The Week Ahead – Have We Seen the Q4 Bottom?
Dip buyers powered the S&P 500 even as rate-hike bets nearly doubled. Now Nvidia’s first report under its interim CEO, retail sales, FOMC minutes and a score of Fed speakers put the rebound to the test.
You've reached your free article limit
You've read 0 of 1 free Pro articles.

Nvidia, Retail Sales and FOMC Minutes Highlight the Upcoming Week
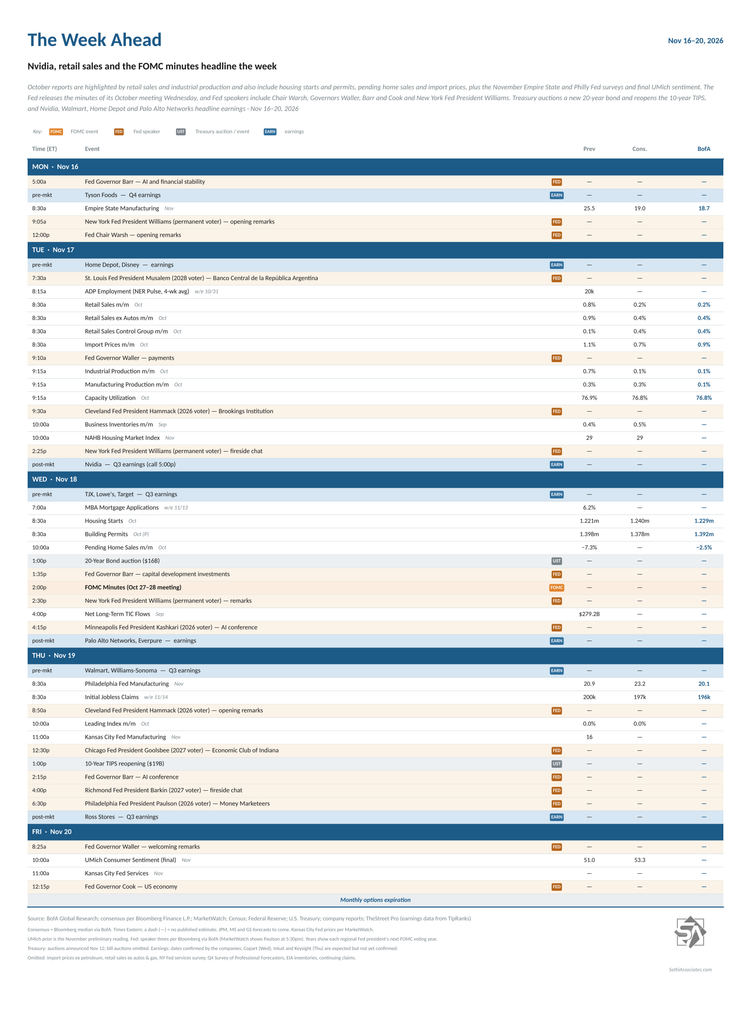
After a week dominated by hot inflation data and hawkish Fedspeak, the focus turns to Nvidia’s earnings, the consumer (retail sales and big-box retailers) and the FOMC minutes, along with another full slate of Fed speakers, including Chair Warsh’s first public remarks since the October meeting.
US economic reports are headlined by Tuesday’s October retail sales. Bloomberg consensus is for headline sales to rise 0.2% m/m and the control group 0.4%, after 0.8% and 0.1% in September. JPM, Morgan Stanley and DB all look for no growth in headline sales, with JPM and MS at +0.2% for the control group. October industrial production is also Tuesday (our most complete look at the manufacturing sector), with consensus at +0.1% (from +0.7%); DB sees +0.3% and MS −0.4%.
Other October reports include import prices, housing starts and permits, pending home sales and the leading and coincident indexes. November reports include the Empire State, Philly Fed and Kansas City Fed manufacturing surveys, the Kansas City Fed services survey, the NAHB housing market index and final University of Michigan consumer sentiment. September reports include business inventories and TIC flows. We’ll also get the usual weekly reports (ADP, mortgage applications, unemployment claims, etc.).
The Fed releases the minutes of its October 27–28 meeting Wednesday, while Fed Chair Warsh makes opening remarks at the Federal Reserve’s Productivity and Jobs Task Force Conference Monday at noon ET, his first public remarks since the October press conference. Other Fed speakers include Governors Waller, Barr and Cook, New York Fed President Williams (all permanent voters), Cleveland Fed President Hammack (2026 voter), Minneapolis Fed President Kashkari (2026 voter), Philadelphia Fed President Paulson (2026 voter), Chicago Fed President Goolsbee (2027 voter), Richmond Fed President Barkin (2027 voter) and St. Louis Fed President Musalem (2028 voter).
Non-Bill (>1yr in maturity) US Treasury auctions include a new $16B 20-year bond Wednesday and a $19B 10-year TIPS reopening Thursday.
Friday also brings monthly options expiration.
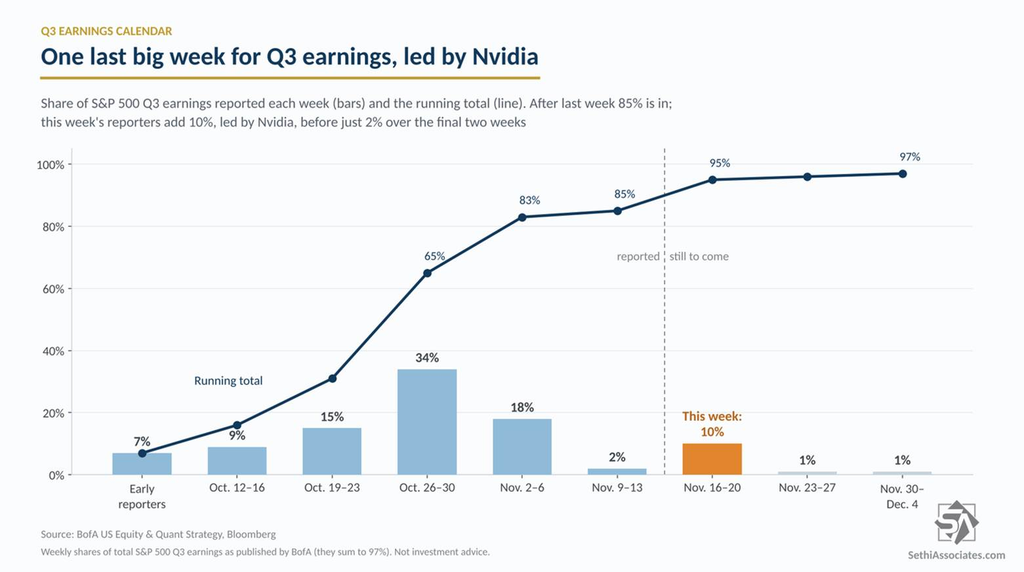
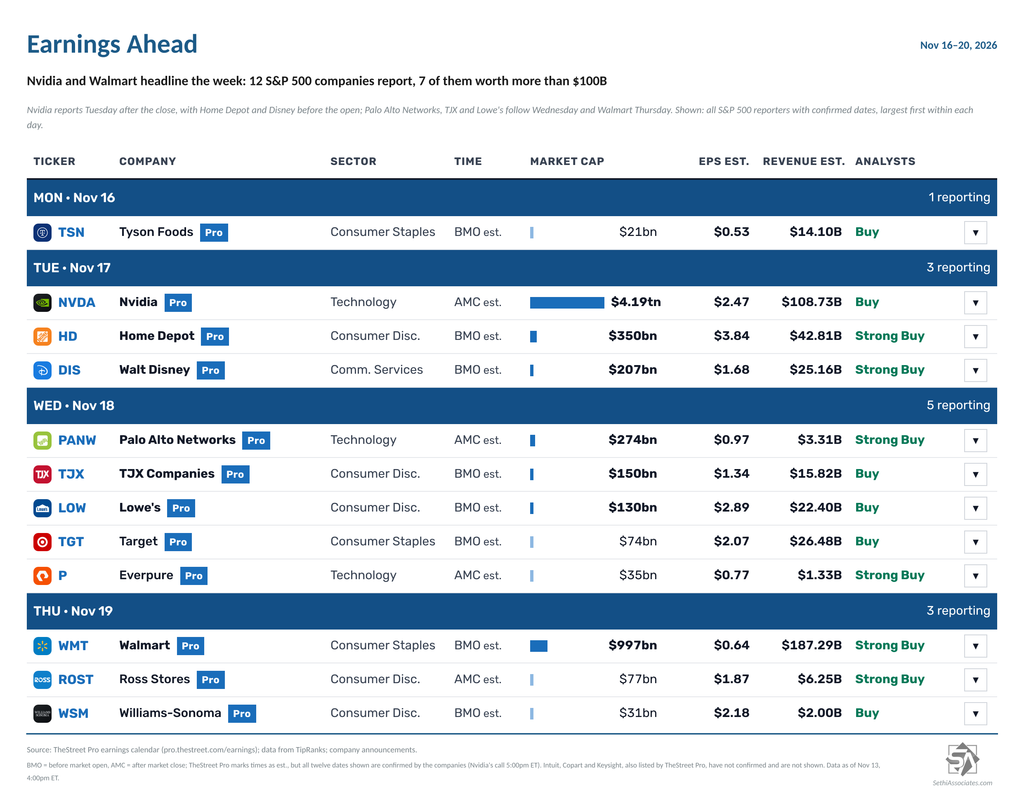
Q3 earnings season continues to wind down with 12 S&P 500 components confirmed to report (10% of index earnings, according to BofA), but seven of them have market caps over $100B, including Nvidia (under interim CEO Colette Kress), which is likely the highlight of the week:
- Tuesday: Nvidia (NVDA), Home Depot (HD) and Disney (DIS).
- Wednesday: Palo Alto Networks (PANW), TJX (TJX) and Lowe’s (LOW).
- Thursday: Walmart (WMT).
Other S&P 500 reporters include Tyson Foods (TSN) Monday; Target (TGT) and Everpure (P) Wednesday; and Ross Stores (ROST) and Williams-Sonoma (WSM) Thursday. Intuit (INTU), Copart (CPRT) and Keysight (KEYS) are expected but haven’t confirmed dates.
Outside the S&P 500, we’ll hear from Baidu (BIDU) and KE Holdings (BEKE) Monday; JD.com (JD) and Viking (VIK) Tuesday; Tencent (TCEHY) Wednesday; Alibaba (BABA), PDD (PDD), NetEase (NTES) and Gap (GAP) Thursday; and BJ’s (BJ) Friday.
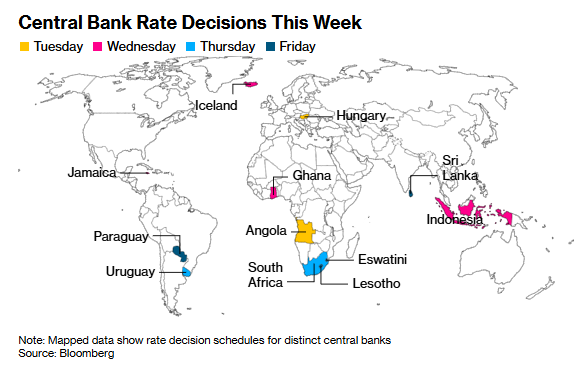
Ex-US highlights from Deutsche Bank:
“Moving on to Europe, a busy week is ahead for the UK. Labour market gauges are scheduled for Tuesday and October CPI, RPI and PPI will follow on Wednesday, before October retail sales and the November GfK consumer confidence round out the highlights on Friday. Our UK economists… expect headline CPI to increase, printing 3.80% YoY (3.48% in September), with core CPI rising as well, to 2.87% YoY (2.78% in September). Elsewhere in Europe, German data includes the November ZEW survey (Tuesday) and October PPI (Friday). Aside from economic indicators, notable events include the UK-EU summit on Friday…
“Over in Asia, the focus will be on China’s activity releases for October, including retail sales, industrial production and home prices on Monday. China will also host the APEC economic leaders’ meeting on Wednesday and Thursday in Shenzhen. In Japan, data highlights include the preliminary Q3 GDP report (Monday), October national CPI (Friday) and the trade balance (Wednesday). Our Chief Japan economist expects a contraction of -0.6% SAAR for Q3 real GDP and forecasts that the core CPI will accelerate to 2.4% YoY (2.1% in September), while the core-core CPI will slow to 2.3% YoY.”
On the geopolitical front, President Trump will hold a trilateral meeting with China’s Xi Jinping and Russian President Vladimir Putin Thursday on the sidelines of the APEC summit in Shenzhen, a White House spokeswoman said (Bloomberg). Trump has said such a meeting would focus on denuclearization, and he plans to discuss the war in Iran but not Ukraine, according to a senior administration official, who added that Trump and Putin aren’t expected to meet separately. Trump will also hold his third one-on-one meeting with Xi this year.
And here is a link to TipRanks’ Economic Calendar.
And a link to Bloomberg’s Week Ahead (gift link).
And a link to Christophe Barraud’s international Week Ahead rundown.
This post will go through in order (in case you want to skip around): the economy, the Fed and interest rates, earnings, valuations, breadth, positioning, sentiment, seasonality, and then my wrap-up.
Inflation Runs Hot as the Data Keeps Beating Expectations
Looking first at the economy, my intro has remained the same since the start of the Iran conflict (and longer term, more or less all of the past five years – I’ve not had a recession probability above 40% since the pandemic): “we continue to see it weathering the various storms remarkably well due in large part to resilient consumption (boosted by huge increases in wealth over the past few years despite slowing incomes) and AI-spending… with data of late showing a stable (and perhaps accelerating) economy, but one that is also boosting inflation.”
Last week was lighter on data, but what we got remained consistent with the foregoing, with inflation running hot and activity holding up:
- The NY Fed’s October Survey of Consumer Expectations showed median inflation expectations unchanged at 3.9% one year ahead, 3.3% three years ahead and 3.0% five years ahead, while the mean probability that unemployment will be higher a year from now rose to 45.3%, the highest since April 2020, even as job finding expectations rose (NY Fed).
- ADP’s weekly NER Pulse showed private employers adding 79,000 jobs in the four weeks ending October 24th, the most since the period ending September 26th, though the four-week average of those totals fell for a fourth week to 73,500 the least since September 12th (ADP Weekly Hiring Strengthens to Best Since September 26).
- NFIB’s small business optimism index slipped 0.1 point to 97.8 in October, its third straight decline and the lowest since June, but a net 37% of owners plan to raise prices, the most since July 2022 (Small Business Price Hike Plans Jump to the Highest Since 2022).
- October existing home sales fell 5.5% to a 3.75 million annual rate, the lowest since August 2010 and well below the 3.85 million expected, as mortgage rates climbed (Existing Home Sales Fall to Lowest Since 2010, but the Worst May Be Yet to Come).
- Initial jobless claims rose 9,000 to 200,000, the highest in four weeks, but the four-week average held at 195,250, matching the lowest since October 1969, and continuing claims fell to 1.697 million (Initial Jobless Claims Four-Week Average Holds at Lowest Since 1969).
- Household debt rose $334 billion (1.8%) in the third quarter to a record $19.11 trillion, the biggest increase since the fourth quarter of 2022, and the share in some stage of delinquency rose to 4.96% from 4.73%, the highest since the first quarter of 2016, with pressure moving toward housing and autos (Household Debt Jumps the Most Since 2022, Delinquencies Climb to Highest Since 2016).
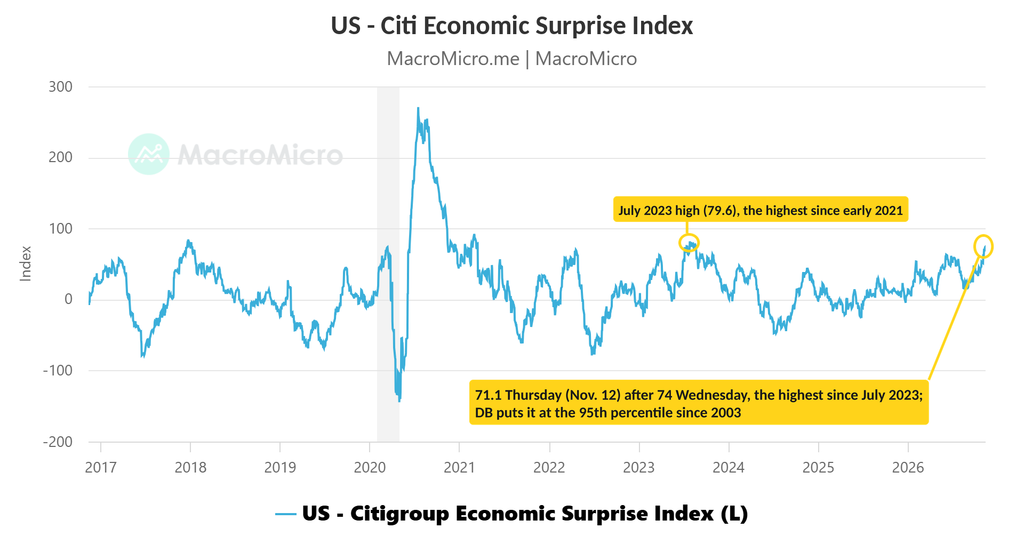
With the data continuing to beat expectations, the Citi US Economic Surprise Index rose to 74.0 on Wednesday, just a little below the July 2023 peak of 79.6, which was the highest since early 2021. DB puts it at the 95th percentile since 2003.
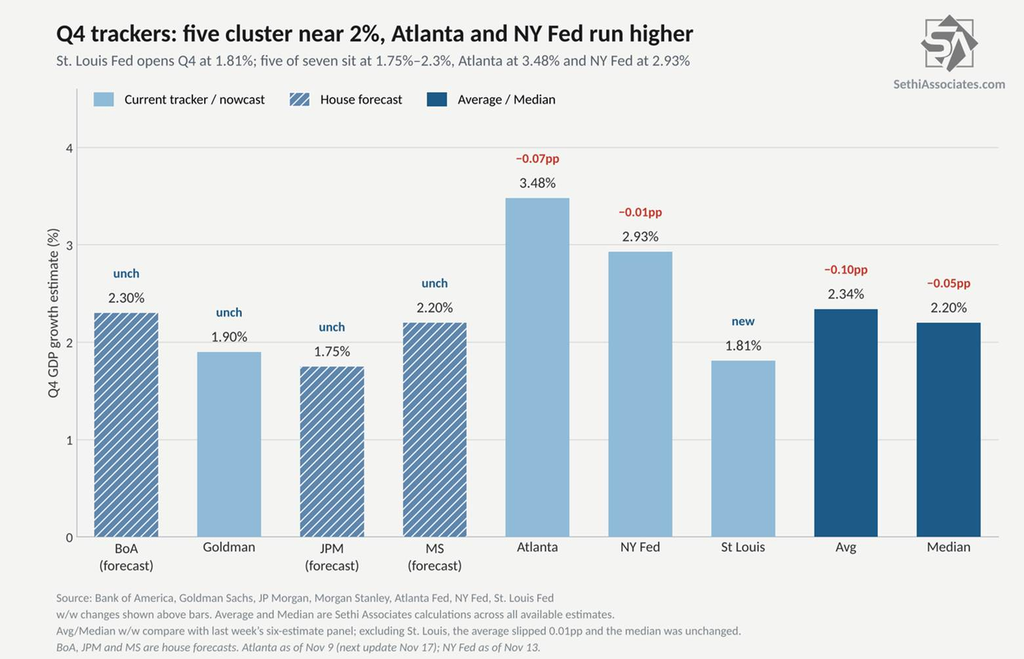
Looking at the Q4 GDP trackers, five of the seven now cluster within three-tenths of a point of 2% (1.75%–2.3%), with the Atlanta and NY Fed further above, pulling up the average. The St. Louis Fed started its nowcast at 1.81%, while Goldman’s tracker is unchanged at 1.9%. The Atlanta Fed’s GDPNow eased to 3.48% as of November 9th, from 3.55% on November 6th (its next update is Tuesday, after retail sales), and the NY Fed’s Nowcast edged down to 2.93% from 2.94%. BofA, JPM and Morgan Stanley’s forecasts are unchanged at 2.3%, 1.75% and 2.2%, and those are all house forecasts, with BofA not yet initiating its GDP tracker. Across the seven, the average is 2.34% and the median 2.2%.
But as noted in my intro at the top of this section, the strong economy is “also boosting inflation,” and we saw that last week in a pair of inflation reports:
- October core CPI rose 0.30%, above the 0.2% expected and a third straight month at 0.29% or more, while headline CPI rose 0.35%, above the 0.3% expected. With the BLS not publishing year-over-year rates for October, our estimates have core up 2.81% from a year earlier, the most since May, and headline 4.02%, with Fed favorite supercore estimated to have risen 3.52% from a year earlier, the most since May (Core CPI Comes in Hot Again, Putting a Half-Point Fed Hike on the Table).
- October PPI final demand rose 0.35%, below the 0.4% expected and the smallest gain since July, but was up 6.52% from a year earlier, the highest since November 2022. Core rose 0.33% (5.05% y/y, the highest since December 2022), and “core-core” (excluding food, energy and trade) 0.49%, the most since May (Headline Producer Prices Cool, but Core Hits Highest Annual Rate Since 2022).
- And as noted earlier, NFIB’s small business optimism index showed a net 37% of owners plan to raise prices, the most since July 2022 (Small Business Price Hike Plans Jump to the Highest Since 2022).
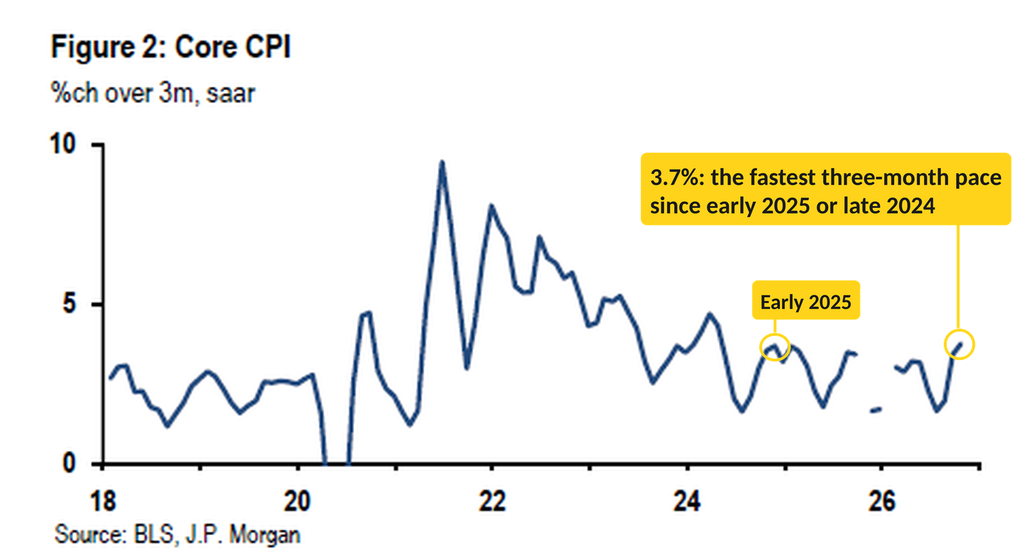
JPM (Feroli) says October delivered “the third consecutive upside surprise on core CPI,” and “the three-month pace on core inflation, at 3.7%, is now the fastest increase since early 2025 or late 2024,” with the three-month pace of supercore “the highest in two and a half years.” JPM estimates the core PCE deflator rose 0.29% m/m in October, which would leave it up 3.2% y/y, “equaling the recent peak in May,” and 3.5% annualized over three months.
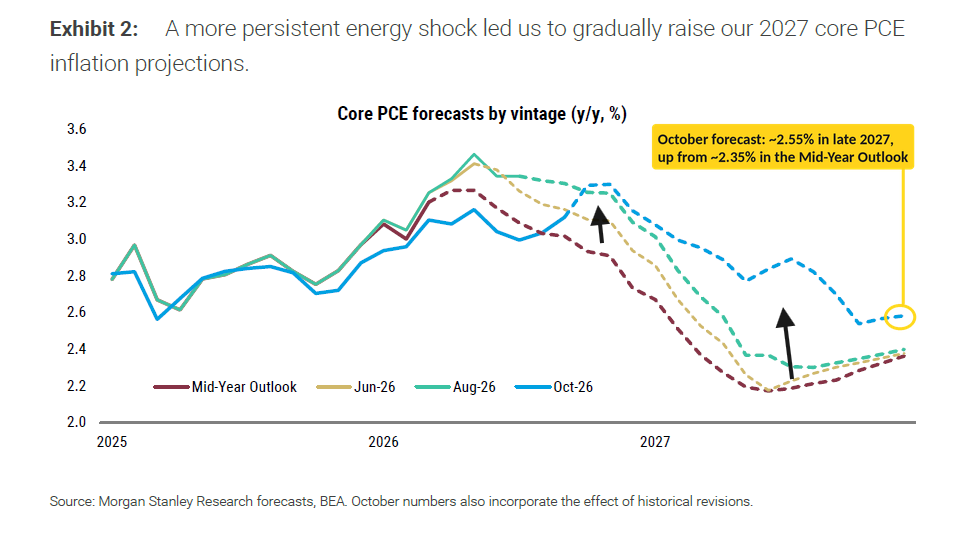
Morgan Stanley raised its October core PCE estimate to 0.35% m/m from 0.22%, putting the three-month annualized pace at 3.79%. It now sees core PCE ending 2027 at 2.6%, up from about 2.4% at mid-year, on “a more persistent energy shock.
Both see reasons not to overreact, but Morgan Stanley’s Gapen worries about goods.
JPM: “It’s also hard to write off the latest run of firm prints as a fluke, given the backdrop… Still, over six months inflation is well within the range of the last couple years, highlighting that we probably shouldn’t get too worried just yet.”
MS: “Services accounted for most of the upside surprise, although a good explanation for the strength is harder to identify. We do not yet see clear signs of overheating domestically… leading indicators for two key sources of the surprise – OER and motor vehicle insurance – point to softer inflation ahead… However, we remain particularly concerned about goods, where energy pass-through appears to be broadening… potentially intensifying in 1Q27 as firms reset prices.”
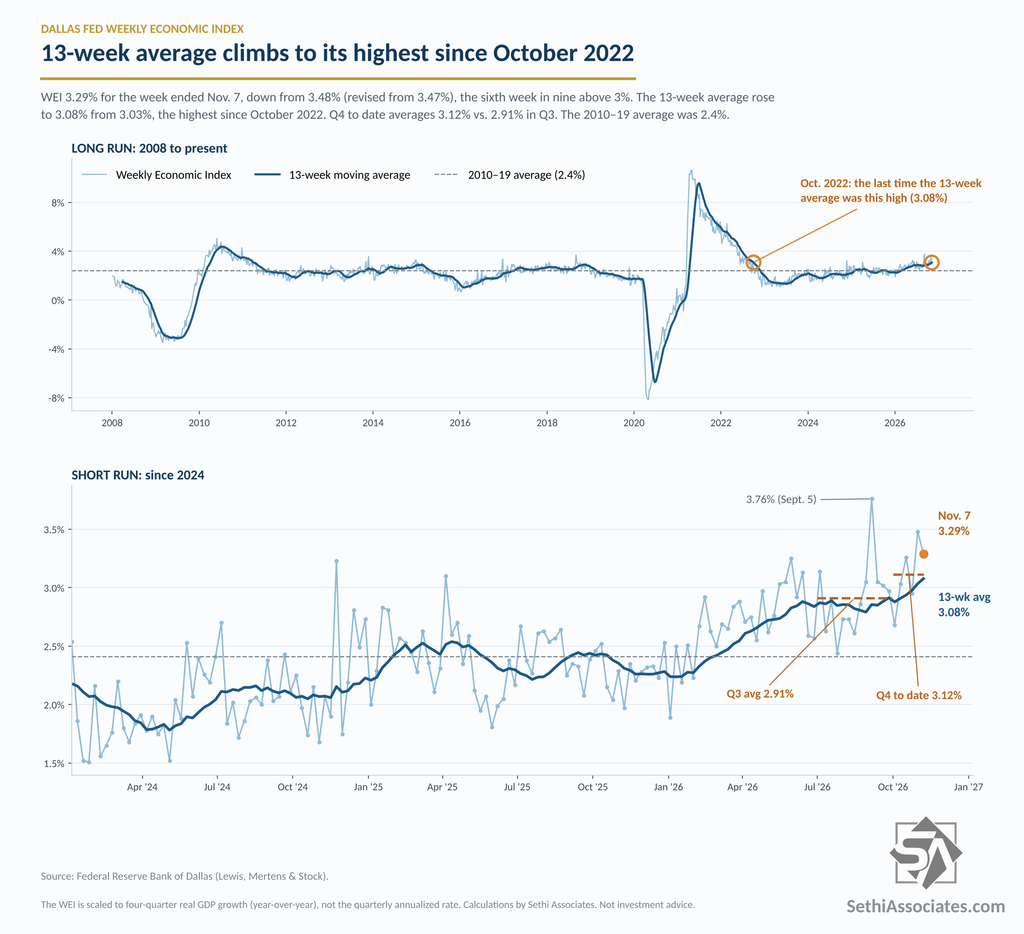
Meanwhile, the Dallas Fed Weekly Economic Index (WEI)* slipped to 3.29% in the week through November 7th (so it doesn’t include last week’s data) from 3.48% the prior week (revised from 3.47%), but that’s still the sixth week in nine over 3%.
The 13-week average though rose further to 3.08% (from 3.03%), its highest since October 2022, continuing to evidence economic momentum that is above trend (the 2010–19 average was 2.4%). For Q4 to date it’s averaging +3.12% y/y, which would be the strongest y/y GDP growth since Q2 2024, although with only six weeks in, that would imply an aggressive ~4.3% Q/Q SAAR, so treat it with caution.
*The WEI is scaled as a y/y rise for real GDP (so different from most GDP trackers, which are Q/Q SAAR), uses 10 daily and weekly economic series and runs a week behind other GDP trackers.
It has over time tracked actual GDP closely (a 0.92 correlation since 2008, see chart), although the last two quarters it has come in high, predicting +2.91% y/y GDP growth in Q3 vs the actual first estimate of +2.07% and for Q2 +2.84% vs +2.19%. More importantly, though, it has consistently indicated no recession and relatively healthy growth since the pandemic (which is what we’ve experienced), never dipping below +1% since 2021.
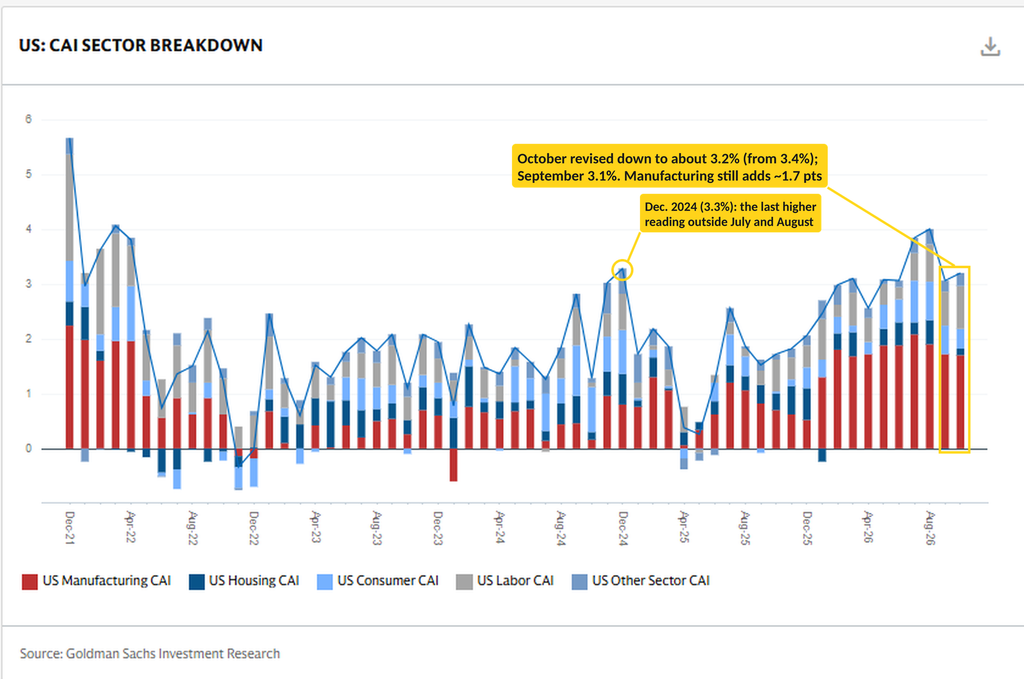
Goldman’s Current Activity Indicator* was revised down to 3.2% for October (from 3.4%), with September at 3.1%. Still, other than July (3.8%) and August (4.0%), it’s the best since December 2024 (3.3%). Manufacturing remains the biggest contributor (1.7 points), followed by labor (0.8), its biggest contribution since January 2023.
*The CAI is their “real-time measure of inflation-adjusted economic momentum using 37 inputs.”
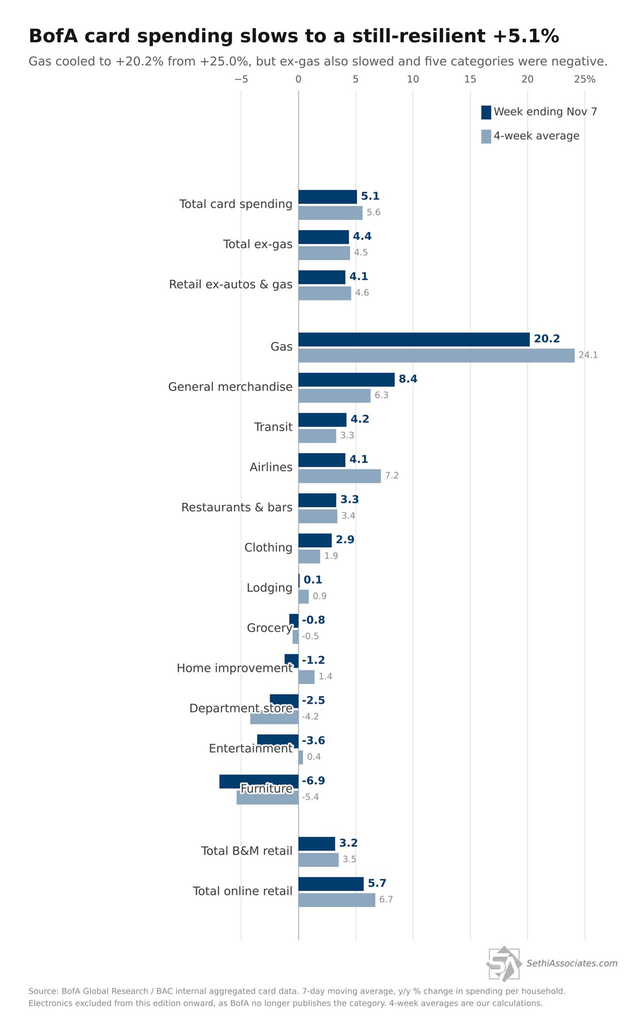
BofA card spending (credit+debit) slowed to a still-resilient +5.1% versus the year-ago period (y/y) in the week ending November 7th, down from +6.2% the prior week. BofA said spending remains healthy and attributed the slowdown “likely” to the moderation in gas prices. Ex-gasoline and autos spending growth also slowed, though, to +4.1% y/y from +5.0%.
- Total +5.1% y/y (+5.6% four-week moving average).
- Ex-gasoline +4.4% y/y (+4.5% four-week moving average).
- Ex-autos and gasoline +4.1% y/y (+4.6% four-week moving average).
Gasoline cooled to +20.2% y/y from +25.0%, its lowest reading since late August, though still well above a year earlier. On the income split, BofA again noted that lower-income spending growth has consistently outpaced higher-income over the past several weeks.
Among categories, general merchandise firmed to +8.4% from +7.2%, the strongest outside gas, while transit (+4.2%, from +2.4%), clothing (+2.9%, from +1.2%) and restaurants & bars (+3.3%, from +3.0%) edged higher. Department stores saw the largest week-over-week improvement, though they remained negative. Airlines cooled to +4.1% from +7.3%, and online retail eased to +5.7% from +7.6%.
Five categories were negative y/y, up from two the prior week: furniture (−6.9%, from −4.1%), entertainment (−3.6%, from +2.5%, the biggest week-over-week drop of any category), department stores (−2.5%, improved from −8.1%), home improvement (−1.2%, from +4.3%) and grocery (−0.8%, from +0.2%).
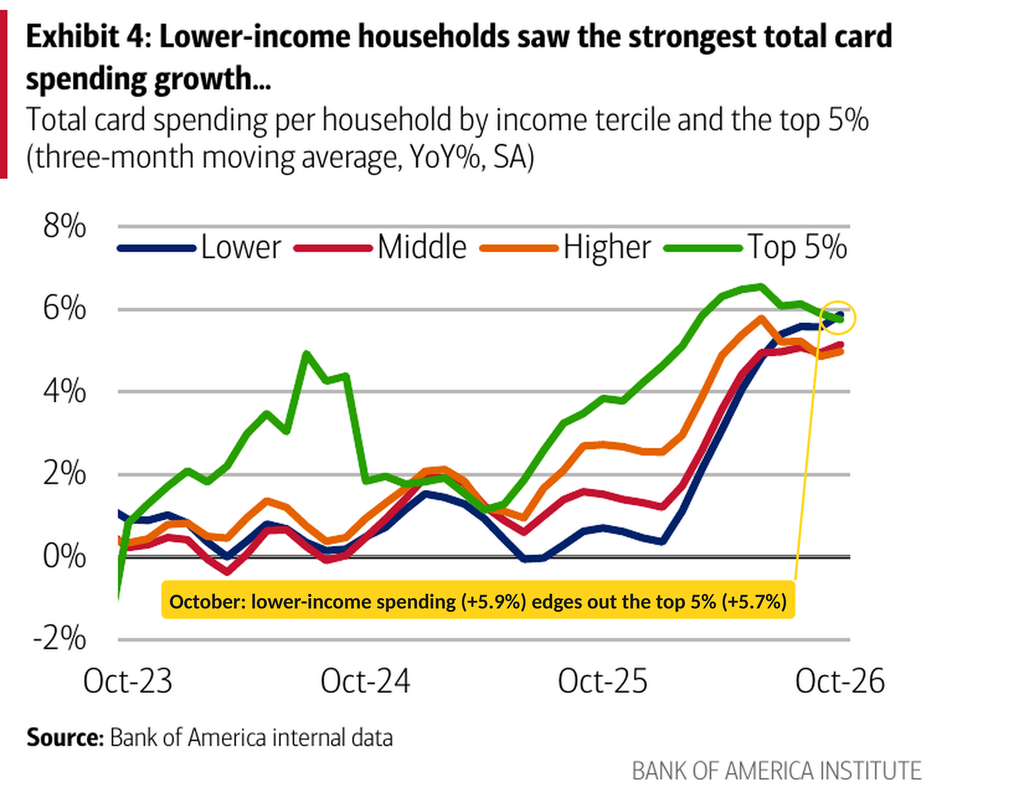
BofA’s monthly Consumer Checkpoint adds that October card spending per household rose 5.8% y/y (from 6.2% in September) and 4.6% excluding gasoline (from 5.1%). That’s a moderation, but seasonally adjusted spending still rose 0.1% m/m, “suggesting momentum remains positive.” Services contributed 2.5 points of the growth (from 2.7), and retail 1.2 points (from 1.6, and about 2 at the summer peak), which fits with the soft retail sales forecasts above.
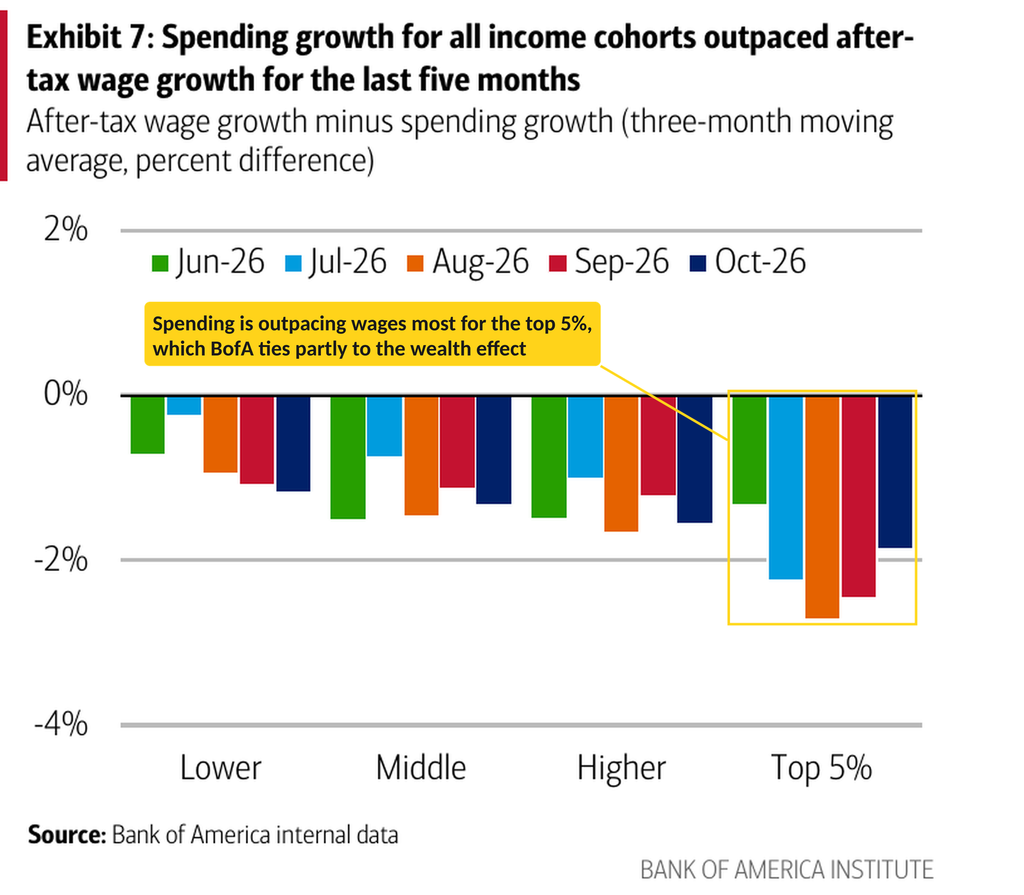
Spending growth has also converged across incomes. Lower-income households’ spending rose 5.9%, edging out the top 5% (5.7%), helped by the fastest after-tax wage growth (4.7%, versus 3.4% for higher-income households). Spending has outpaced after-tax wages for every income group for five months, but the gap is widest for the top 5%, which BofA attributes partly to the wealth effect. It says the impact of “recent stock market gyrations” on that group “will warrant close attention,” though spending “may still be relatively robust with only small to modest pullbacks in equities.”
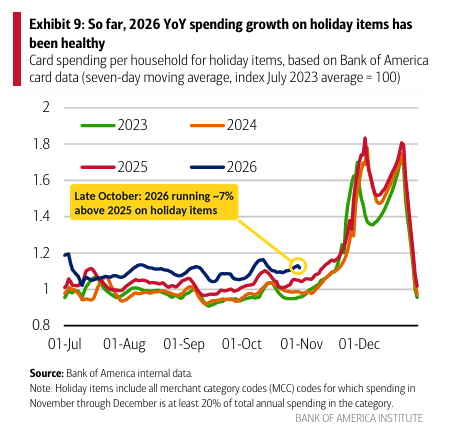
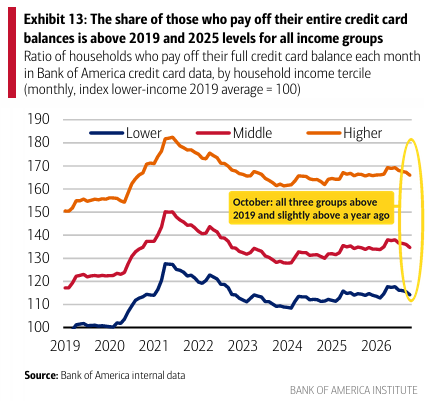
Heading into the holidays, spending on holiday items is running well above last year, led by online, but average ticket sizes are below 2025 levels, which BofA thinks may reflect consumers “turning to less expensive items amid rising prices elsewhere.” Household finances look healthy overall, with a higher share of households paying off their full card balances and deposits still above pre-pandemic inflation-adjusted levels, although the share making only minimum card payments and 401(k) hardship withdrawals have both edged up.
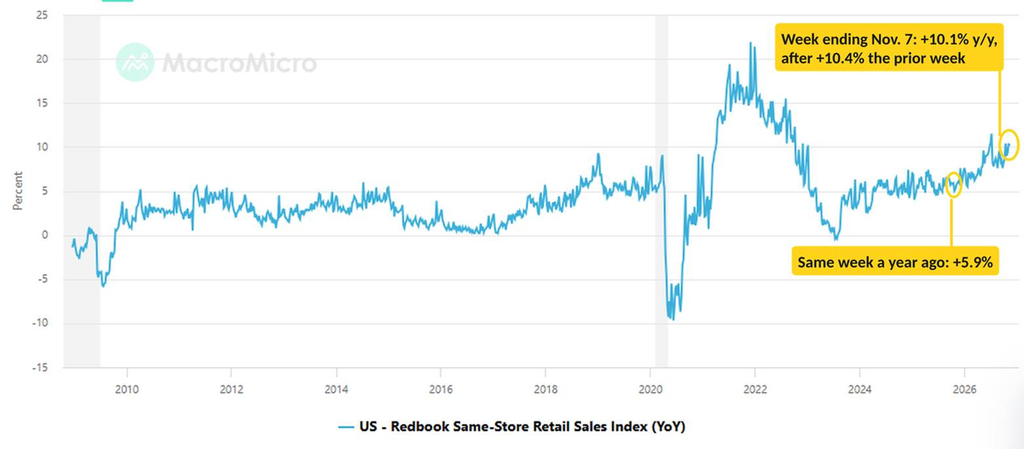
Redbook sales* rose 10.1% y/y in the week ending November 7th, down slightly from 10.4% the prior week (the joint highest since early July) but a second straight week above 10%, and well above the 5.9% of a year earlier.
*Redbook sales are same-store sales across a panel of large general-merchandise retailers, such as department stores, discount chains, apparel retailers, drugstores, and warehouse clubs.
Fed Debate Shifts From Whether to How Fast
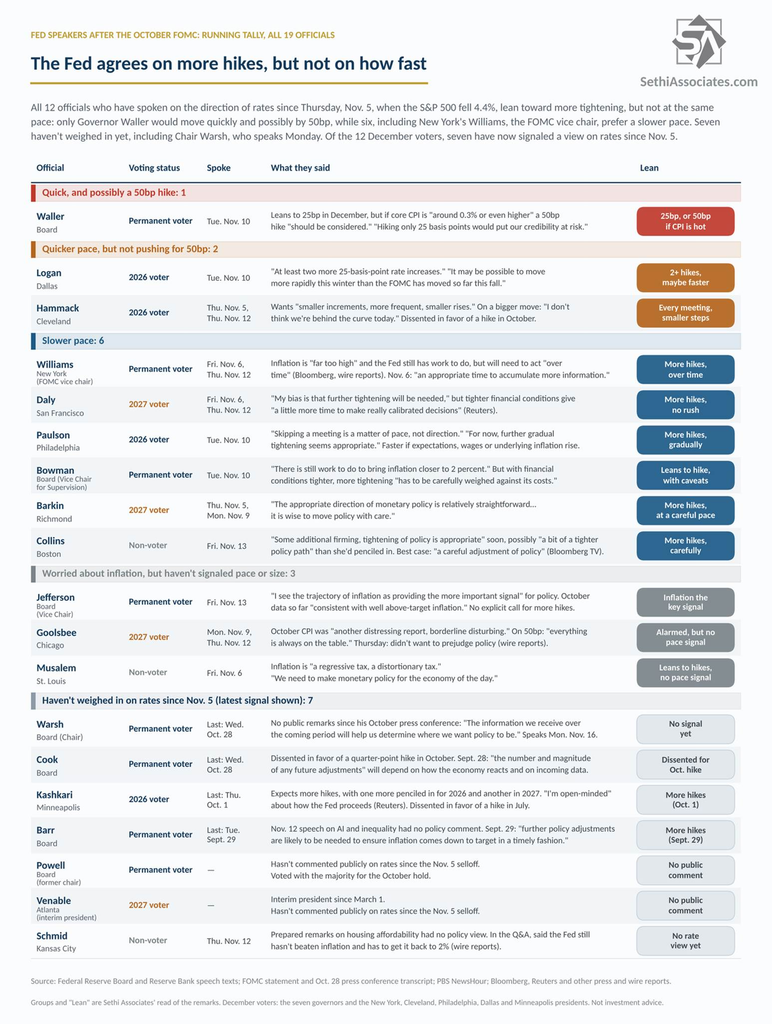
Fedspeak was hawkish across the board last week, moving the debate from whether the Fed hikes again to how many times and how fast. As I covered in real time, Governor Waller said a 50bp hike “should be considered” if core CPI came in around 0.3% or higher, which it did (more here), and Dallas’ Logan added to the 50bp speculation, seeing “at least two more” hikes and saying “it may be possible to move more rapidly this winter” (Dallas’ Logan Adds to 50-Basis-Point Speculation). But the Fed’s more dovish members (Bowman, Paulson and later Williams and Daly) tamped that down, looking for hikes “over time” (While the Fed’s Doves See More Hikes, They’re in Less of a Hurry; Fed’s Daly and Williams Also See More Hikes, but ‘Over Time’), and even Cleveland’s Hammack, the committee’s most hawkish member, talked down larger hikes in favor of “more frequent, smaller rises” (Fed’s Biggest Hawk Talks Down Larger Hikes). Vice Chair Jefferson Friday night didn’t discuss his thoughts on the path for rates but did note that AI, on net, may push toward higher rates through the wealth effect (stock prices) and a higher neutral rate.
So, by my count, 12 of the 19 FOMC participants have now signaled more hikes ahead, but just Waller has openly discussed 50bp, so that’s probably off the table at this point. With December a lock, the question to be answered is how many and how quickly. We’ll get a good idea on the first part when we get the new dot plot in a little over three weeks. On the second, Logan and Hammack have made clear they want a quicker pace; Williams, Daly, Paulson, Bowman, Barkin and perhaps Collins prefer a slower one; and Jefferson, Goolsbee and Musalem are worried about inflation without signaling pace (but it would be very surprising if Jefferson and Williams were out of step). The other seven haven’t weighed in on policy since the October meeting, including Chair Warsh, who speaks Monday, although we’re unlikely to get anything so granular given his dislike of forward guidance.
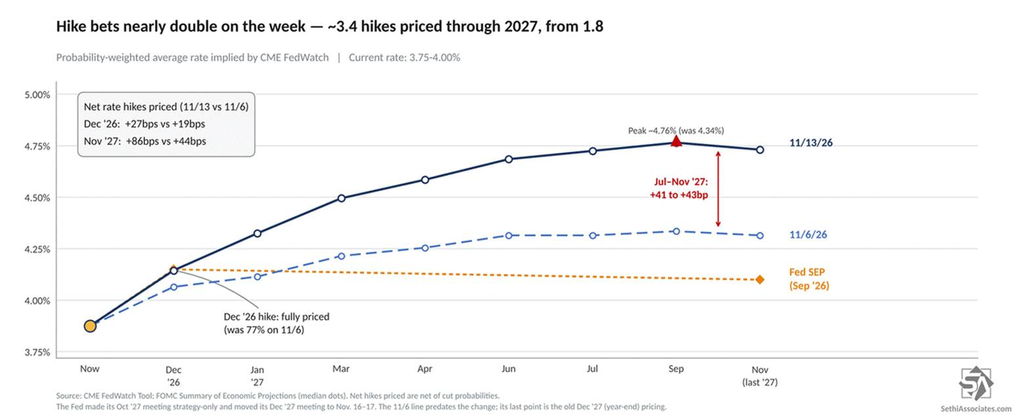
On the back of the inflation reports and Fedspeak, rate-hike bets nearly doubled last week. A December hike went from a 77% chance the prior Friday to fully priced, with an 8% chance of a half-point move (it was as high as 15% during the week), and markets now pricing 86 basis points of hikes through the Fed’s final 2027 meeting, nearly three and a half, up from 44bp a week earlier, less than two, per CME FedWatch.
The banks moved too. Goldman now sees two more hikes, pushing its first cut to December 2027 (Goldman Now Calls for Two More Hikes, Pushes First Cut to December 2027), and BofA sees hikes at each of the next three meetings (BofA Now Sees Fed Hikes at Next Three Meetings).
JPM agrees with consensus that “it is … more likely that the Committee will go with a 25bp hike” in December, although with core CPI at 0.30% exactly (Waller’s threshold), “it’s fair to say that a 50bp hike will be at least discussed at the upcoming meeting.” JPM’s own forecast still has just the one hike (to 4.00%–4.25%), but its Global Data Watch (“Losing my religion”) says “we are close to the end of a long period of magical thinking,” and that at the Fed a pivot is underway:
“This week’s Fed communications underscore that a policy pivot has begun away from its New Testament stance of forgiving our inflation sins while promoting the dogma of immaculate disinflation. This view was maintained in the September SEP – which projected inflation moving back to target amid sustained above-potential growth. It continued through their recent October pause, which reiterated guidance for a shallow and gradual policy adjustment.”
JPM says incoming data are “challenging the Fed’s beliefs on multiple fronts.” Even before the CPI, Waller had flagged how broad the recent core price increases have been (which was discussed in Core CPI Comes in Hot Again, Putting a Half-Point Fed Hike on the Table), and pressure keeps building upstream, with core PPI up at a 5.5% annualized rate over the past three months and consumer import prices at 3.3%. Labor demand is firming too, with payrolls “aligning with our forecast for gains of 100k or faster per month [even] amid an underlying environment of weak labor supply,” and Fed officials “recognize that labor markets are tight and that wage inflation will likely firm in an environment of sustained solid demand.”
JPM thinks it’s premature to expect the Fed to say it needs to slow the economy (in the last cycle, Chair Powell didn’t add “a period of below-trend growth” to his remarks until July 2022), but:
“…the upcoming December meeting looks likely to deliver a hike, with a median voter anticipating multiple rate hikes next year. This would guide the Fed to go beyond removing last year’s easing and signal an intent to return to a policy stance intended to restrain demand.”
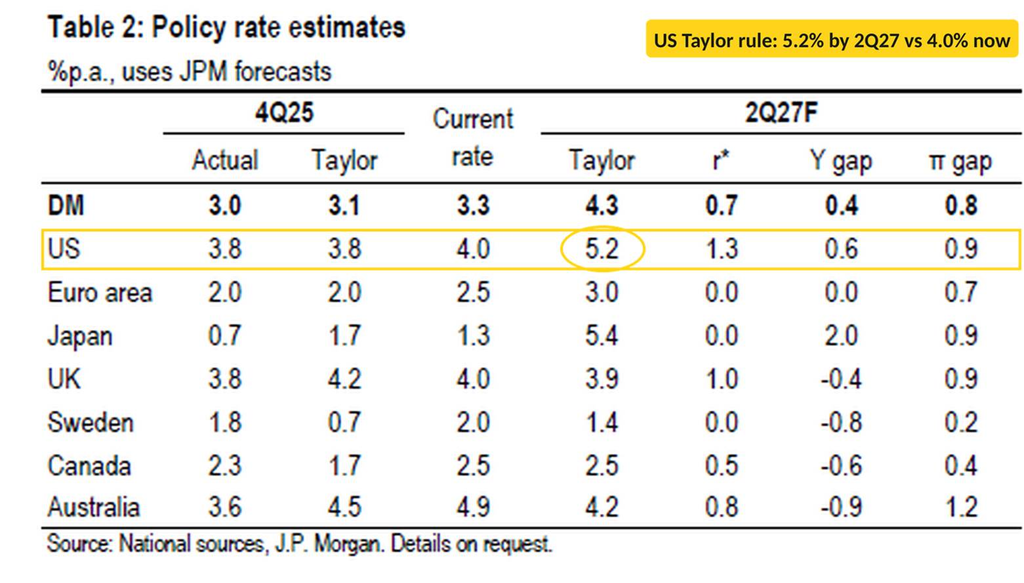
A simple Taylor rule points the same way. Using JPM’s forecasts, it puts the appropriate fed funds rate at 5.2% by Q2 2027, versus 4.0% currently in JPM’s table, with inflation running 0.9 points above target and the economy 0.6% above potential. At the end of 2025, the actual rate and the Taylor rule were both at 3.8%.
Morgan Stanley like Goldman expects 25bp hikes in December and March (to 4.25%–4.5%), but says “another firm jobs and inflation round could add January,” taking the terminal range to 4.5%–4.75%. It also sees a high bar for 50bp in December, “requiring renewed oil pressures and a November jobs report of 150k+ payrolls, a sub 4.0% U-rate, and wage firming”:
“We think the bar for a 50bp rate hike is very high, particularly since the employment report is received during the blackout period and the November CPI report is released after the conclusion of the December FOMC meeting. A 50bp rate hike also runs the risk of communicating to markets that the Fed sees itself as behind, which could cause excessive tightening in financial market conditions. No Fed speakers this week indicated they were behind the curve. In fact, several went out of their way to say the opposite.”
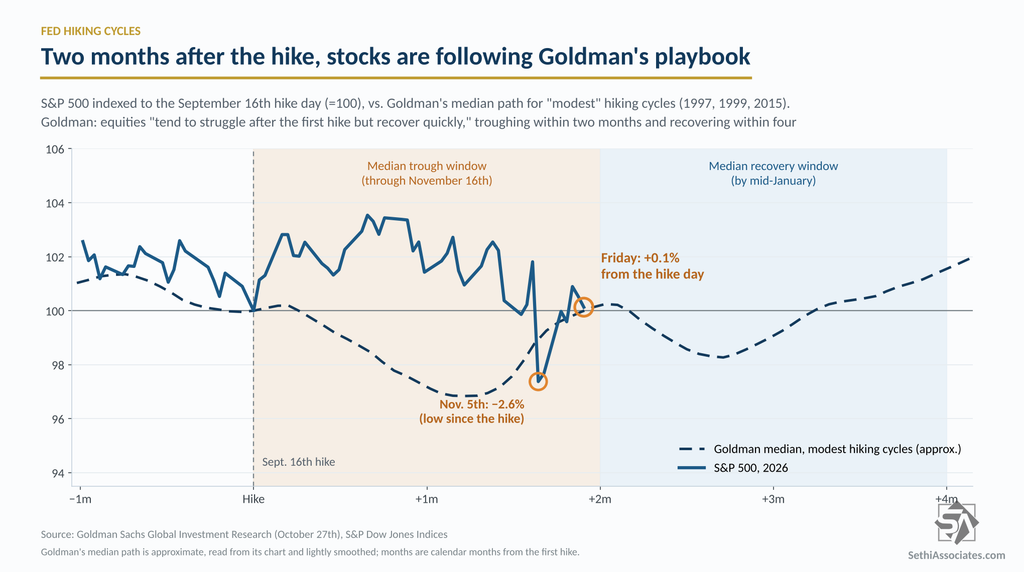
As a reminder, Goldman said that after a first rate hike in a “modest” hiking cycle, equities “tend to struggle after the first hike but recover quickly,” with the median trough coming within two months. Monday marks two months since the September 16th hike, and so far the pattern is holding: the November 5th close remains the S&P 500’s low since the hike, and Friday’s close left it 0.1% above the hike-day close (from 2.3% below a week earlier).
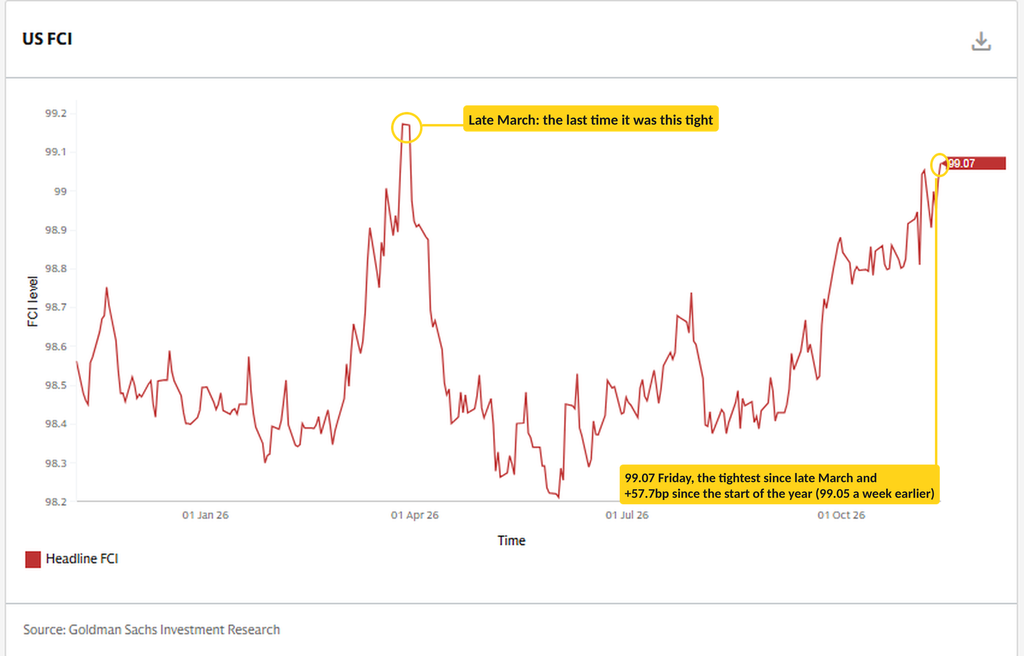
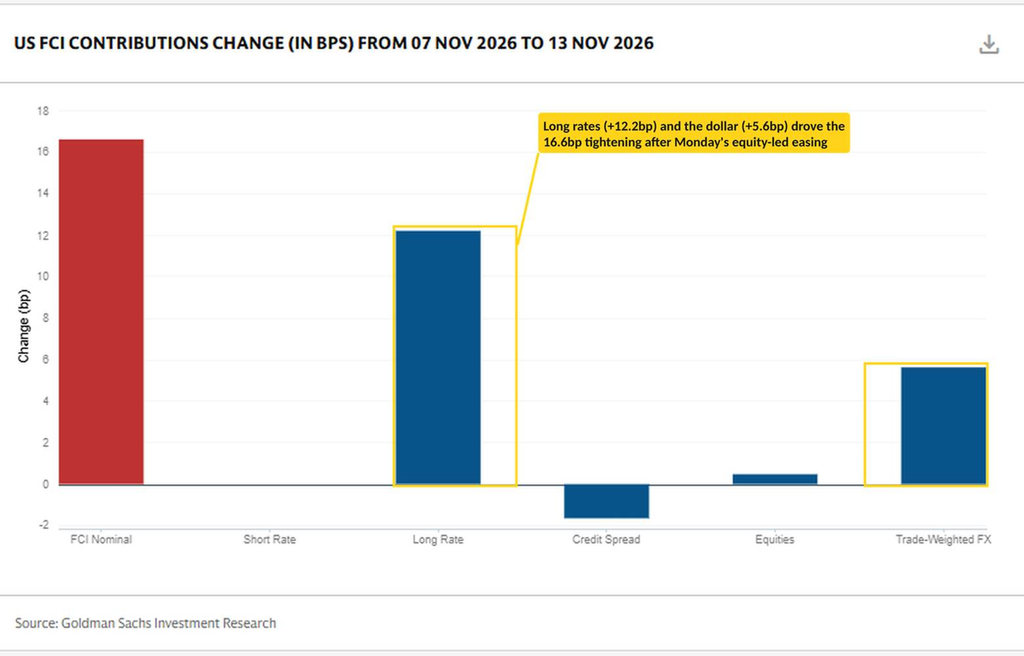
Goldman’s Financial Conditions Index edged up to 99.07 last week from 99.05, its tightest since late March and up 57.7bp since the start of the year. That masks bigger turbulence under the surface, though. Monday’s equity rally eased conditions by about 15bp, but higher long rates (+12.2bp) and the stronger dollar (+5.6bp) then tightened them 16.6bp from Monday’s close through Friday, with credit spreads (−1.6bp) the only offset.
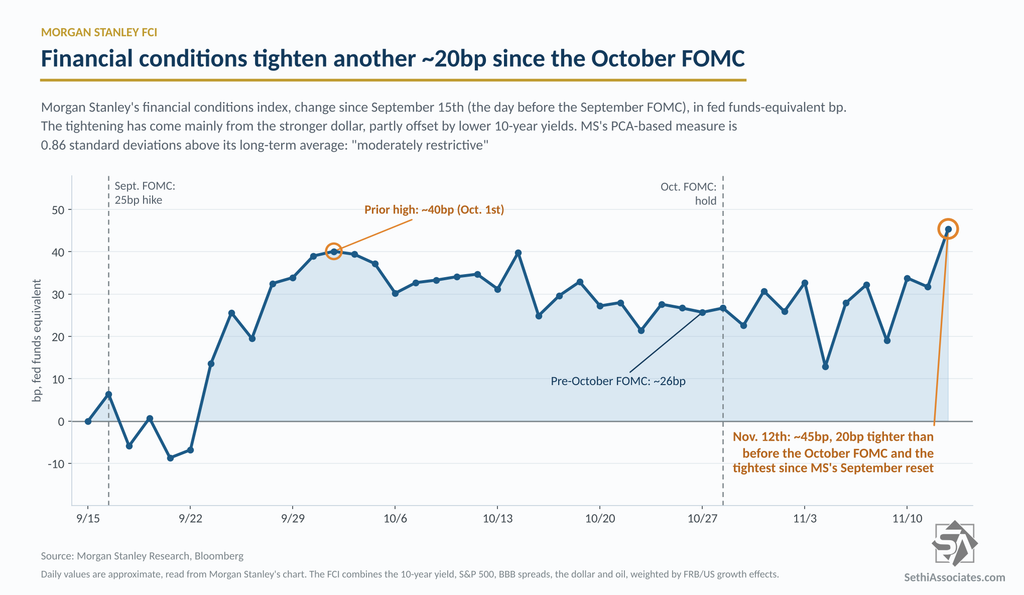
MS says its financial conditions index shows conditions 20bp tighter than before the October meeting as of November 12th’s close (from 3bp a week earlier), “driven primarily by U.S. dollar appreciation,” and that “financial conditions remain moderately restrictive” (0.86 standard deviations above their long-term average on its PCA measure).
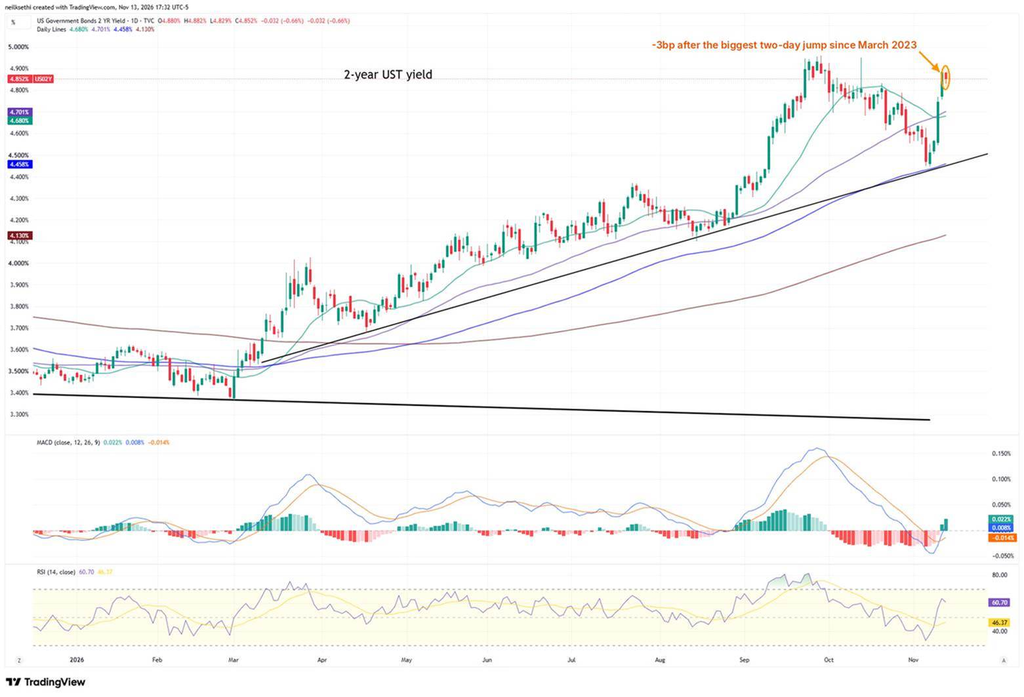
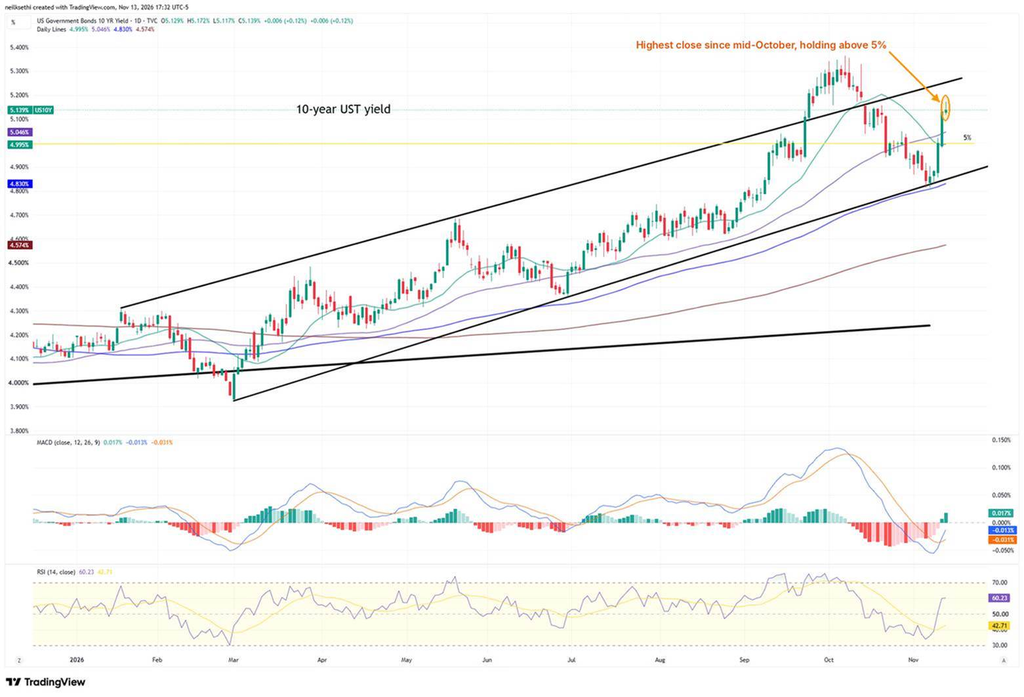
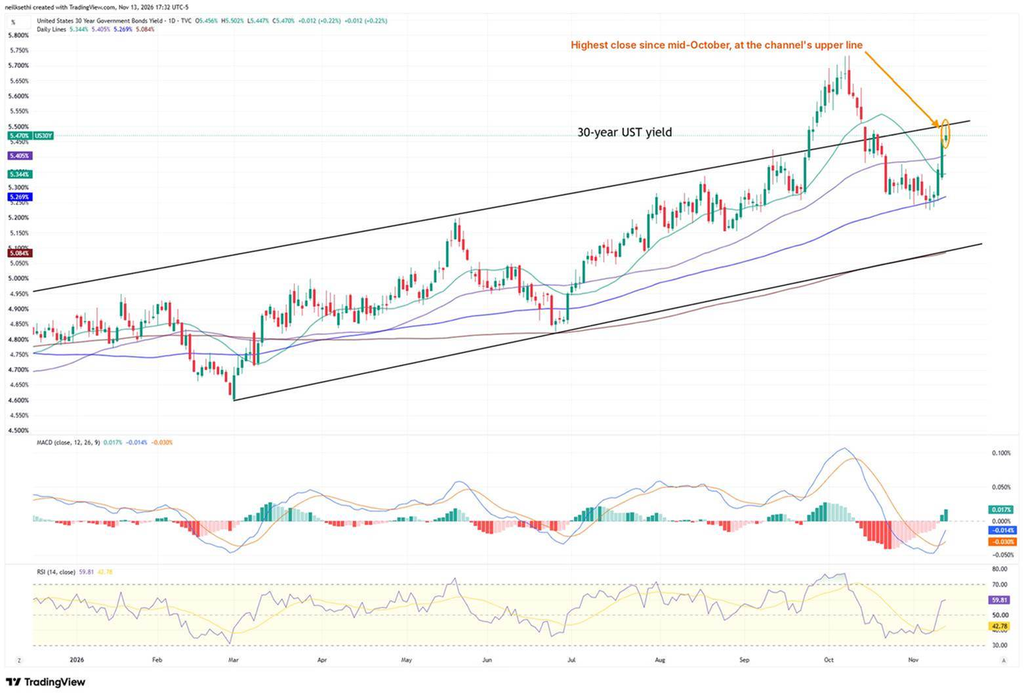
Turning to rates, Treasuries sold off on the hot CPI and hawkish Fedspeak. The 2-year closed the week at 4.85% (+34bp w/w), its biggest weekly gain since October 2024; the 10-year at 5.14% (+28bp) and the 30-year at 5.47% (+21bp), both their biggest weekly rises since April 2025 (the week after liberation day). That takes the 2-year and 10-year above the tops of the ranges I set in early August (4.75% and 5%), while the 30-year remains inside its range (top of 5.75%). The 10-year and 30-year both closed at their highest since mid-October.
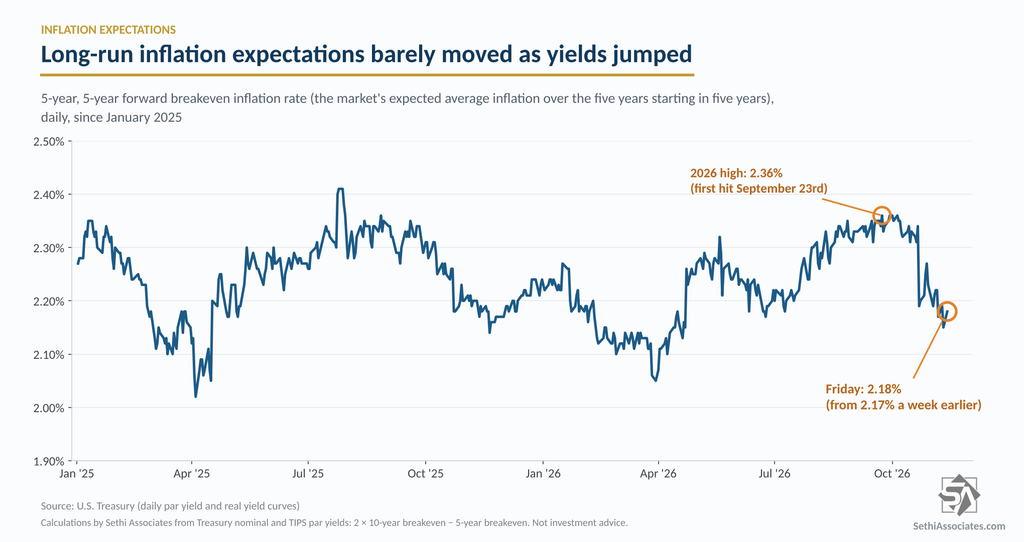
Long-run inflation expectations barely moved, though. The 5-year, 5-year forward breakeven ended the week at 2.18%, up from 2.17% a week earlier and still well below its 2026 high of 2.36% on September 23rd.
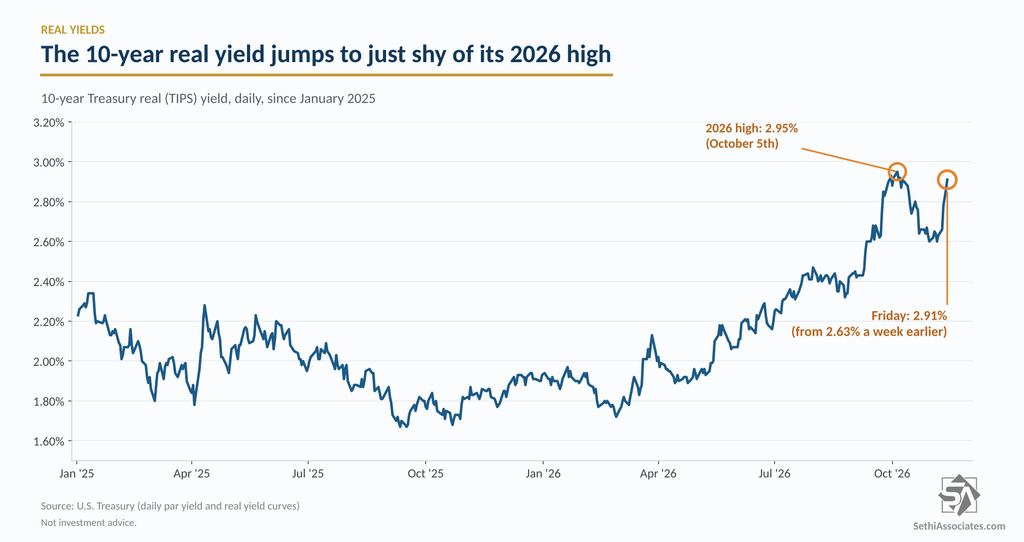
So the move came almost entirely from real yields, with the 10-year real (TIPS) yield jumping to 2.91% from 2.63%, its highest since October 9th and just below its 2026 high of 2.95% on October 5th.
But the move higher in real yields wasn’t from the term premium (the extra yield investors demand to hold longer-term bonds). Instead, per the ACM model, about 17bp of the roughly 20bp rise in the 10-year yield through Thursday came from higher expected short-term rates, in other words a repricing of the Fed path.
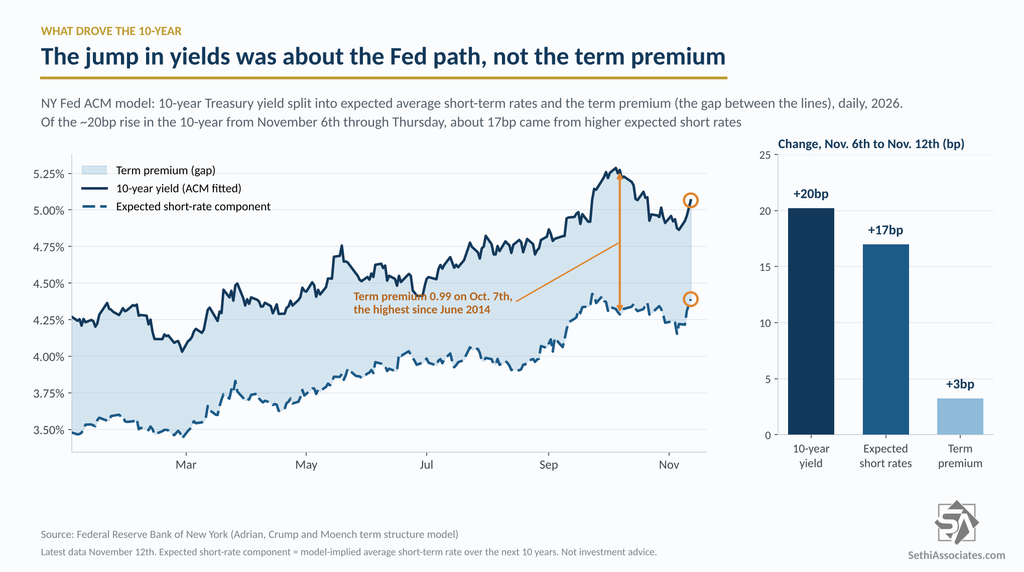
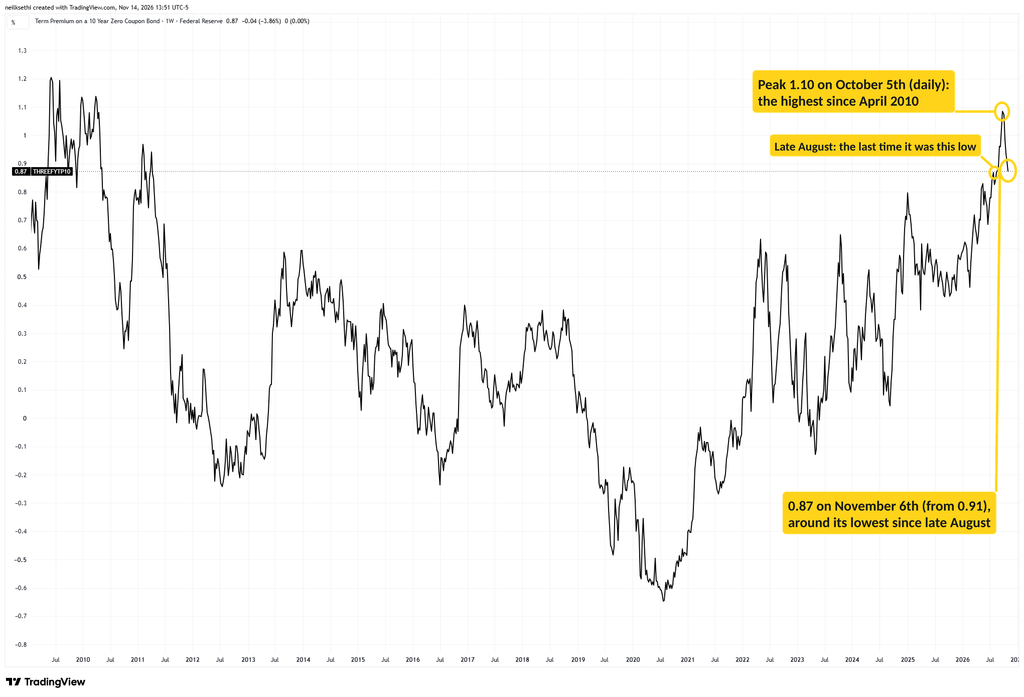
The Fed’s Kim-Wright measure, which runs a week behind, eased to 0.87 on November 6th from 0.91 a week earlier, around its lowest since late August, though still (barely) above any reading from mid-April 2011 through 2025.
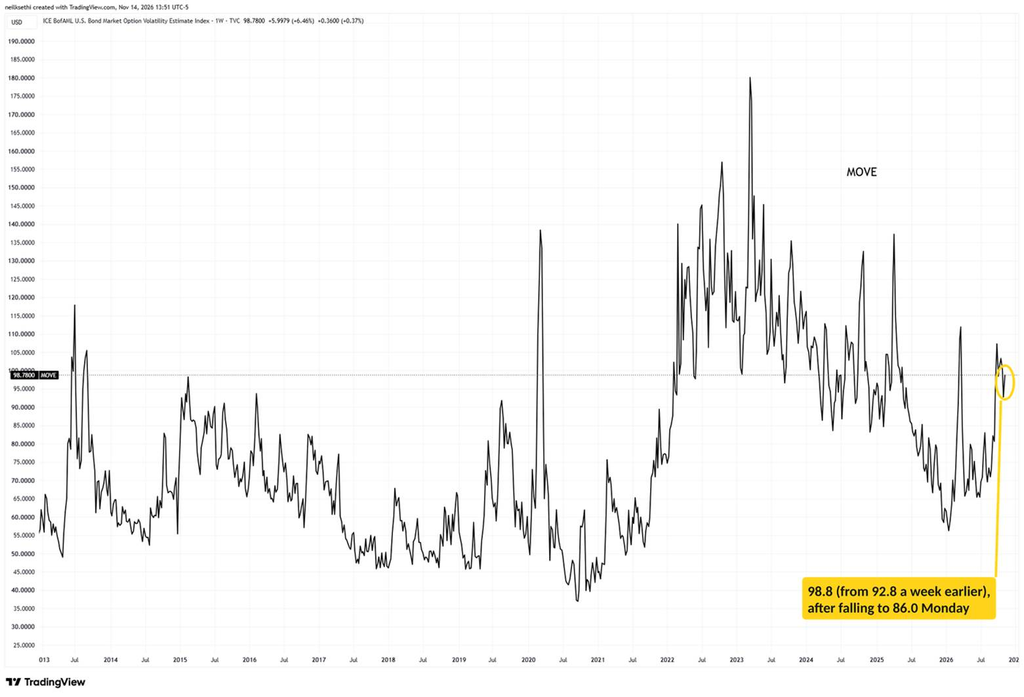
Bond volatility picked up but remains contained. The MOVE index ended the week at 98.8, up from 92.8 a week earlier and its highest since November 3rd, after falling to 86.0 Monday, its lowest since September 22nd. It’s still well below 113.6 on October 5th.
Not helping yields was relatively weak demand at the refunding auctions, with the 3-year, 10-year and 30-year all tailing, the first time since May all three did. All saw indirect bidders’ share fall below their six-month averages, the 10-year by the most since 2016 (3-year; 10-year; 30-year). I’ll have a post next week diving into the indirect demand component.
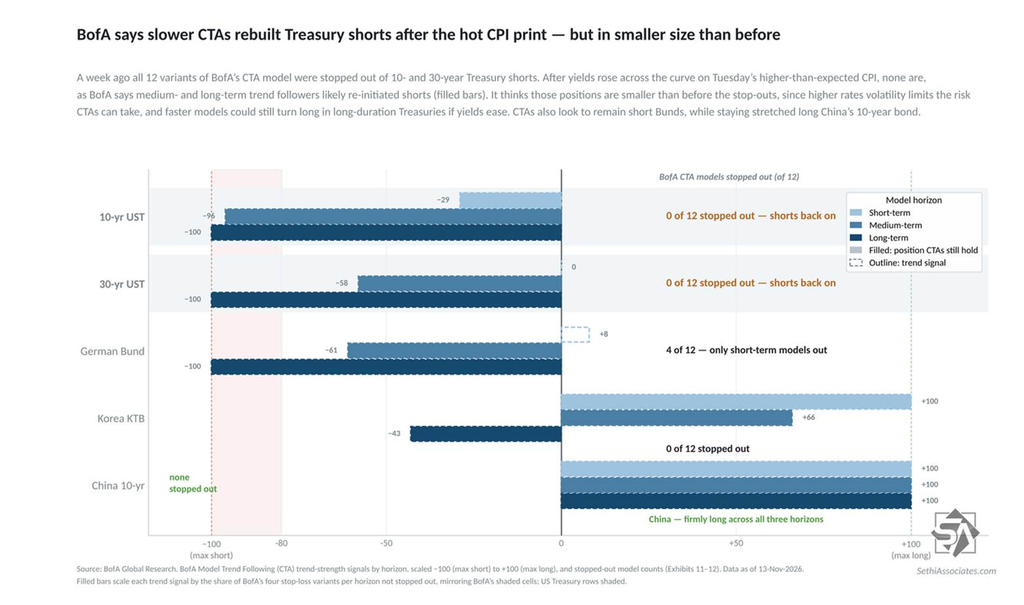
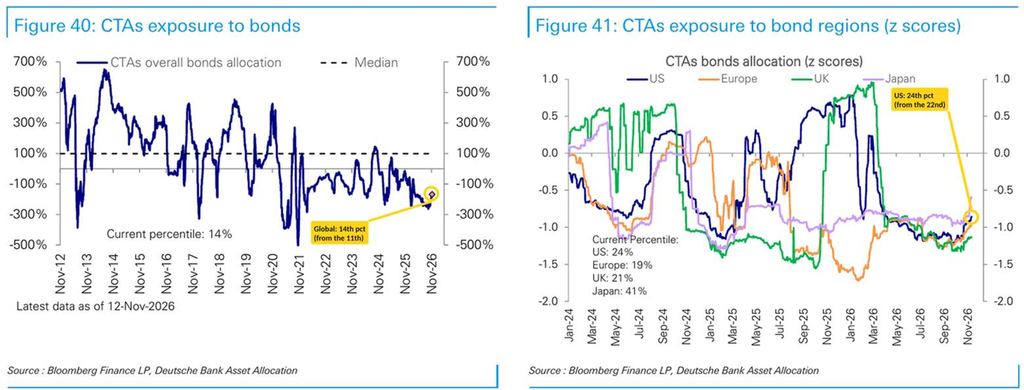
Also weaker last week was demand from CTAs. BofA says medium- and long-term trend followers likely re-initiated Treasury futures shorts last week as yields rose across the curve after Tuesday’s hotter-than-expected CPI. A week earlier all 12 of its CTA model variants were stopped out of 10- and 30-year shorts; now none are. BofA thinks the new positions are smaller than before, since higher rates volatility limits how much risk CTAs can take, and faster models could still turn long in long-duration Treasuries if yields ease. CTAs also appear to remain short Bunds and stretched long China’s 10-year bond.
DB saw less of a pickup in CTA covering in bonds, with US positioning slowly climbing to the 24th percentile (from the 22nd) and global to the 14th (from the 11th).
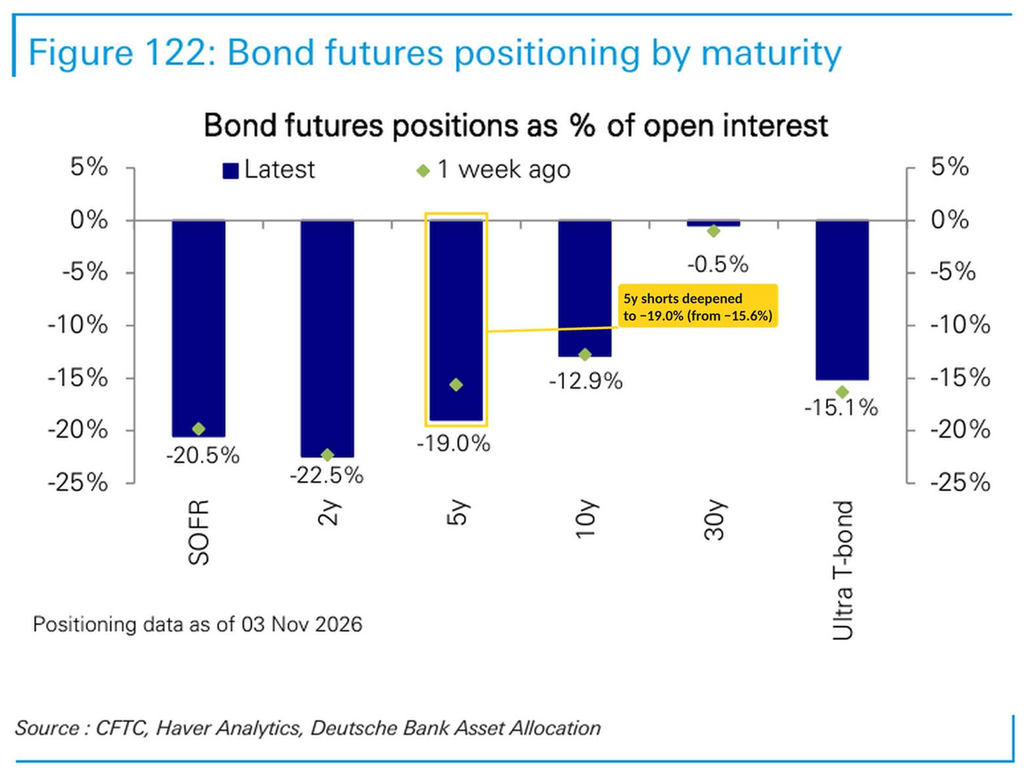
Looking at broader positioning, DB’s read of the CFTC data (as of November 3rd so a bit delayed) shows speculators still net short across the curve. Net shorts are 22.5% of open interest in 2-year futures, 19.0% in 5-year (from 15.6%), 12.9% in 10-year and 15.1% in the Ultra bond, although only 0.5% in the 30-year.
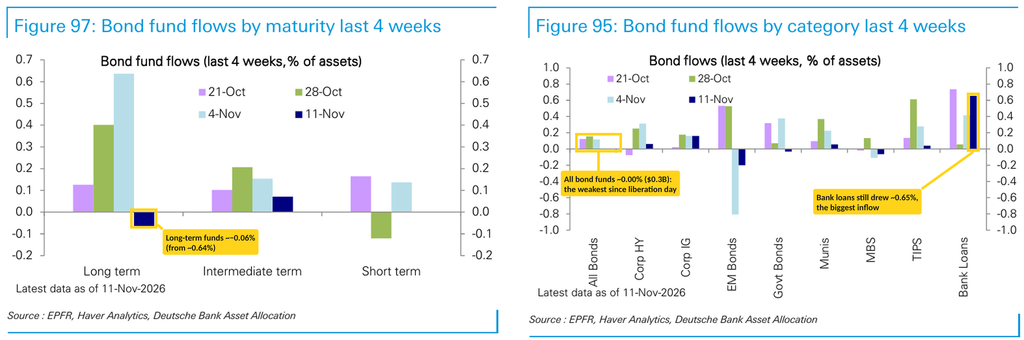
And bond fund flows show investors stepping back from their buying after the hot CPI. Per DB, long-term bond funds saw outflows (~−0.06% of assets) in the week through November 11th, after taking in ~0.64% the prior week, while intermediate-term (~0.07%) and short-term (~0.00%) funds saw small inflows. Overall bond fund inflows slowed to ~0.00% ($0.3B), the least since liberation day. Bank loans (~0.65%) and IG (~0.16%) led, while government bonds (~−0.03%, only their second outflow in seven months) and EM bonds (~−0.20%, a second week) saw outflows, and broad-mandate funds saw outflows for the first time in nearly eight months.
Investors Reacting to Earnings Better Than Normal, Just Not for the Mag 7
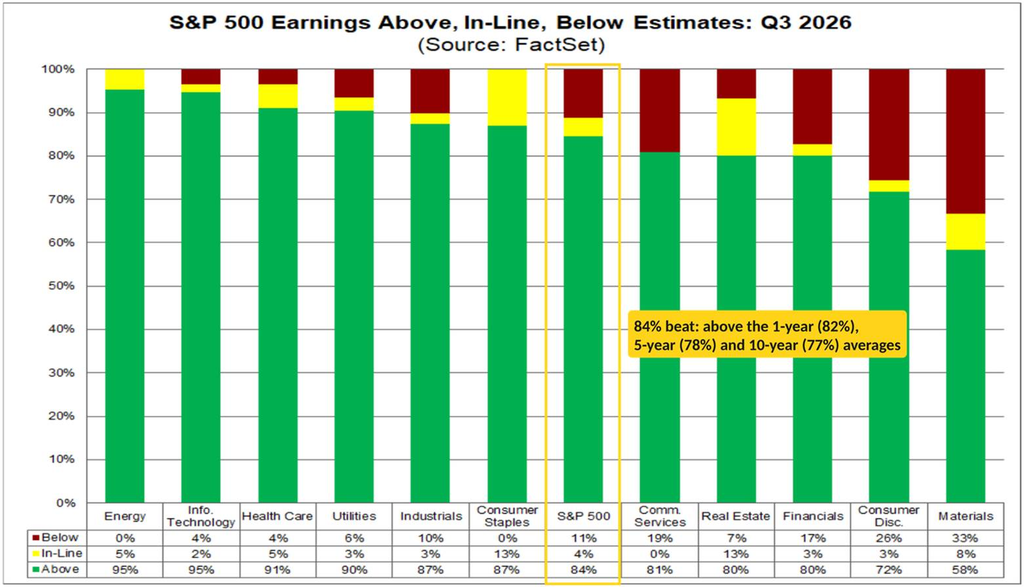
Looking at Q3 earnings, we’re now nearly done (and we’ll get just about all the way there with this week’s earnings), with 91% of the S&P 500 reporting through Thursday according to FactSet, and beats remain high with 84% beating, above the 1-year average of 82%, the 5-year average of 78% and the 10-year average of 77%.
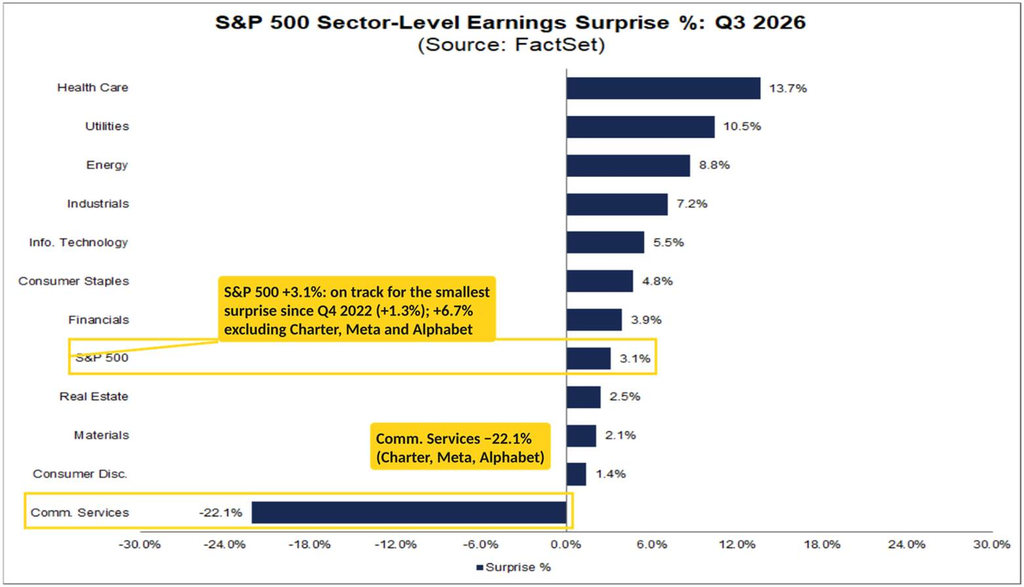
The magnitude of the beats though remains historically weak at +3.1% (from +2.7% the prior week), well below the 1-year average of 13.8%, the 5-year average of 7.5% and the 10-year average of 8.0%. If that holds, it would be the smallest surprise since Q4 2022 (+1.3%). But as noted in prior weeks, it’s in large part a function of the Communication Services sector at −22.1% (from −24.6%), on the GAAP charges at Alphabet (GOOGL) and Meta (META), along with a big miss at Charter Communications (CHTR). FactSet notes that excluding those three companies, the surprise would be +6.7%, much closer to the 5- and 10-year averages.
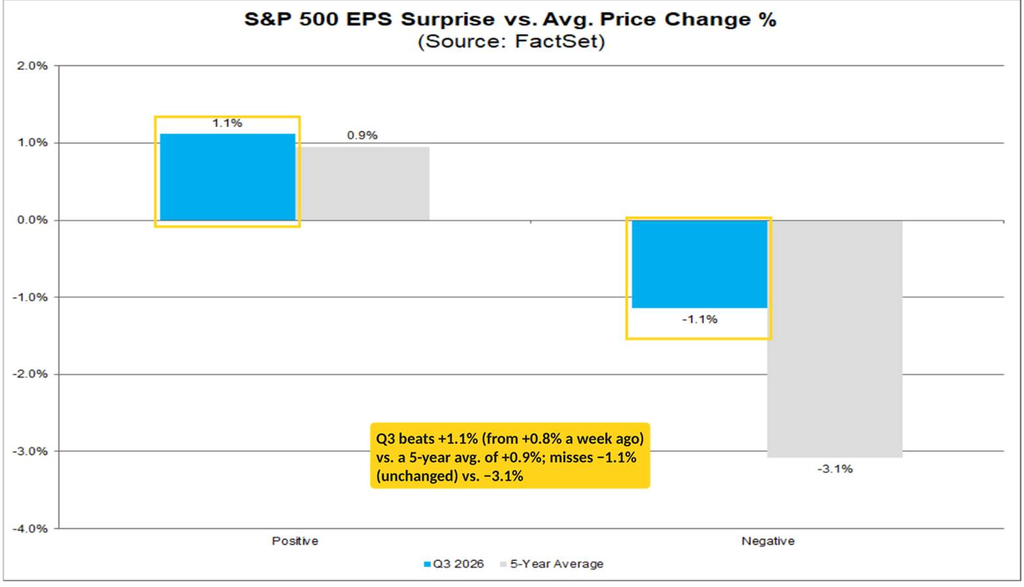
The market has started rewarding beats more than average, though, according to FactSet and continues to punish misses less than average. They say companies beating estimates have now averaged a +1.1% move from two days before their report to two days after (from +0.8% the prior week), above the 5-year average of +0.9%, while those missing have averaged −1.1% (unchanged), far better than the 5-year average of −3.1%. FactSet credits rising Q4 estimates (the Q4 bottom-up EPS estimate is up 1.1% since September 30th, while analysts usually cut estimates during a quarter) and better-than-usual Q4 guidance (see below).
The exception is the Magnificent 7. The three that beat, Apple (AAPL), Microsoft (MSFT) and Tesla (TSLA), averaged a −0.2% move over the same window, and the three that missed, Alphabet, Amazon (AMZN) and Meta, averaged −7.8%.
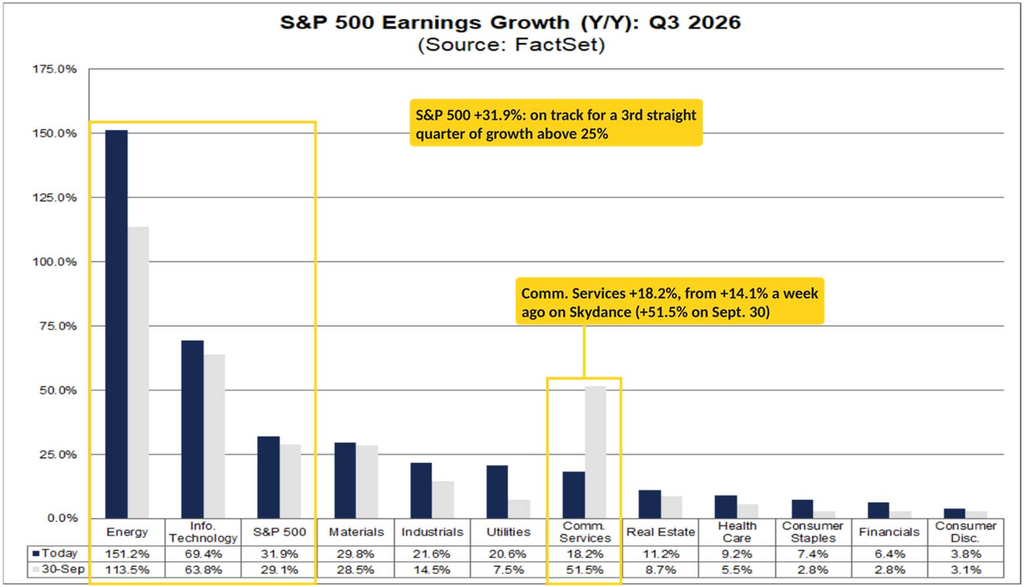
With the improvement in results, Q3 expected earnings growth climbed another 0.6 points to +31.9% (from a revised 31.3%), which would be a third straight quarter above 25% and an eighth straight of double-digit growth. Energy extended to +151.2% y/y (from +149.4%, and up from +113.5% on September 30th), followed by Tech +69.4% (from +69.2%) and Materials +29.8%, while Comm Services rebounded to +18.2% from +14.1% the prior week on a beat from Skydance (SKYD) (still well below +51.5% on September 30th).
Within Tech, semiconductors are growing 133%. Excluding them, FactSet says Tech’s growth rate would fall to 29.9% from 69.4%.
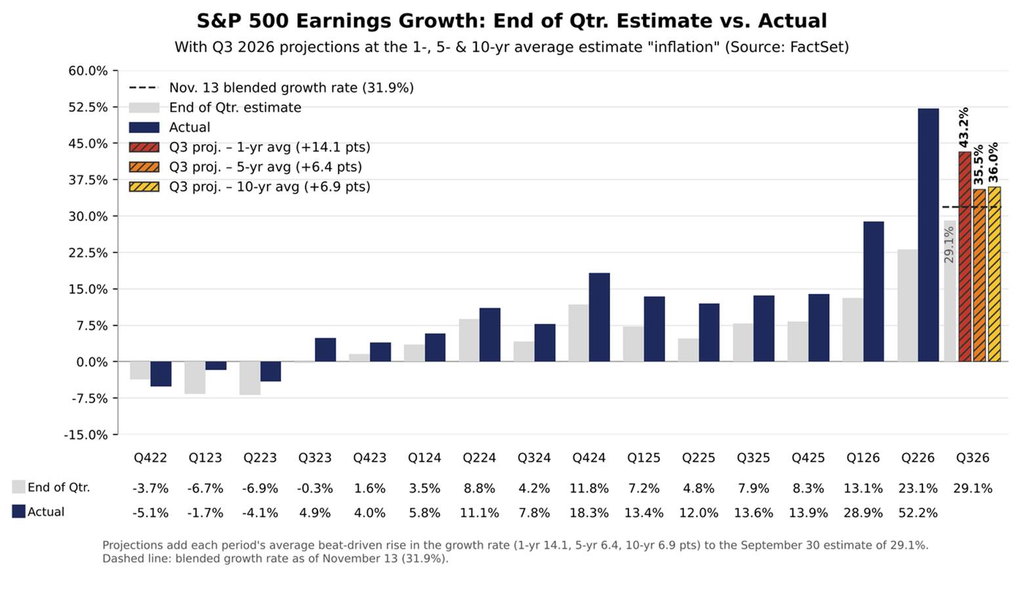
Which is directionally consistent with the typical “earnings inflation” we see each earnings season as I mentioned at the start of the reporting period (numbers are from the end of the quarter, which is where the “inflation” metrics are measured from):
With the blended growth rate at 31.9%, the 5- and 10-year averages (35.5% and 36.0% from the 29.1% September 30th estimate) imply roughly another three and a half to four points from here, though with 91% of companies reported there’s even less room left for it. So far the growth rate has risen 2.8 points since September 30th, against 5- and 10-year average gains of 6.4 and 6.9 points over a full season.
Q3 revenue growth expectations also edged up to +14.4% (from +14.3%), which would be the second fastest since Q4 2021 (16.3%), behind only Q2 (15.6%), and a third straight quarter of double-digit growth. Expectations are led by Tech (+42.9%), Energy (+35.7%) and Communications (+16.0%). And 74% of companies have beaten revenue estimates (5-year average 70%), by an aggregate +2.2% (5-year average +1.8%).
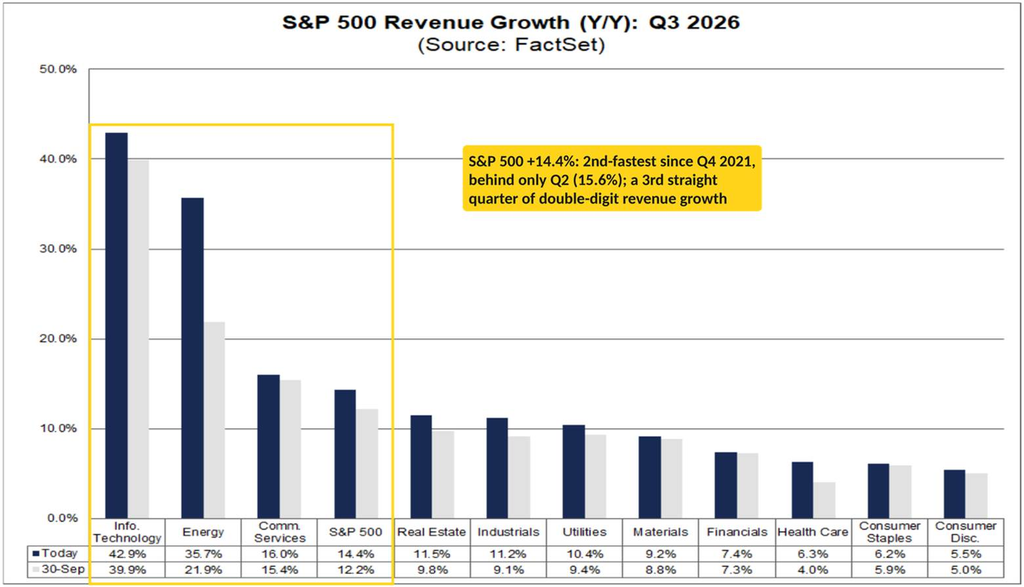
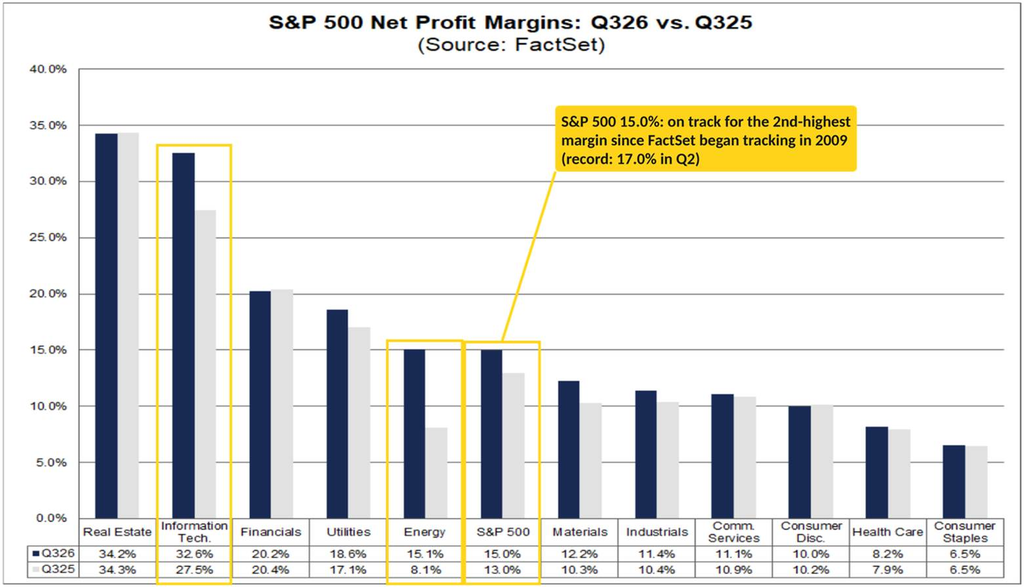
Net profit margins also improved to an elevated 15.0% (from 14.9%), the second highest on record (since 2009) after 17.0% in Q2 and up from 13.0% a year ago, led by Tech’s 32.6% (vs 27.5% a year ago and a 25.9% five-year average) and Energy’s 15.1% (vs 8.1%).
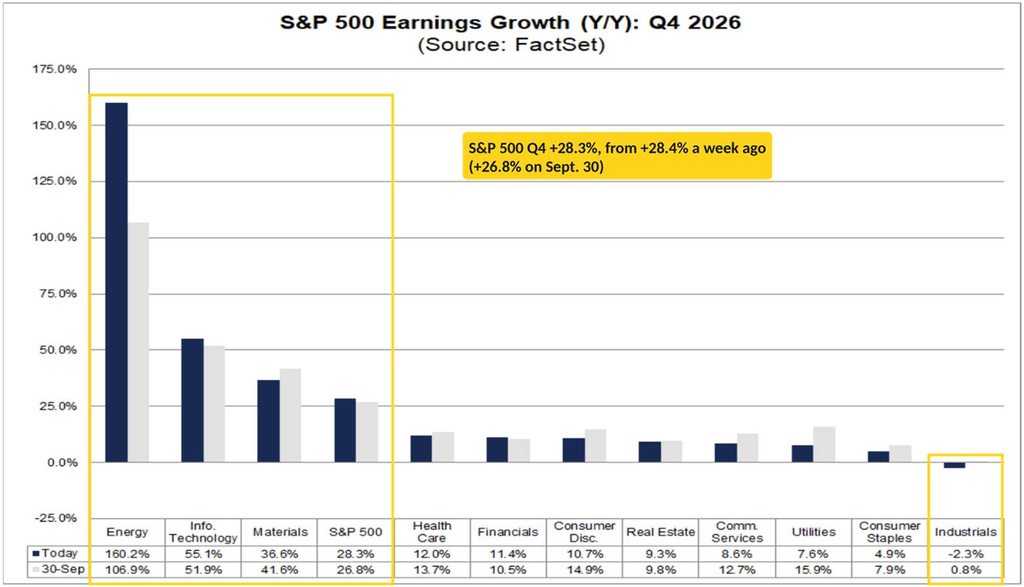
Expected Q4 growth though edged down to 28.3% (from 28.4%; it’s still up from 26.8% on September 30th), even as guidance remains better than usual: 42% of the 78 companies that have guided Q4 have been negative, versus a 5-year average of 60%. Under the hood the trims continued, with Comm Services (8.6% from 8.9%), Materials (36.6% from 38.5%), Utilities (7.6% from 9.7%), Consumer Discretionary (10.7% from 11.3%) and Industrials (−2.3% from −2.2%) lower again, almost offset by Tech (55.1% from 54.9%) and Energy (160.2% from 157.2%).
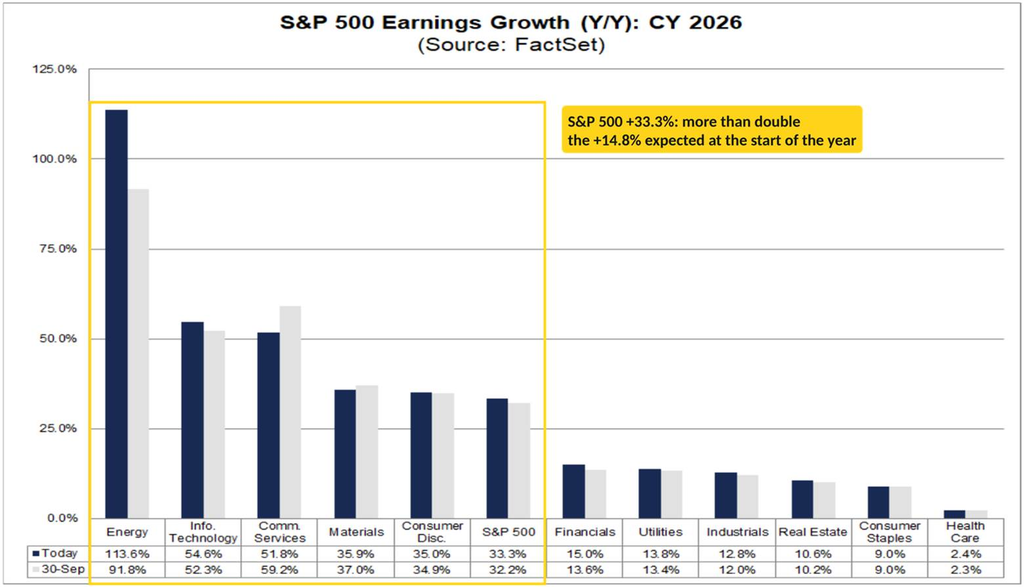
With Q3 up and Q4 little changed, 2026 SPX earnings growth expectations held at +33.3%, up from +24.0% on June 30th, +17.1% on March 31st, and over double the +14.8% at the start of the year. Energy leads at +113.6% (from +111.5%; up from +6.4% at the start of the year), followed by Tech at +54.6% (from +54.4%; up from +28.6%) and Communications (+51.8%, from +53.4%). Those sectors along with Materials (+35.9%) and Consumer Discretionary (+35.0%) remain the five expected to come in above the SPX average.
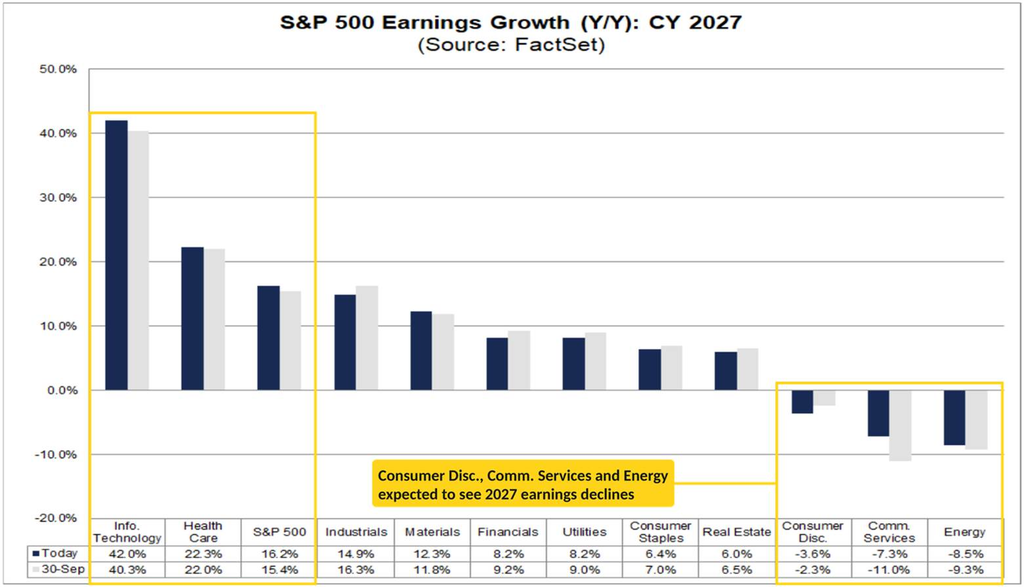
And 2027 earnings are expected to be up another +16.2% (from +16.1%), softening just a little from the +17.5% as of June 30th even as the 2026 comp has lifted by 9.3 points during that time. Tech again leads (+42.0%), followed by Health Care (+22.3%), with no other sector above the SPX average (Industrials just under at +14.9%). Energy (−8.5%), Communications (−7.3%) and Consumer Discretionary (−3.6%) are expected to see declines.
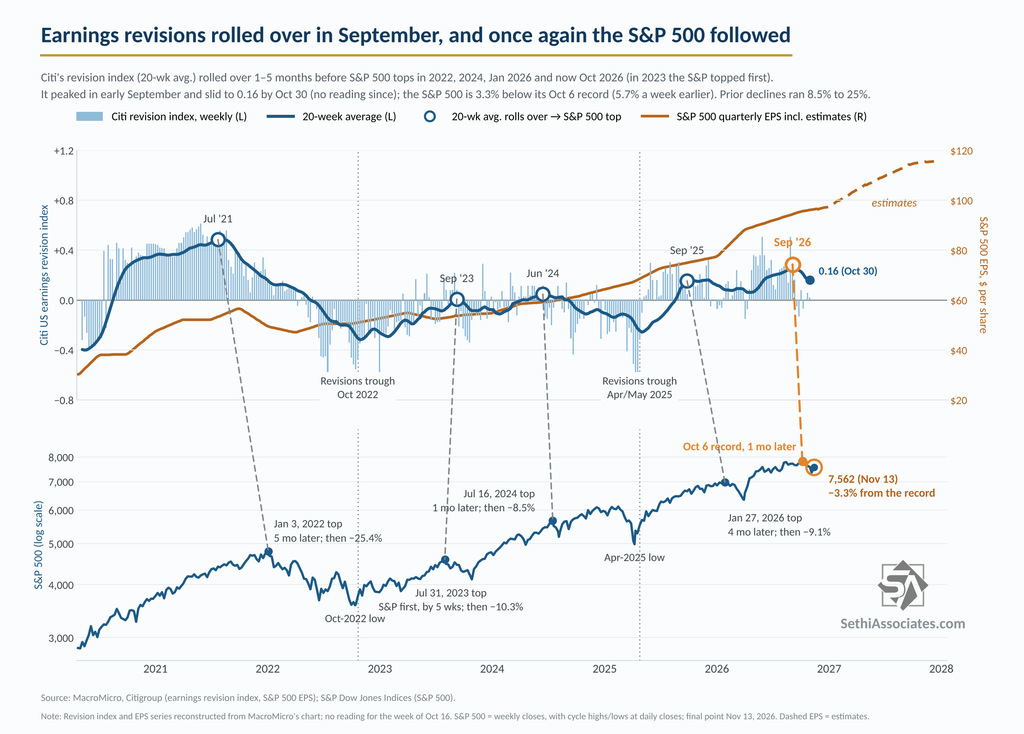
Turning to earnings revisions, Citi’s earnings revision index hasn’t printed since the week of October 30th (+0.02), when its 20-week average had rolled over to about 0.16. The S&P 500 is now 3.3% below its October 6th record (from 5.7% a week earlier).
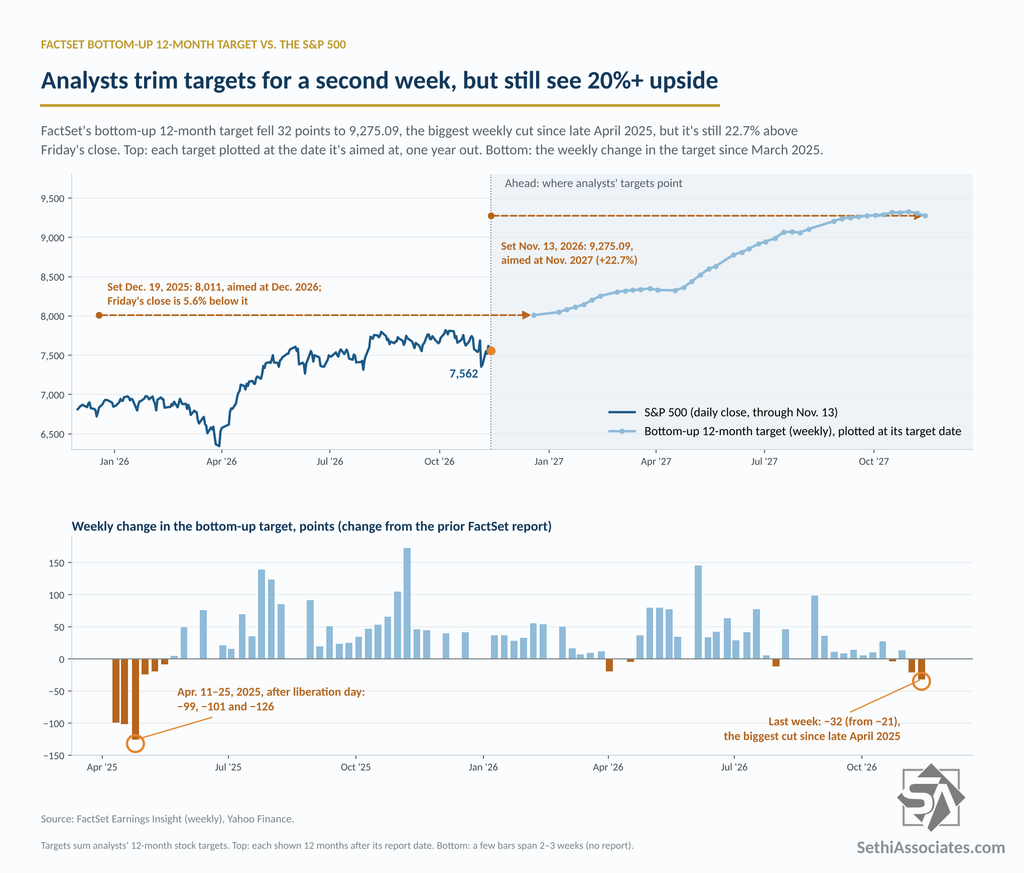
Analysts meanwhile continue to see plenty of upside, although FactSet’s compilation of analyst bottom-up SPX 12-month price targets eased for a second week to 9,275.09 (−32pts w/w, ~+950 pts since March 31st, ~+1,350 pts since Thanksgiving, and ~+2,585 pts since July 1, 2025). That’s a bigger drop than the prior week’s, making this the largest since April 2025. Still that represents a gain of +22.2% from Thursday’s close (7,592.40), down from +26.6% the prior week as the index rose about 3.2% through Thursday (and +22.7% from Friday’s close).
As a reminder, we started the year with a 12-month bottom-up price target of about 8,000 (8,010.64). Friday’s close leaves the S&P 500 about 5.6% below that.
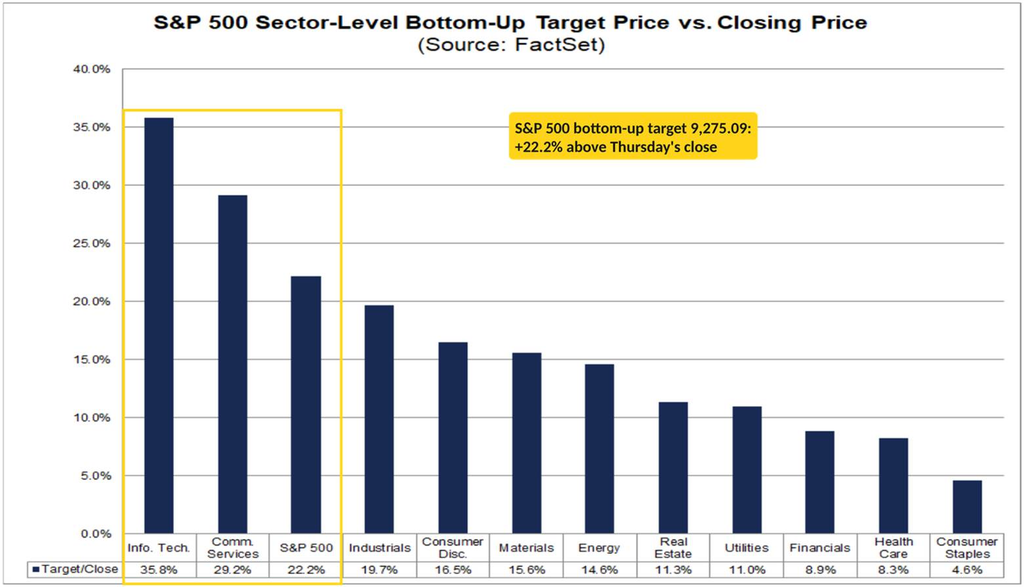
Tech (+35.8%, from +44.1%) remains on top for expected upside even after its bounce, followed by Communications (+29.2%, from +34.9%) and Industrials (+19.7%, from +25.2%). Energy’s expected upside fell back to +14.6% from +19.8%. Consumer Staples (+4.6%), Health Care (+8.3%) and Financials (+8.9%) remain the only sectors with single-digit expected upside.
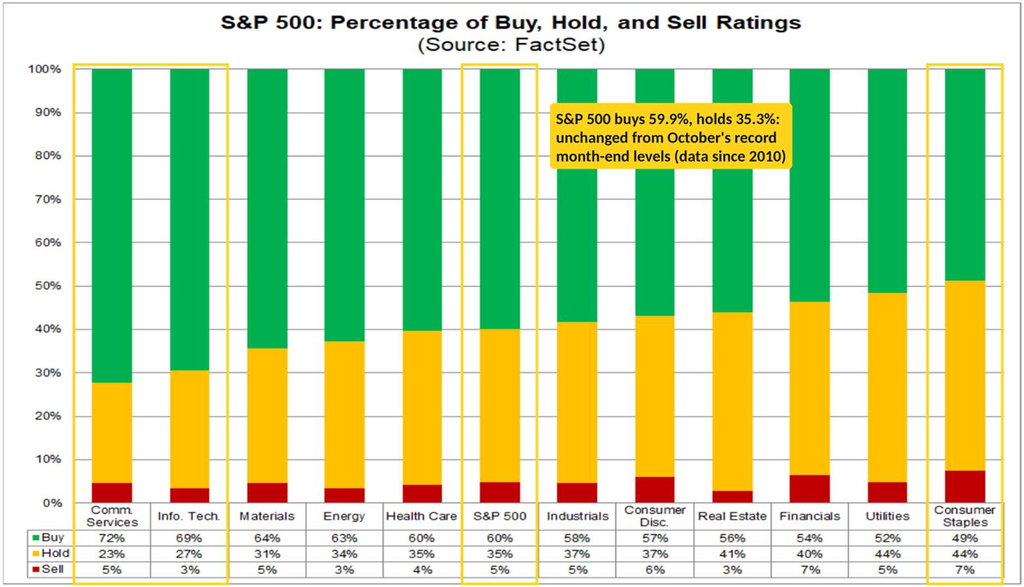
In terms of analyst ratings, buy ratings held at 59.9%, matching the record month-end high (to 2010) they set at the end of October, while hold ratings held at a record-low 35.3% and sells edged down to 4.7% (from 4.8%). The 5-year month-end averages are 55.8%, 38.7% and 5.6%. Communications (72%) and Tech (69%) have the highest share of buys, while Consumer Staples has the lowest (49%) and, along with Financials, the most sells (7%).
Nasdaq-100’s P/E Falls to Its Lowest Since the Covid Crash
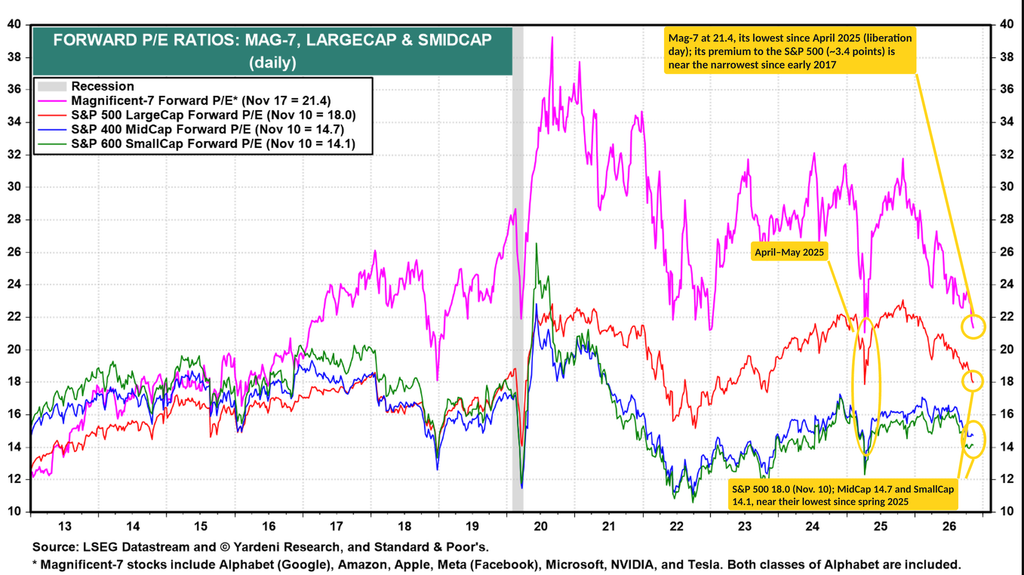
Ed Yardeni’s forward P/E for the S&P 500 rebounded to 18.0 as of November 10th from 17.6 the prior week (which was “below the 2025 liberation day low”), and he thinks it “probably bottomed on November 5,” while forward earnings “should continue rising, albeit at a slower pace.” As he puts it, “FEMO has offset FOMO” (fabulous earnings momentum vs. the fear of missing out), with soaring forward earnings offsetting the drop in the P/E.
His chart also shows the Magnificent 7’s forward P/E down to 21.4, its lowest since April 2025, which leaves its premium to the S&P 500 (about 3.4 points) near the narrowest since early 2017. The S&P 400 MidCap (14.7) and S&P 600 SmallCap (14.1) are near their lowest since the spring of 2025.
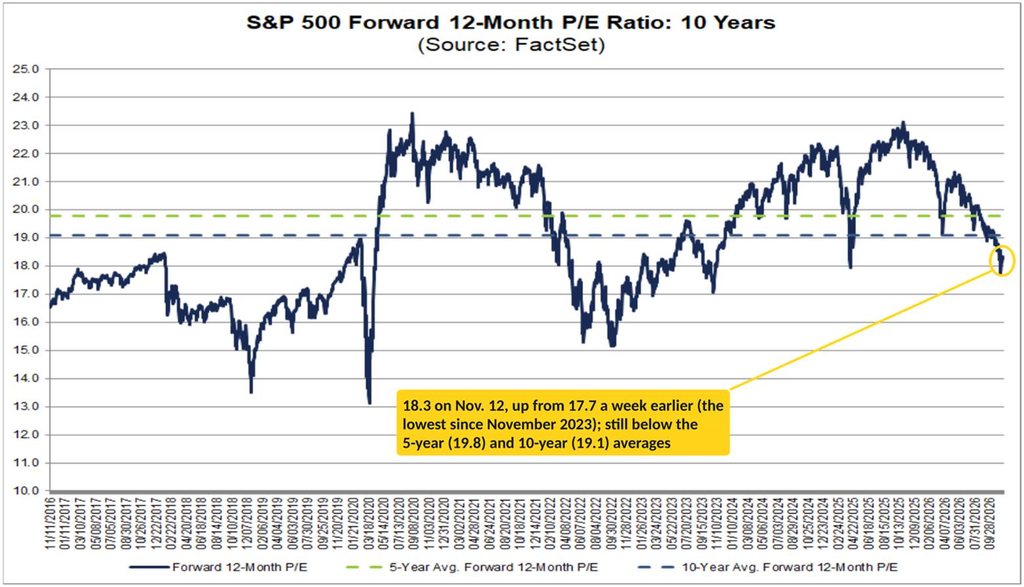
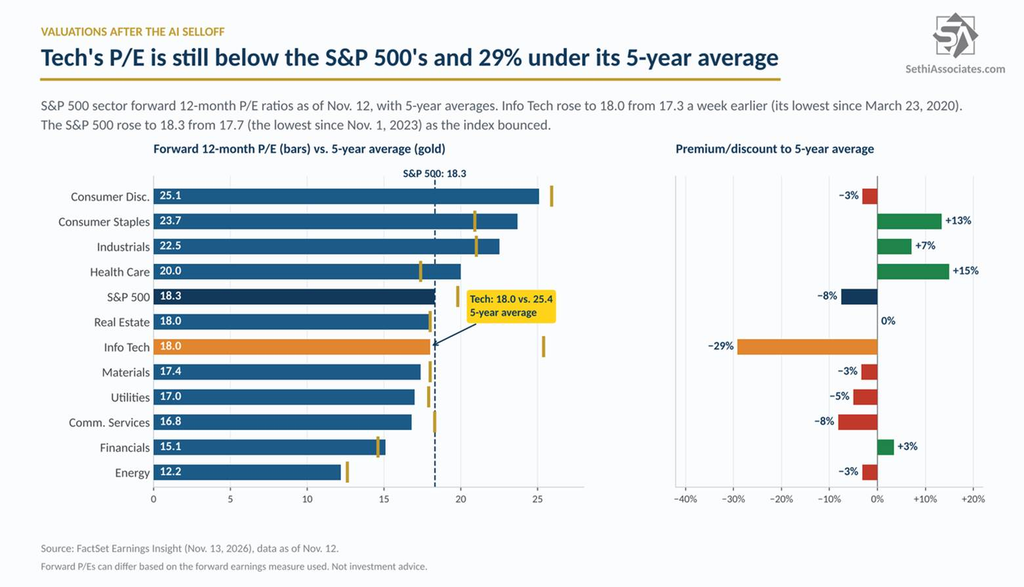
FactSet’s forward P/E* for the S&P 500 rose to 18.3 (as of Thursday) from 17.7 (the lowest since November 1, 2023), still below the 5-year (19.8) and 10-year (19.1) averages. That’s down from 19.0 on September 30th, as the index fell 0.8% since then while forward EPS rose 3.3%. Tech’s forward P/E rose to 18.0 from 17.3 (the lowest since March 23, 2020), leaving it still just below the S&P 500’s and 29% under its 5-year average (25.4). The trailing P/E is 25.4 (from 24.7), above its 5-year (24.4) and 10-year (23.7) averages.
*Note P/Es can differ based on the particular metrics used for forward earnings.
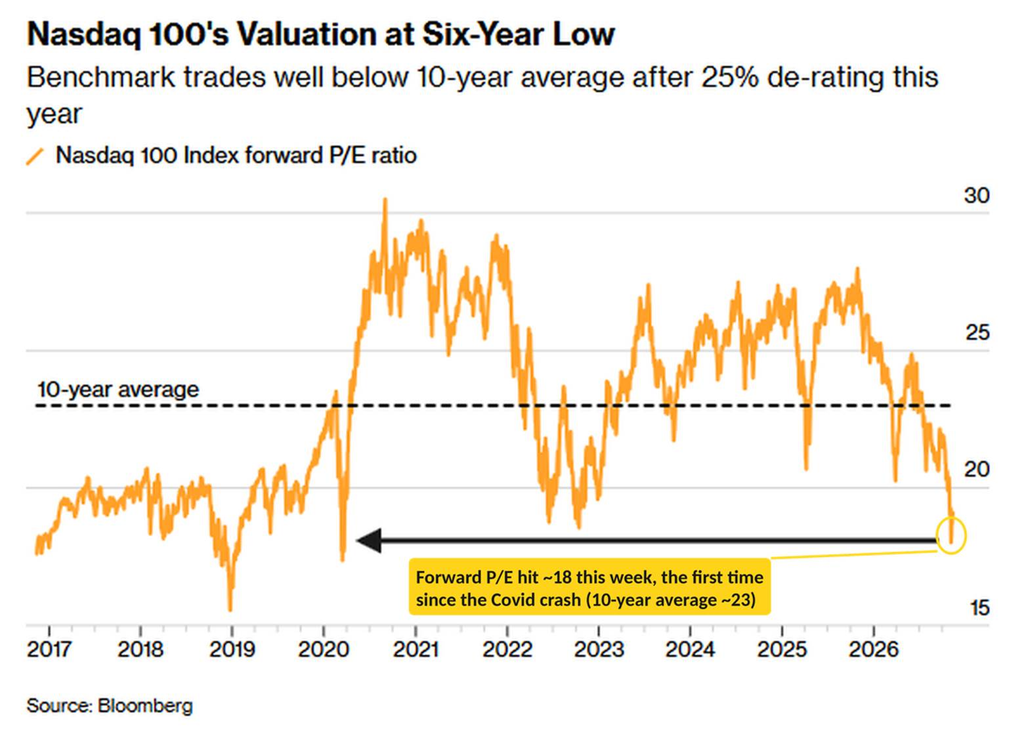
The Nasdaq-100’s forward P/E hit 18 last week for the first time since the Covid crash, per Bloomberg, well below its 10-year average (about 23) after a 25% de-rating this year.
Breadth Improves, but the Nasdaq Keeps Lagging
Breadth improved last week, led by the S&P 500’s own members, but the Nasdaq continues to lag, with the share of its stocks above their 200-DMAs slipping to the lowest since the end of March.
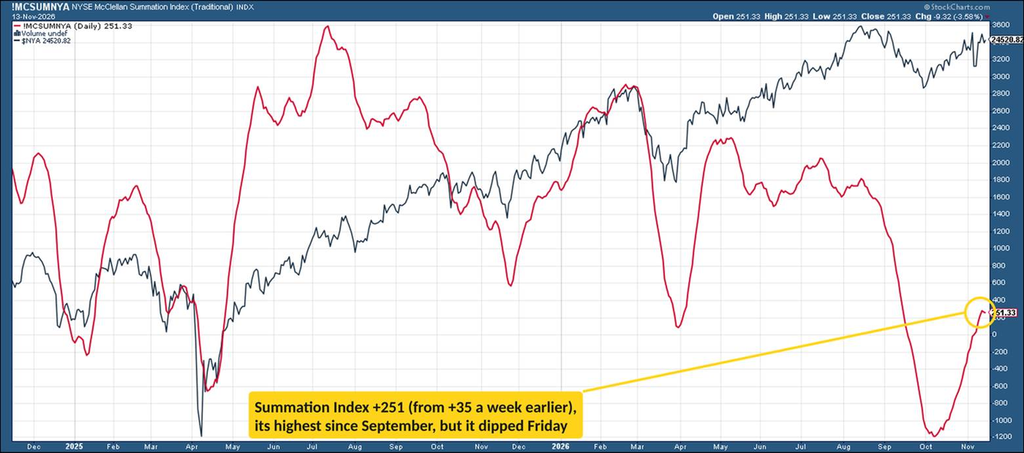
The McClellan Summation Index (red line, broadly whether the typical stock is doing relatively better or worse than the index) continued its turn higher, to +251 from +35 a week earlier, its highest since September, though it dipped Friday.
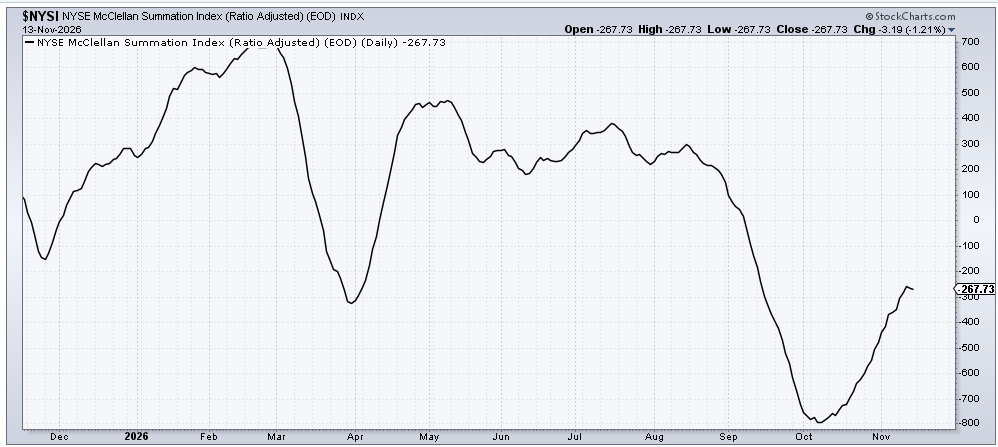
Helene, who follows the ratio-adjusted version, says in her Saturday Chart Fest that it’s “starting to rollover. Not great for the ‘others'” (Saturday Chart Fest).
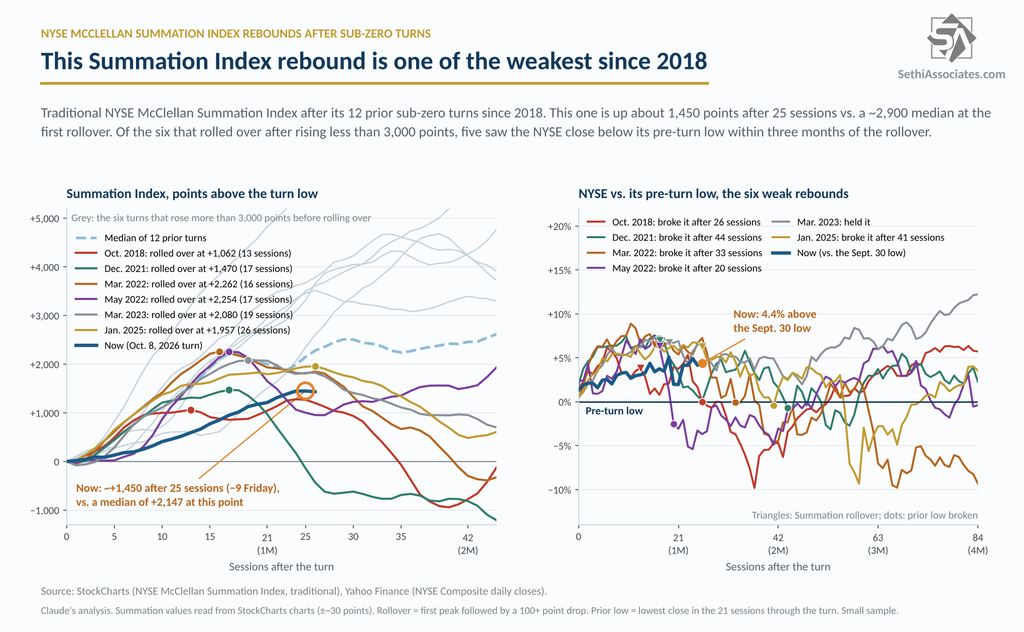
Twenty-six sessions in, the rebound from the October 8th sub-zero turn has improved to the fourth-weakest of the 13 turns since 2018, from the second-weakest a week earlier. The NYSE is up 3.0% since the turn, against a 6.5% median for the 12 prior turns at the same point (9 of 12 higher). The three turns still weaker at this stage (October 2018, December 2021 and May 2022) all went on to break below their prior price lows. The NYSE Composite is now 1.2% below its August 14th record and 4.4% above its September 30th low. The next checkpoint is 42 sessions, Tuesday, December 8th.
Now, about Friday’s dip: the traditional index slipped 9 points (to 251.33 from 260.65), short of the 100-point drop that would make it a statistically significant rollover. If it does become the first rollover since the October 8th turn, though, the timing is normal. Thursday’s peak came 25 sessions after the turn, against a median of 26 sessions (range 13 to 42) for the first rollover after the 12 prior sub-zero turns since 2018. But consistent with the prior paragraph, what’s unusual is how little it rose first: about 1,450 points from the October 8th low, which ranks with December 2021 (about 1,470) and October 2018 (about 1,060) as the smallest of the 13, and about half the roughly 2,900-point median.
Whether this does turn into a rollover matters if history is any guide. Six of the prior turns rolled over after rises of less than 3,000 points (this one is less than half that), and in five of them (all but March 2023) the NYSE closed below its pre-turn low within three months of the rollover, with a median worst close 12% below the rollover-day level. Of the six that rose more, though, only June 2022 broke its prior low. The weak ones were similarly only 4% to 7% above their pre-turn lows when they rolled over, about where the NYSE is now (4.4% above its September 30th low). It’s a small sample, and a renewed push higher would change the picture, but like the price rebound, this breadth thrust has been on the soft side.
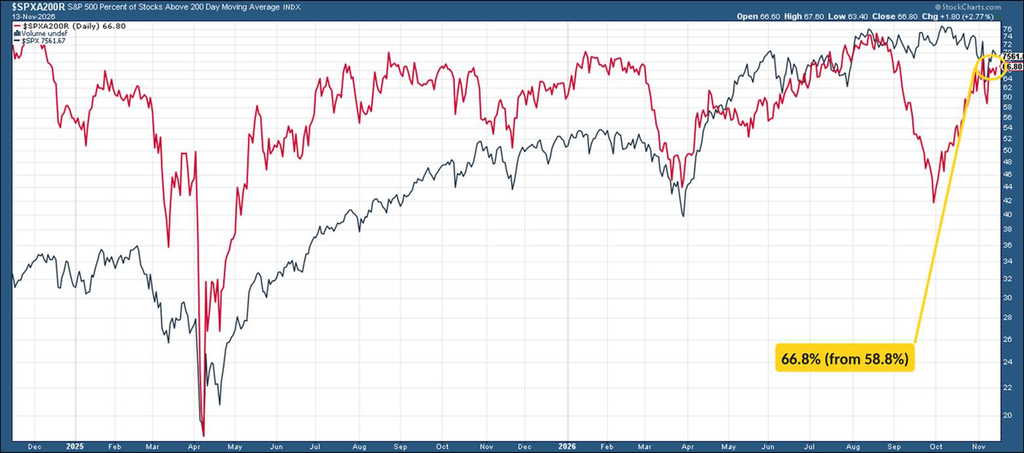
The percentage of stocks over their 200-DMAs (red lines) jumped for the S&P 500, to 66.8% from 58.8% a week earlier, up from 42% at the September 30th low.
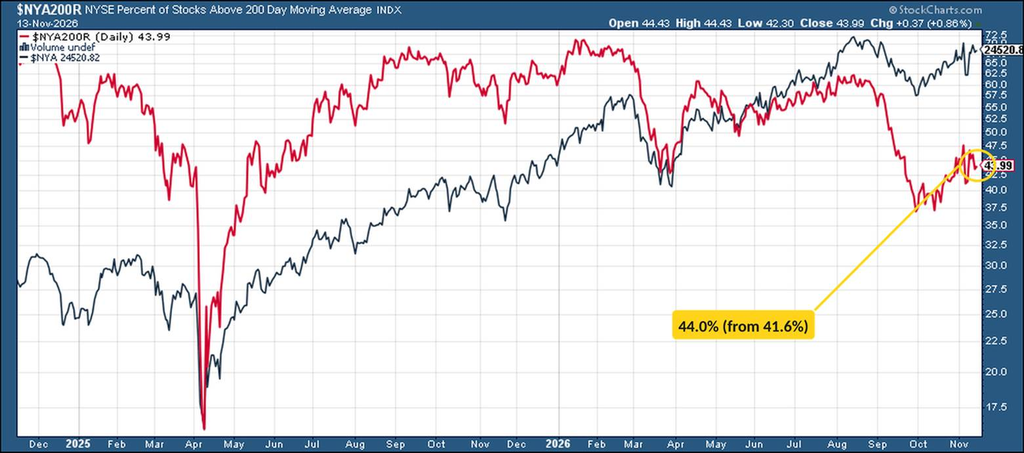
The NYSE though lags at 44.0% from 41.6%.
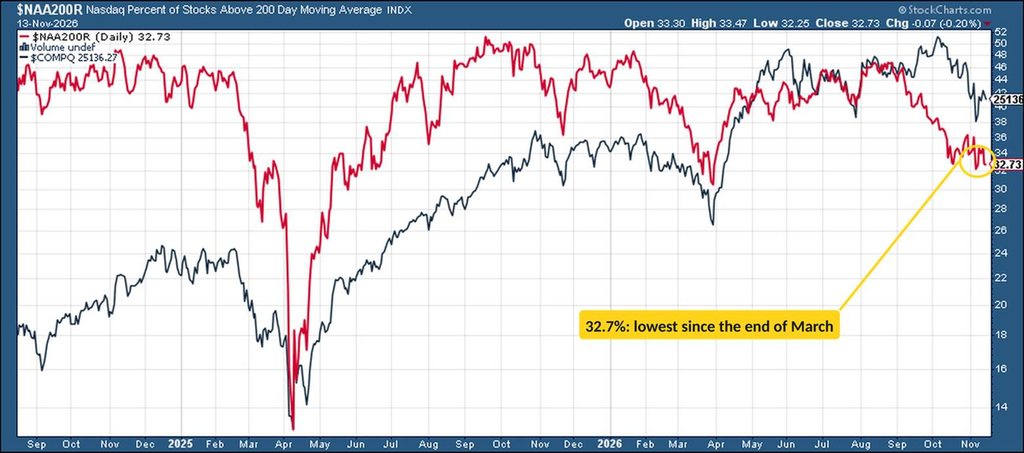
The Nasdaq, despite last week’s rally, went the wrong direction, slipping to 32.7% from 32.8%, its lowest since the end of March, even as the Nasdaq Composite (black line) rose 2.3% on the week.
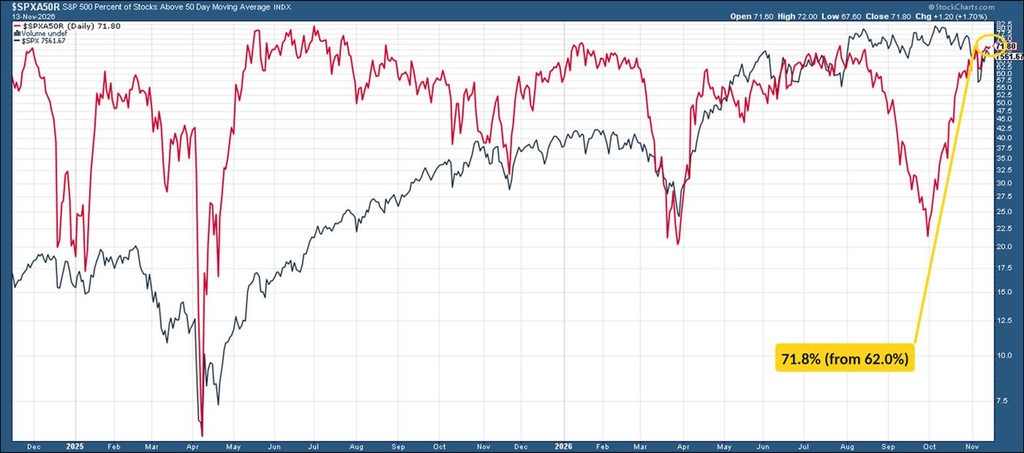
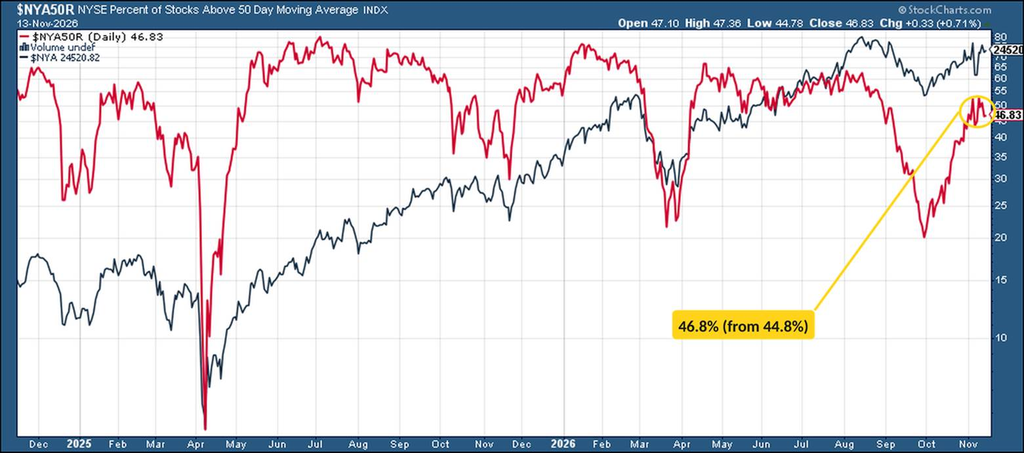
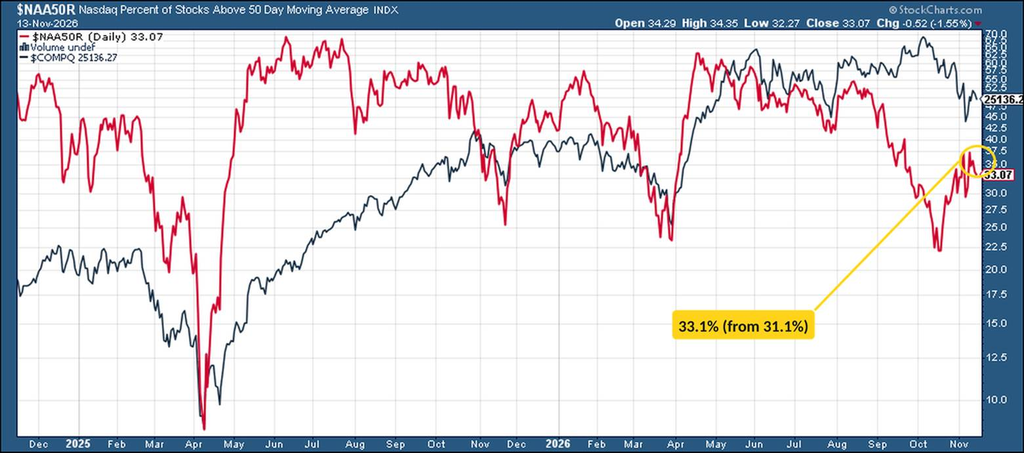
The 50-DMAs though improved on all three exchanges: S&P 500 71.8% (from 62.0%), NYSE 46.8% (from 44.8%), Nasdaq 33.1% (from 31.1%).
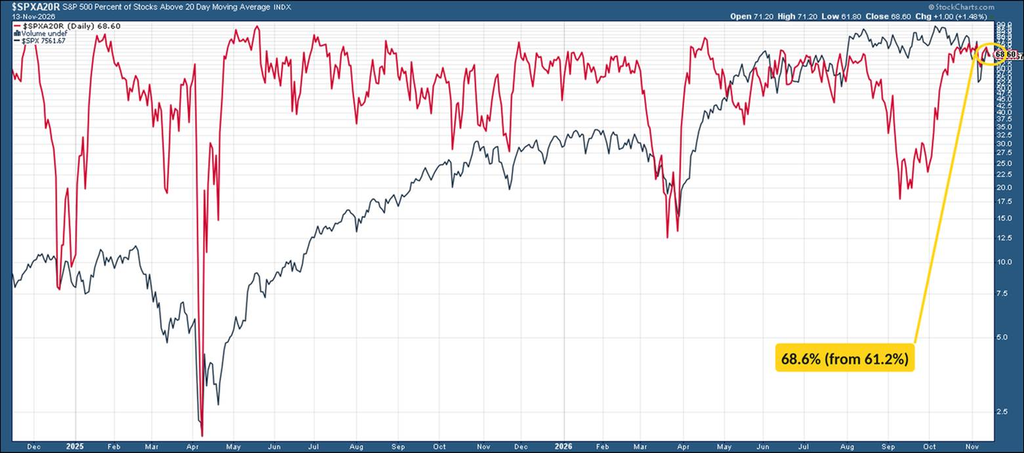
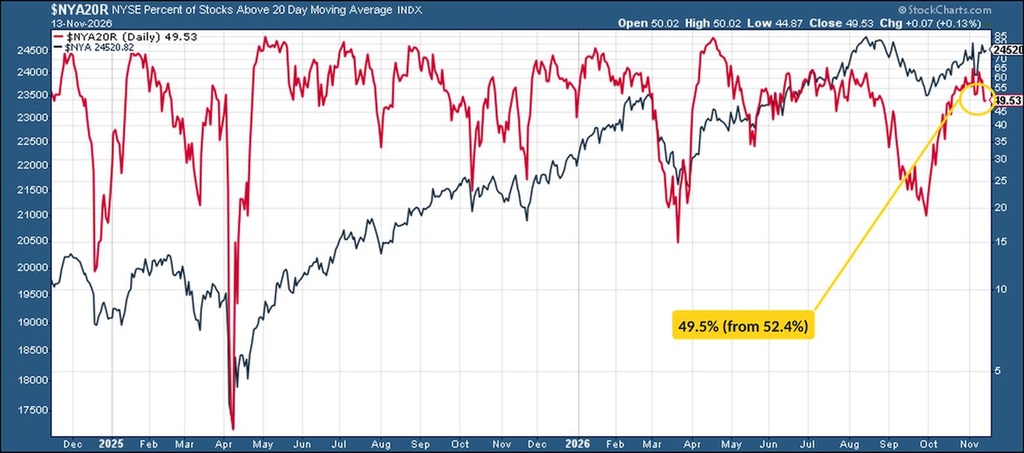
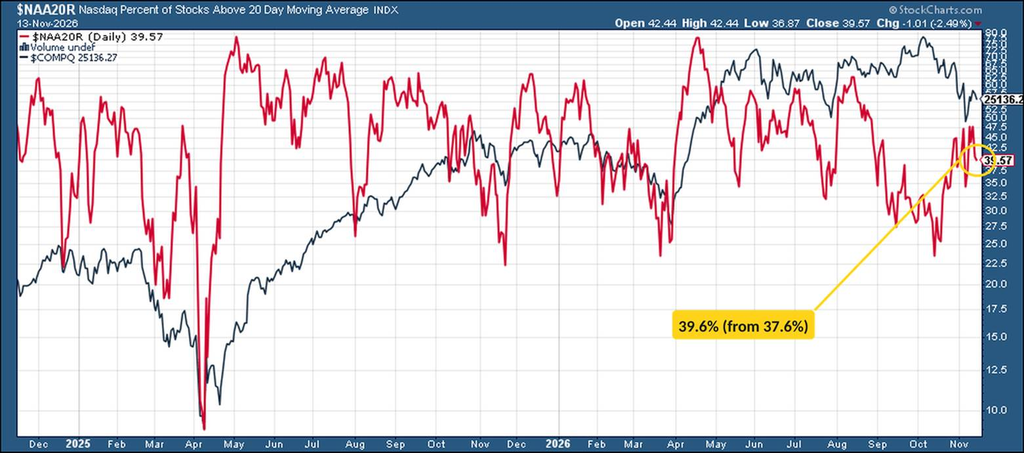
The 20-DMAs, which react fastest, rose for the S&P 500 (68.6%, from 61.2%) and Nasdaq (39.6%, from 37.6%), but slipped for the NYSE (49.5%, from 52.4%).
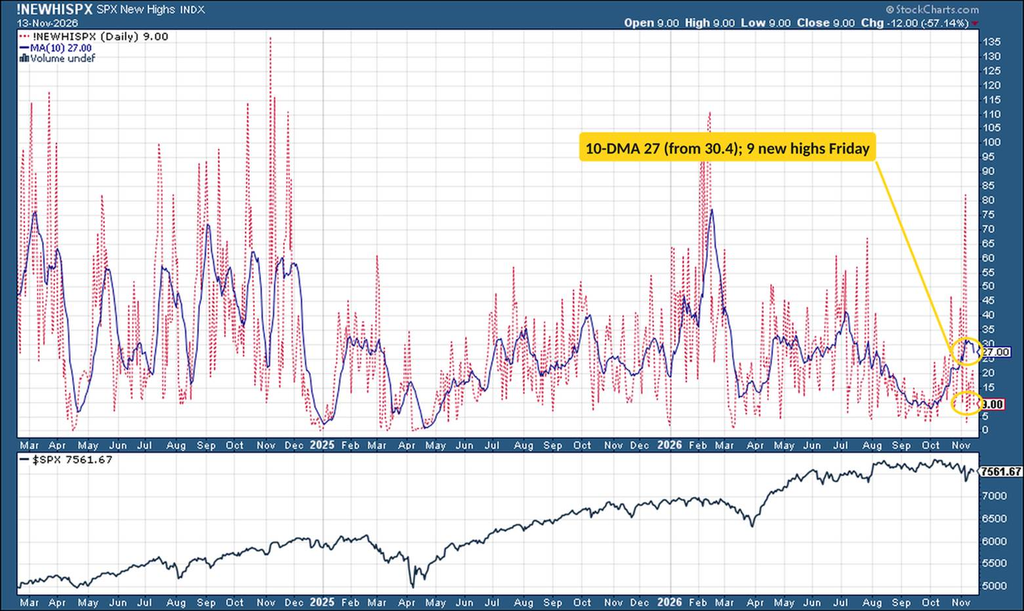
S&P 500 new 52-week highs were 9 Friday, up from 3 a week earlier, but the 10-DMA has now slipped to 27 from 30.4.
While the 10-DMA is turning down, though, like the Summation Index, it’s not technically a rollover yet. Unlike the Summation Index, its rise wasn’t weak: the climb from about 8 on October 1st to about 31 on November 5th compares with a median of about 23 for the first peak after the 20 prior times the 10-DMA fell to 10 or below since 2018, and it came in a normal 25 sessions. It also came while the S&P 500 was falling, a sign of rotation under the surface. Historically those first rollovers haven’t been much of a signal, with the S&P up a median 0.5% a month later and 5.7% three months later (higher in 15 of 20). One thing to watch: the roughly 80 new highs on November 5th roll out of the 10-day window on Thursday, so the average will likely drop sharply next week unless new highs pick up.
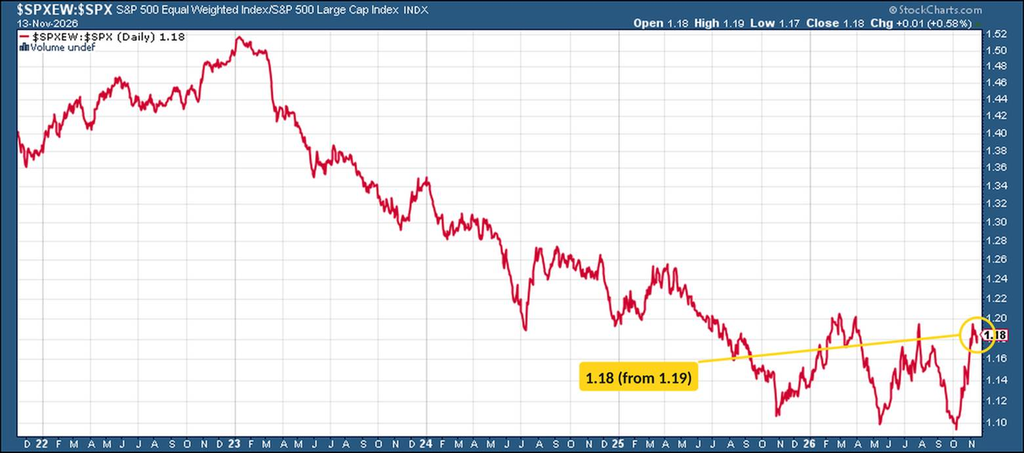
The ratio of the equal-weight S&P 500 to the cap-weighted index edged down to 1.184 from 1.186, after rolling over from 1.195 on November 5th, its highest since late July, as the equal-weight index (RSP +2.4%) slightly trailed the cap-weighted one (SPY +2.6%) in last week’s bounce.
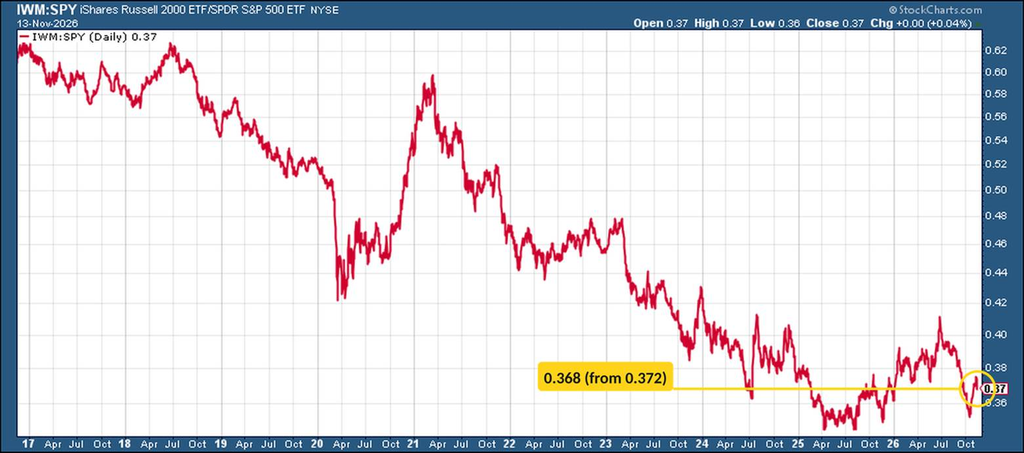
The ratio of small caps to large caps (IWM:SPY) slipped to 0.368 from 0.372 as small caps lagged (IWM +1.4%).
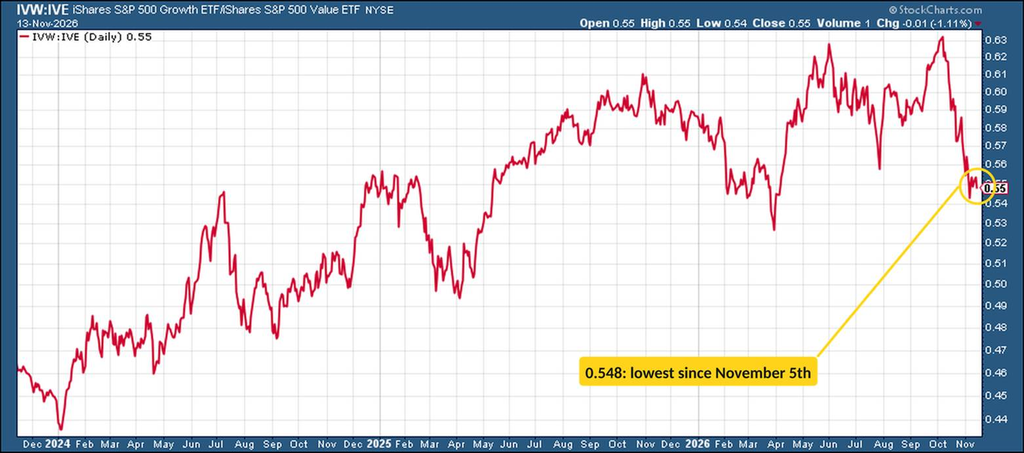
S&P 500 growth/value (IVW:IVE) eased to 0.548 from 0.550 but remained above its November 5th low.
Positioning Stays Light as Retail Buys the Dip With Leverage
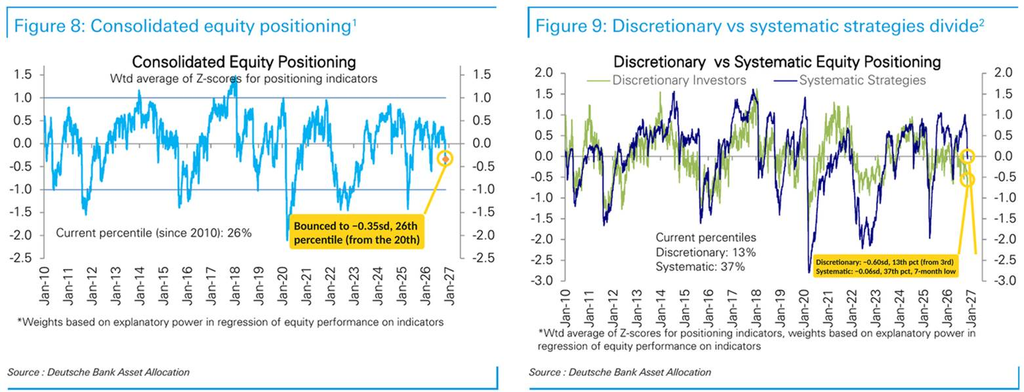
Starting with Deutsche Bank, which says consolidated equity positioning “bounced up modestly but remains well underweight,” now at the 26th percentile (from the 20th).
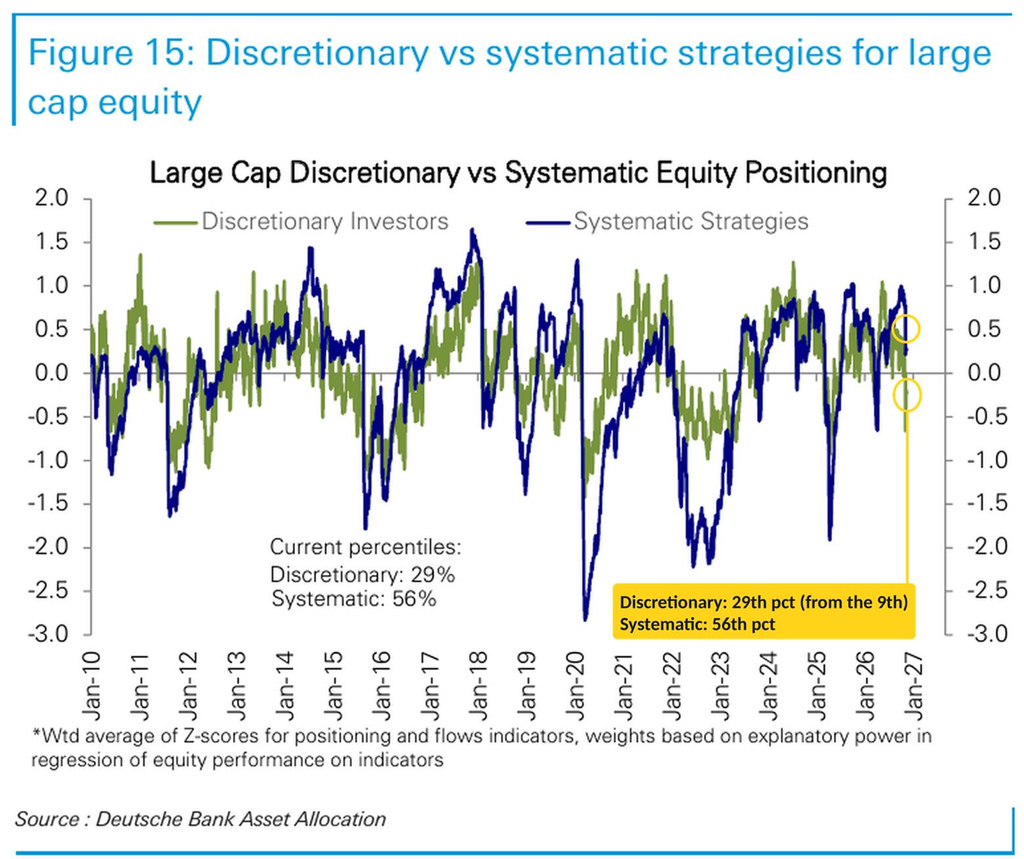
“Systematic strategies (37th percentile) have continued to cut exposure to a 7-month low on weaker trend signals and higher vol. Cuts have been especially large in the Nasdaq 100, small caps and EM equities. Discretionary investor positioning is up off the bottom of its band but still deeply underweight (13th percentile).”
(Discretionary was at the 3rd percentile last week and systematic at the 44th.)
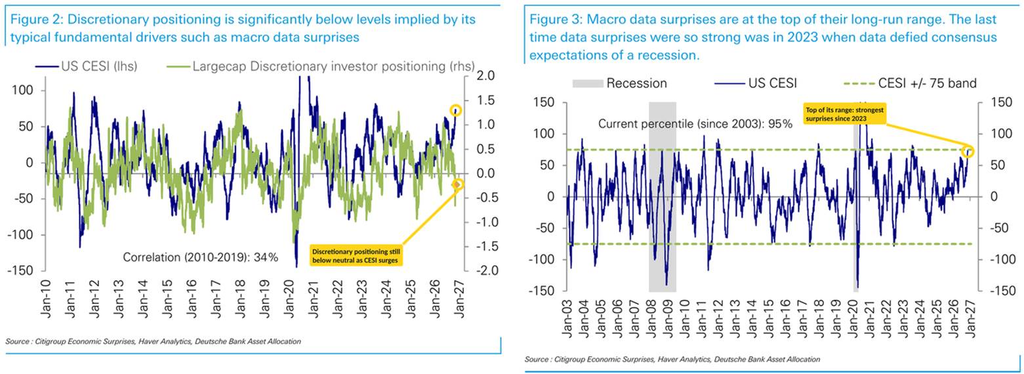
DB says the weakness in discretionary positioning is no longer explained by the usual drivers:
“While a resurgence in rates vol has taken a toll, the weakness in discretionary positioning goes much beyond. It is now significantly disconnected from fundamental drivers that it has historically been correlated with, such as macro data surprises, which have stealthily reached the top of their historical band. The last time macro data surprised this strongly to the upside was 3 years ago in 2023, when it kept defying consensus forecasts for a recession. In contrast, data currently has been beating already robust expectations.”
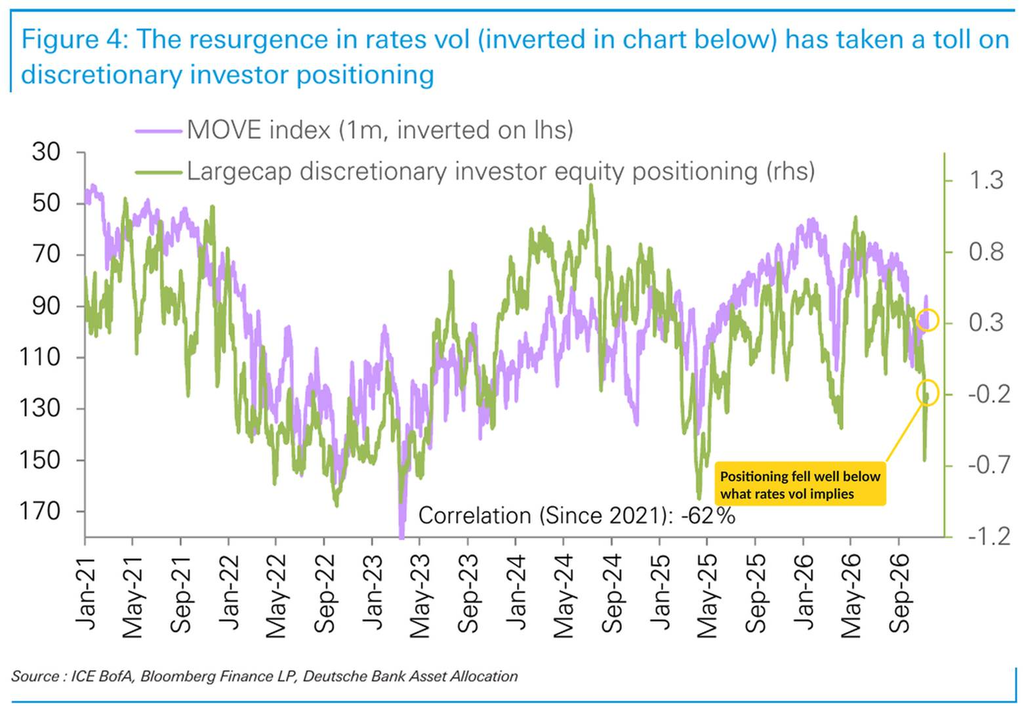
DB also shows discretionary positioning has had a −62% correlation with the MOVE index since 2021, but the latest pullback in positioning is much further than the rise in the MOVE index would imply.
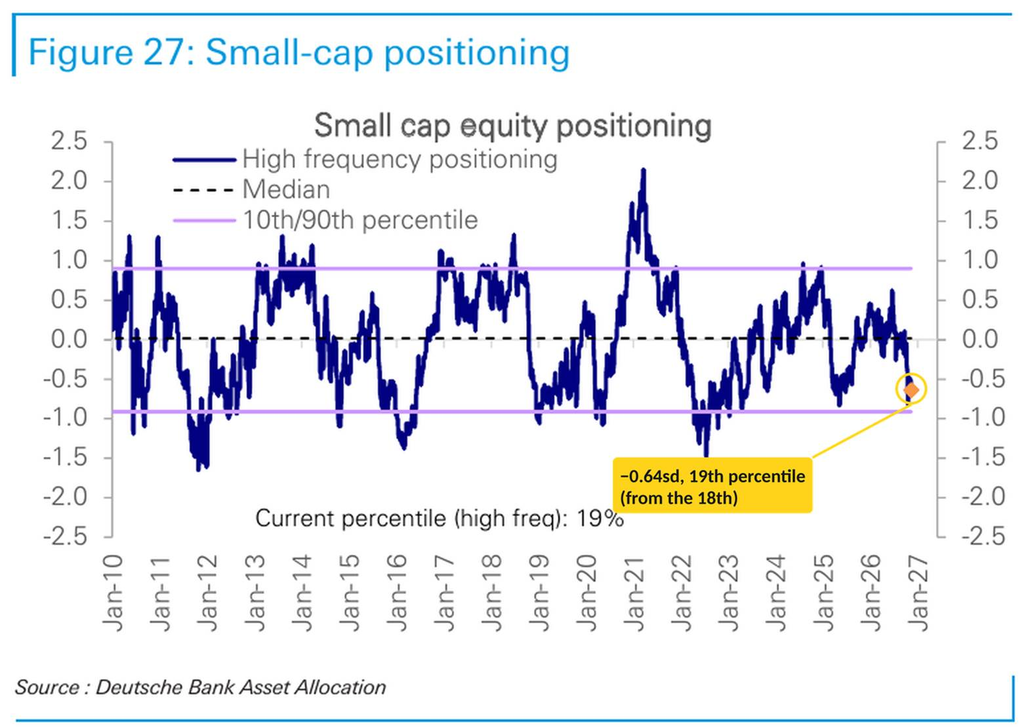
Large-cap positioning rose to slightly below neutral (37th percentile, from the 24th), while small caps slipped further underweight (19th, from the 18th). Within large caps, discretionary investors rose to the 29th percentile (from the 9th) in DB’s chart, with systematic strategies at the 56th.
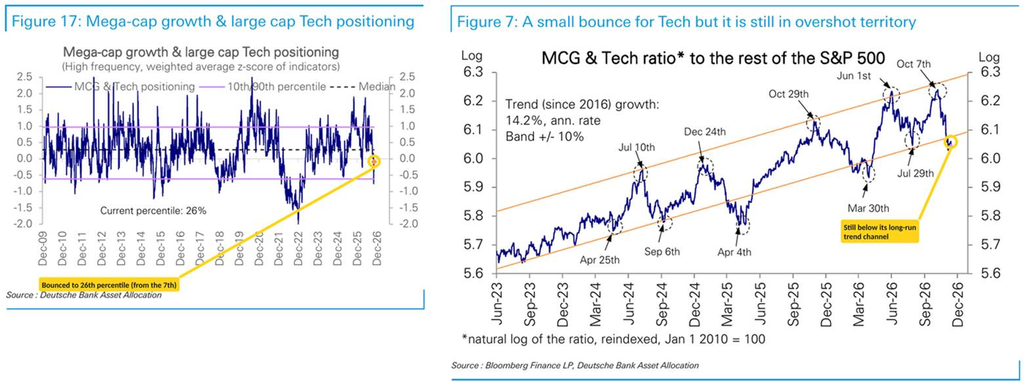
Tech positioning bounced to the 26th percentile (from the 7th), recovering “to modestly underweight from its biggest underweight in 3½ years.” DB says “Tech has bounced modestly but on a relative basis is still in overshot territory, slightly below its long-run trend channel,” and that it remains overweight Tech after upgrading it two weeks ago.
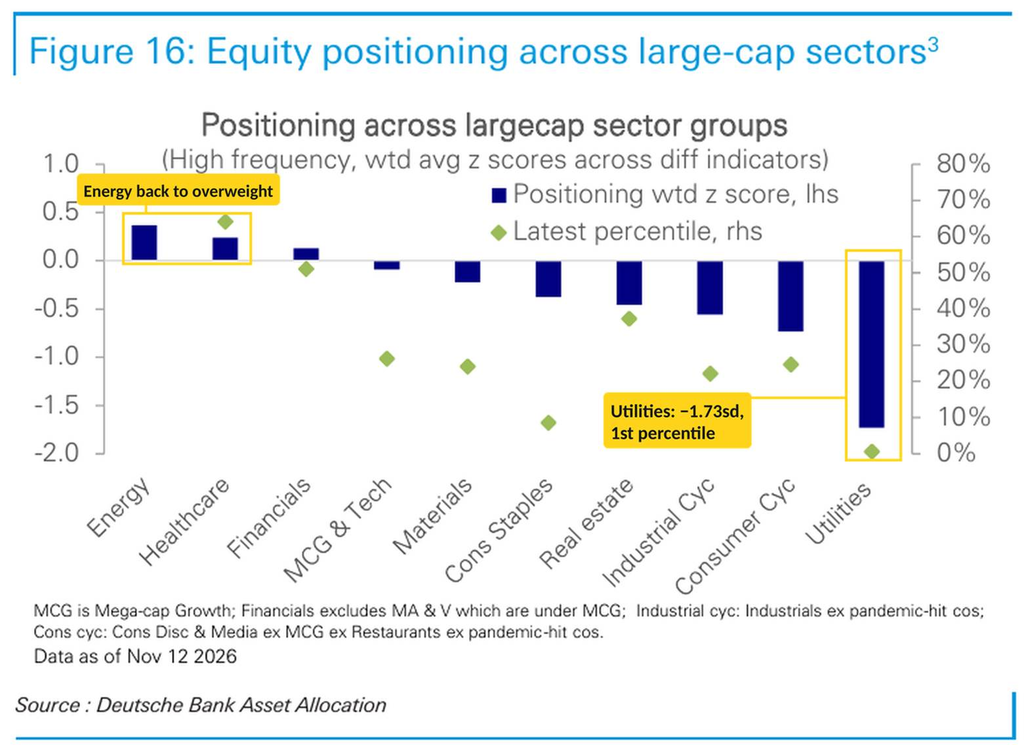
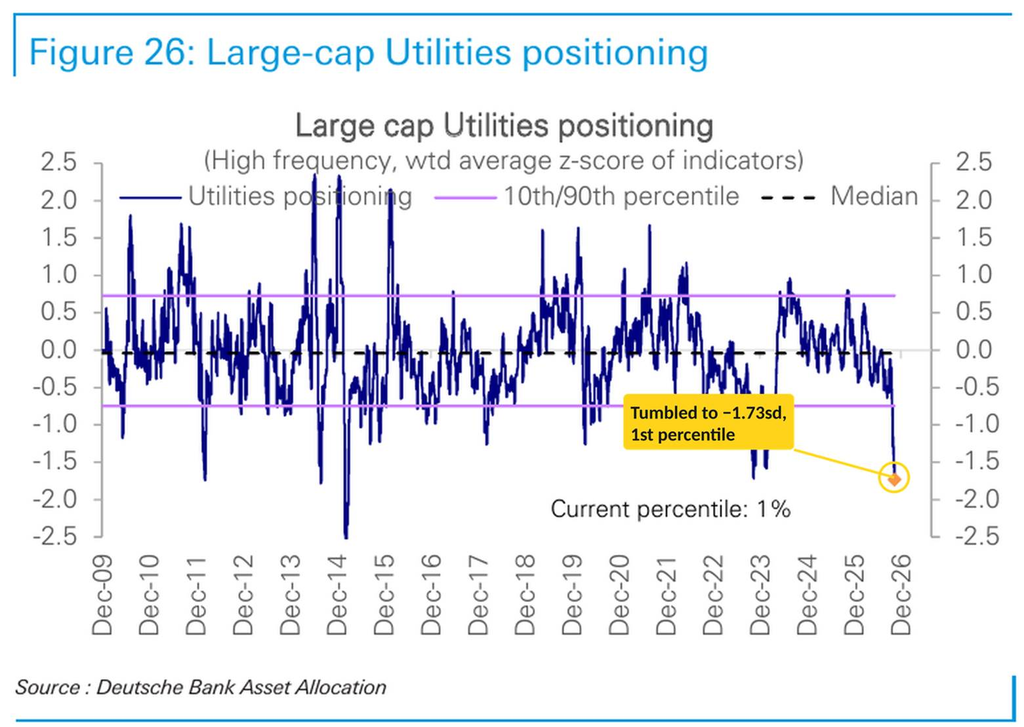
Outside of Tech, Utilities “tumbled to an extreme underweight” (1st percentile, −1.73sd), with Consumer Staples (9th, from the 4th), Industrial Cyclicals (22nd), Materials (24th) and Consumer Cyclicals (25th, from the 4th) also underweight. Energy jumped back to overweight (83rd, from the 72nd) and Healthcare rose to its biggest overweight in nine months (64th, from the 60th), while Financials (51st) rose to slightly overweight and Real Estate (37th, from the 9th) jumped from the bottom of its range.
Fund flows picked up further. Per DB’s read of EPFR data (week through Wednesday, November 11th), equity funds took in ~0.31% of assets ($98.3B), the most in five months, while as noted earlier bond fund inflows slowed to ~0.00% ($0.3B), the least since liberation day, and money market funds saw outflows (~−0.16%, −$17.9B) after the prior week’s ~1.24% ($140.4B) surge.
US equity funds led last week, taking in ~0.37% ($63.6B, the most in two months) from ~0.18%. EM equity inflows slowed to ~0.51% ($14.7B, the least in five weeks) from ~1.55%, still led by Asia ex-Japan (~0.88%, from ~2.88%), with healthy inflows to Taiwan ($5.8B) and Korea ($4.0B) while China slowed sharply ($2.1B). Latin America saw outflows for a third week (~−1.02%), Japan took in ~0.34% ($4.2B), and Europe saw small inflows (~0.02%) after four weeks of outflows. By sector, Tech funds took in ~0.63% ($8.9B), a seventh straight week of inflows, as did Healthcare (~0.28%), while Utilities (~−0.68%, a fourth week), Energy (~−0.62%), Telecom (~−0.60%) and Industrials (~−0.45%) saw outflows.
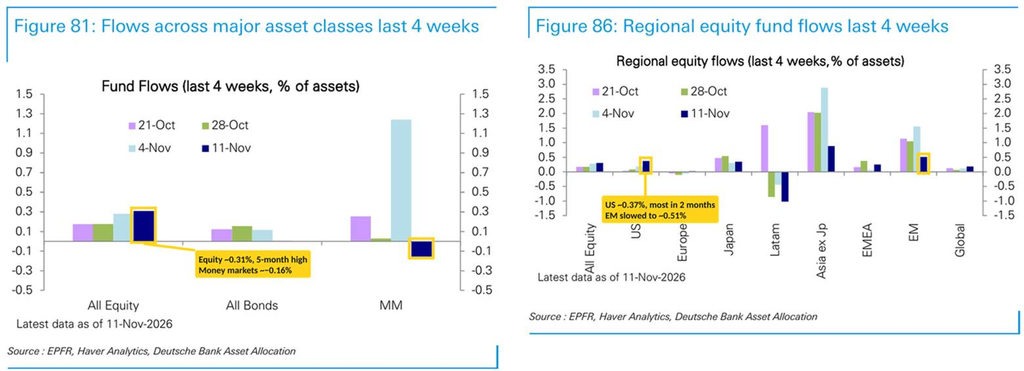
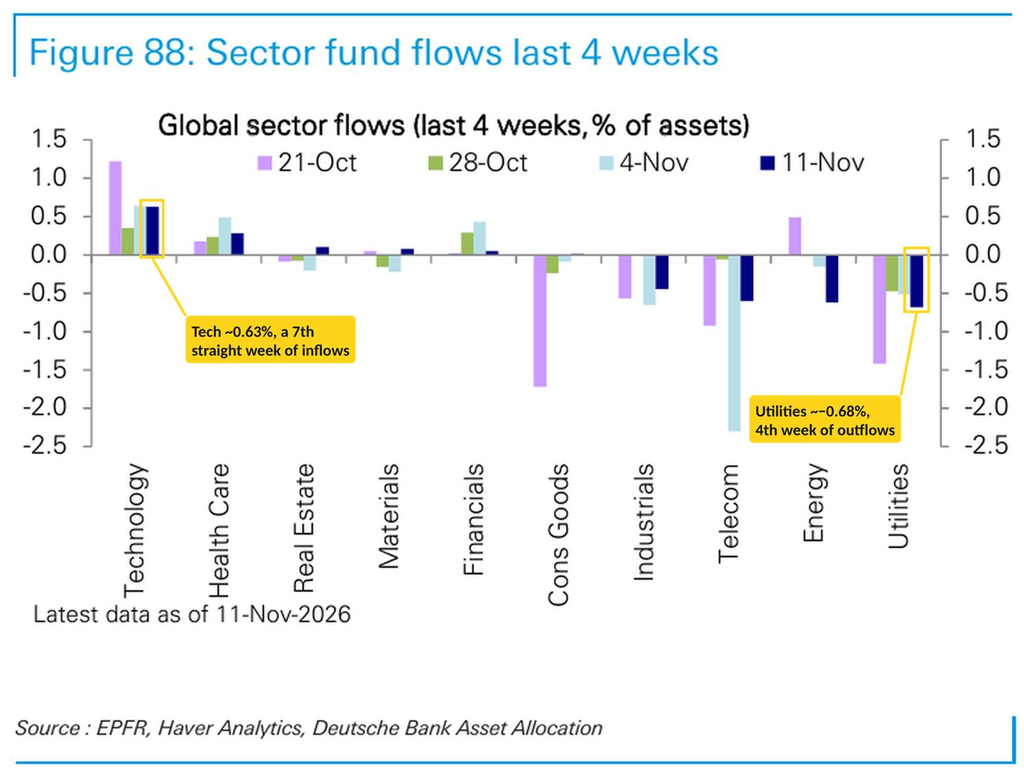
BofA’s Flow Show said $98.3 billion went into global stock funds, with $63.6B into US equities, both the most since June. He notes 2026 is a record year for inflows to global equities ($1.4 trillion annualized), US stocks ($656 billion), investment-grade bonds ($463 billion), tech funds ($222 billion) and Korean stocks ($78 billion). He says the inflows “remain impressively supportive of stock markets but also show while there are lots of investors emotionally bearish right now, very few are ‘physically’ bearish, i.e. short/underweight.”

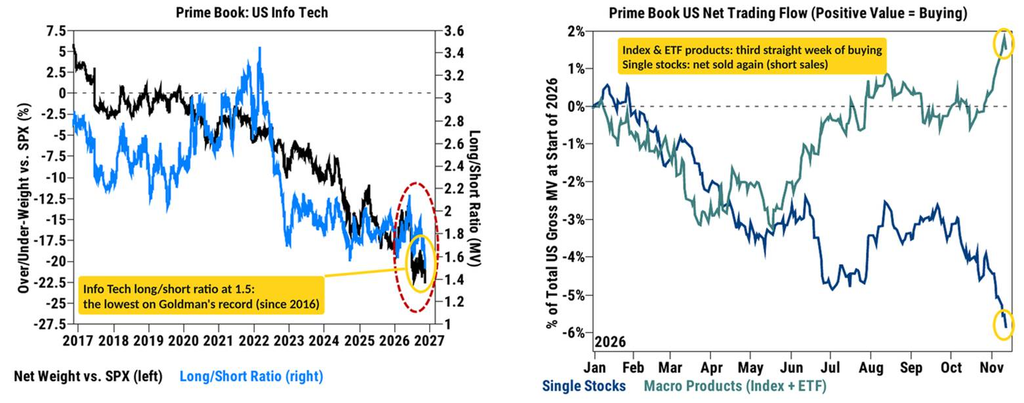
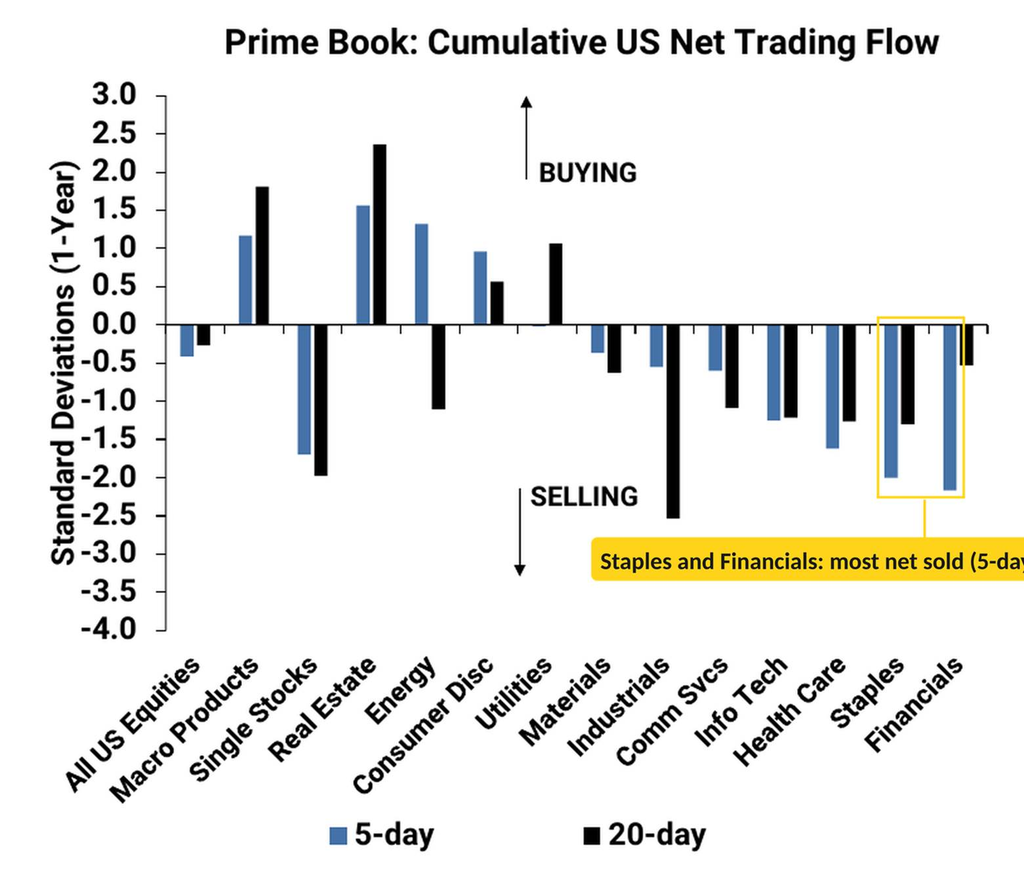
Goldman’s look at hedge funds through Thursday finds they were net sellers for a second straight week (5 of the last 6), with the selling again concentrated in single stocks. Goldman’s Prime Book saw hedge funds net sell US equities (November 6–12, −0.4 SDs vs. the past year), driven by short sales in single stocks (−1.7 SDs), partially offset by a third straight week of buying in index and ETF products (+1.2 SDs, with short covers outpacing long buys 1.3 to 1). US-listed ETF shorts fell 8.6%, the largest percentage covering in seven months, led by large-cap equity, credit and tech ETFs, more than reversing the prior week’s 3.3% increase.
The mix suggests hedge funds are becoming less worried about the macro picture but see more idiosyncratic risk, choosing to short specific stocks rather than the market. They took off index hedges (the biggest ETF short covering in seven months) while adding single-stock shorts, led by Tech. That’s a bet on dispersion rather than direction. With net leverage still at the 4th percentile of the past year and Tech’s long/short ratio at a record low, it leaves plenty of fuel if those names turn. The flip side is that short covering did a good share of the lifting in index products last week, which is less durable than fresh buying.
Info Tech was again by far the most net sold sector, in the US and globally, taking hedge funds’ US Info Tech long/short ratio to 1.5, the lowest on Goldman’s record (since 2016), from a YTD peak of 2.14 in early June. Financials were the most net sold US sector in SD terms (−2.2 SDs), the largest percentage net selling in eight months (99th percentile over five years), though they’re still 12.1% of hedge funds’ US net exposure (98th percentile over one year). Consumer Staples were also heavily sold (−2.0 SDs), almost entirely via short sales (5.6 to 1), consistent with Goldman’s recommendation from last week to short that sector, while Consumer Discretionary was the most net bought.
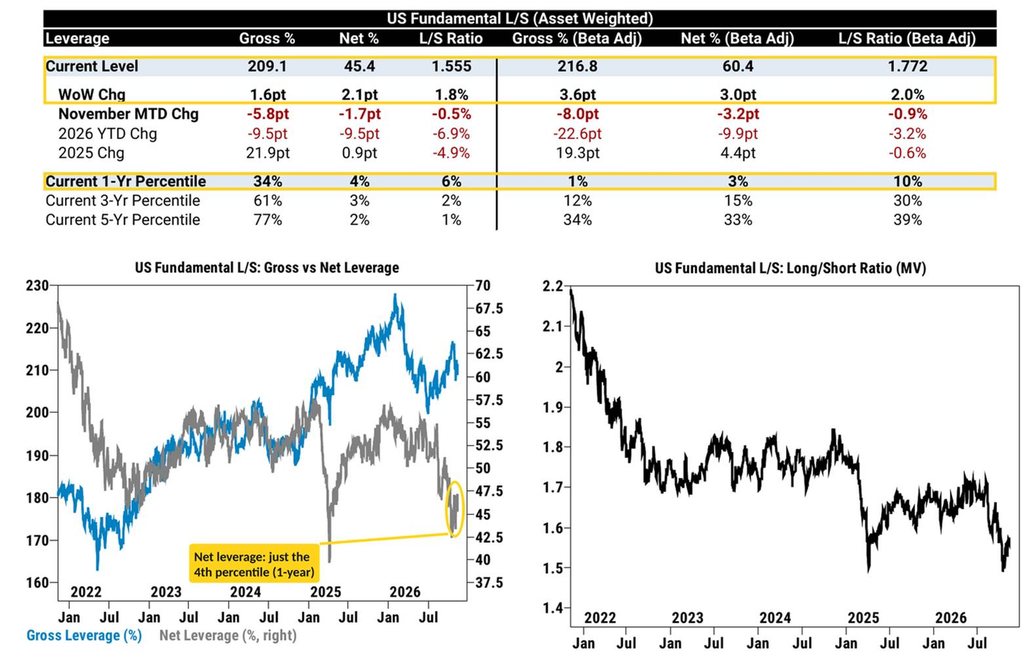
Goldman’s latest update says that through Thursday US Fundamental Long/Short (L/S) Gross leverage rose 1.6 pts to 209.1% (34th percentile one-year), while Net leverage rose 2.1 pts to 45.4%, still just the 4th percentile one-year (2nd over five years).
Beta-adjusted net leverage rose 3.0 pts to 60.4% (3rd percentile one-year, 15th over three years and 33rd over five), and beta-adjusted gross rose 3.6 pts to 216.8% (1st percentile one-year), implying their longs’ average beta edged up to about 1.09 from 1.08.
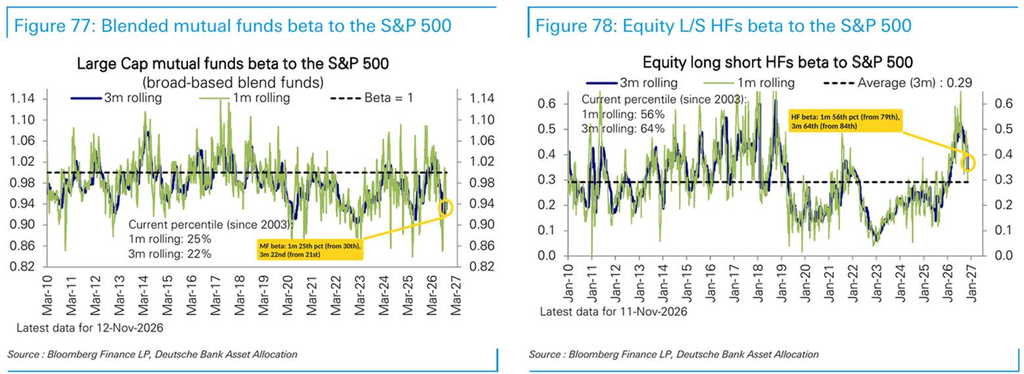
DB’s beta measures though show hedge funds still de-risking: equity long/short hedge funds’ rolling beta to the S&P 500 is at the 56th percentile (since 2003) on a 1-month basis (from the 79th) and the 64th on a 3-month basis (from the 84th), while large-cap mutual funds are at the 25th percentile on a 1-month basis (from the 30th) and the 22nd on a 3-month basis (from the 21st).
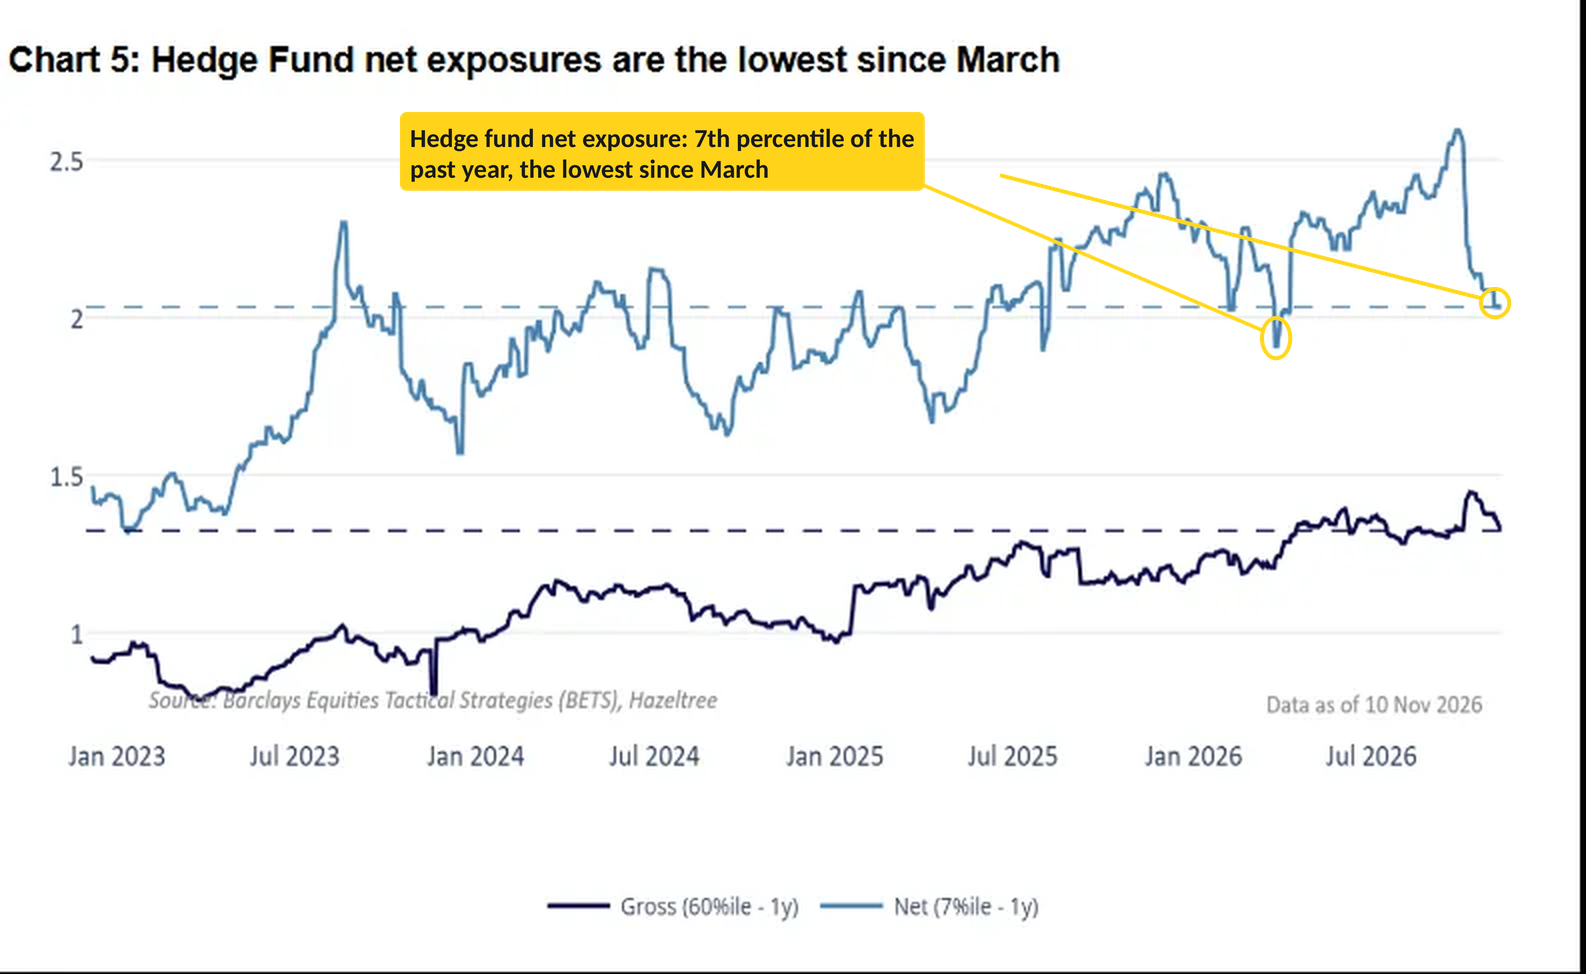
Barclays’ measure tells the same story: hedge fund net exposure is at the 7th percentile of the past year, the lowest since March, while gross exposure is at the 60th.
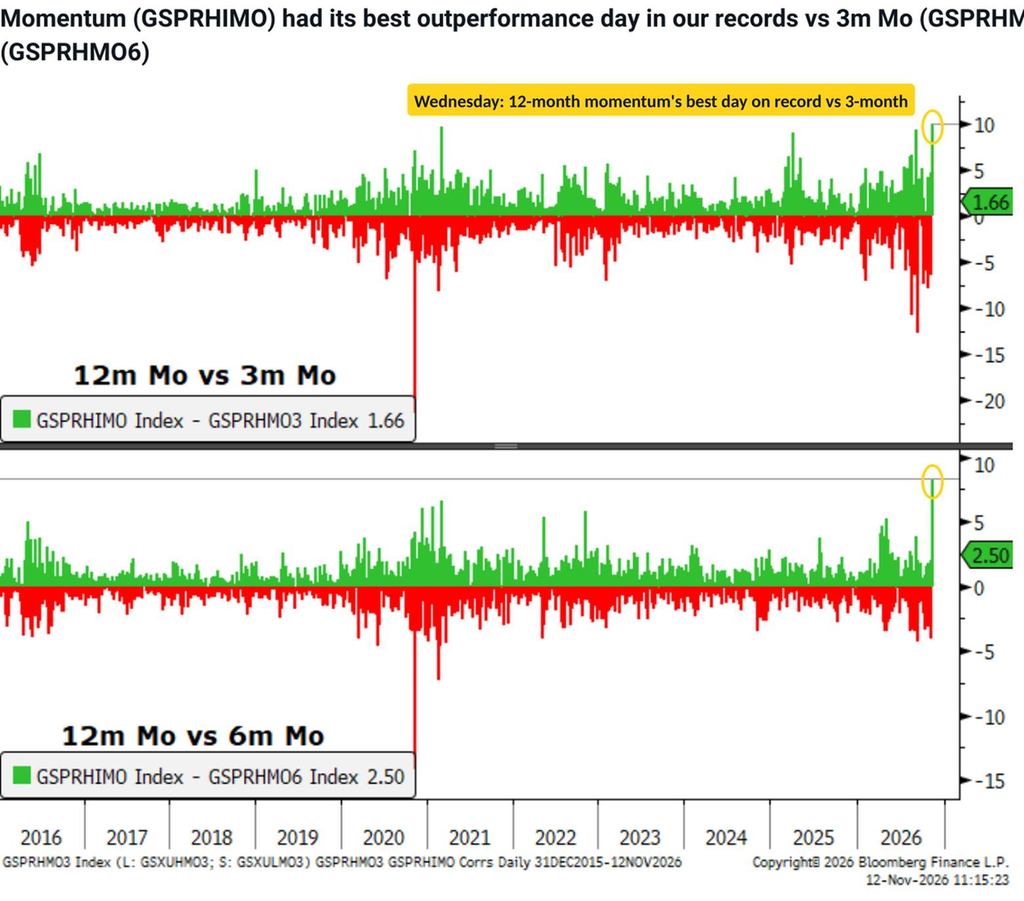
Goldman’s thematic desk says “the momentum regime shift that started this summer is re-emerging as 12m Momentum… had its best outperformance day in our records vs 3m Mo… and 6m Mo” (Wednesday), and the correlation between 3- and 12-month momentum has turned negative “as the AI trade has unwound.”
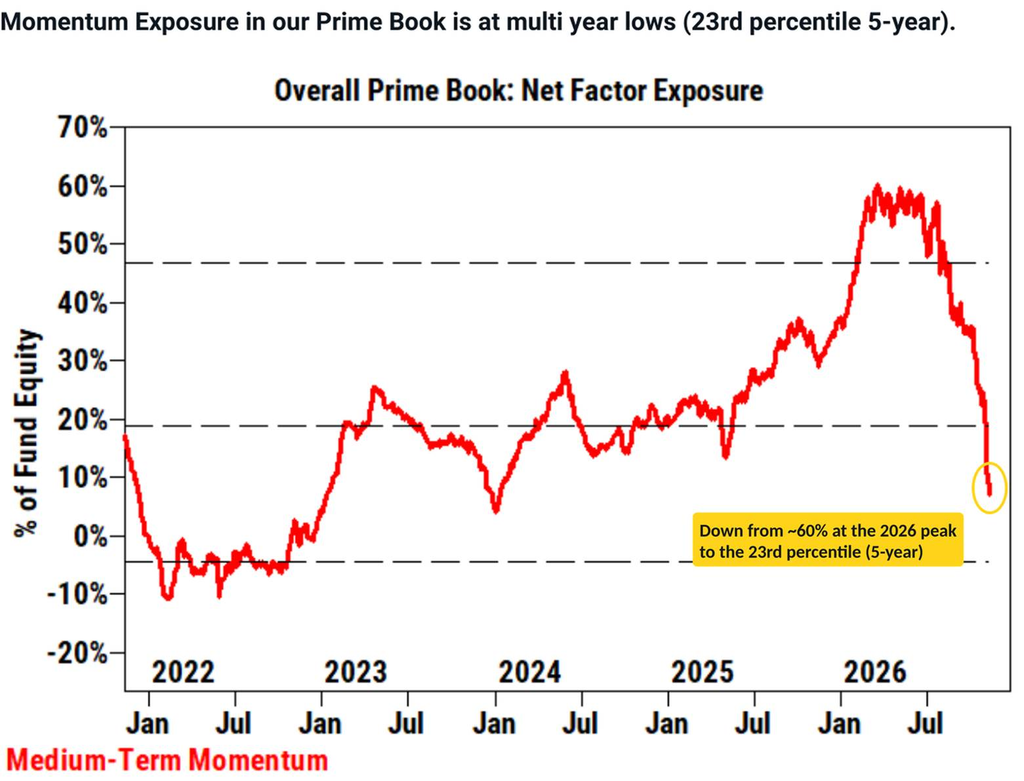
That comes after hedge funds’ momentum exposure collapsed from about 60% at its 2026 peak to the 23rd percentile of its five-year range, and Data Center basket crowding is at the 1st percentile over six months: “the consensus winners are no longer crowded.” Future momentum rebalances point to buying consumer and health care and selling energy and tech, “specifically, a rotation out of semis and into software.” Goldman’s High Beta TMT Momentum basket rose 125% in the first half of 2026 and is down 56% in the second.
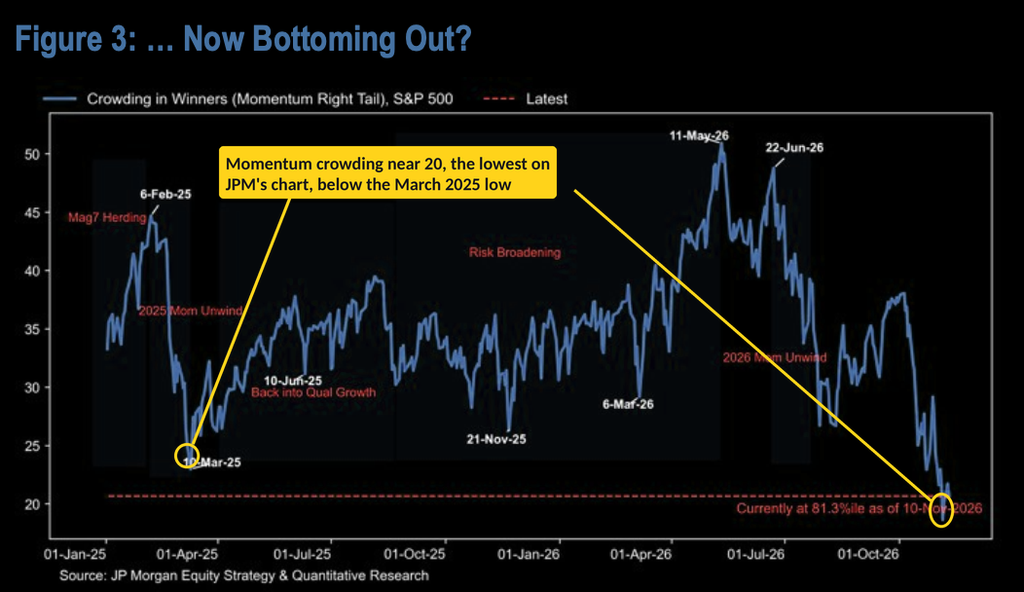
JPM’s numbers are just as stark. It estimates the momentum long/short factor has fallen about 40% from its peak, its largest unwind since the post-GFC recovery, with October’s 11% drop in long momentum vs. the market a roughly six-sigma event. Its measure of crowding in momentum winners has fallen to the lowest on its chart (back to January 2025), below the March 2025 low (JPMorgan via The Market Ear/ZeroHedge).
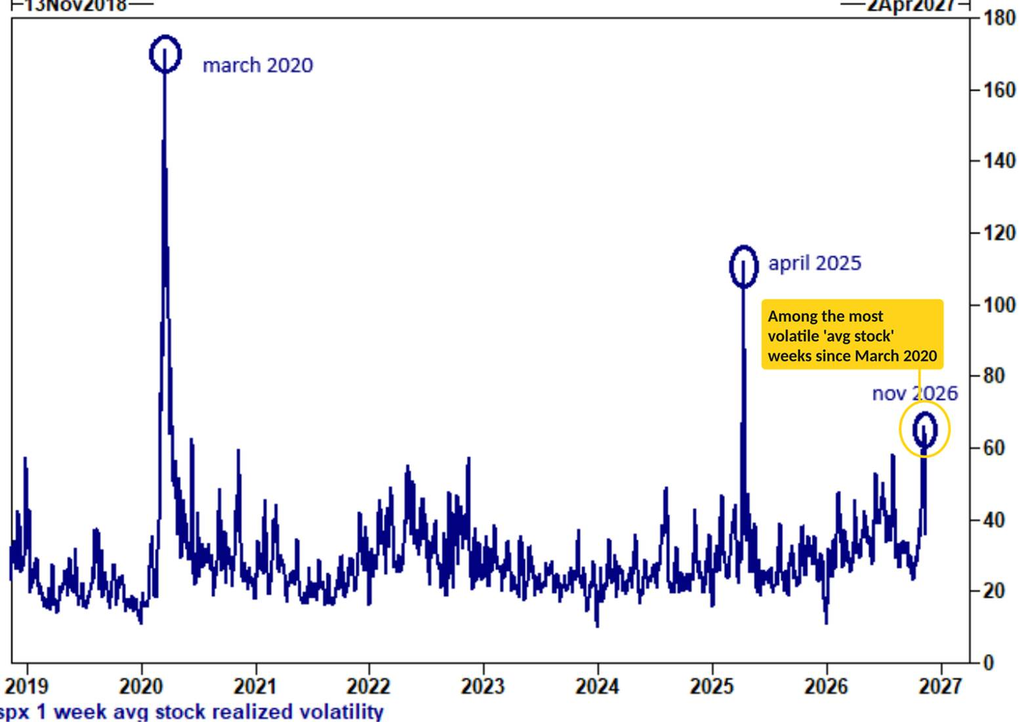
Goldman’s derivatives desk says “investor positioning is light… the vol complex is jittery (Panic Index at 6.5/10)” (down from 9.57 last week), and “options volumes have ballooned (recall Thursday Nov 5th was the largest put volume session ever).” With so much volatility in the largest weights (Nvidia especially), “the last week has been one of the most volatile ‘avg stock’ periods since march 2020” (its chart shows April 2025 was higher).
They say hedge funds still aren’t chasing upside, though, at least via options: SPX call skew didn’t rise with the week’s rally. But what they have been betting on is lower volatility. Goldman says hedge funds showed “more confidence in ‘vol lower’ than … in ‘spot higher,'” and VIX puts have traded more volume over the last 10 sessions than at any point in 2026. Index skew is bid, with the 3-month 10% out-of-the-money S&P put now fully funding a 5.5% out-of-the-money call (6.7% this summer).
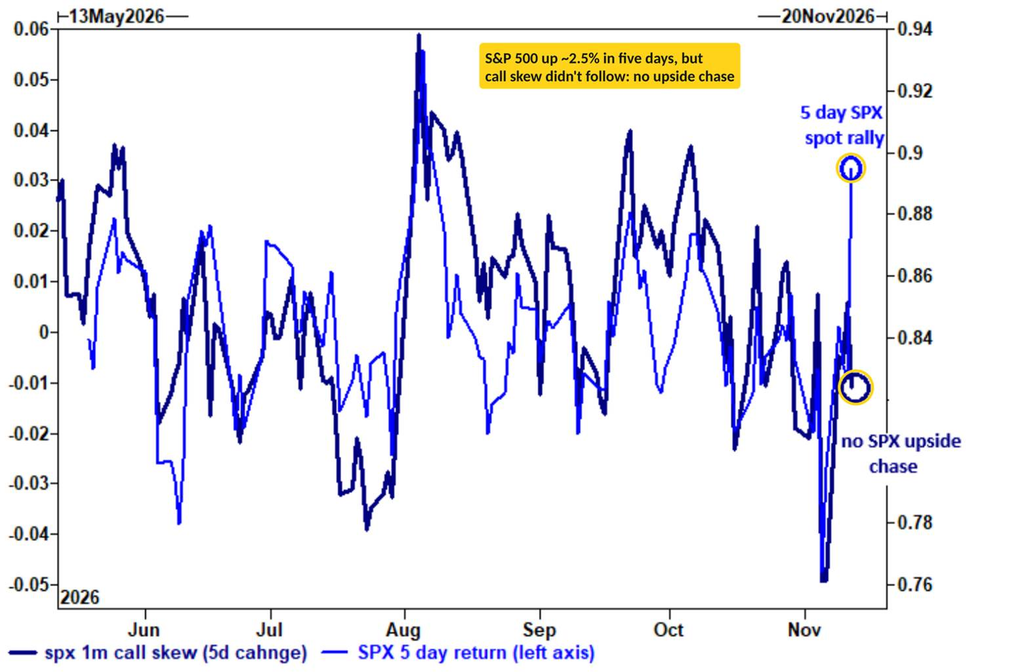
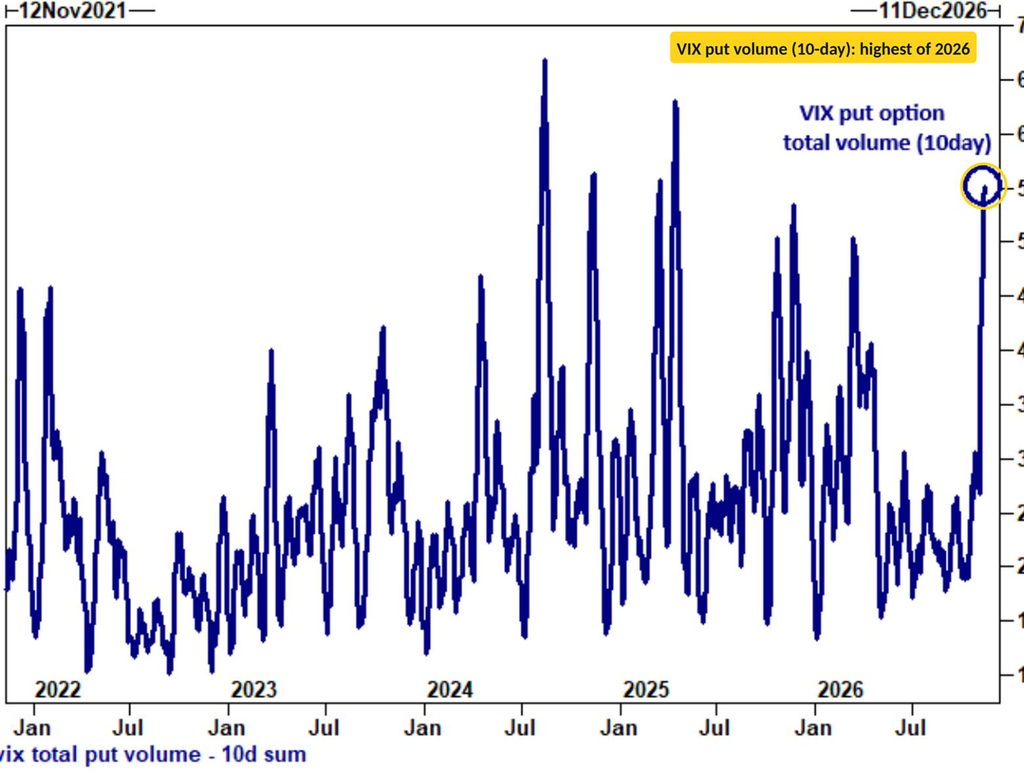
For perspective, a week ago options priced a 2.48% move for the S&P 500 through Friday; it rose 2.5% on the week. The straddle through this Friday’s close, covering Nvidia’s earnings, is priced at a 1.93% move (per Goldman).
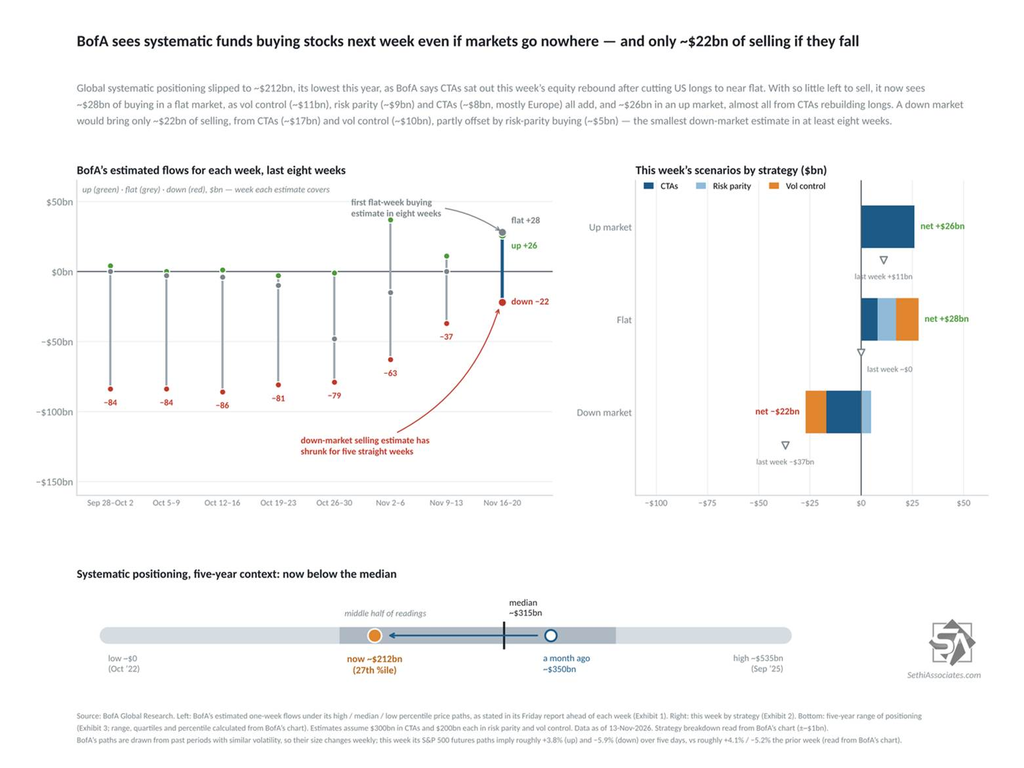
Turning to the systematic community, BofA estimates global systematic positioning slipped to ~$212B, its lowest this year, from ~$225B last week and ~$350B a month ago. It again lists no sell trigger for the S&P 500, as CTAs entered last week close to flat after de-risking and then sat out the equity rebound. It sees a buy trigger for the Nasdaq-100 at +2.7% (none listed last week), while the Russell 2000 shows no trigger either way (last week’s buy trigger was +5.4%).
Positively, BofA sees systematic funds buying stocks this week as its base case:
- +$28B of buying in a flat market (from roughly $0 last week), as vol control (~$11B), risk parity (~$9B) and CTAs (~$8B, mostly Europe) all add.
- +$26B of buying in an “up” market (BofA’s high-percentile path, roughly +3.8% for S&P 500 futures over five days; from +$11B last week), almost all from CTAs rebuilding longs.
- −$22B of selling in a “down” market (BofA’s low-percentile path, roughly −5.9% for S&P futures; from −$37B last week), from CTAs (~$17B) and vol control (~$10B), partly offset by risk-parity buying (~$5B). That’s the smallest down-market estimate in at least eight weeks.
At DB, global CTA equity positioning fell to the 42nd percentile (from the 47th), the lowest in seven months. The S&P 500 is at the 48th (from the 53rd), the Nasdaq-100 at the 14th (from the 24th), having flipped to net short for the first time in seven months, and the Russell 2000 at the 22nd (unchanged, with shorts increasing).
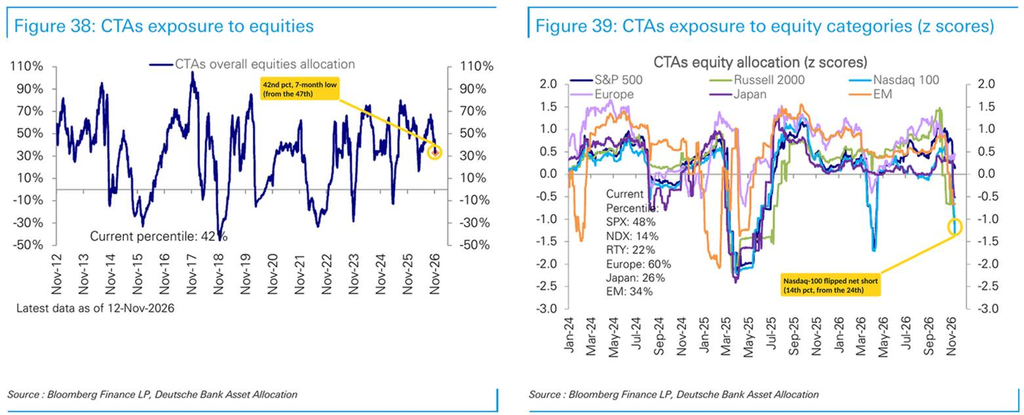
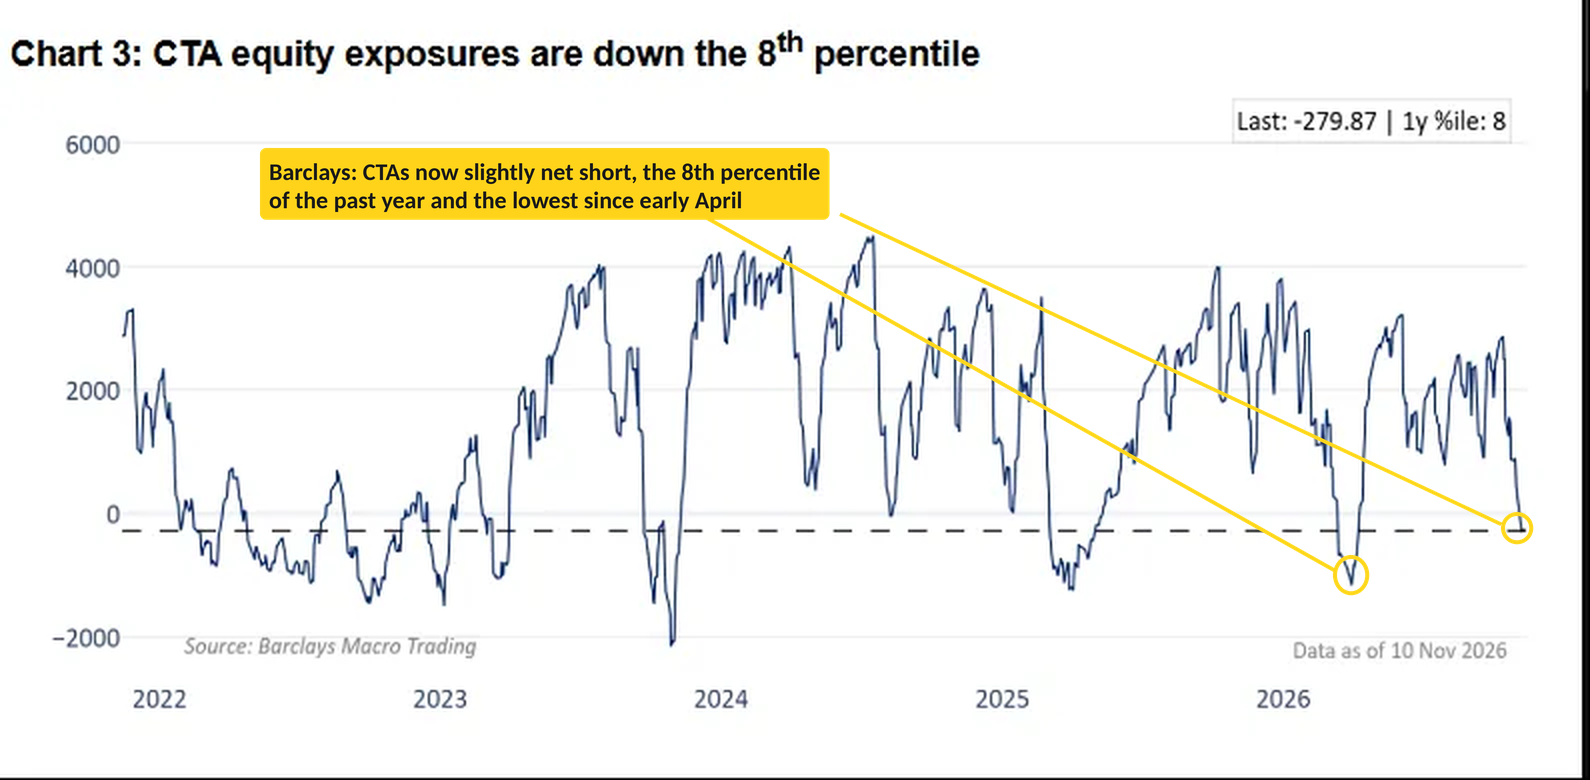
Barclays’ read is even lower. Its trading desk says CTAs have cut equity exposure to the 8th percentile of the past year (slightly net short in its chart, the lowest since early April), while vol-control funds are at the 1st percentile after the VIX hit 28 the prior week.
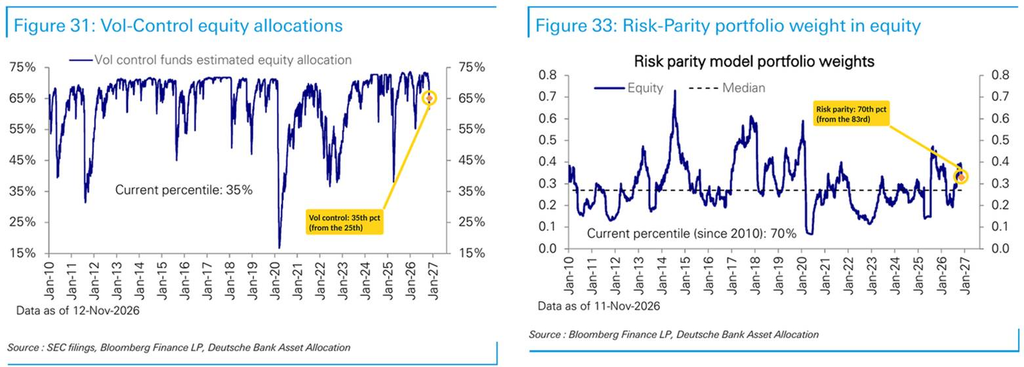
With volatility more subdued last week, DB estimates vol control* rebounded to the 35th percentile (from the 25th), though it “remains well below its recent highs,” while risk parity** equity allocations fell to the 70th (from the 83rd).
*Vol control strategies enter and exit based on changes in volatility over past windows (mostly 1-month and 3-month).
**Risk parity funds balance risk across asset classes based on relative volatility, often using leverage, to reach a target portfolio risk level.
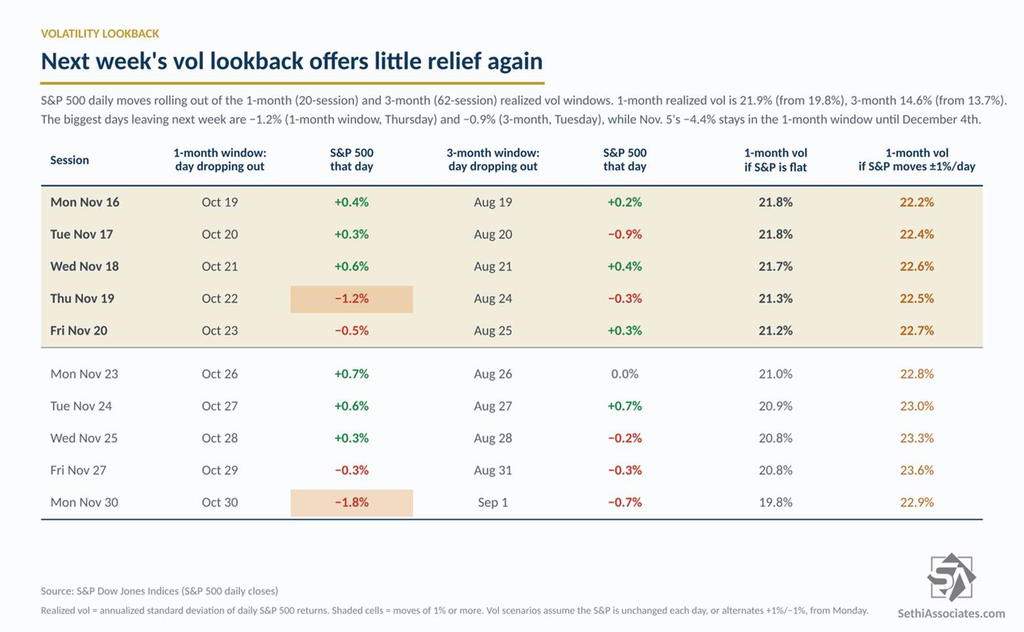
While the dialing back of volatility has seen some mechanical releveraging from vol control, 1-month realized volatility rose further last week to 21.9% (from 19.8%), after touching 22.2% Wednesday and Thursday, the highest since May 2025. 3-month rose to 14.6% (from 13.7%), the highest since late June. Monday’s 2.3% jump replaced a much smaller day in the window. That will be a headwind to further releveraging.
The lookback doesn’t help much this week either. The biggest day dropping out of the 1-month window is −1.2% (Thursday), and out of the 3-month window −0.9% (Tuesday), per Tier1Alpha. Even if the S&P were flat for the next two weeks, 1-month realized vol would only ease to about 19.8% by November 30th, and the November 5th −4.4% drop doesn’t roll out of the 1-month window until December 4th (ironically jobs report day). If the S&P instead alternates ±1% a day, 1-month vol rises to ~22.7% by Friday.
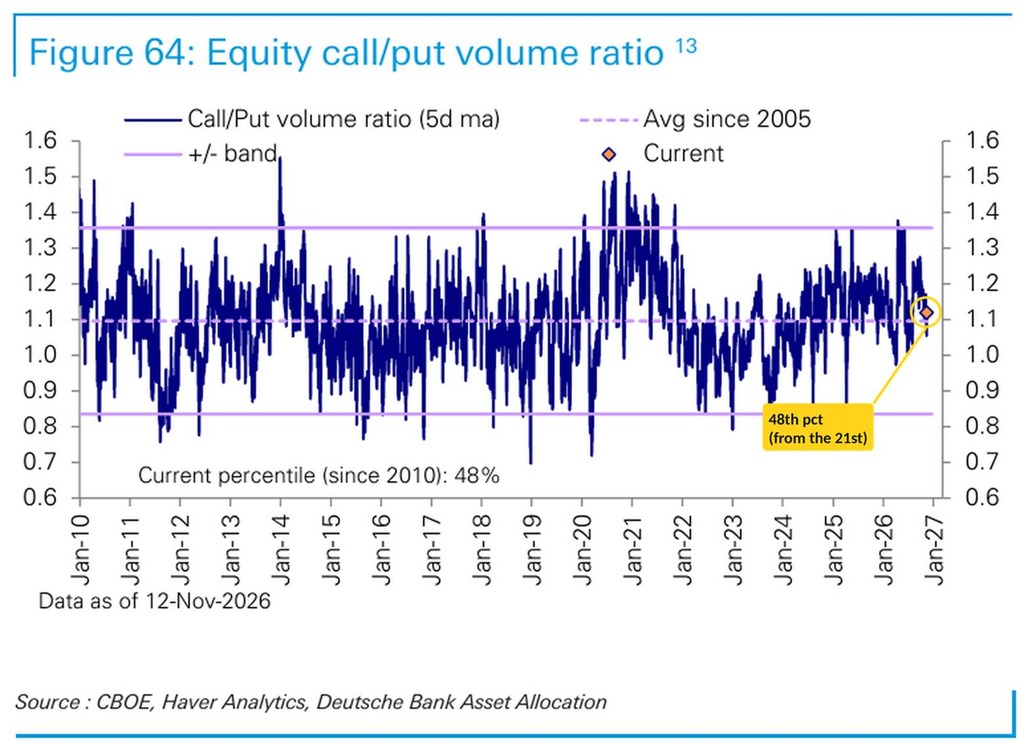
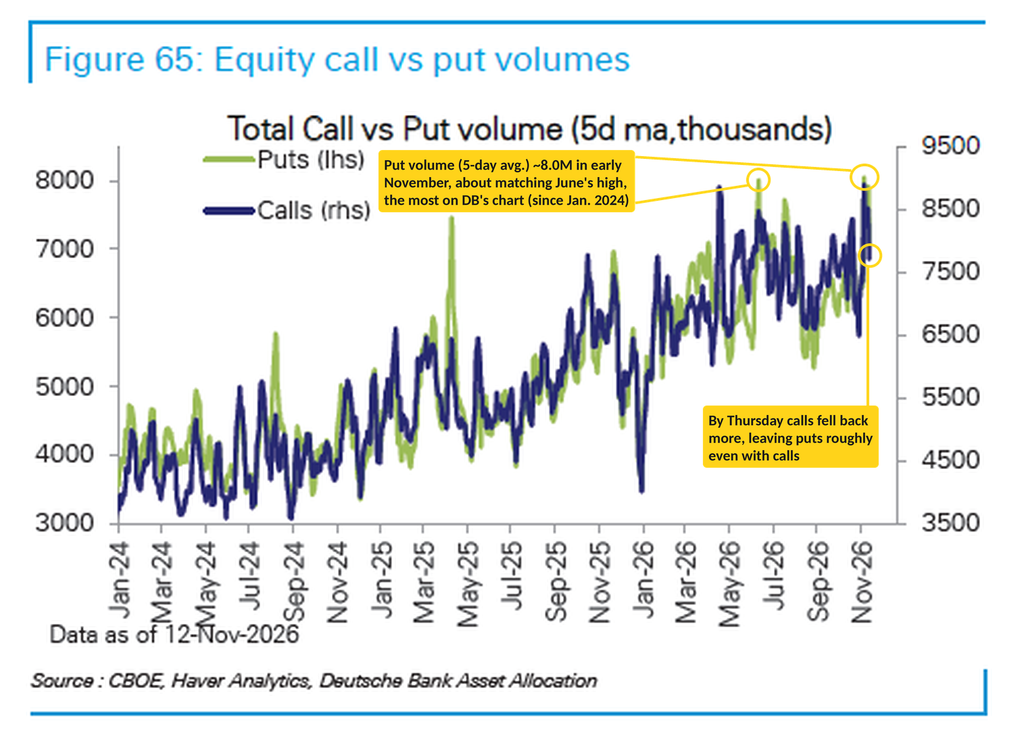
Similarly, DB’s call/put 5-day moving average rebounded to the 48th percentile (from the 21st), although net call volume “declined sharply in index options and modestly in single-stock options, while it rose modestly in ETF options.” DB’s chart shows put volume did climb: its 5-day average rose to about 8 million contracts in early November, about matching its June high as the most on the chart (back to January 2024). Both eased into Thursday, leaving put volume roughly even with call volume.
The CBOE equity put/call ratio’s 10-DMA rose further to 0.65 (from 0.62), the highest since early August but still below July’s ~0.68 peak, so traders are hedging more, though not aggressively by this measure.
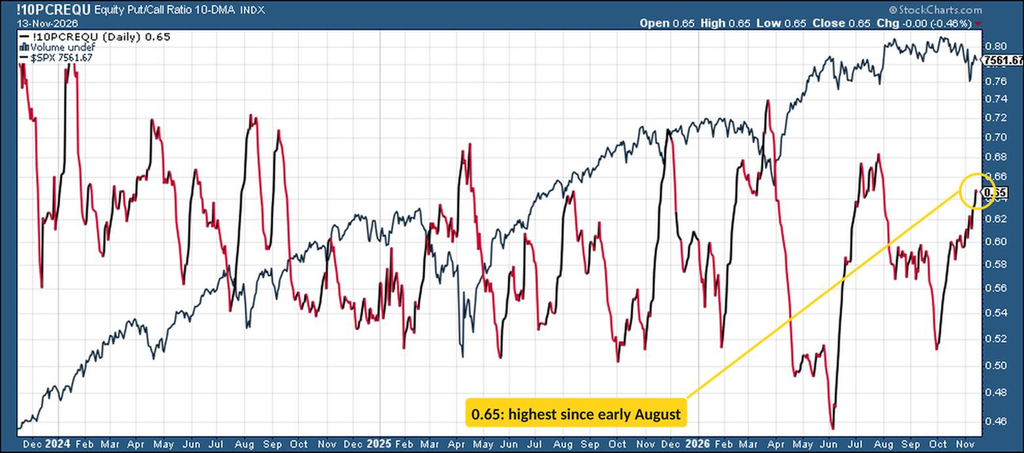
Historically, the current level has been a mild positive when stocks are near their highs. Since 2007, when the 10-DMA hit a three-month high with the S&P 500 within 5% of its 52-week high (34 times, most recently Tuesday), the S&P was higher three months later 76% of the time (vs. 72% for all days) and six months later 78% of the time (vs. 74%), with a median six-month gain of 8.0% (vs. 6.5%). As a percentile of its past year (now the 83rd), though, the ratio hasn’t told you much.

Turning to leveraged ETFs, which act as “negative gamma” per Charlie McElligott (funds have to buy or sell in the direction of market moves each day), I noted last week that the big drop in their assets had left their exposure below where it started the year, which meant less of a volatility kick from these funds.
That didn’t last long. Retail bought the dip with Nomura saying creations hit the 100th percentile after the crash. McElligott put the complex at $151.5B midweek, up from $142B a day earlier, and it now has to trade $7.6B for every 1% move, up from $6.5B. That sensitivity jumped 17% while assets rose 7%, which suggests the new money went into the most levered and most volatile products.
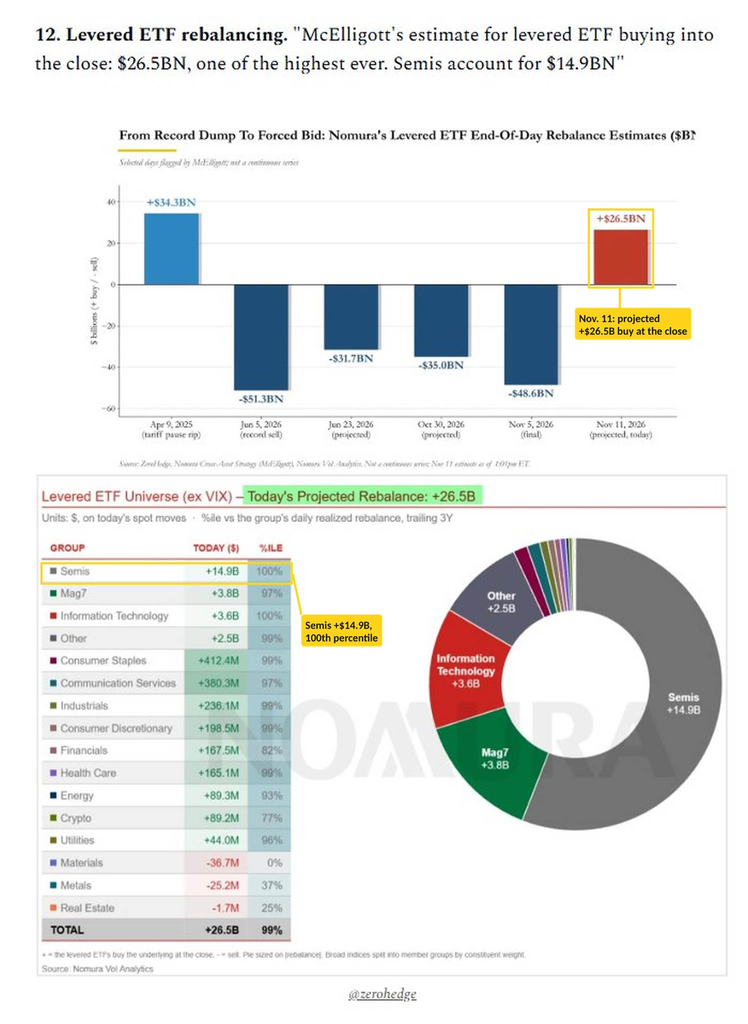
Nomura’s estimate of the levered-ETF buying into Wednesday’s close was +$26.5B, one of the largest ever. Semis, at $14.9B, were 56% of it, followed by the Magnificent 7 at $3.8B and Tech at $3.6B, with Semis and Tech both at the 100th percentile against three years of history and the total at the 99th. At $7.6B per 1%, a 4% down day like November 5th would mean roughly $30B of selling into the close.
JPM similarly sees retail back buying the dip, with equity ETF purchases running at $20B a day the prior week and accelerating to $30B Monday. Leveraged equity ETFs took in nearly $5B over November 5th–6th, roughly $15B of leveraged exposure, while inverse ETFs saw about $5B of outflows. That said, similar to hedge funds as noted earlier, “the options crowd has yet to fully re-engage,” with retail’s share of options trading “close to its one-year low,” which JPM says “leaves another potential source of upside demand” (JPMorgan via The Market Ear/ZeroHedge).
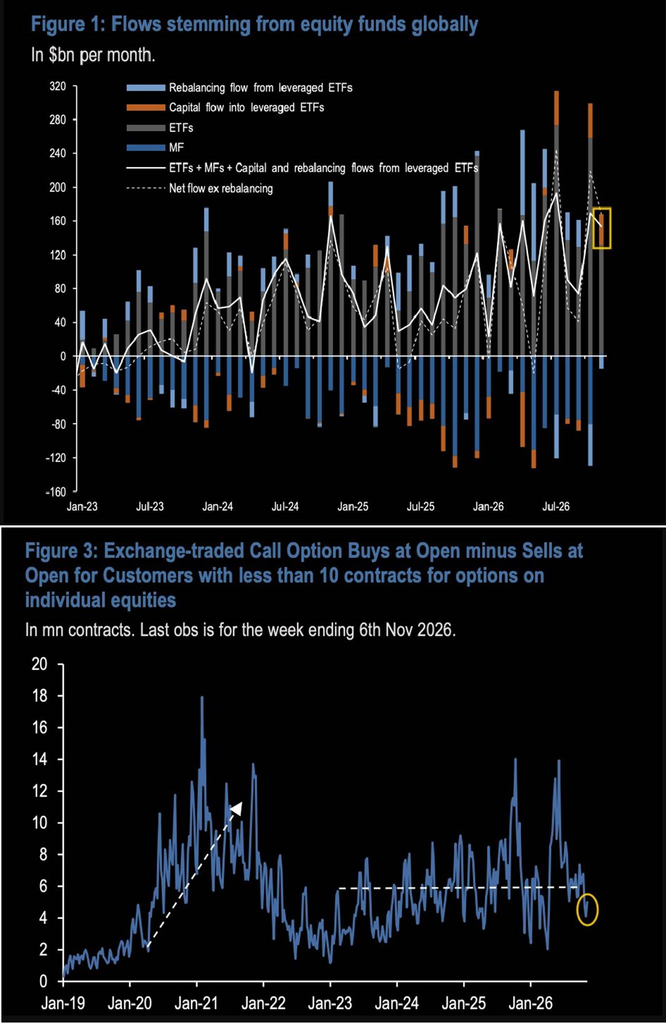
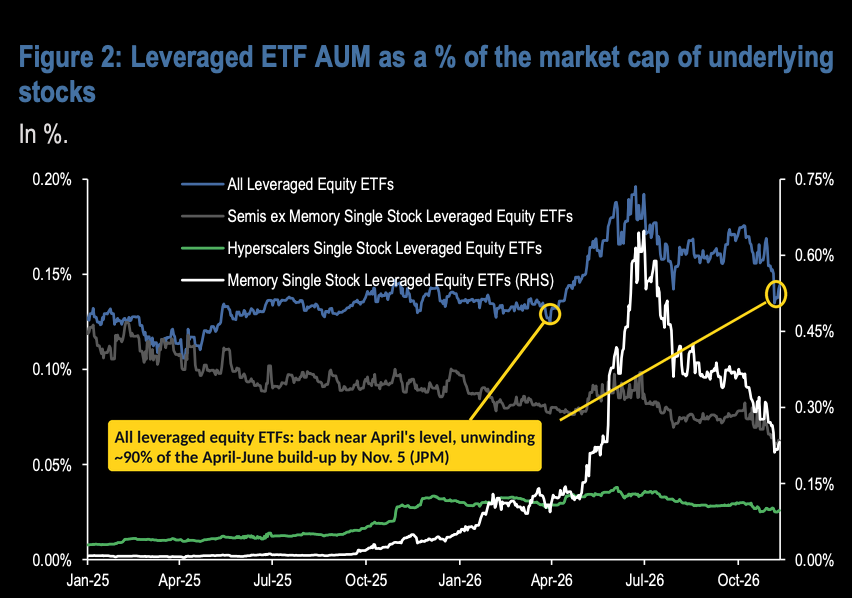
The leverage washout has been extraordinary, too. JPM estimates that by November 5th, leveraged equity ETF exposure relative to the underlying market cap had unwound nearly 90% of the increase built from April to June, so the rebound in leveraged buying is coming from a much lower base.
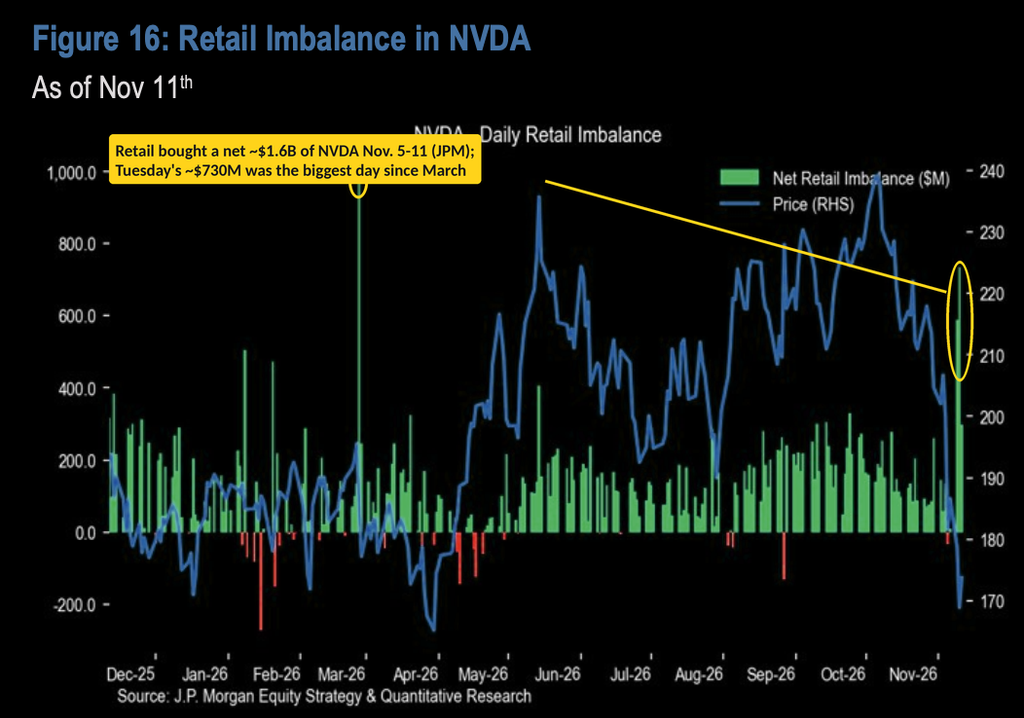
And retail is still buying the generals. JPM estimates a net $1.6B of Nvidia buying over November 5th–11th, the week’s most-bought stock, with buying intensity at 3.7 standard deviations Monday and 4.7 Tuesday.
Vanda Research (via the WSJ) meanwhile clocked a record $111M of retail buying in Nvidia in Thursday’s first 30 minutes, the stock’s largest opening half-hour, after $42.5M went into six 2x leveraged long Nvidia ETFs Monday through Wednesday. The only comparable wave of leveraged long demand came in January 2025 after DeepSeek, while inverse Nvidia funds saw no net buying.
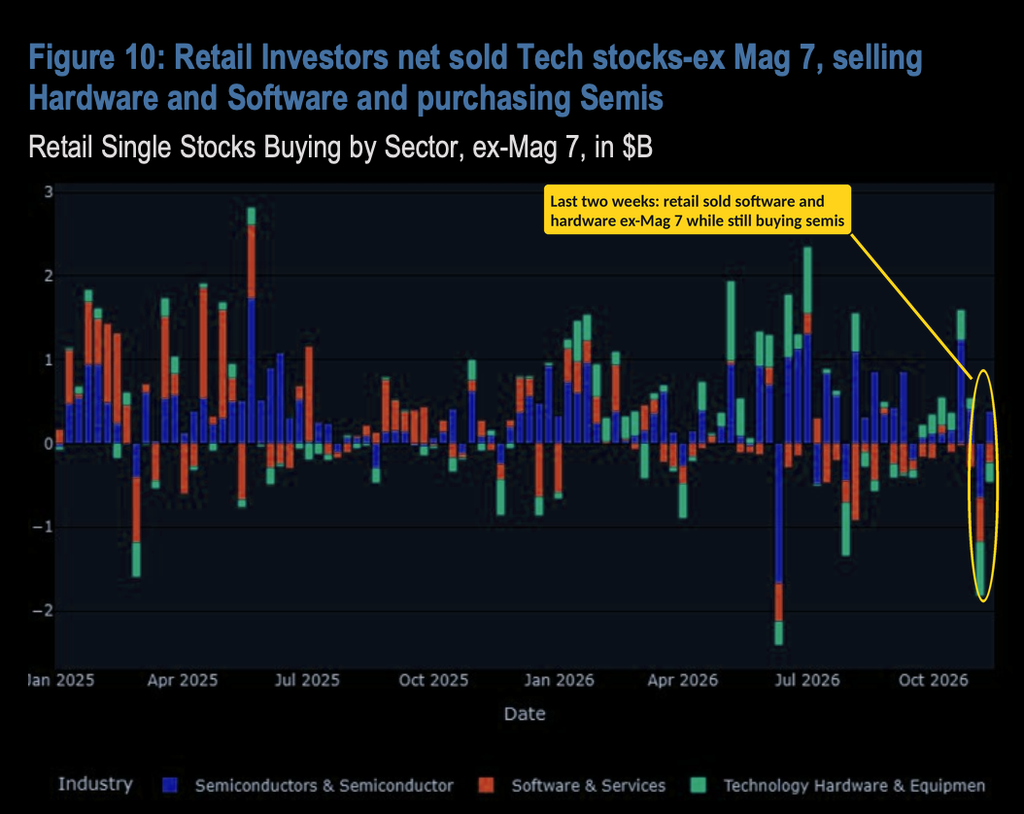
But the bid is narrow. JPM says retail bought the Mag 7 at a 1.1-standard-deviation pace over the past week while selling tech stocks outside the group at the same pace, buying semis but selling hardware and software.
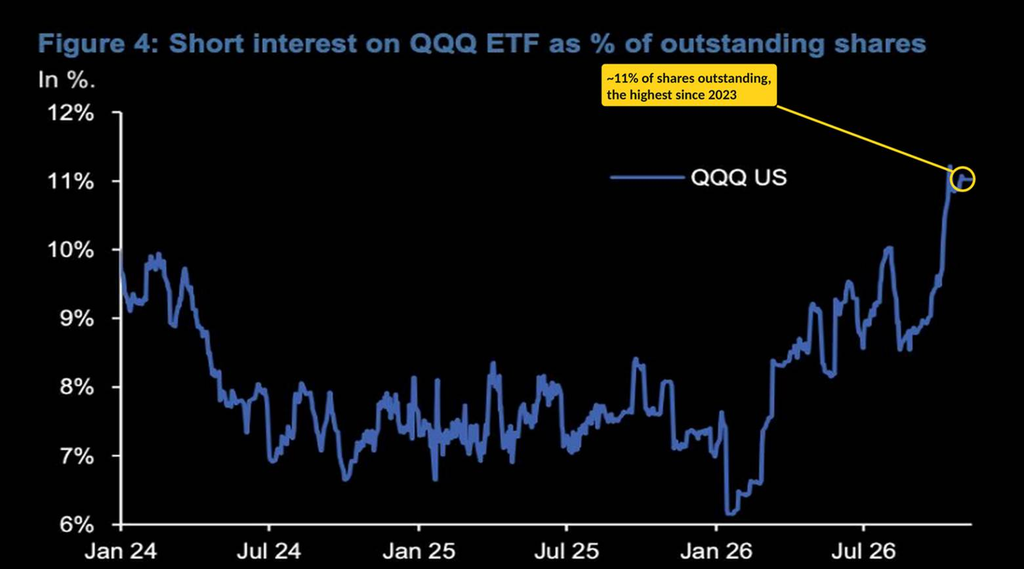
And they’re also offsetting some of that buying with index shorts. JPM notes QQQ short interest has climbed to about 11% of shares outstanding, the highest since 2023, while Nasdaq futures positioning has been heavily reduced. “That leaves a potentially powerful source of incremental demand if the market stabilizes,” though “not all QQQ shorts are directional bets. Some represent hedges against existing long exposure, limiting the potential squeeze fuel.”
JPM’s proxy for Nasdaq futures positioning is back to about 17,000 contracts from nearly 100,000 in June, after briefly dipping below zero in early November for the first time since April.
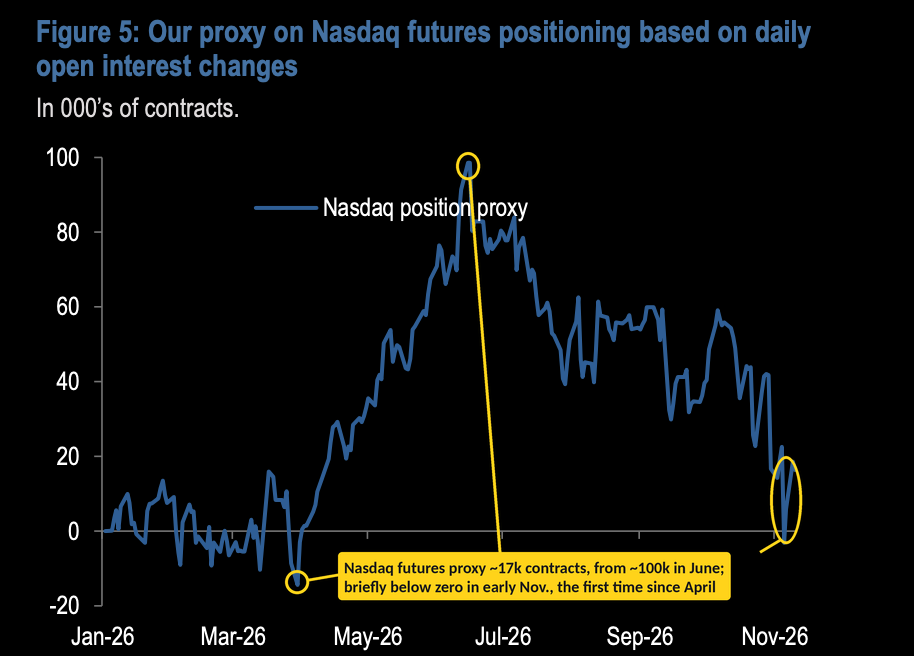
Putting it together, JPM argues hedge funds have already done most of their de-risking, and continued retail support through November could let them start rebuilding positions from late November, a second wave of demand into year-end that would take the market “from forced selling to forced buying.” The risk is that retail runs out of ammunition before institutions return.
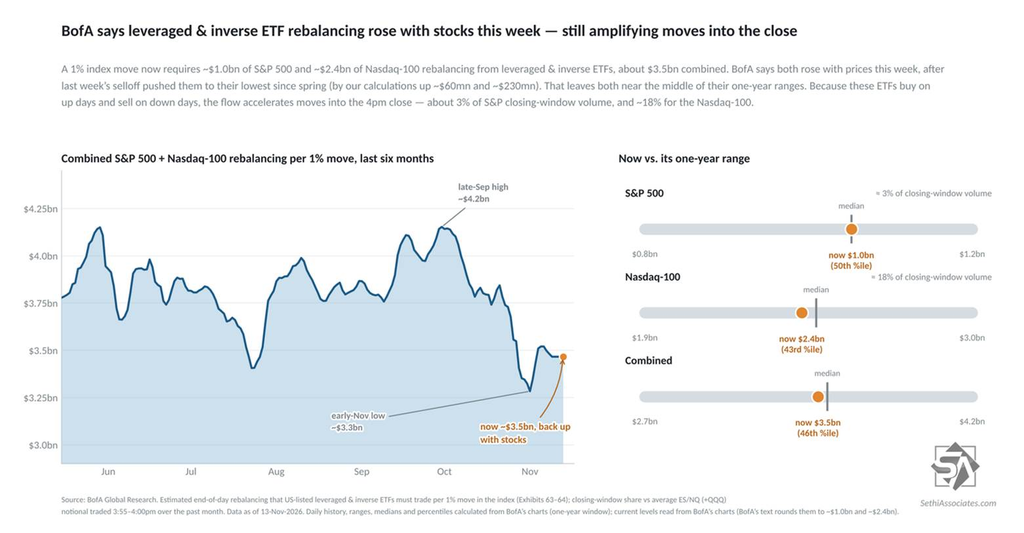
BofA’s narrower, index-only measure of S&P 500 and Nasdaq-100 leveraged ETF AUM tells a similar story. Leveraged and inverse ETFs now need to trade ~$1.0B of S&P 500 and ~$2.4B of Nasdaq-100 per 1% move, about $3.4B combined. Both rose with prices last week (by our calculations up ~$60M and ~$230M) after the prior week’s selloff pushed them to their lowest since spring. Because these ETFs buy on up days and sell on down days, the flow accelerates moves into the 4pm close, equal to about 3% of S&P closing-window volume and ~18% for the Nasdaq-100.
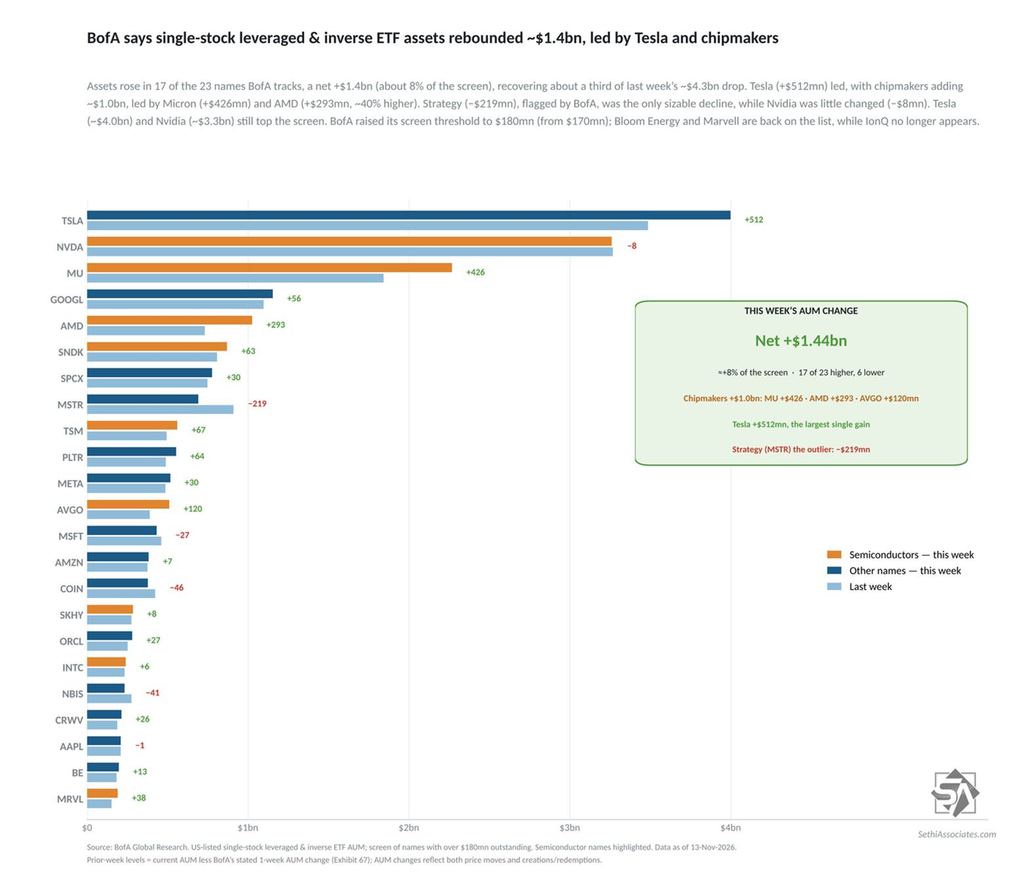
BofA also says single-stock leveraged and inverse ETF assets rebounded a net ~$1.4B last week, with 17 of the 23 names it tracks higher, recovering about a third of the prior week’s ~$4.3B drop. Tesla (TSLA) (+$512M) led, and chipmakers added about $1.0B, led by Micron (MU) (+$426M) and AMD (AMD) (+$293M). Strategy (MSTR) (−$219M) was the only sizable decline. Tesla (about $4.0B) and Nvidia (NVDA) (about $3.3B) still top the list.
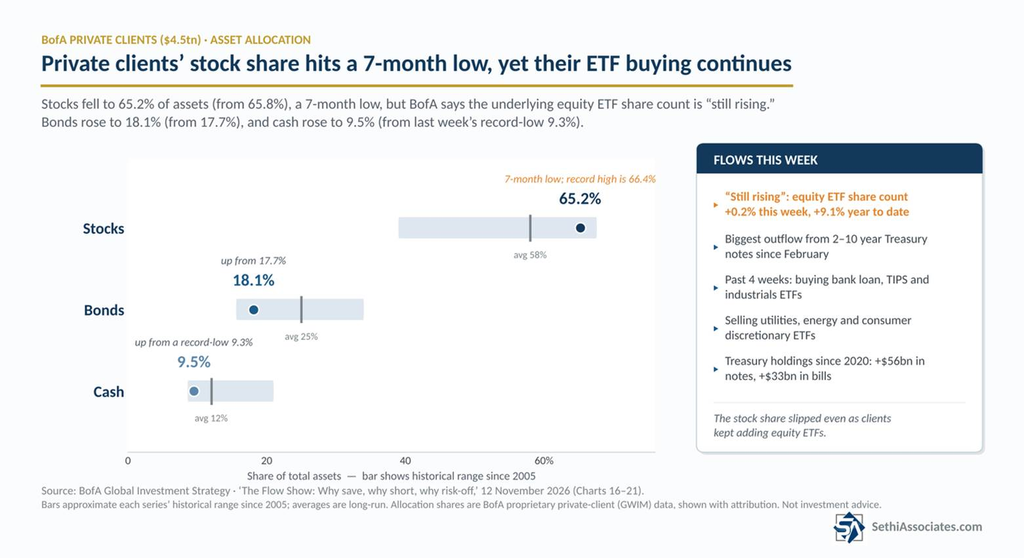
BofA also says despite the equity rally raising prices, its private clients ($4.5 trillion in assets) saw their stock allocations fall to 65.2% from 65.8%, a 7-month low, although their underlying equity ETF share count is “still rising” (+0.2% on the week and +9.1% year to date). Cash rose to 9.5% from a record-low 9.3%, and bonds rose to 18.1% from 17.7%, even as they saw their biggest outflow from 2- to 10-year notes since February.
On gamma*, BofA says SPX hedger gamma was negative at every close last week, ending Thursday at −$1.0B (13th percentile of the past year), up from −$4.9B a week earlier, as 5-day realized volatility rose to 21.1%. But it was near an inflection point. On Thursday’s profile, gamma turns positive at ~7,605 and stays positive up to ~7,850, so a modest rally would have market makers dampening moves again (currently they are relatively neutral), while a decline would push gamma further negative. Friday’s 0.4% drop left the S&P 500 at 7,561.67, about 0.6% below the level where gamma turns positive.
*Gamma plays an important, if nebulous, role in market volatility. Positive gamma means options market makers buy and sell against price moves, which dampens volatility. Negative gamma means the reverse: market makers trade with the move, accelerating rallies and selloffs and adding to volatility.
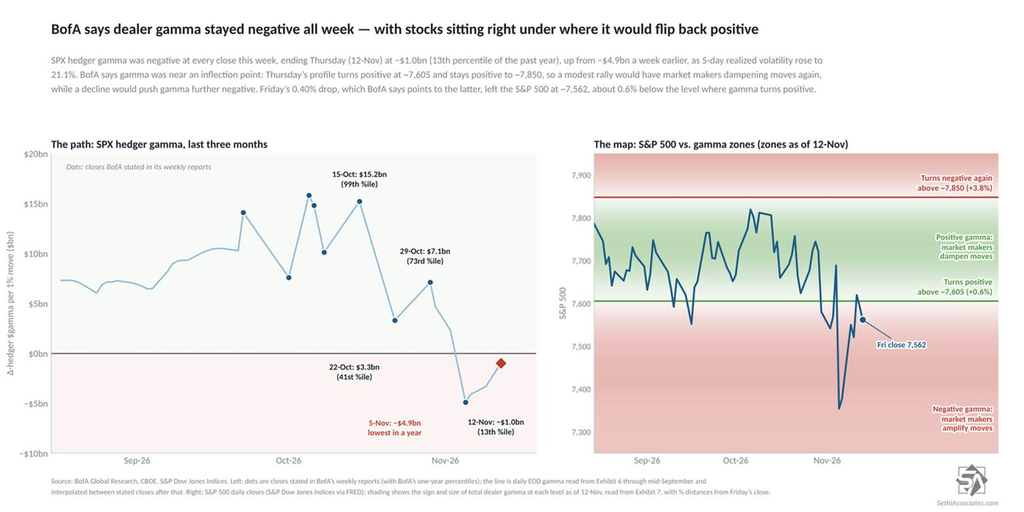
Tier1Alpha agrees dealers are still short gamma (“indicating that HIGHER VOLATILITY is expected”), with its gamma flip at about 7,657 as of Thursday. That’s little changed from ~7,650 a week earlier, but with the S&P 500 at 7,561.67 Friday, it’s now only about 1.3% above the market (from 3.7%).
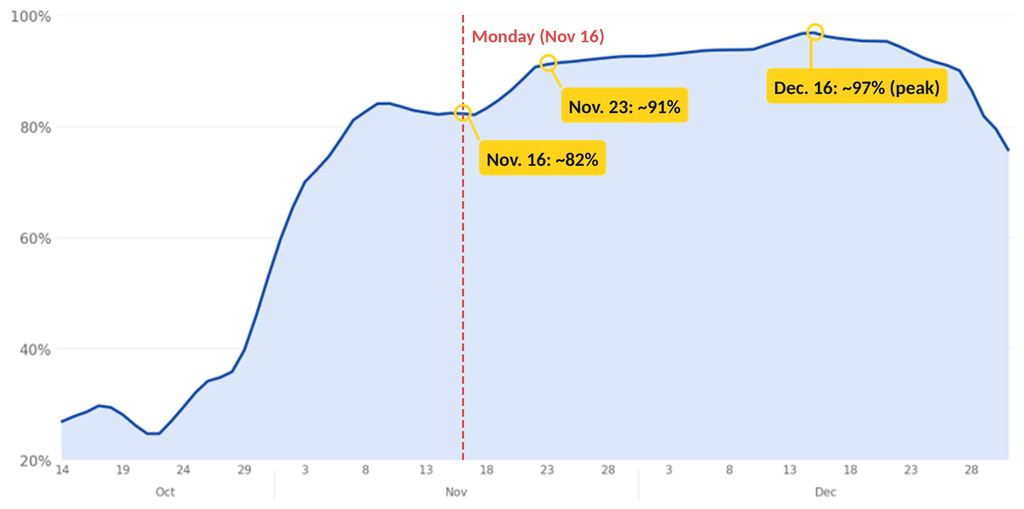
Turning to corporate buybacks (an important source of underlying demand), the blackout period is mostly behind us. Citadel estimates about 82% of S&P 500 index weight will be eligible to repurchase shares Monday (November 16th), rising to about 91% by the following Monday (November 23rd) and peaking near 97% in mid-December, before falling back late in the month as the next blackout begins.
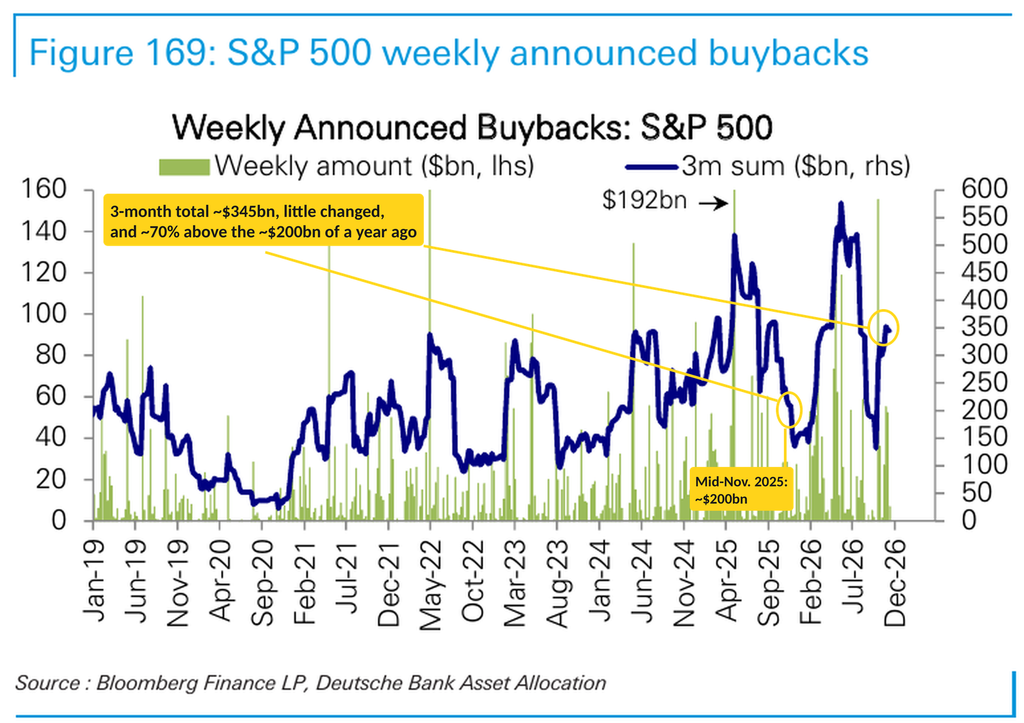
DB’s tally of announced S&P 500 buybacks over the past three months is little changed from last week at about $345B (from ~$350B), roughly 70% above the ~$200B of a year ago, although history says it may fall from here as it dropped last year to about $145B by early December.
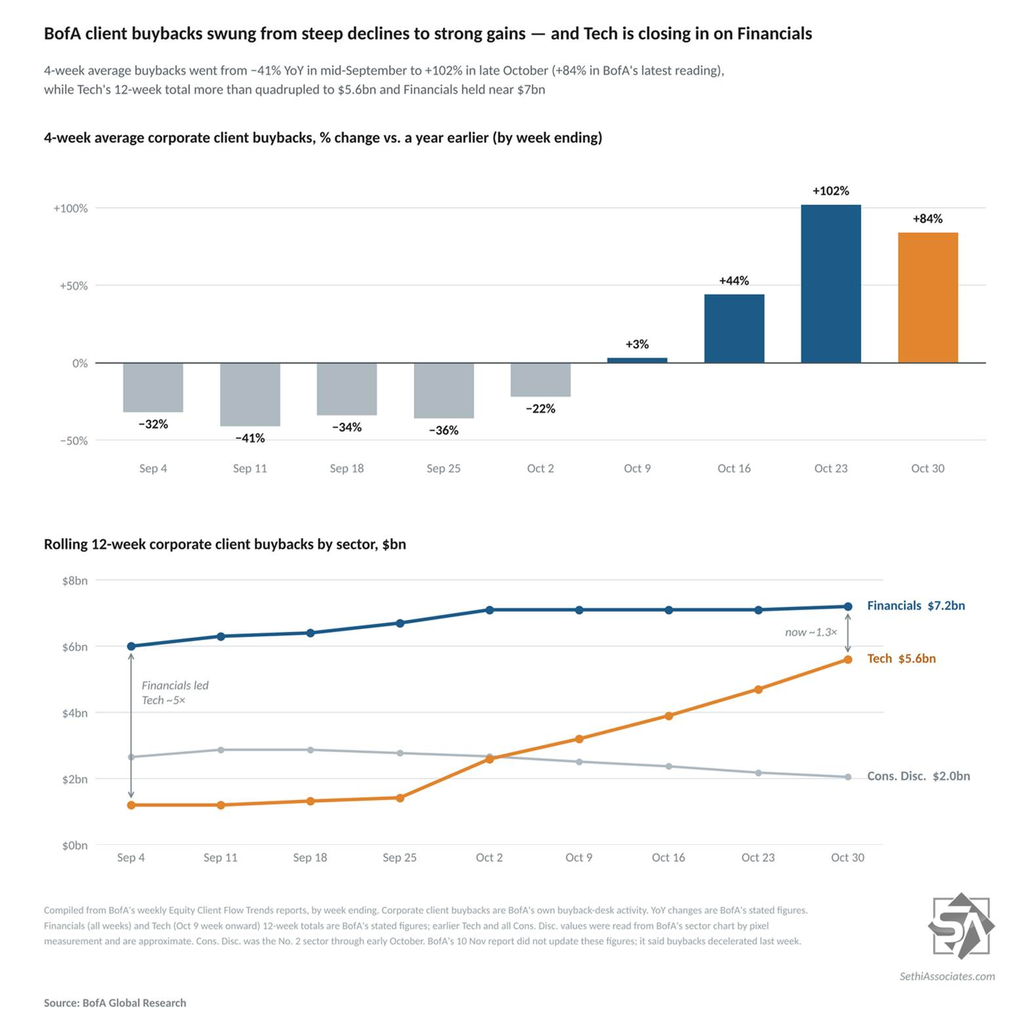
BofA said corporate client buybacks decelerated last week after accelerating for five straight weeks, though it didn’t update its figures. As of the week ending October 30th, they remained slightly below their seasonal average, and on a 4-week average basis they were up 84% vs the year earlier, from +102% the prior week. Financials still lead the past 12 weeks at $7.2B, about 1.3x the next sector, Tech ($5.6B).
BofA’s latest report also puts rolling 52-week buybacks at 0.18% of S&P 500 market cap, less than half their February 2025 peak of 0.42%.
Surveys Turn Bearish Even as Stocks Bounce
As I noted during the week, sentiment pulled back in the most followed surveys:
- AAII bears topped 50% for the first time in eight weeks (AAII Bears Top 50% for First Time in Eight Weeks).
- NAAIM’s exposure index fell to 72.9, its lowest since mid-September (Investment Professionals’ Equity Exposure Falls to Eight-Week Low).
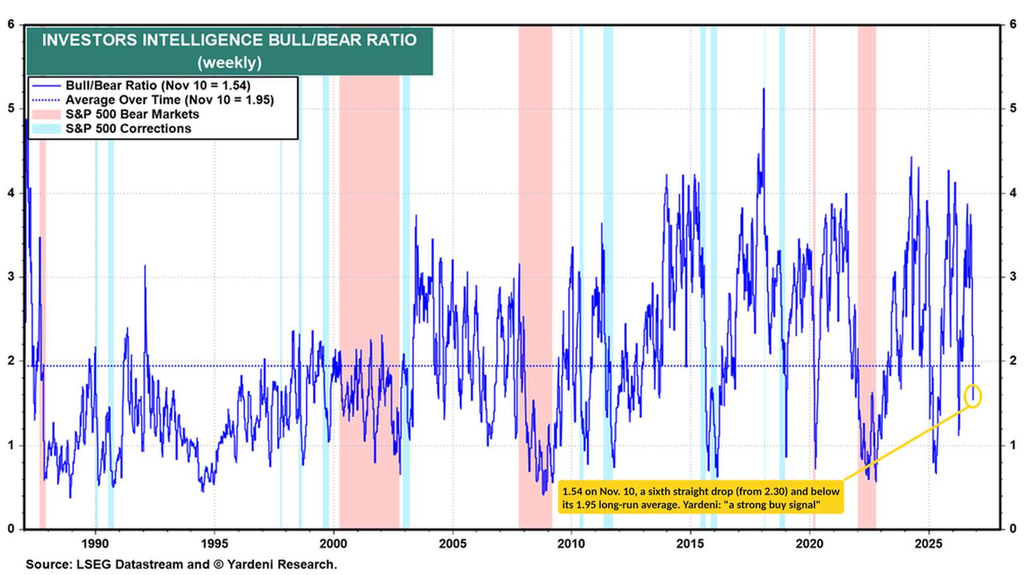
- Investors Intelligence bears jumped to 24% with bulls down to 37%, the most bears and fewest bulls since April, which Helene called “a serious change in sentiment” (A Serious Change in Sentiment; her column is here).
The latter took the Investors Intelligence (independent investment-newsletter writers) bull/bear ratio down for a sixth week, to 1.54 from 2.30, now below both its 2.61 average since 2014 and its 1.95 average since 1987. Yardeni calls it “a strong buy signal” from a contrarian perspective. Combined with AAII’s 0.60 bull/bear ratio (from 0.70, and below its 1.18 average), the two surveys Yardeni tracks are both well below average.
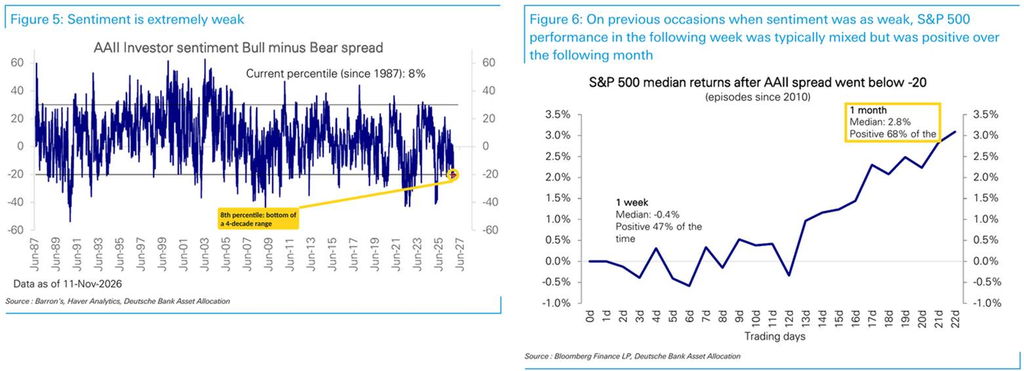
With AAII’s bull-bear spread at −20.6 last week (30.8% bulls, 51.4% bears), just the 8th percentile since 2010, DB notes that when the spread has been below −20, the S&P 500 has typically been higher a month later, with a median gain of 2.8%, positive 68% of the time.
Goldman’s US Equity Sentiment Indicator was not updated as of Sunday midday.
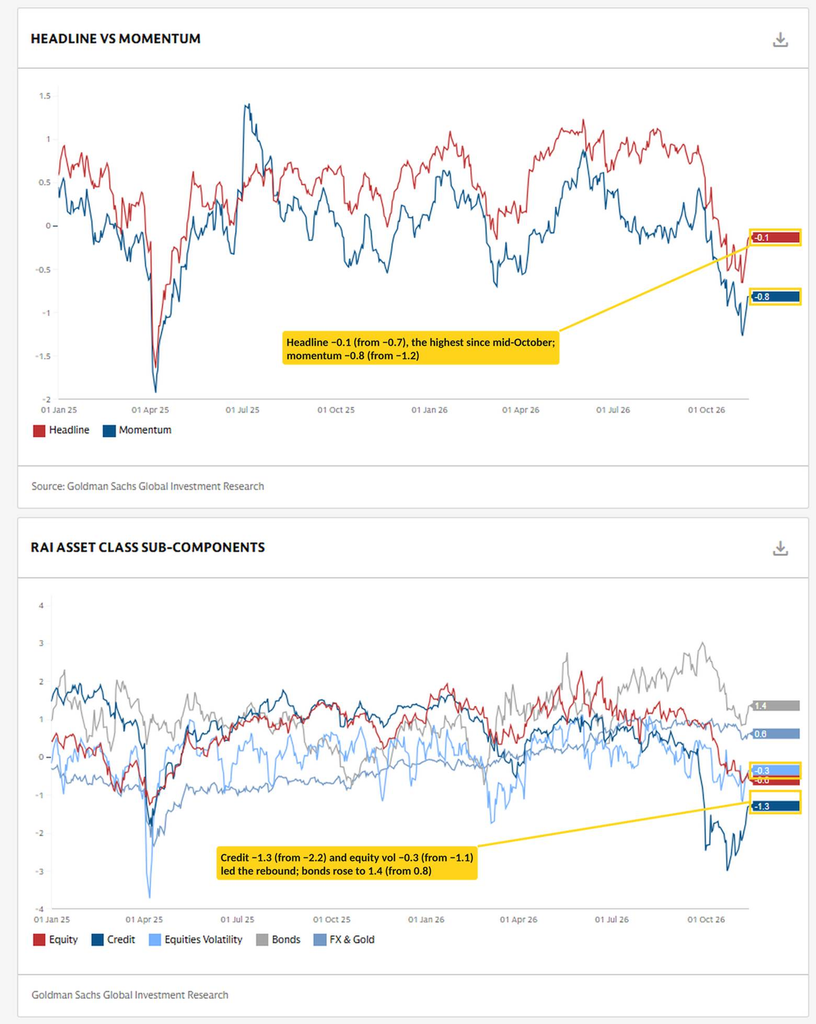
Goldman’s Risk Appetite Indicator* though rebounded to −0.1, its highest since mid-October, from −0.7 the prior week (its lowest since April 2025), and the momentum index rose to −0.8 from −1.2. By component, credit remains the weakest (−1.3, from −2.2) despite the biggest improvement, followed by equities (−0.6, unchanged) and equity volatility (−0.3, from −1.1), while bonds (1.4, from 0.8) and FX & gold (0.6, from 0.5) are still positive.
*”Goldman Sachs Risk Appetite Indicator (RAI) aims to track the level of global market risk appetite and risk aversion based on various market variables. A sharp rise in the index can send a warning signal that investors have more risk appetite and are potentially exposed to a correction if consensus views are tested. Similarly, a sharp decline indicates a reduction in risk appetite, and at extreme levels it can indicate that markets may have overshot. RAI signals are most powerful when the level of risk appetite is very low below -1.5, with levels closer to -2.0 giving the clearest signal over longer time horizons, as at such levels the asymmetry of subsequent medium term equity return becomes very positively skewed. RAI momentum is designed to track short term shifts of market risk appetite, and subcomponents of the RAI.”
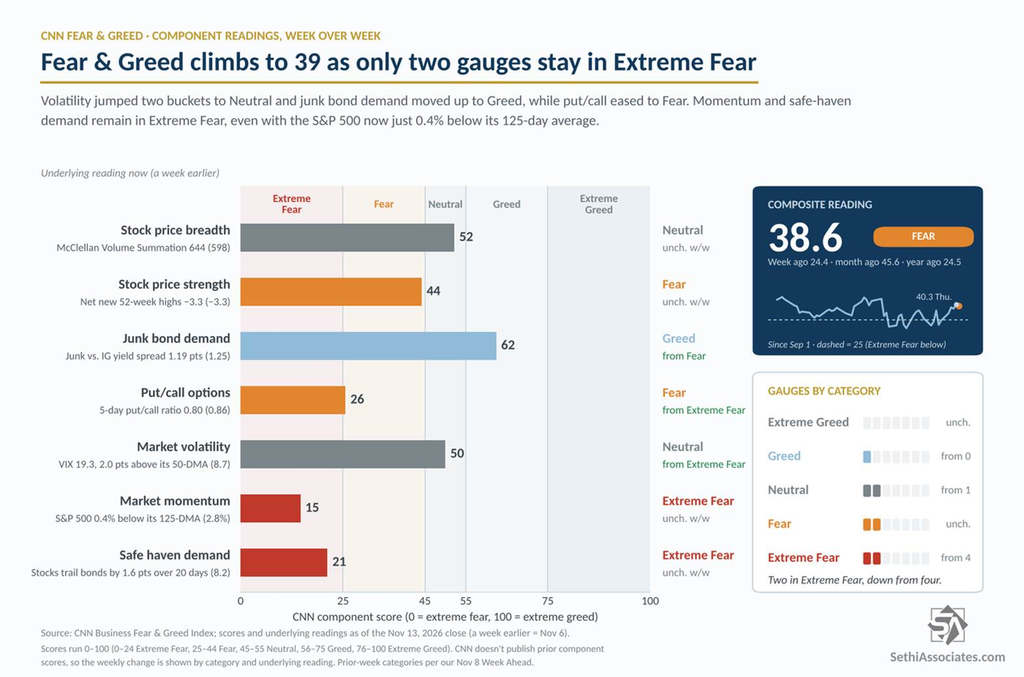
The CNN Fear & Greed Index also improved to 38.6 (Fear), up from 24.4 (Extreme Fear) a week earlier, after reaching 40.3 Thursday, its highest since October 13th.
Two of the seven indicators are now in Extreme Fear, down from four, with two in Fear, two Neutral and one in Greed (from none).
- Extreme Greed = None
- Greed = junk bond demand (vs investment grade) (from Fear)
- Neutral = stock price breadth (McClellan Volume Summation Index); market volatility (VIX & its 50-DMA) (from Extreme Fear)
- Fear = stock price strength (net new 52-week highs); put/call options (5-day put/call ratio) (from Extreme Fear)
- Extreme Fear = market momentum (SPX vs 125-DMA); safe haven demand (20-day difference in stock/bond returns)
And I noted in previous weeks if you have any questions on the indicator, TheStreet Pro’s own Jason Meshnick is your guy, as he helped create it.
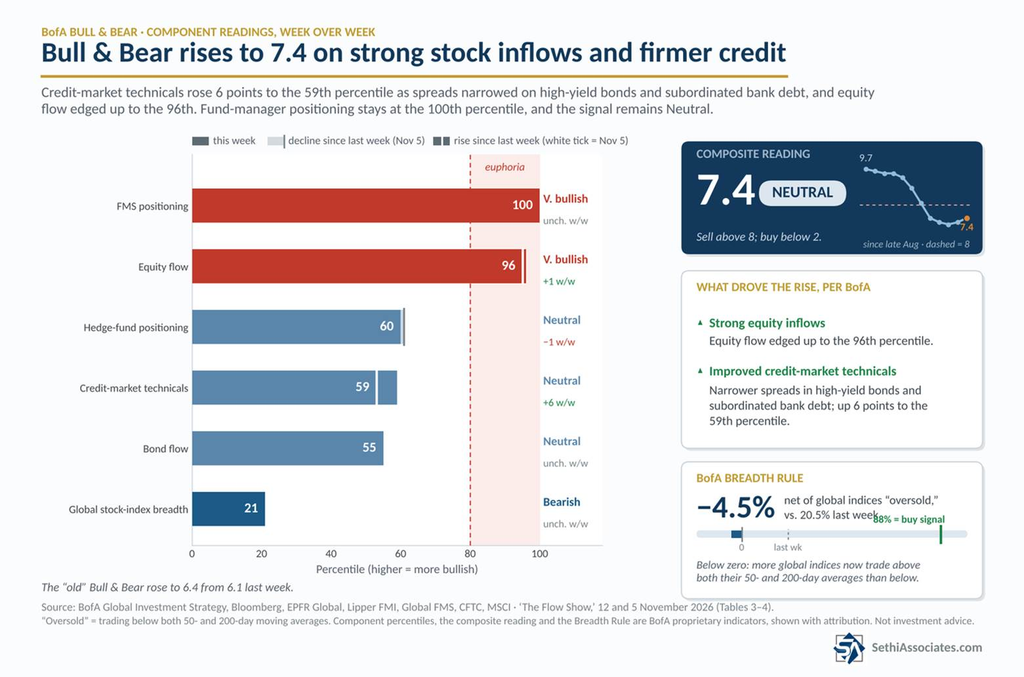
BofA says its Bull & Bear Indicator also rose to 7.4 from 7.2 on strong equity inflows and improved credit market technicals.
- Credit technicals: up 6 points to 59.
- Equity flow: up 1 to 96.
- Hedge-fund positioning: down 1 to 60.
- Fund-manager positioning: unchanged at 100.
- Bond flow: unchanged at 55.
- Global breadth: unchanged at 21.
The signal stays Neutral (sell trigger is above 8). The “old” Bull & Bear rose to 6.4 from 6.1.
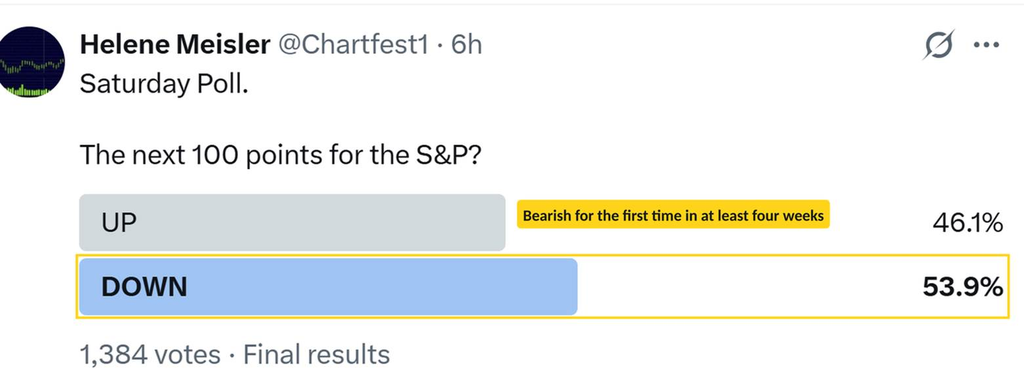
Helene Meisler‘s Saturday poll on the direction for the next 100 points for the S&P 500 though flipped bearish, at 46.1% up versus 53.9% down (1,384 votes), from 50.2% up last week, its first bearish result in at least four weeks.
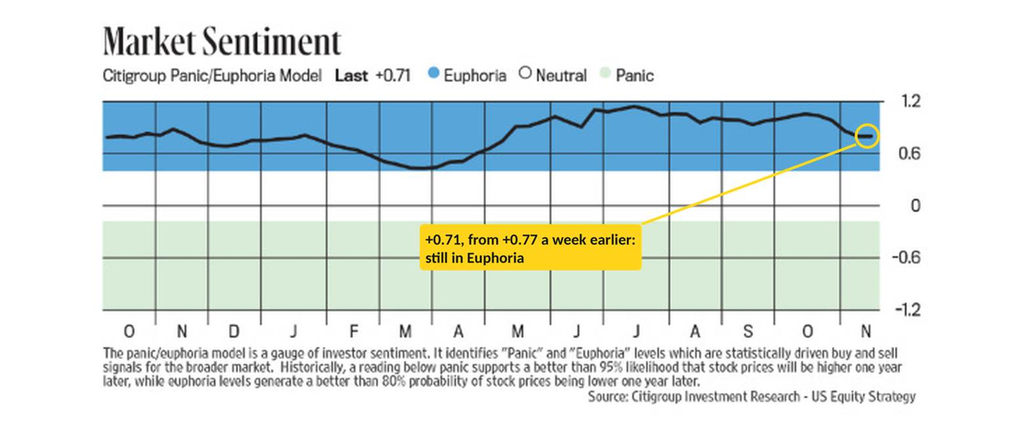
And Citi’s Panic/Euphoria Model, which Helene has each week in her Chart Fest, eased to +0.71 from +0.77 but remains in Euphoria, a level Citi says has historically come with “a better than 80% probability of stock prices being lower one year later,” although as I have indicated in the past the recent track record has been weak. As Helene puts it, it’s “coming off the boil but that’s the most you can say.”
Into the Low Point of November’s Mid-Month Dip
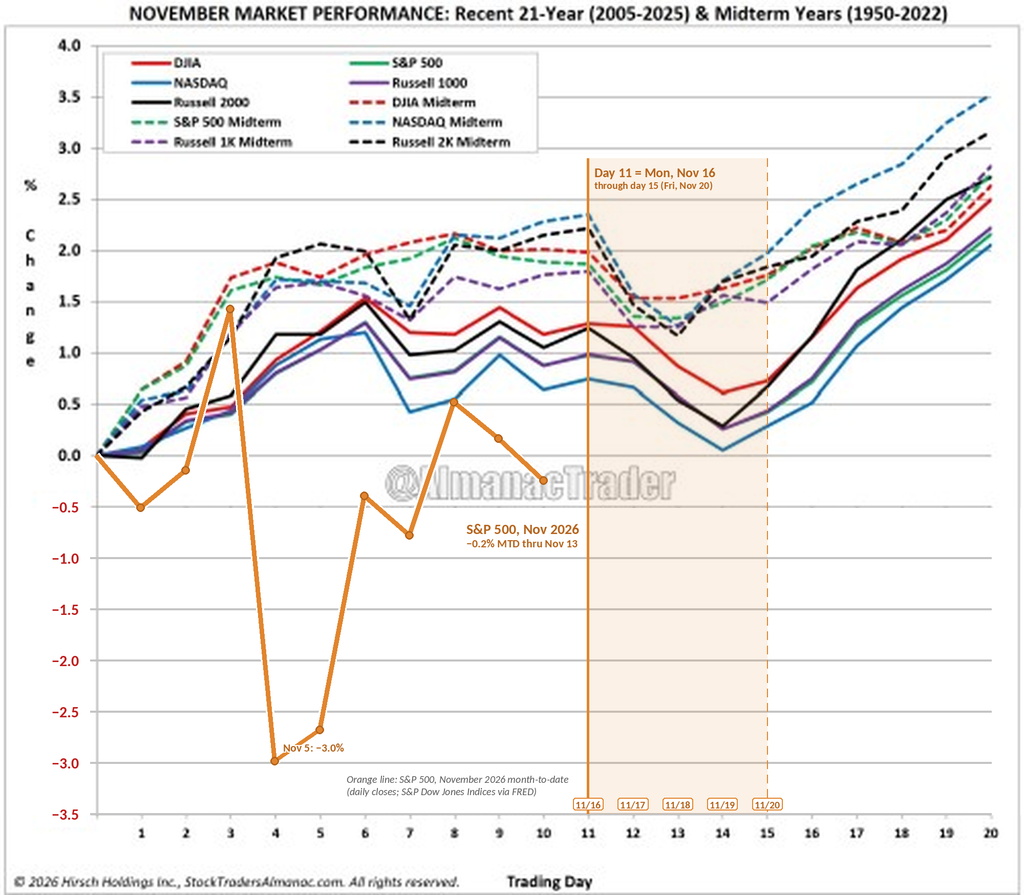
Looking at the seasonality breakdown from Jeff Hirsch, editor of the Stock Trader’s Almanac & Almanac Investor Newsletter, this week we hit the low point of November’s mid-month dip, with the caveat that we haven’t done a very good job of following the seasonal pattern so far this month (more on that in a minute).
Monday is trading day 11. Over the past 21 years, the major indices have lost about 0.35–0.45% over the week. The slide runs Tuesday through Thursday (day 14, November 19th), when the averages reach their lowest level since the first few trading days of the month. A Friday bounce of about 0.15–0.4% trims the losses.
In midterm years, Tuesday (day 12) has brought the sharpest drop. The Nasdaq has fallen about 0.8%, the Russell 2000 about 0.7%, the S&P 500 and Russell 1000 about 0.5%, and the DJIA about 0.45%. Hirsch flags the same day for small caps across all years: the Russell 2000 has risen on the 12th trading day just 12 times in the last 42 years, averaging −0.39%. The midterm lines bottom by Wednesday and rebound Thursday and Friday, leaving the week down about 0.15–0.3%.
Friday is also monthly options expiration, which falls in the week before Thanksgiving this year. Hirsch notes the DJIA rose in this week ten straight years from 1993 to 2002 and has been up in 21 of the last 33, but it has been down in seven of the last nine. Expiration day itself has a bullish bias, with the DJIA up 17 of the last 24, though five of the declines have come in the last ten years. The 21-year averages fit that recent record: the week is down, but Friday is up.
From the day-14 low, the strong finish in Hirsch’s pattern takes over, with every index rallying through Thanksgiving week into month-end.
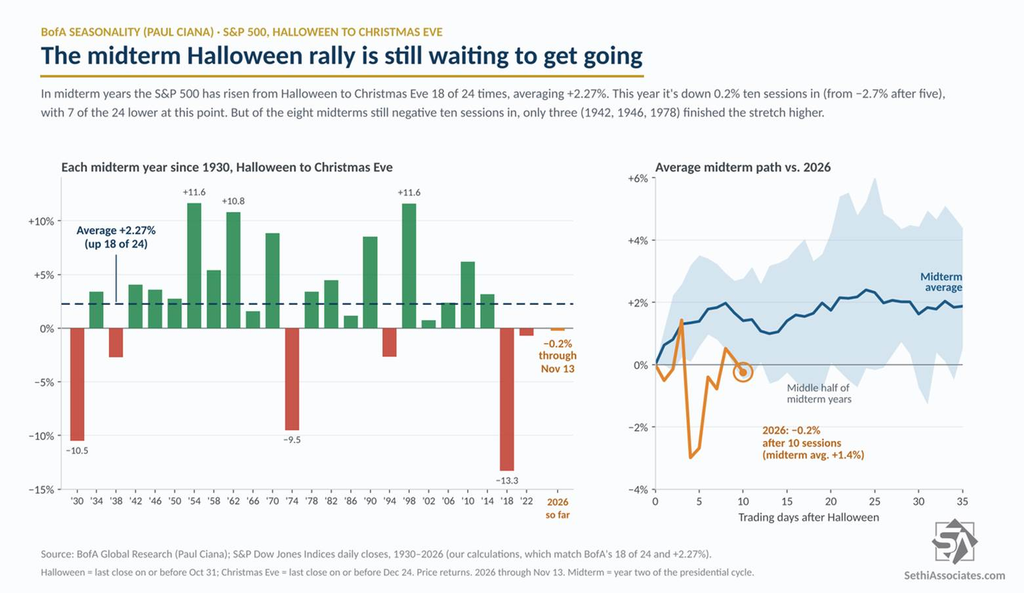
As noted, though, November is lagging the typical seasonal pattern. The S&P 500 is down 0.2% for the month through day 10 (from −2.7% through day 5), and the Nasdaq-100 1.6% (from −4.9%), versus 21-year average gains of roughly 0.7%–1.2% for the major indices by this point (about 1.8%–2.3% in midterm years), again reinforcing that seasonality is just a general guide to how markets have historically performed, certainly not a prediction of how they will actually perform.
BofA’s Ciana noted last week that in midterm years, Halloween to Christmas Eve has been up 75% of the time (18 of 24) by +2.27%, and that when the S&P 500 is up year-to-date through October (as it was this year), November-December has risen 79% of the time since 1928. With the S&P 500 now down just 0.2% since Halloween (the October 30th close), we’ve made up much of the ground but still have some catching up to do.
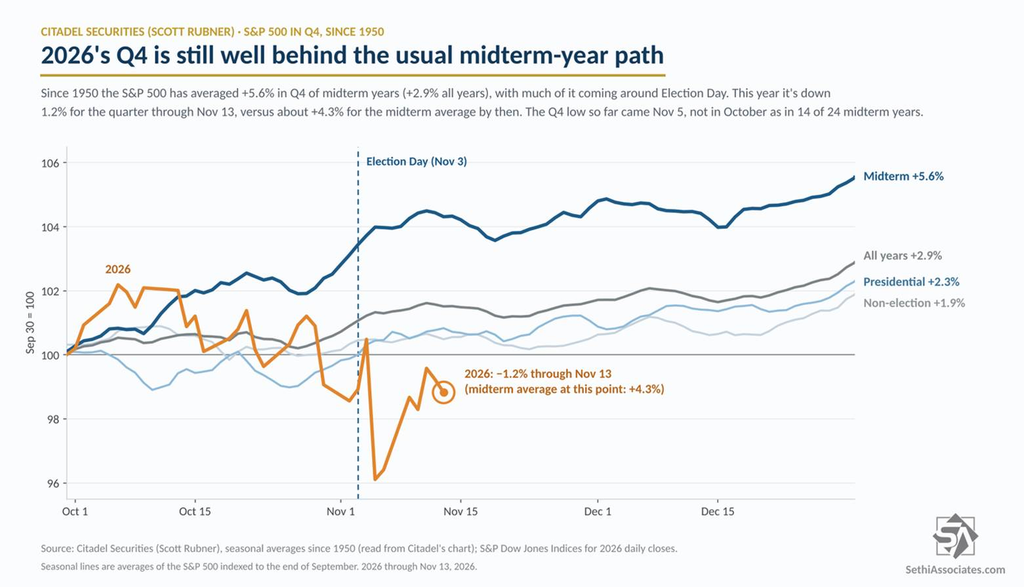
Citadel’s Rubner added that since 1950 the S&P 500 has been higher six and twelve months after every midterm election, with a median twelve-month gain of 14.5%. Q4 of midterm years has been the strongest of the presidential cycle, averaging +5.6% versus +2.9% for all years, and November has averaged +2.2% in midterm years, with the first half of the month positive nearly 80% of the time. This year the first half is down 0.2% through Friday, and with today the 15th it looks like we’re ending just barely in that 20% minority. The S&P 500 is down 0.1% since Election Day (the November 3rd close) and 1.2% for Q4, so matching the midterm Q4 average would take a rally of nearly 7% from here into year-end.
The other Rubner stat, a Q4 low in October in 14 of 24 midterm years followed by a median rally of nearly 10%, remains off the table. The November 5th close (7,353.73) is the Q4 low so far, and the S&P 500 is 2.8% above it.
Wrap-Up – The Clock Starts Working for the Bulls
Last week’s Week Ahead was titled “CPI and Equity Flows Test a Shaken Market.” The test was a tough one: core CPI rose more than expected, pushing the estimated year-over-year rate in the wrong direction, and unexpectedly hawkish Fedspeak drove, as noted, a big repricing in Fed rate-hike bets, sending the 2-year Treasury yield to its biggest weekly rise since October 2024 and the 10-year above 5% (5.14%), its highest close since mid-October. And we had the added pressure of the removal of Jensen Huang, the architect of the AI buildout.
I said last week I was “taking it one day at a time right now,” with “good arguments for it to go either way,” and it turned out that the way was to the upside. That led me to turn more optimistic during the week, a view I carried through the weakness Thursday and Friday, saying Thursday that “the markets again showed remarkable resilience, which says to me that for now the more likely path is further upside” (The Bounce Stalls as Nvidia Ousts Huang and Yields Jump), and Friday that dip buyers “are still out there,” leaving me constructive (Chips Slide Again, but the S&P 500 Still Ends the Week Up 2.5%).
Having now gone through the indicators, they mostly back that up. Positioning remains light: DB’s discretionary measure is still at just the 13th percentile, systematic exposure is at a seven-month low, Goldman’s hedge fund net leverage is in the 4th percentile of the past year, and QQQ short interest is the highest since 2023. Importantly, though, in contrast to last week, when indications were for further selling from the systematic community, we’ve started to see releveraging (as mentioned above, and from Tier1Alpha during the week), and BofA now sees systematic funds buying ~$28B this week even if stocks go nowhere, with only ~$22B of selling in a down tape (the smallest in at least eight weeks). That comes on top of what will likely be continued flows from retail and hedge funds if things remain more stable.
And such flows would create a virtuous cycle with the S&P 500 just below the levels where dealer gamma turns positive (~7,605 per BofA, ~7,657 per Tier1Alpha). Higher gamma means lower volatility. Lower volatility means more systematic releveraging. More systematic releveraging encourages more flows from discretionary traders. More flows mean higher prices, meaning higher gamma, and so forth. Of course, cutting against lower volatility is the fact that leveraged ETFs are back to increasing their footprint.
Some sentiment surveys, while not washed out, have at least tipped into the area of favorable forward returns historically, with the Investors Intelligence bull/bear ratio at 1.54, which Yardeni calls “a strong buy signal” and AAII bears above 50% for the first time in eight weeks. And the buyback window is now wide open, with ~82% of S&P 500 index weight eligible Monday, rising to ~91% the following week, adding another important source of demand.
And almost all of the commentators who, as I’ve noted, have called the twists and turns of the past couple of years are now on board with further upside. DB remains overweight Tech after its upgrade, HSBC’s Kettner flipped Monday, saying the correction should be used to increase exposure to equities again (HSBC’s Kettner Says It’s Time to Buy the Pullback), Citadel’s Rubner had already turned more positive the prior week, and now Yardeni has explicitly turned bullish.
In “Time To Sound The All Clear Signal?”, written Wednesday, Yardeni says the November 5th selloff “was the buying opportunity we had anticipated.” The S&P 500 “found support at its 200-day moving average” and was just 2.6% below its record as of Wednesday’s close, with the equal-weight index back at its record high. And his “worry list is getting shorter”:
- Geopolitics: the feared post-midterm re-escalation of the Middle East war “did not materialize,” as Trump “adopted a more conciliatory tone after Republican election losses,” and oil has retreated.
- Bond yields: the 10-year is back in his “old normal range of 4.00%-5.00%,” which he views as consistent with solid growth (though it closed the week above it at 5.14%).
- Domestic policy: the midterms are done, and the Blue Wave “might slow data center construction, but it won’t stop the AI buildout,” though fiscal standoffs over the budget and debt ceiling remain a risk.
- AI: financial, political and physical constraints “should be speed bumps, not roadblocks,” since demand for computing power “remains exceptionally strong.” He points to CoreWeave (CRWV), with Q3 revenue up 168% y/y to $3.7 billion and a $132.5 billion backlog, and to revenue growth at OpenAI (+160% to $10 billion) and Anthropic (+1,127% to almost $17 billion).
For the rest of the year, he expects analysts to “moderate their earnings forecasts as they account for the speed bumps ahead, while investors become more comfortable paying a higher multiple as earnings estimates become more credible and sentiment improves.” His targets are unchanged: 7,900 for year-end (about 4.5% above Friday’s close) and 8,400 by mid-2027.
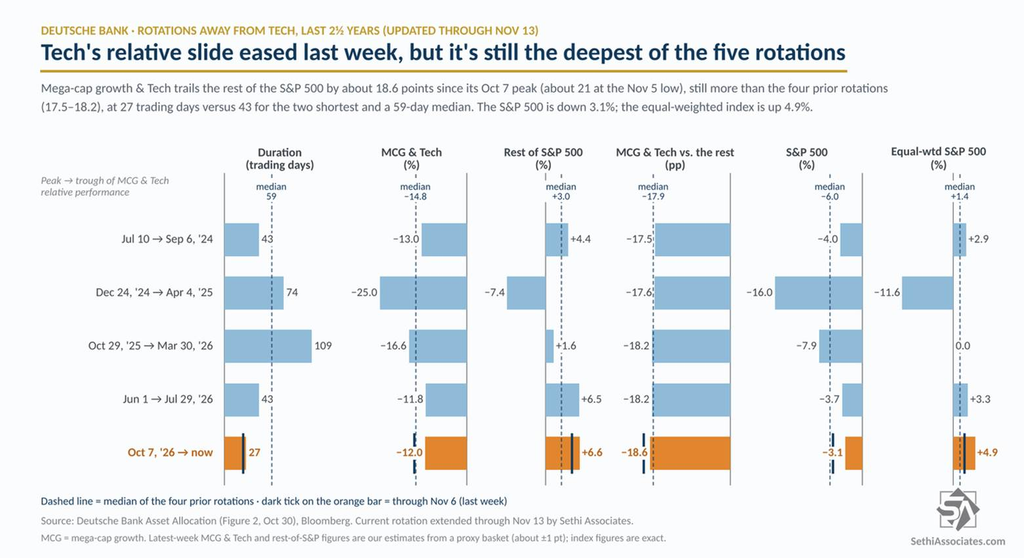
And as mentioned last week, the Tech pullback was deeper than the prior pullbacks on DB’s rotation framework with the relative drop in Mega-Cap Growth (MCG) and Tech vs. the rest of the S&P 500 at 21 points on November 5th, as compared with pullbacks of 17.5–18.2 points in the last four. We’re still well short in terms of duration, at 27 trading days from the October 7th peak, vs. the 43 days of the two shortest prior rotations and the 59-day median, but perhaps it’s the depth and not the duration that matters here
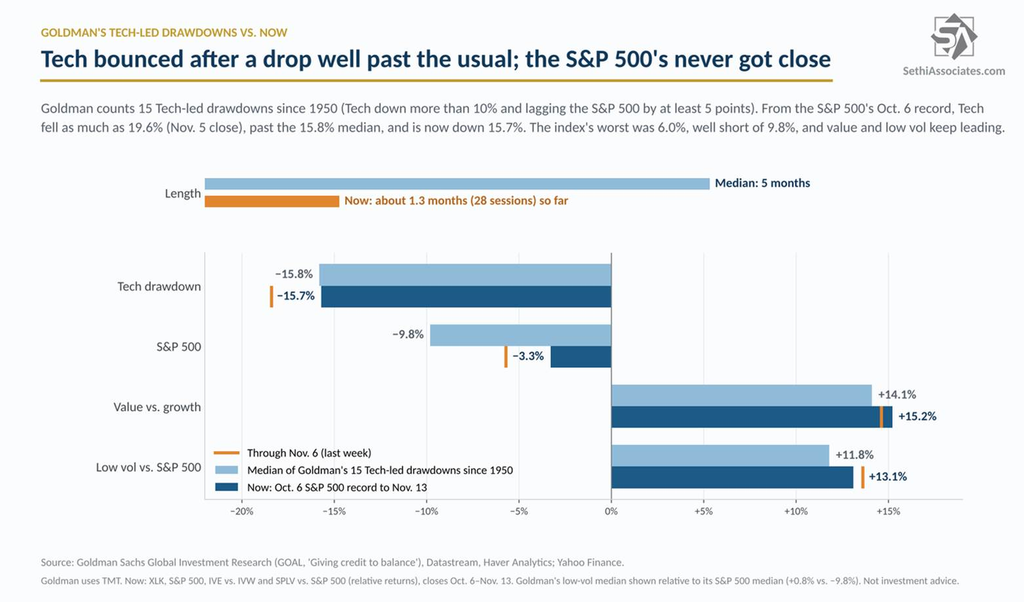
It’s a similar analysis looking at Goldman’s Tech-led drawdown framework although with more caveats. Tech’s decline from the October 6th record bottomed (so far) at 19.6% on November 5th, past the 15.8% median, but the S&P 500’s drawdown topped out at 6.0% that day, well short of its 9.8% median. And at 28 sessions (just over a month), it’s also far shorter than the five-month median. The rotation though has followed the playbook, with value outperforming growth by 15.2% since October 6th (median 14.1%) and low-vol stocks the S&P 500 by 13.1% (median 11.8%).
Add Barclays’ Alex Altmann, another who also has a pretty good record on his buy calls the past couple of years: the S&P 500 was up 6.1% two months after his August 2025 signal, 5.3% after November 2025’s and 10.3% after March 2026’s (though it first fell 5.5%). His bearish calls have been more mixed though. His February 2025 call to short US stocks in favor of Europe came just before the tariff selloff, but his June call for a 6% to 7% pullback came a day before the low (the S&P fell 4.5% from its record), and the index is about where it was when he turned risk-off in late May.
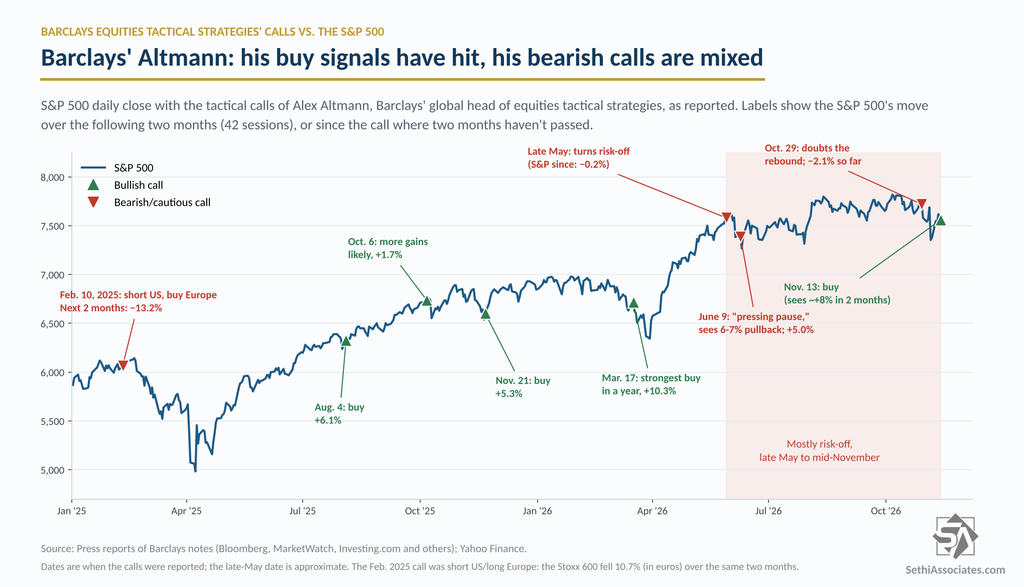
But it’s his buy call we’re interested in: Altmann last week turned tactically bullish on US stocks for the first time since mid-March. He notes the Barclays Equity Timing Indicator (BETI) flashed a buy signal after being mostly risk-off since late May (Barclays Trading Desk Turns Bullish on US Stocks for First Time Since March). Over the past 10 years, the signal has been followed by an S&P 500 gain of about 8% over the next two months, with a 95% hit rate. The driver is the reset in positioning: CTAs are at the 8th percentile of the past year, vol-control funds at the 1st and hedge fund net exposure at the 7th, while Barclays’ Equity Euphoria Indicator is low despite recent retail buying. Altmann though sees it “exclusively as a tactical bounce,” not a fundamental shift, and the desk plans to take profits if two-thirds of the expected gain (a 5% to 6% S&P 500 rise) comes in November. He also notes the Santa Claus rally has increasingly shifted into November, which could leave stocks vulnerable in December (but remember his bearish calls have been much less prophetic).
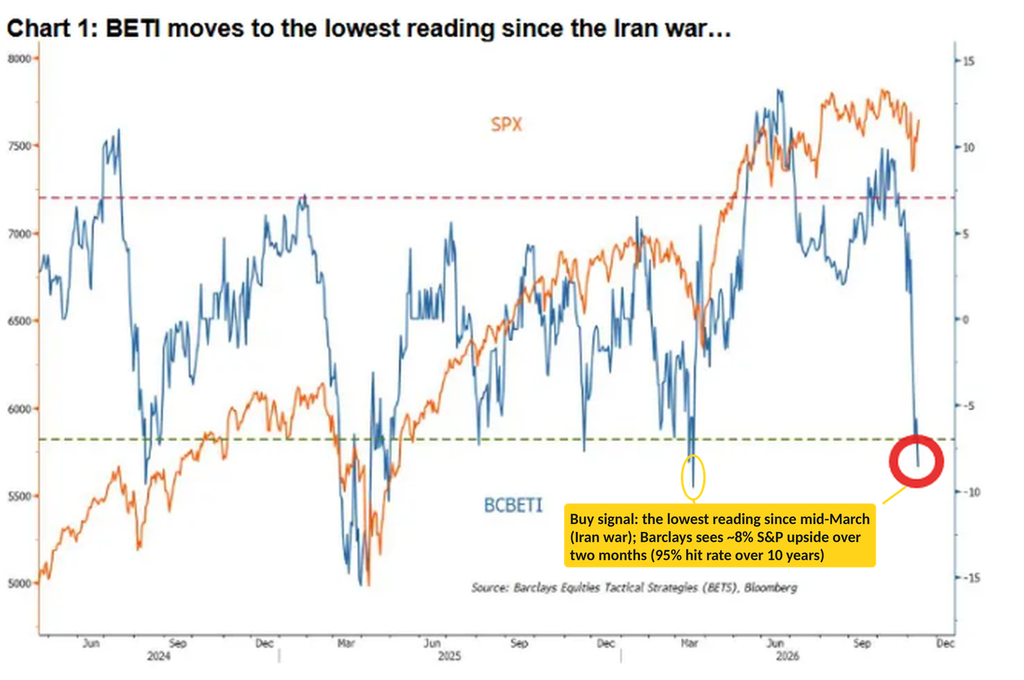
Also arguing for upside are the strong economy, continued robust expected earnings growth through 2027 (with Q4 estimates rising and guidance better than usual), the market rewarding earnings beats more than usual (and punishing misses less than usual), the improved breadth (even if it took a step back last week), Goldman’s first-hike playbook holding so far (the November 5th close is still the low since the September hike), strong seasonality after this week, etc.
That doesn’t, though, mean it’s time to load the boat. The Technical conditions of the indices outside of the equal-weight S&P 500 are weak (see Friday’s Charts – Stocks Notch Best Week Since August, Even as the 2-Year Jumps Most Since 2024), yields have jumped back toward the highs of the year on the back of an increasingly hawkish Fed and unfriendly inflation prints, Goldman’s Financial Conditions Index is the tightest since late March, there is the ever-present “Trump Wildcard” risk, the likely pullback in the “Bank of Nvidia” helping power the AI buildout will be a headwind (post on that coming Monday or Tuesday in the Stock Market Today), we’ve passed the peak in earnings growth which can act as a short-term headwind (post on that coming as well), etc.
Overall, though, I’m definitely more bullish than I was a week ago, even as I acknowledge a retest of the November 5th lows remains a distinct possibility.
As always, let’s see what we get and go from there.
At the time of publication, in terms of securities mentioned, Sethi was long AMD, AMZN, DIS, GOOGL, IWM, META, MSFT, MU, NVDA, QQQ, RSP, SKYD, SPY and numerous Treasury ETFs.