Household Debt Jumps the Most Since 2022, Delinquencies Climb to Highest Since 2016
Mortgages drive the biggest jump in borrowing since 2022, while new delinquencies shift to home loans and autos.
You've reached your free article limit
You've read 0 of 1 free Pro articles.

New York Fed Total Household Debt (Q3 2026): $19.105 trillion (prev $18.771 trillion)
Executive Summary
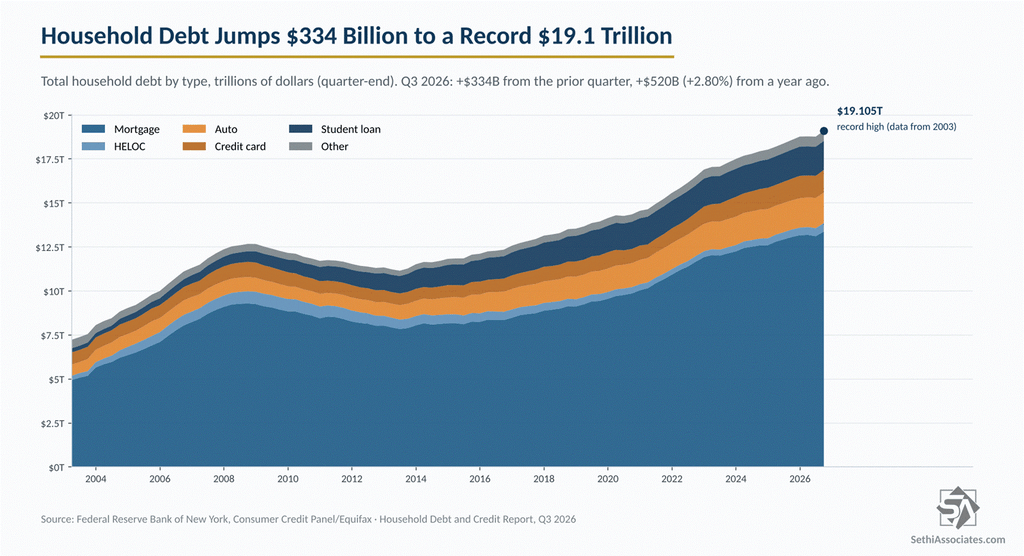
- Household debt rose $334 billion (1.8%) in the third quarter to a record $19.105 trillion, the biggest increase since the fourth quarter of 2022, after a $13 billion dip in the second quarter. Mortgages added $257 billion and home equity lines of credit $23 billion, the most for HELOCs since 2005 with many homeowners locked into lower-interest mortgages.
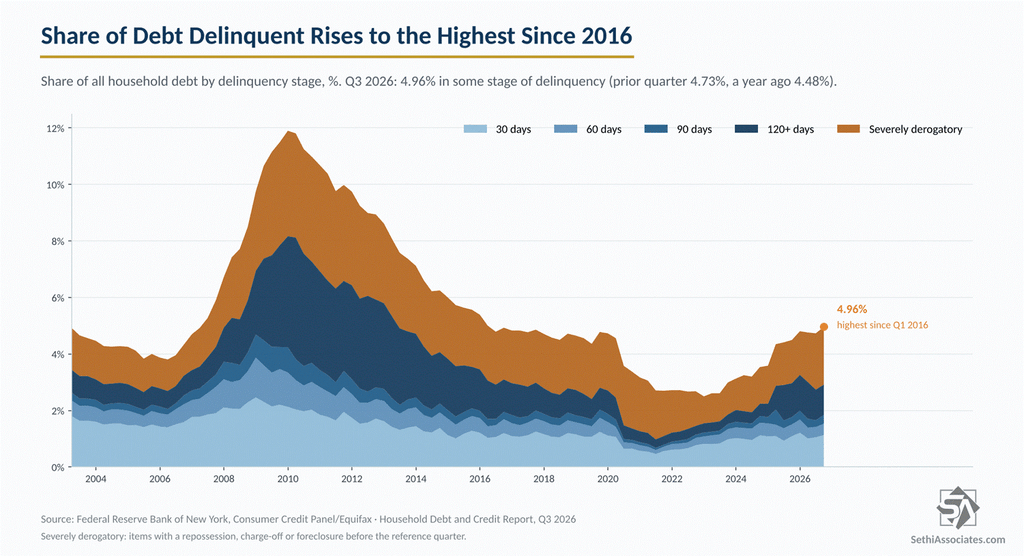
- The share of debt in some stage of delinquency rose to 4.96%, the highest since the first quarter of 2016, from 4.73%. The pressure is moving toward housing and autos: new serious mortgage delinquencies hit the highest rate since 2015, auto the highest since 2010, and foreclosures the most since early 2020.
- Credit cards went the other way. Balances hit a record $1.285 trillion, but the rate of card balances turning seriously delinquent fell to the lowest since the first quarter of 2024, and the New York Fed says the pandemic-era wave of riskier cards is fading. TransUnion data adds a catch: the share of card borrowers seriously behind is still rising, just on smaller balances.
The New York Fed’s quarterly Household Debt and Credit Report, built from a large sample of Equifax credit reports, is the broadest look at what Americans owe. Unlike the Fed’s monthly consumer credit report I covered on Monday, it includes mortgages, and it shows whether people are keeping up with their payments.
Borrowing Rebounds, Led by Housing
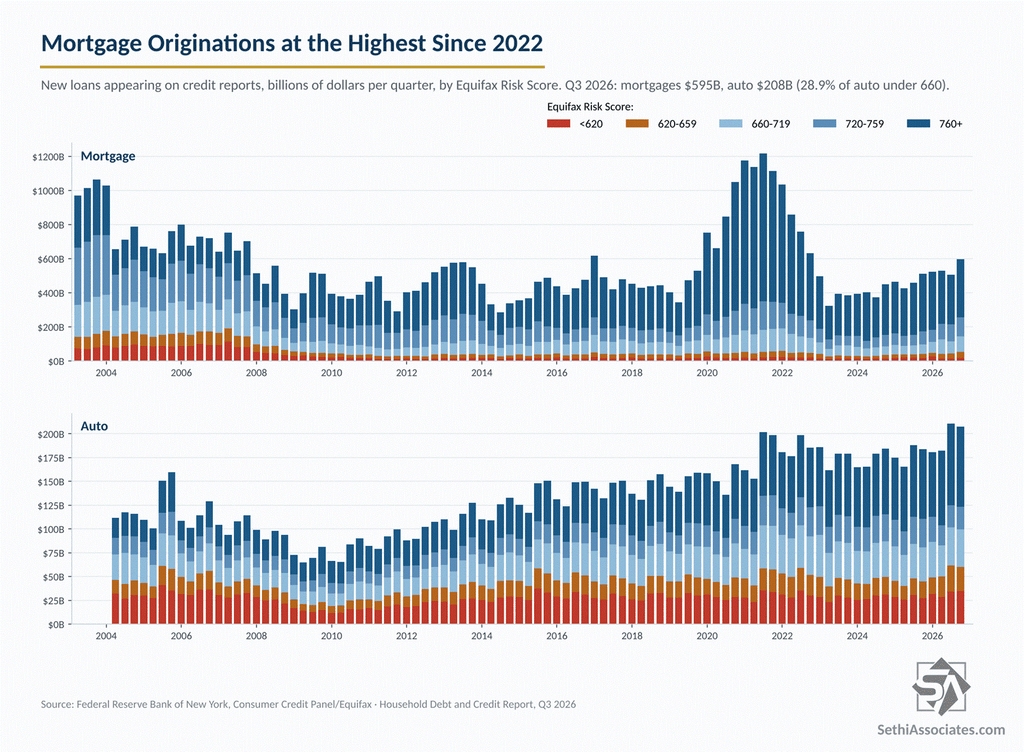
Mortgage balances rose $257 billion to a record $13.374 trillion, the biggest increase since the third quarter of 2022, after falling $74 billion in the second quarter. Despite high mortgage rates, new mortgage originations jumped to $595 billion from $505 billion, also the most since the third quarter of 2022.
That stands in contrast with last week’s post on the Fed loan officer survey (SLOOS), where banks reported weaker mortgage demand in every category, although the mix could perhaps explain some of the discrepancy. Unlike the SLOOS, which covers only banks, the NY Fed counts every new mortgage that shows up on a credit report, including refinancings and loans from nonbank lenders. Credit quality slipped at the margin, with the median credit score on new mortgages falling to 761, the lowest since the second quarter of 2019, from 764 in the second quarter and 775 a year ago.
With many homeowners locked into low-rate mortgages, home equity lines of credit rose $23 billion to $481 billion, the largest increase since 2005, and HELOC limits rose $31 billion. “Household debt levels rose moderately, led by increases in mortgage and home equity line of credit originations,” Donghoon Lee, economic research advisor at the New York Fed, said in the release.
Auto loans rose $21 billion to a record $1.734 trillion on $208 billion of new loans, just under the second quarter’s record $211 billion. Student loans edged up $5 billion to $1.656 trillion.
Credit Card Balances at a Record
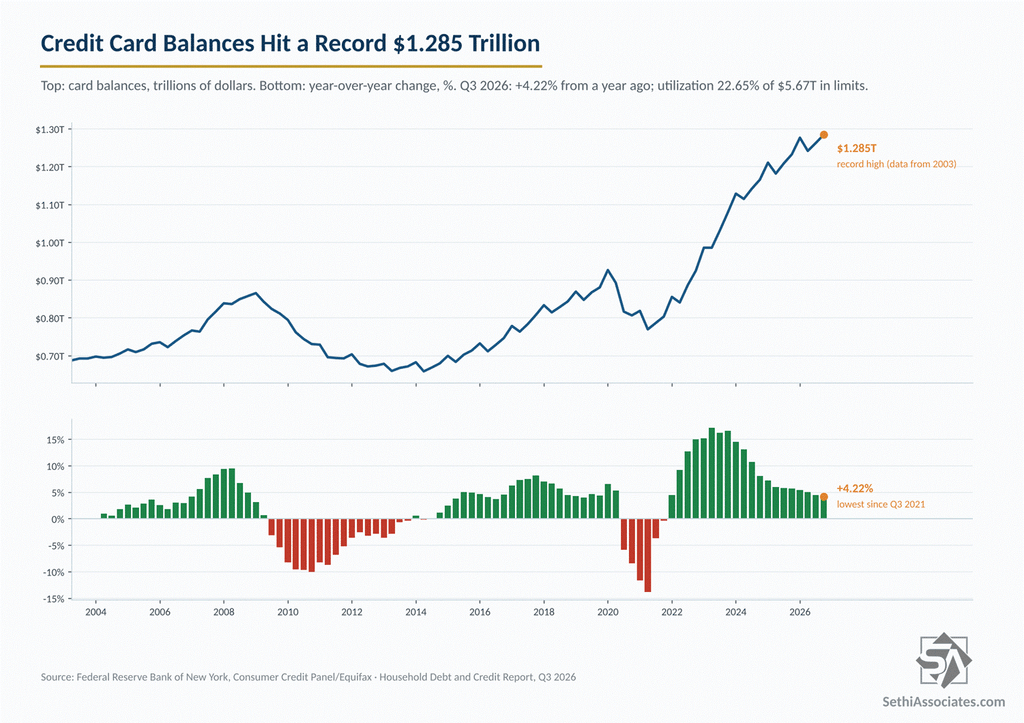
Card balances rose $22 billion to a record $1.285 trillion, up 4.22% from a year ago, the least since the third quarter of 2021 and the 12th straight quarter of slower growth. But card limits rose faster, up $115 billion to $5.674 trillion, the most since the first quarter of 2023, so utilization slipped to 22.65% of available credit, the lowest since the second quarter of 2023.
Consumers are also opening more cards. Card accounts hit a record 660.8 million, and 89.3 million people had a credit inquiry in the past six months, the most since the first quarter of 2023. TransUnion counted 22.4 million new cards opened in the third quarter, up from 20.4 million a year earlier.
As I noted in my look at the Fed’s G.19 report, that debt isn’t getting cheaper. The average rate on card accounts charged interest was 22.36% in the third quarter, and the average new card offer was 23.96% in October, tied for the highest since December 2025, according to LendingTree.
Delinquencies Rise to the Highest Since 2016
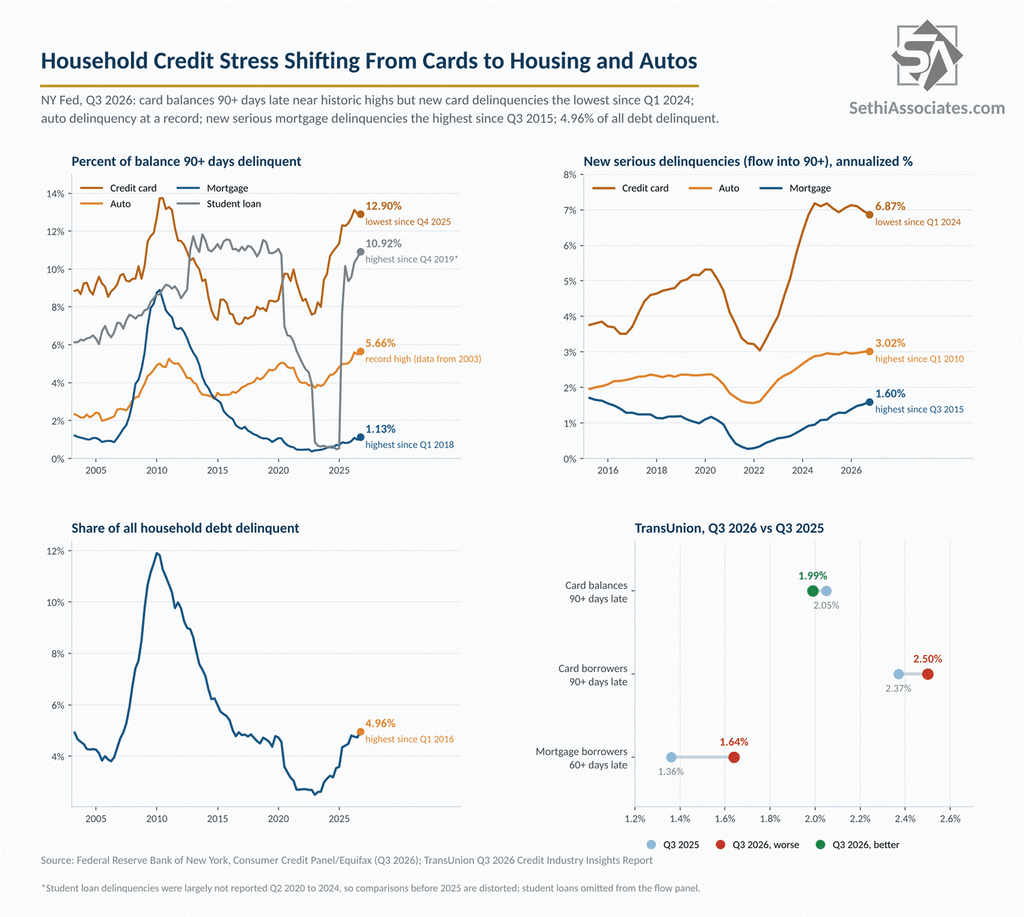
At the end of September, 4.96% of household debt was in some stage of delinquency, the highest since the first quarter of 2016, up from 4.73% in the second quarter and 4.48% a year ago (the NY Fed rounds it to 5.0%, a 0.3-point rise). The share that was seriously delinquent, 90 or more days late including debt already charged off, rose to 3.43%, also the highest since the first quarter of 2016.
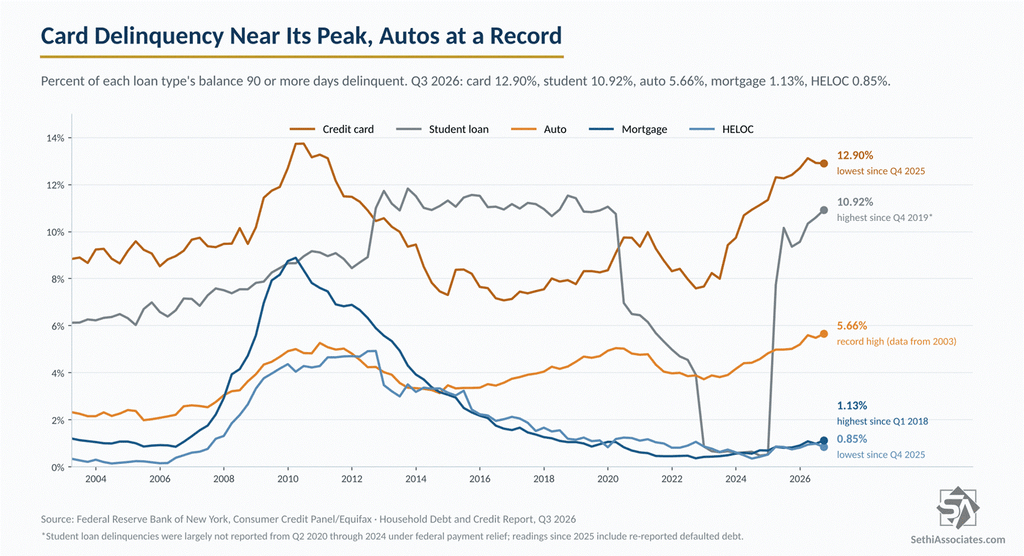
By loan type, though, the picture varies widely. The share of card balances 90 or more days late is 12.90%, close to the 13.74% peak in the second quarter of 2010, while for autos it’s 5.66%, a record for data going back to 2003. Mortgage delinquencies are low at 1.13%, but that’s up from 0.99% and the highest since the first quarter of 2018.
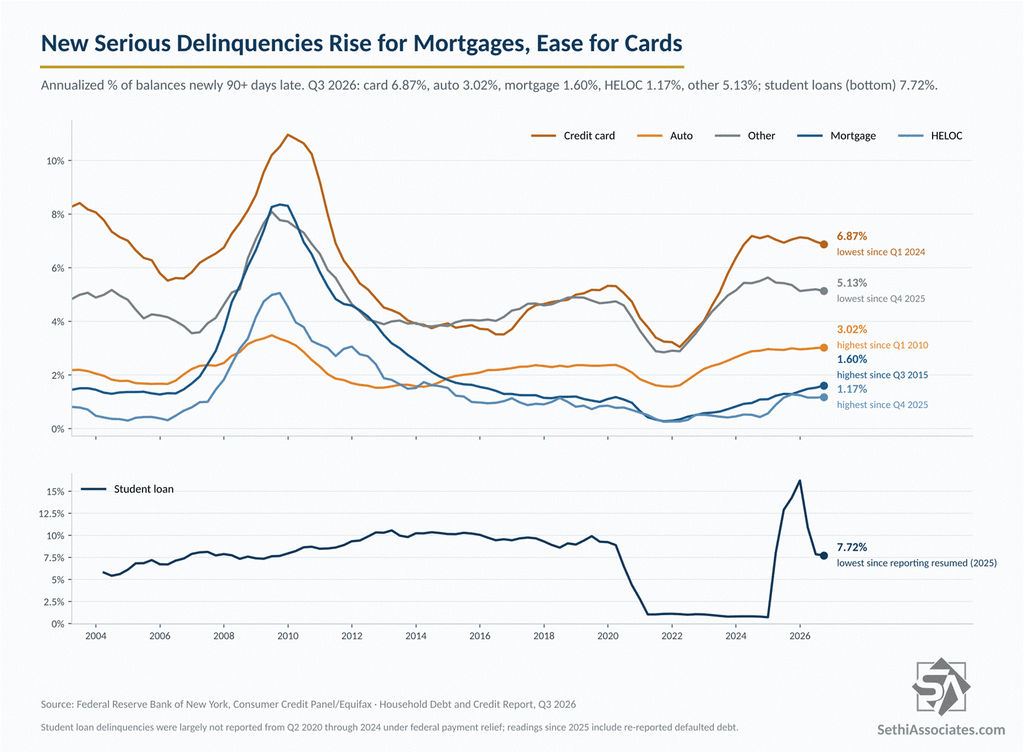
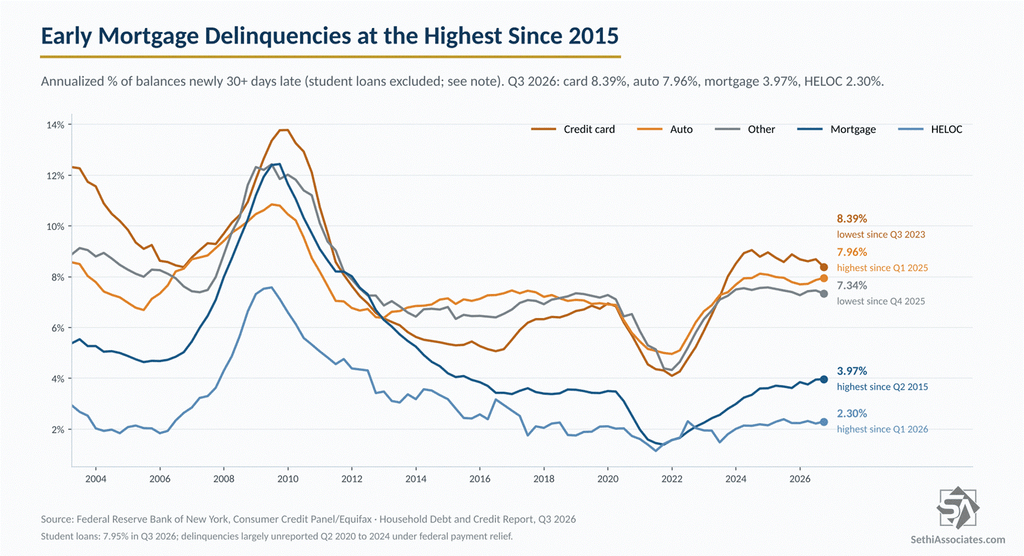
One of the more interesting takeaways is that the rate at which balances are newly becoming delinquent shows a shift in where the stress is building, with mortgages and autos doing most of the worsening at both the early (30 or more days late) and serious (90 or more days late) stages.
For mortgages, the annualized rate of balances newly 30 or more days late edged up to 3.97% from 3.95%, the highest since the second quarter of 2015, and the rate turning 90 or more days late rose to 1.60% from 1.52%, the highest since the third quarter of 2015. Of mortgages that were 30 to 60 days late, 18.32% slid to 90 days or more in the quarter, the highest since the third quarter of 2015, while the share catching up fell to 37.31% from 42.04%.
TransUnion’s third-quarter credit report shows the same trend in a different dataset: the share of mortgage borrowers 60 or more days late rose to 1.64% from 1.36% a year earlier.
Note, though, the rate of new serious mortgage delinquencies is still far below its 8.35% peak in the third quarter of 2009. “Although delinquency transition rates for housing debts have crept up, the overall credit quality of these loans remains strong,” Lee said.
Auto delinquencies also kept grinding higher. The rate of auto balances newly 30 or more days late rose to 7.96% from 7.87%, tied with the second quarter of 2025 for the highest since the first quarter of 2025, and the rate turning seriously delinquent edged up to 3.02% from 3.00%, the highest since the first quarter of 2010.
Cards, though, improved at both stages: the rate of card balances newly 30 or more days late fell to 8.39% from 8.69%, the lowest since the third quarter of 2023, and the rate turning seriously delinquent fell to 6.87% from 6.97%, the lowest since the first quarter of 2024.
There’s a catch on cards, though. TransUnion shows the share of card balances 90 or more days late fell to 1.99% from 2.05% a year earlier, but the share of card borrowers that far behind rose to 2.50% from 2.37%. More people are falling behind, just with smaller balances, so dollar-based measures like the NY Fed’s can flatter the improvement.
The rise in late payments fits with the NY Fed’s October consumer survey, where households’ expected odds of missing a minimum debt payment jumped to 13.8%, the highest since December 2025.
Student Loans Ease, but Remain Elevated
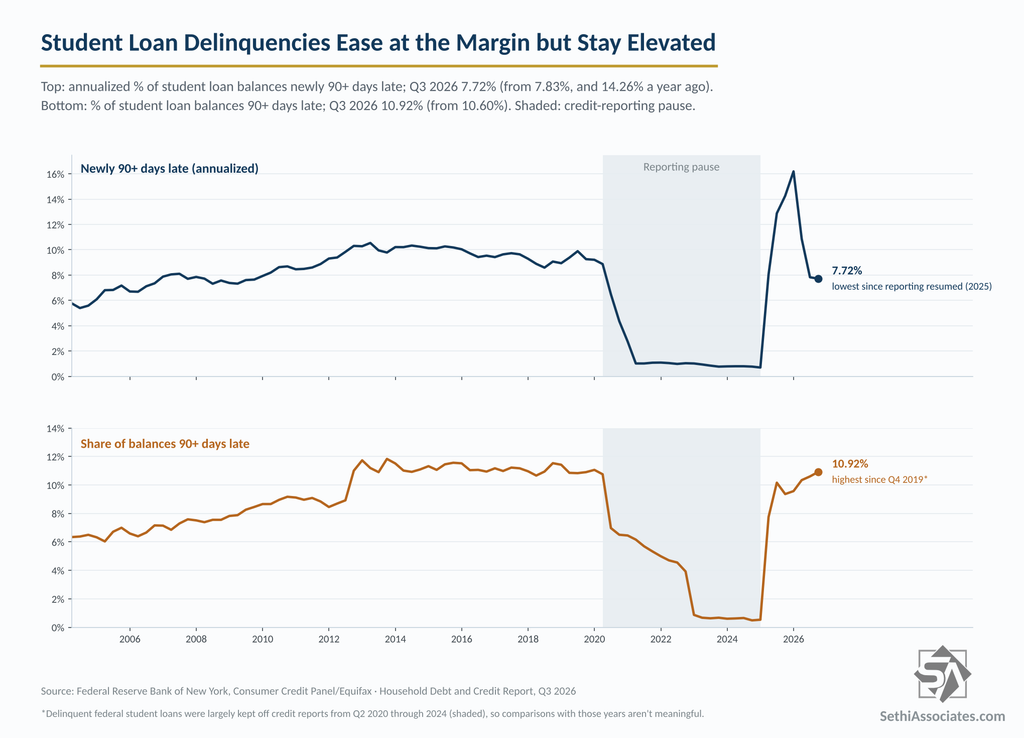
The rate of student loan balances turning seriously delinquent fell to 7.72% from 7.83%, the lowest since delinquencies began reappearing on credit reports in early 2025 and down from 14.26% a year ago. Still, 10.92% of student debt is 90 or more days late, the most since the fourth quarter of 2019, up from 10.60%. Note though delinquent federal student loans were largely kept off credit reports from 2020 through 2024, so comparisons with those years aren’t meaningful.
Foreclosures Pick Up
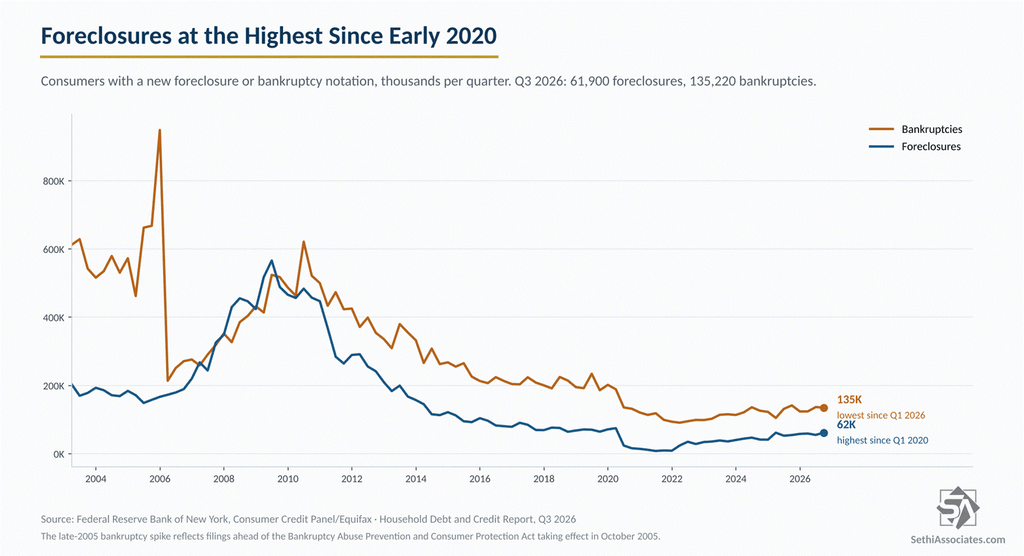
New foreclosures hit 61,900, up from 55,160 and the most since the first quarter of 2020, though that’s a fraction of the 566,200 at the peak in the second quarter of 2009. Bankruptcies slipped to 135,220 from 136,800.
Why Card Trouble Is Easing
A New York Fed Liberty Street Economics post released with the report traces the 2023-24 jump in card delinquencies to cards issued in 2020-22, when lenders extended more cards and credit to borrowers in lower-income neighborhoods. The median credit score at card issuance fell to 688 in that period from 699 in 2017-19, and those cards made up a big share of new delinquencies through 2024.
Cards issued since early 2023 have gone to borrowers with higher scores, and the authors say the elevated delinquencies may prove “more of a pandemic-era echo than a permanent feature of the credit card market.” The gap between low- and high-income neighborhoods has widened since 2022, though, and the post notes high inflation and borrowing costs have squeezed consumers, “with inflation outpacing wage growth for low-income brackets.” The shift to higher-score borrowers lines up with banks in the loan officer survey saying they’re less likely to approve subprime card applicants than a year ago.
More specifically, the gap in serious card delinquency rates between the lowest- and highest-income neighborhoods is 5.93 percentage points, down from a 6.28 peak in the third quarter of 2024 but still well above 4.42 before the pandemic.
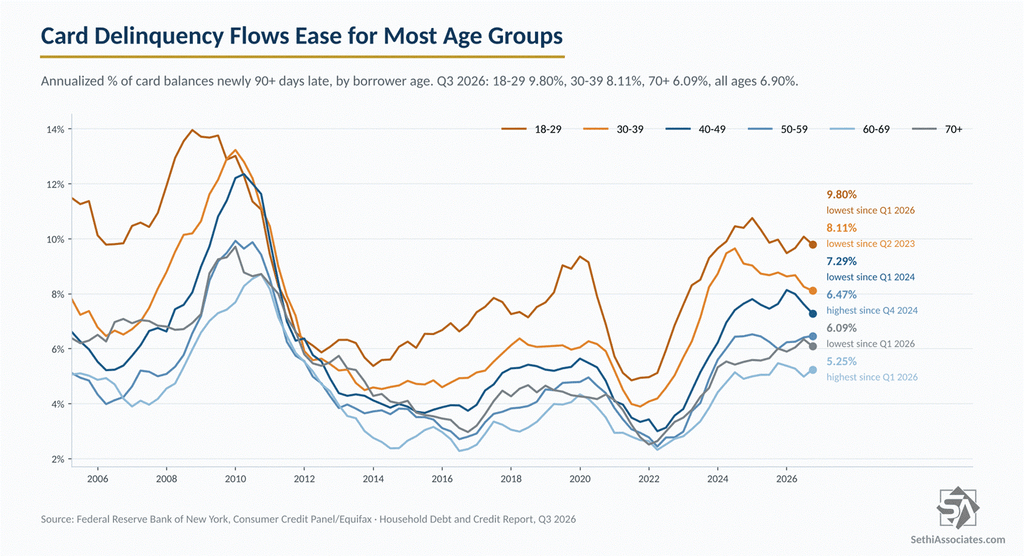
By age, the rate of card balances turning seriously delinquent fell for four of six age groups, though it’s still highest for borrowers 18 to 29 at 9.80%.
What to Watch
The stress in household credit appears to be shifting from credit cards to mortgages and autos, although TransUnion data show more card borrowers falling behind, just on smaller balances. Mortgage delinquencies are still low by historical standards, but the rate of new serious delinquencies has climbed in all but one quarter since late 2021, and fewer late borrowers are catching up. Importantly, card lenders’ newer accounts are performing better, while mortgage and auto lenders are where credit trends are worsening.
Next up are the NY Fed’s SCE Credit Access Survey on November 16 and its November consumer survey on December 7, the first taken after the midterms and the tech selloff.
Source: New York Fed Household Debt and Credit Report, Q3 2026; Liberty Street Economics. Charts are built from New York Fed data.