Here’s My Plan for Evolv After Mixed Q3 Report
Stocks Under $10K holding EVLV reported quarterly earnings; here’s my take, read on the chart and plan.
You've reached your free article limit
You've read 0 of 1 free Pro articles.

Portfolio holding Evolv Technologies (EVLV) posted fiscal third-quarter financial results Tuesday, revealing an adjusted loss per share of $0.02 (unadjusted loss per share of $0.09) on revenue of $47.345 million. While that top-line result exceeded expectations and was good for year-over-year growth of 10.5%, the adjusted bottom-line print just met Wall Street’s expectations. The company ended the quarter with an annual recurring revenue of $140.5 million, which was up 20% from the end of the same quarter a year ago. Remaining performance obligation printed at $325.8 million, up 13.2 million from the end of the prior quarter.
The CEO
“Our third-quarter results reflect the significant progress we have made building a stronger, more scalable and increasingly predictable business. We delivered double-digit revenue growth, with ARR growing faster than revenue, against a challenging prior-year comparison, as last year’s results included the largest contract in our history. We expanded our recurring revenue base and strengthened our renewal and expansion motion highlighted by strong net revenue retention in the quarter,” said John Kedzierski, president and CEO of Evolv Technologies, commented in the press release.
Kedzierski added, “That progress, combined with the investments we are making in sales capacity and product innovation, gives us increasing confidence in the path ahead for 2027 and in the long-term model we outlined at Investor Day, with revenue growth expected to ramp toward an approximately 25% CAGR through 2031.”
‘Evolv-ing’ Operations
As revenue grew 10.5% higher to $47.345 million, the cost of that revenue increased 10.5% to $23.796 million. This left a gross profit of $23.549 million (+10.5%) as gross margin held firm at 49.7%. Unadjusted Operating expenses grew 26.9% to $37.951 million, leaving an unadjusted operating loss of $14.402 million (down from a loss of $8.596 million).
After accounting for interest and other income & expenses, as well as taxes, unadjusted net income/loss landed at a loss of $15.564 million (down from a loss of $1.796 million). That works out to an unadjusted loss per share of $0.09, fully diluted, down from the year ago comparison of a loss of $0.01. After adjustments made, primarily for stock-based compensation and non-recurring legal costs, the loss per share printed at -$0.02 flat from the year ago period.
Guidance
For the full year, Evolv increased the lower end of the prior revenue guidance. Evolv now sees full-year sales of $182 million to $185 million, up from the previously issued outlook for $180 million to $185 million. Wall Street is projecting revenue of $182.4 million, so the midpoint, which is a nice beat. The company still sees full year ended ARR at $148 million to $150 million, but did improve its outlook for full year adjusted earnings before interest, taxes, depreciation, and amortization from $15 million to $16 million to $15.5 million – $16.5 million.
Fundamentals
For the period reported, Evolv generated operating cash flow of $17.962 million. Out of that number, the company spent $14.715 million on capital expenditures and on capitalized internal use software. This left free cash flow of $3.247 million, up from a loss of $11.485 million for the year-ago comparison. Evolv does not return capital to shareholders.
Turning to the balance sheet, Evolv ended the quarter with a cash position of $66.861 million and inventories of $5.793 million. That left current assets at $150.038 million. Current liabilities add up to $137.815 million, including no short-term debt, but $87.385 million in deferred revenue. That puts Evolv’s current and quick ratios at a headline 1.09 and 1.05 respectively. Once adjusted for those deferred revenues, these ratios rise to 2.98 and 2.86 in that order. That’s extremely strong.
Total assets amount to $303.061 million, all of which is tangible. We like that. Total liabilities less equity comes to $195.275 million. There is long-term debt on the books of $28.811 million, which could be covered more than twice over by the company’s cash position. This is an exceptional balance sheet.
My Take and the Chart
There’s a lot of things to like here. Unfortunately, profitability is not one of them. Sales are growing acceptably. ARR is growing nicely. Cash flows are quite strong and have improved greatly. The guidance is positive as well.
Readers will see the “falling wedge” pattern of bullish reversal that stretches all the way from August 2025 into the present. Support was found at the lower trendline of the pattern in mid-October. The stock has been battling around its 21-day exponential moving average trying to get the swing crowd behind the trade. That said, the pivot is now the 50-day simple moving average, which has held fast as resistance.
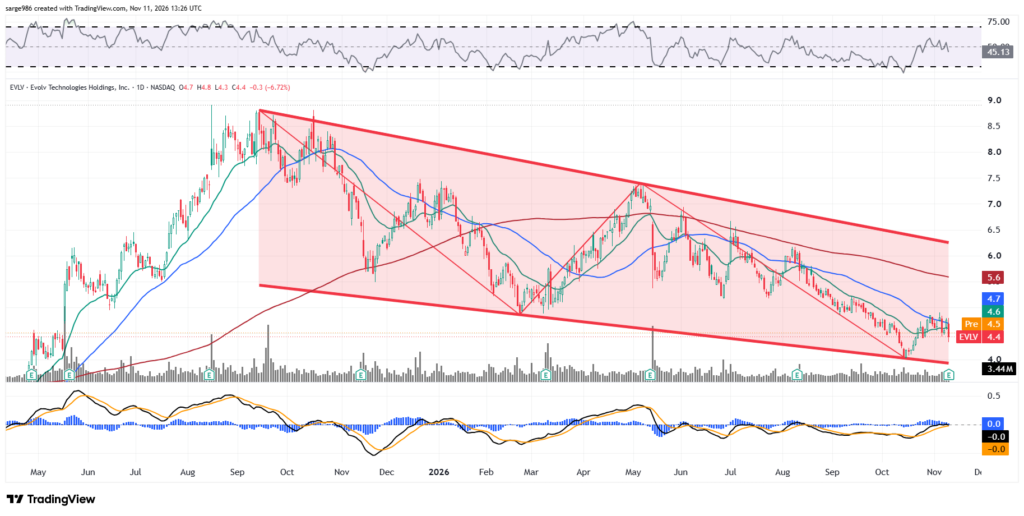
Relative Strength is neutral and has been for a month. The daily moving average convergence divergence, below the chart, has a real chance to impress the bulls. The histogram of the 9-day EMA is already in positive territory with both the 12-day EMA and 26-day EMA trying to get there. If those two lines can do that with the 12-day line above the 26-day line, that would be a bullish signal. The portfolio is reiterating its $7.50 target price on EVLV.
Upcoming Portfolio Earnings…
Ondas Inc (ONDS), Friday, Nov. 13
Consensus: adjusted loss per share of $0.09 on revenue of $148.1 million.
Tuesday’s Intentions vs. Actual Trades
- No trades intended.
Wednesday’s Intentions
- Purchase 25 shares of EVLV at or close to the last sale of $4.56.
Current Positions
Long 80 shares of ASPN at $5.0263. Target Price: $8. Last sale: $5.90.
Long 50 shares of EVLV at $5.33.92. Target Price: $7.50. Last sale: $4.56.
Long 200 shares of OCUL at $7.7263. Target Price: $10. Last sale: $6.98.
Long 330 shares of ONDS at $7.5402. Target Price: $12. Last sale: $5.88.
Long 100 shares of PTON at $5.2708. Target Price: $9. Last sale: $5.81.
Long 20 shares of RKLB at $50.942. Target Price $84. Last sale: $62.79.
Long 150 shares of SOFI at $15.947. Target Price: $24. Last sale: $16.64.
Cash: $465.31.
Portfolio Value: $8,837.34, -11.6% from inception on March 24.
At the time of publication, Guilfoyle was long ASPN, EVLV, OCUL, ONDS, PTON, RKLB, SOFI.