My Two Wishes for This Market
Stocks keep finding somewhere to hide. Here’s why that needs to stop. Let’s also look at Meta, Citi, TLT, drone ETFs and more.
You've reached your free article limit
You've read 0 of 1 free Pro articles.

The Market
I have two wishes for this market. Yes, only two!
The first is that we get a flush to the downside. Something to send the market from a little anxious to panic. The second is that we stop this Either/Or situation we’ve been in since May. The two are related.
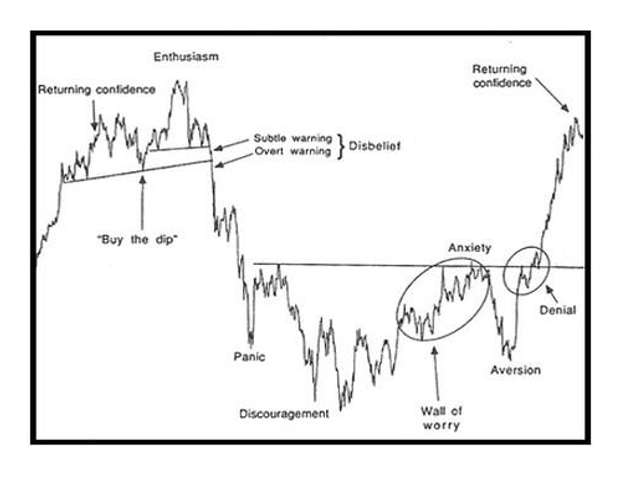
We can begin with the first. You see I think on that chart of the Sentiment Cycle I think we are somewhere just to the right of the words, “Buy the dip.” Thus a flush to the downside gets us to “Panic.”
The sentiment indicators are all so close. It would not take much to get more bears than bulls in the Investors Intelligence survey. It would not take much to get the put/call ratio up over 1.0. And so on. By now you know the list.
Then there is the Either/Or Market. These two are related because in my experience getting panic requires market participants to feel there is nowhere to run and hide. But in an Either/Or Market folks seemingly just keep hiding in one area or the other.
If the semis are up, then chances are drugs and/or staples are down. And vice versa. So what we end up with is a market that has gone absolutely nowhere since May. It’s a market with no trend. And this constant rotation may be keeping the indexes from collapsing but it is not sustainable. Well I suppose if we look at the late 1970s we see we had a similar market in that we went nowhere. For years.
Let that sink in for a minute. Years. Not months. Years.
Absent a flush, I suspect we are set to see the “others’ roll back over sometime near Thanksgiving, which the calendar says is just over a week away.
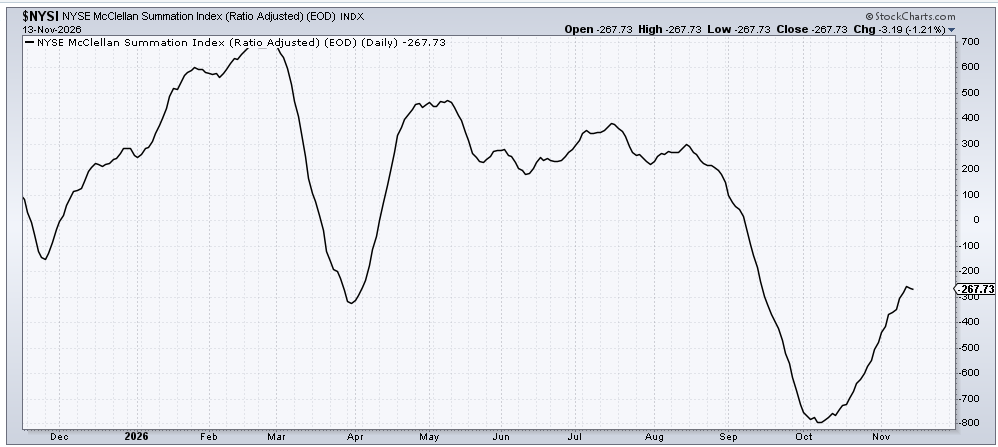
The 30-day moving average of the advance/decline line is already overbought. The Volume Indicator tagged 51% last week. It gets overbought in the mid-50s so it is close now. But just getting overbought is not a reason to think they roll over. The reason I think they roll back over is the McClellan Summation Index has stopped going up.
It won’t take much to turn it back up (a net differential of +100 advancers minus decliners on the NYSE) but if it’s already teetering, then a sharp down day will push it over. And since breadth has already been positive for six of the last 10 trading days, it’s not as though it has been absorbing a lot of downside action in the last two weeks.
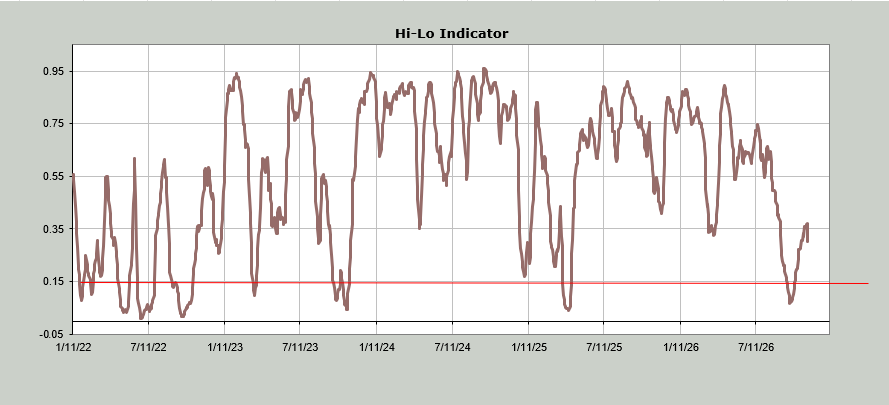
Then there are the stocks making new lows. They have begun to expand. That in turn has caused the Hi-Lo Indicator to roll over. The chart is below.
Generally speaking, once we begin to see the others falter we tend to see a dip and one more push back up but having been bullish on the others since early October, I’m going to be much more selective there.
New Ideas
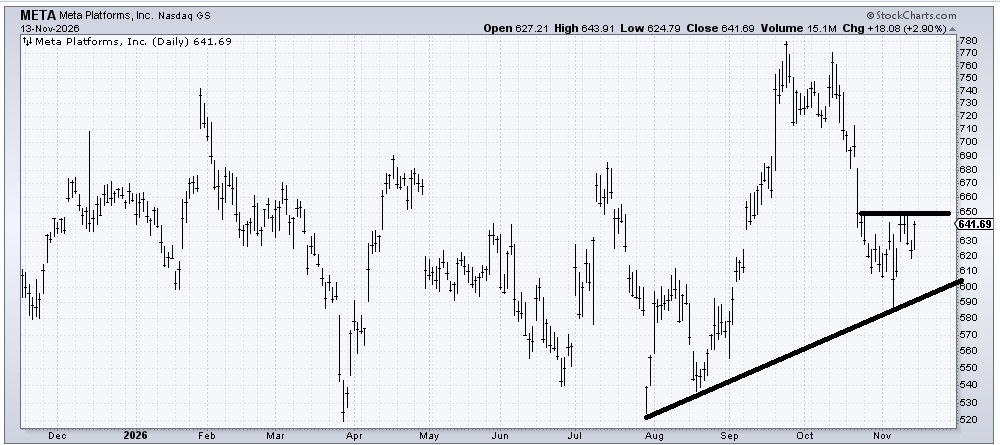
I recommended Meta (META) about a week ago when it bounced off that line with that spike low. I think it will get up and over $650 (flat line) although it may take some time. If the stock comes back down first, it is my belief that it would just test that spike low. I think over $650 and everyone gets excited. Back down near $600 and we might get a mini panic. I still like the chart.
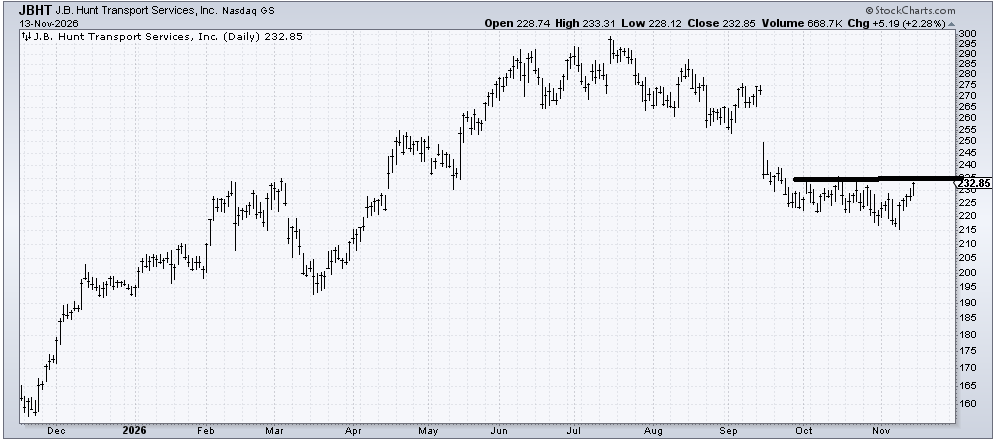
Last week I recommended J.B. Hunt Transport Services (JBHT) for a trade. It’s actually held up pretty well. If it cannot get over $235 soon (it is an “other”!) I would head for the hills.
Insert jbht here.
Today’s Indicator
The Hi-Lo Indicator is discussed above.
Q&A/Reader’s Feedback
Helene welcomes your questions about Top Stocks and her charting strategy and techniques. Please send an email directly to Helene with your questions. However, please remember that TheStreet.com Top Stocks is not intended to provide personalized investment advice. Email Helene here.
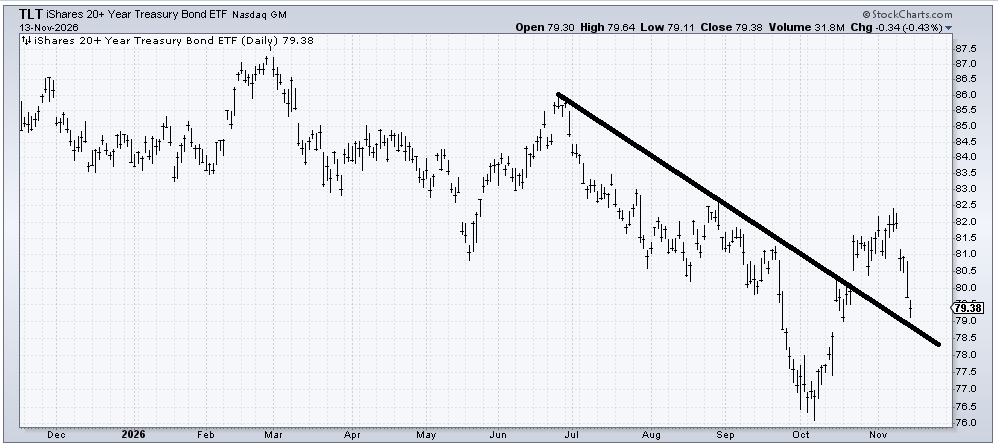
I am quite surprised at the collapse in the iShares 20+ Year Treasury Bond ETF (TLT) over the last week. I had thought it would pull back, but not so hard and fast. It is getting oversold and has support at that line so I would expect a rally from there. If that rally cannot get up and over $80.50 I will have to view myself wrong to think the bonds have bottomed.
Of note, the equity-related bond proxies like the Utes, REITs, Homies, Staples, etc. have not seen commensurate selling. If they play catch up, that would be another reason the “others” are set for a pullback in the coming weeks.
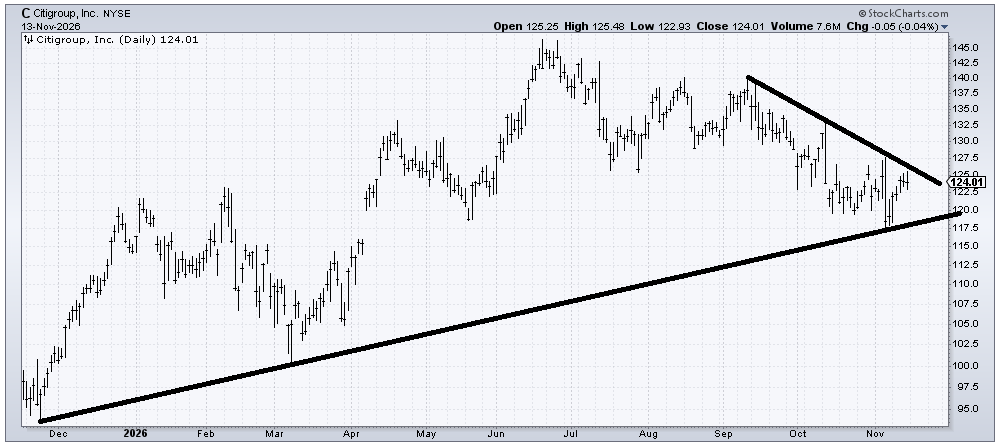
I had been a fan of Citigroup (C) for quite some time but in September when it came under that $125 area I got out as it had broken the twin lows from July. Several weeks ago I said I preferred JPMorgan Chase (JPM) for a trade only. Citi may rally over that downtrend line but look at all that resistance it has to eat through now. If you want to buy it, then the stop is obviously under that $117 low from last week.
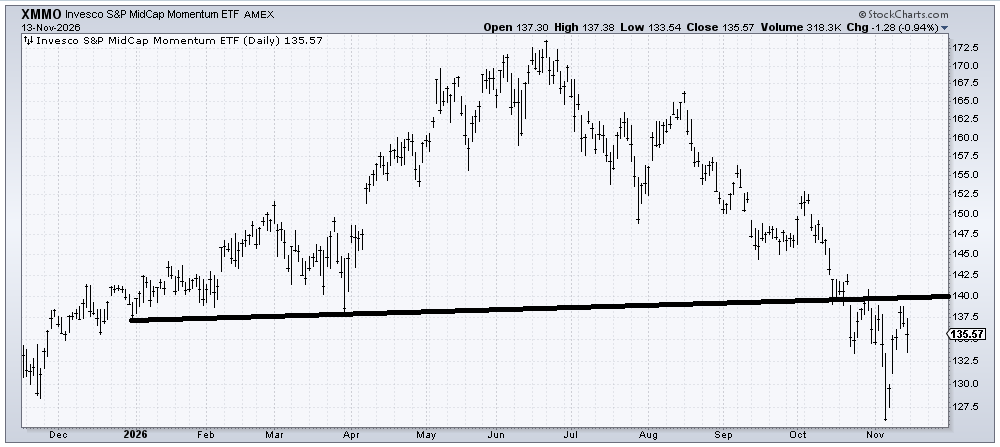
My initial thought when I looked at the Invesco S&P MidCap Momentum ETF (XMMO) was maybe that is a head-and-shoulders bottom forming. If it is then it has to hold over $132. But it is a long road back to get over $140 and start chewing through that resistance. It needs to make a higher high to convince me and that is something it hasn’t done since August, or really June.
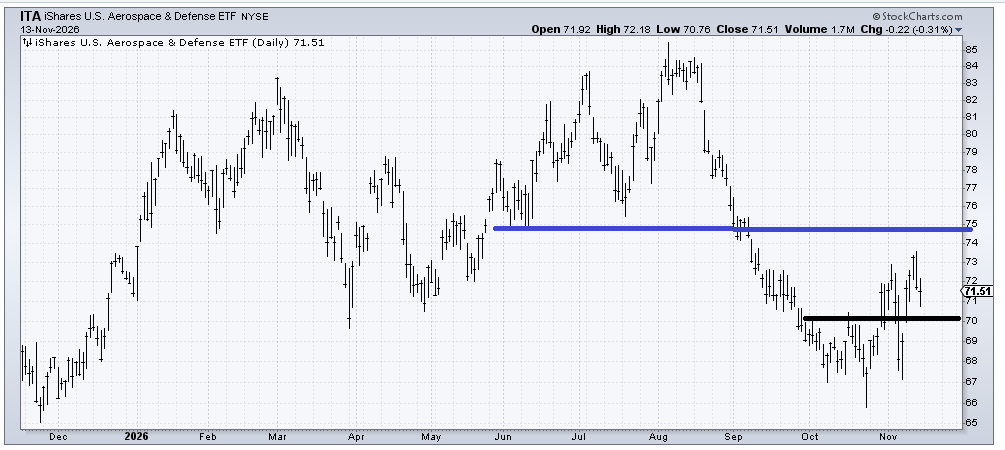
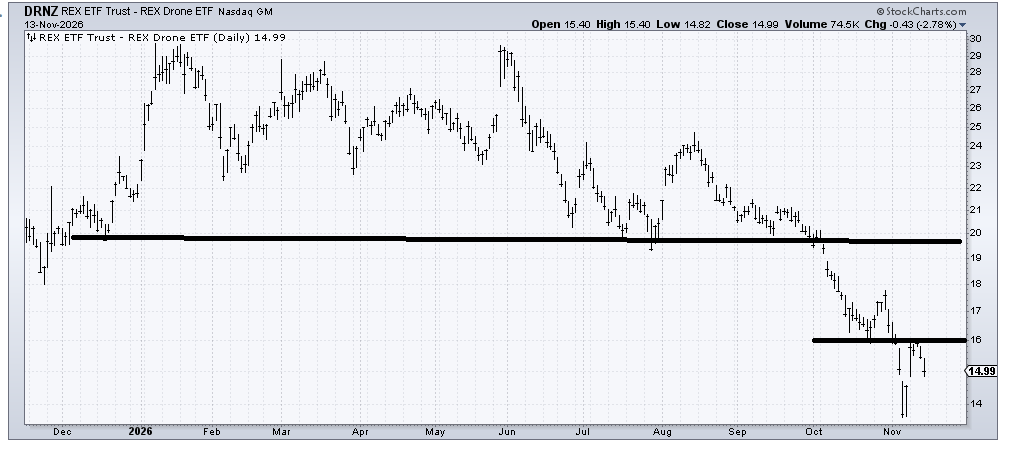
The next two ETF charts trade very thinly and are related so I will take them together. And I will remind you that I recommended the iShares U.S. Aerospace & Defense ETF (ITA) several weeks ago when it had that reversal at the lows.
The concept of REX Drone (DRNZ), a drone ETF, is a good; the chart is not. A rally over $16 would at least tell us the sellers are not showing up at every rally. Until then, I’d only be interested in it if the market got oversold.
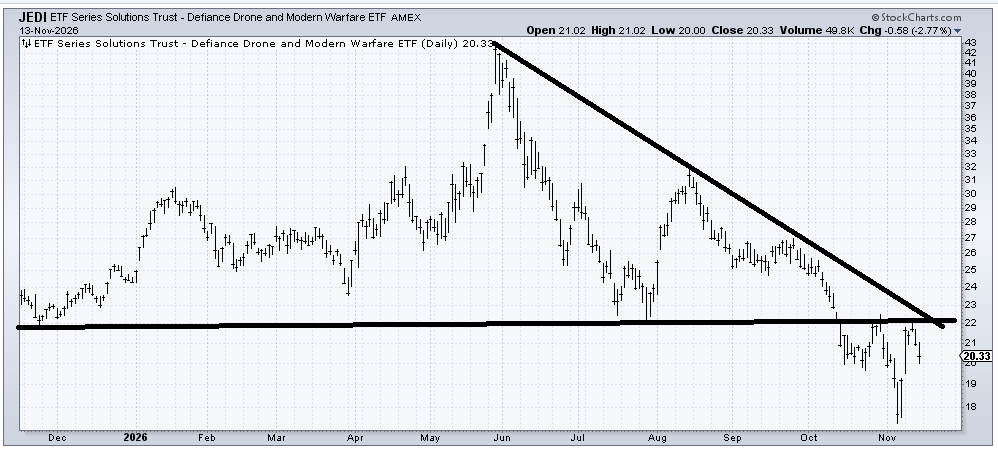
Next up is the Defiance Drone and Modern Warfare ETF (JEDI). Maybe this is the right shoulder of a head-and-shoulders bottom (under $20 and it is no longer a possible pattern), but all that resistance overhead is going to take a very long time to chew through. In a better market I’d bottom fish this for a year-end rally. In this market all I’d say is crack under $20-ish and I’m not interested.
ITA still has higher highs and higher lows after that reversal but having already had a 10% rally it’s hard to get excited over it now. Under $69 and I’d be gone since I think the best it can do in the near term is the blue line at $74-75.