Friday’s Charts – Stocks Notch Best Week Since August, Even as the 2-Year Jumps Most Since 2024
The Nasdaq Composite and Nasdaq-100 fell back to their 200-DMAs.
You've reached your free article limit
You've read 0 of 1 free Pro articles.

This is the companion to tonight’s evening update (Chips Slide Again, but the S&P 500 Still Ends the Week Up 2.5%).
In short, while the Tech pullback deepened Friday, the major indices again finished well off their lows and held onto solid weekly gains, the best since early August.
Note on all charts the colored lines are moving averages (the average price over the lookback period — days on the daily charts, weeks on the weekly charts):
20 = green
50 = purple
100 = blue
200 = brown
MACD = Moving average convergence/divergence line, a measure of momentum that compares longer term and shorter term momentum to gauge if a move is strengthening or weakening. This is probably my favorite individual indicator.
RSI = Relative Strength Index (basically what it sounds like) = measures the strength of the move comparing gains to losses over the given lookback window (I use the standard 14 periods).
The weekly charts show only the 50-week moving average (purple).
S&P 500
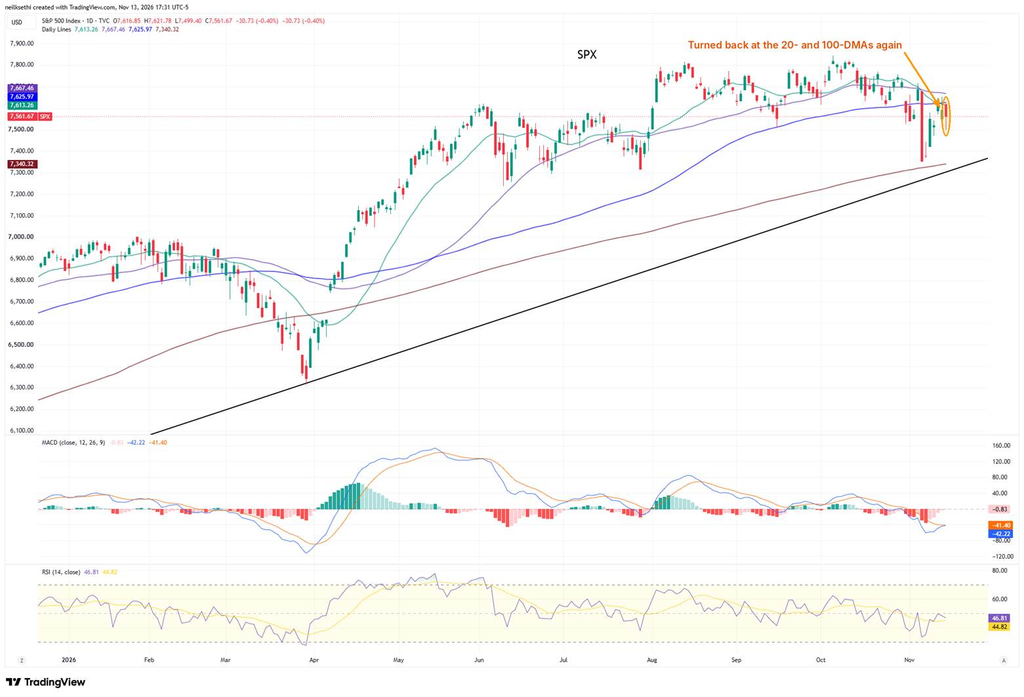
The S&P 500 fell 0.40% to 7,562 after topping out at 7,622 in the first minutes, right at its 20- and 100-DMAs (7,613 and 7,626), and dropping as low as 7,499. That left it below both, as well as its 50-DMA (7,667), for a third day, though it remains well above its 200-DMA (7,340). The MACD remains in “go short” positioning, though it’s on the verge of crossing back more positively, and the RSI is at 47.
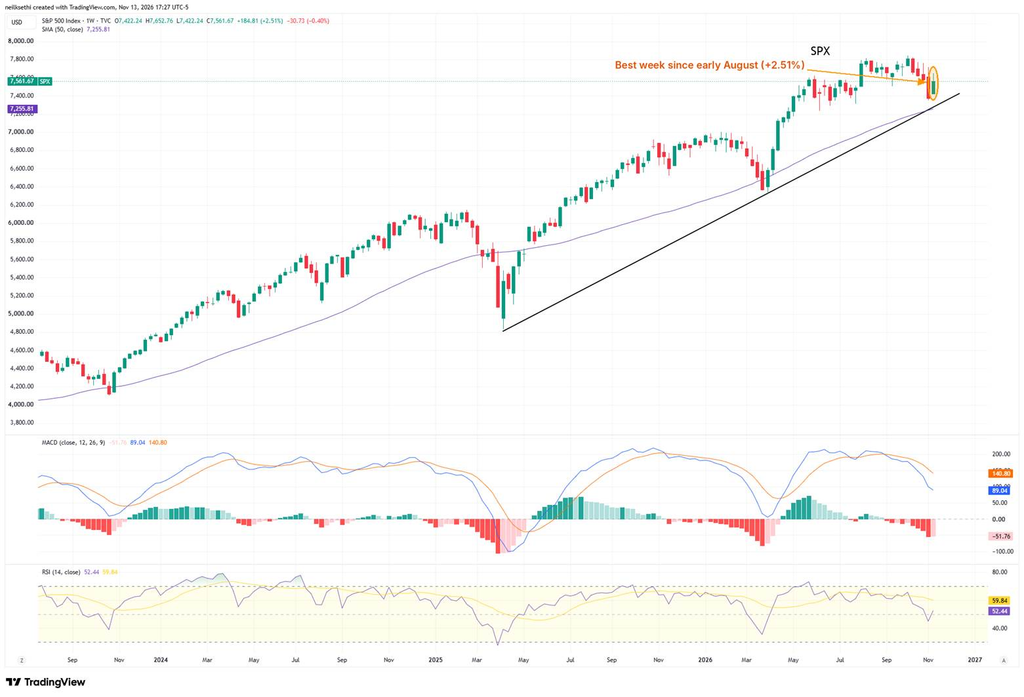
On the weekly chart, the S&P 500 rose 2.51%, its best week since early August, holding above its 50-week MA (7,256) and the uptrend line from the April 2025 low it came close to last week. The weekly MACD though remains in “sell longs” positioning, and the RSI is at 52.
Nasdaq Composite
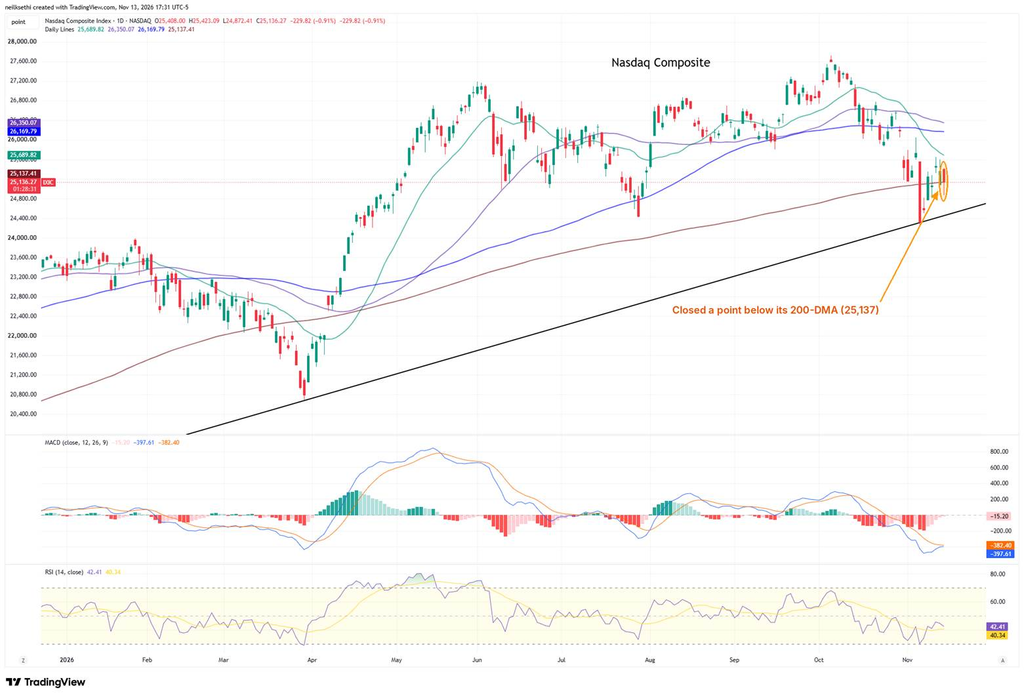
The Nasdaq Composite fell 0.91% to 25,136 after dropping nearly 2% to 24,872, closing just a point below its 200-DMA (25,137) after finishing back above it Thursday. It’s still below its 20-, 50- and 100-DMAs (25,690, 26,350 and 26,170) as well. The MACD remains in “go short” positioning, and the RSI is at 42.
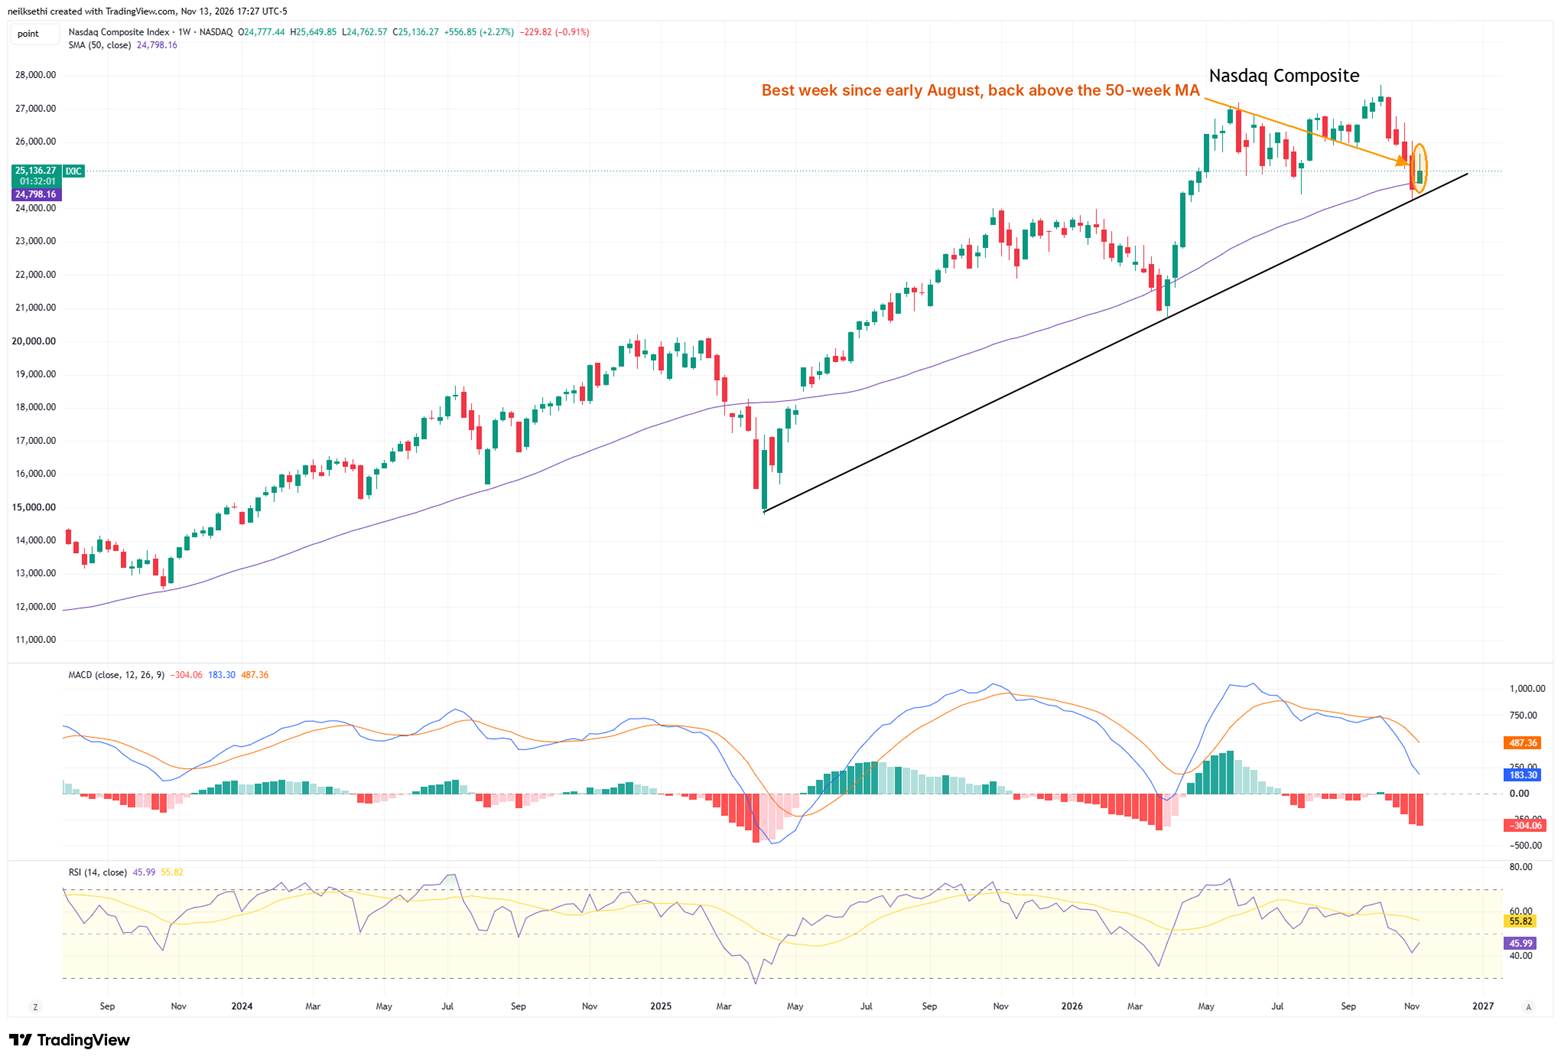
On the weekly chart, the Composite rose 2.27%, its best week since early August, getting back above its 50-week MA (24,798) after closing below it last week for the first time since March. The weekly MACD is in “sell longs” positioning, and the RSI is at 46.
Nasdaq-100 (QQQ)
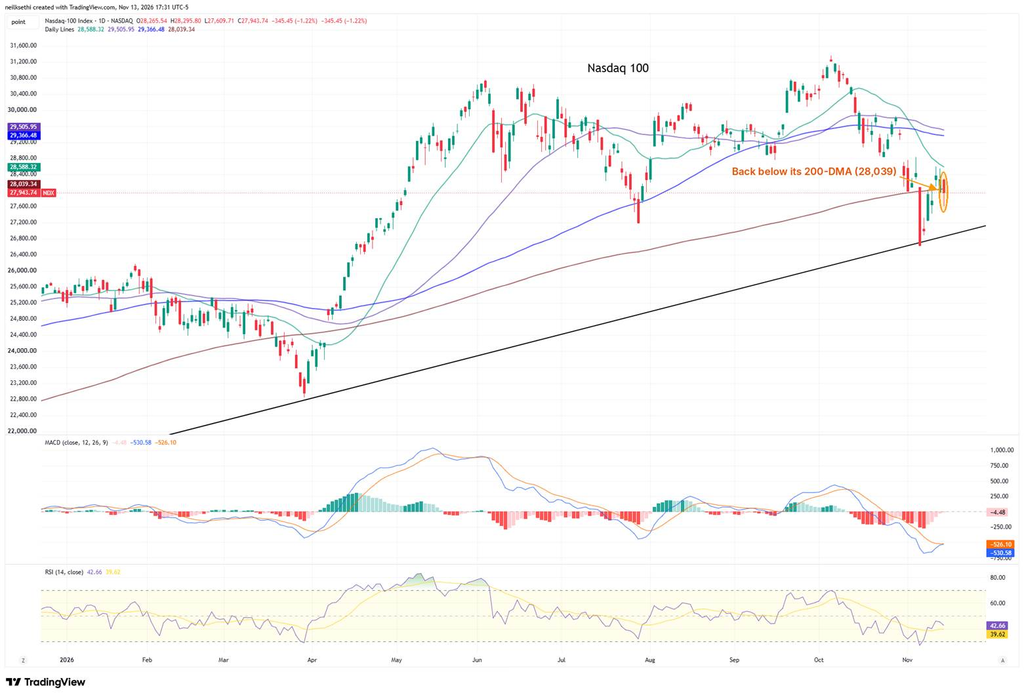
The Nasdaq-100 fell 1.22% to 27,944, its worst day since November 5, after dropping as much as 2.4% to 27,610, closing back below its 200-DMA (28,039) after two days above it. It’s still below its 20-, 50- and 100-DMAs (28,588, 29,506 and 29,366) as well. The MACD remains in “go short” positioning, and the RSI is at 43, so still a lot of work to do.
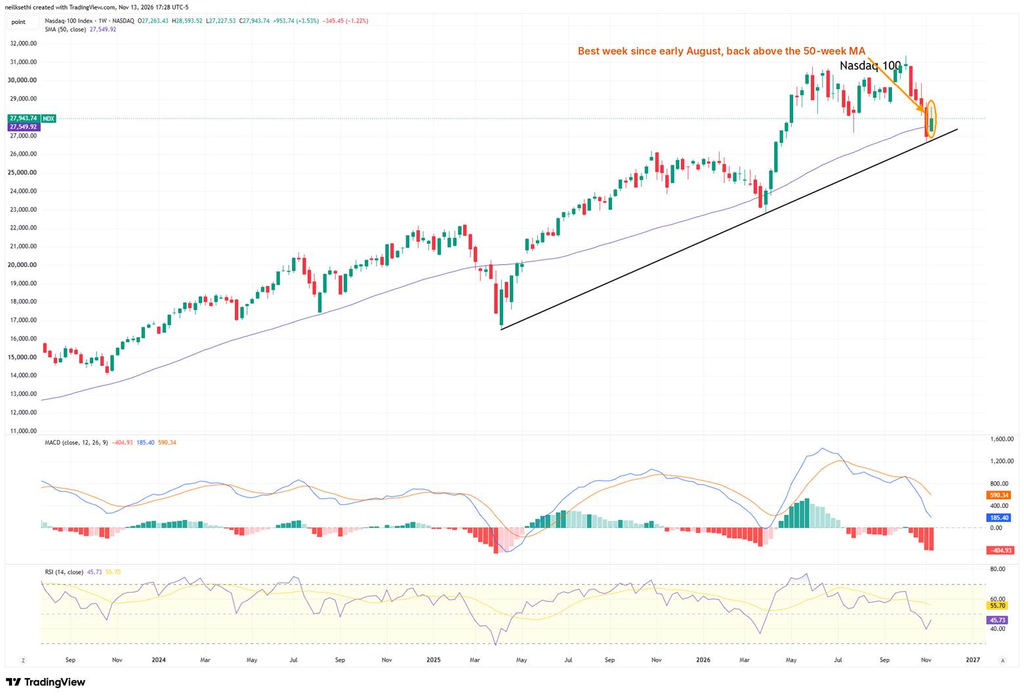
On the weekly chart, the Nasdaq-100 rose 3.53%, its best week since early August, closing back above its 50-week MA (27,550) after testing the uptrend line from the April 2025 low last week. The weekly MACD though remains solidly in “sell longs” positioning, and the RSI is at 46. So both daily and weekly charts are weak.
Russell 2000 (RUT)
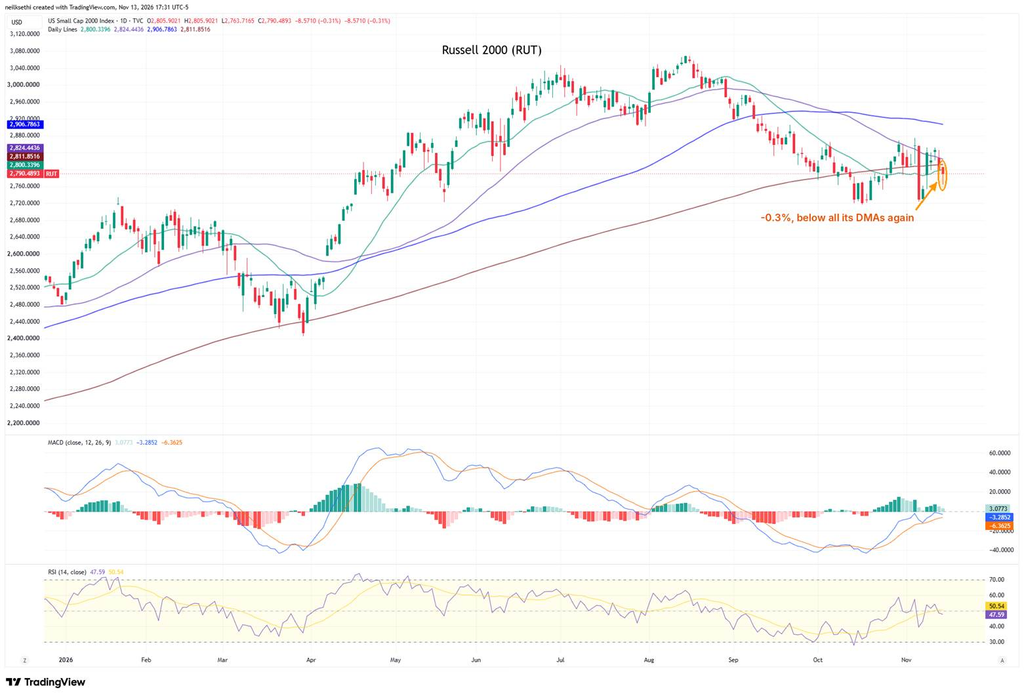
The Russell 2000 fell 0.31% to 2,790 after opening at its high of the day (2,806) and dropping as low as 2,764, slipping below its 20-DMA (2,800) and remaining below its 50-, 100- and 200-DMAs (2,824, 2,907 and 2,812). The MACD remains in “cover shorts” positioning, and the RSI is at 48.
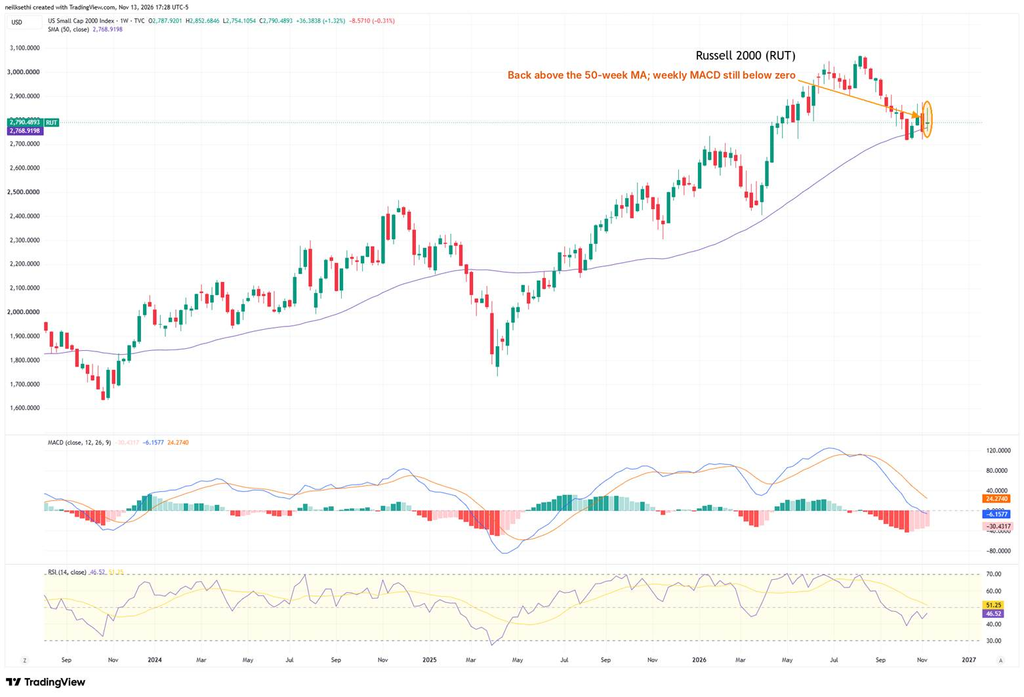
On the weekly chart, the Russell 2000 rose 1.32%, closing back above its 50-week MA (2,769), but the weekly MACD remains below zero in “go short” positioning, and the RSI is at 47. So we don’t have the weekly chart confirming the daily yet.
Equal-weighted SPX (RSP)
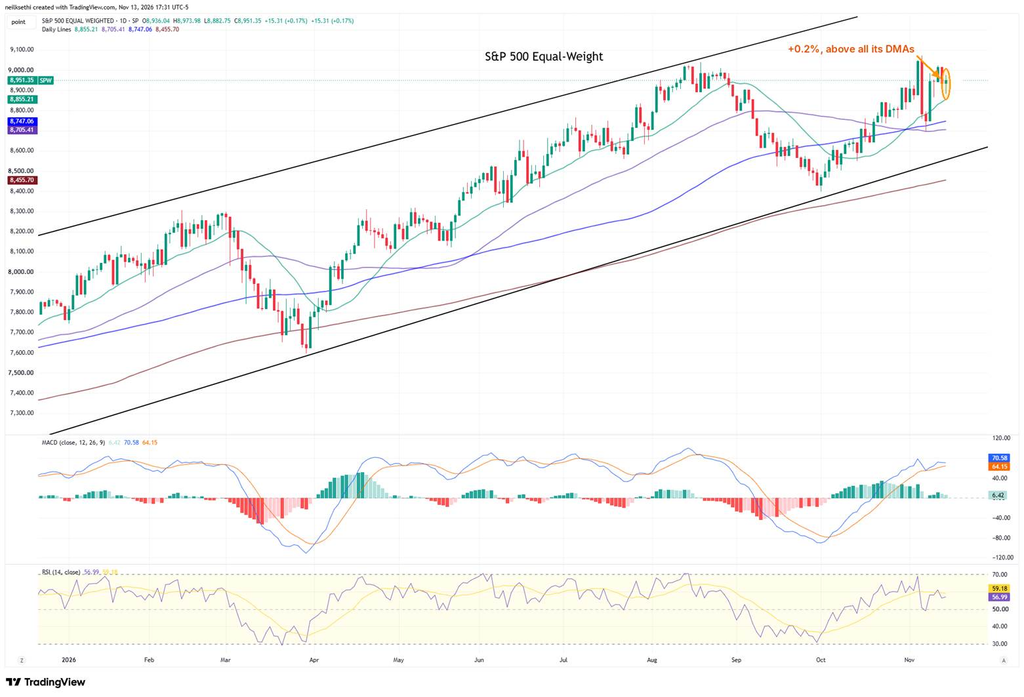
The equal-weighted S&P 500 rose 0.17% to 8,951, outperforming the cap-weighted index for the first time in three days after recovering from an early dip to 8,883, and it remains above all its DMAs, including the 20-DMA (8,855). The MACD remains in “buy longs” positioning, and the RSI is at 57.
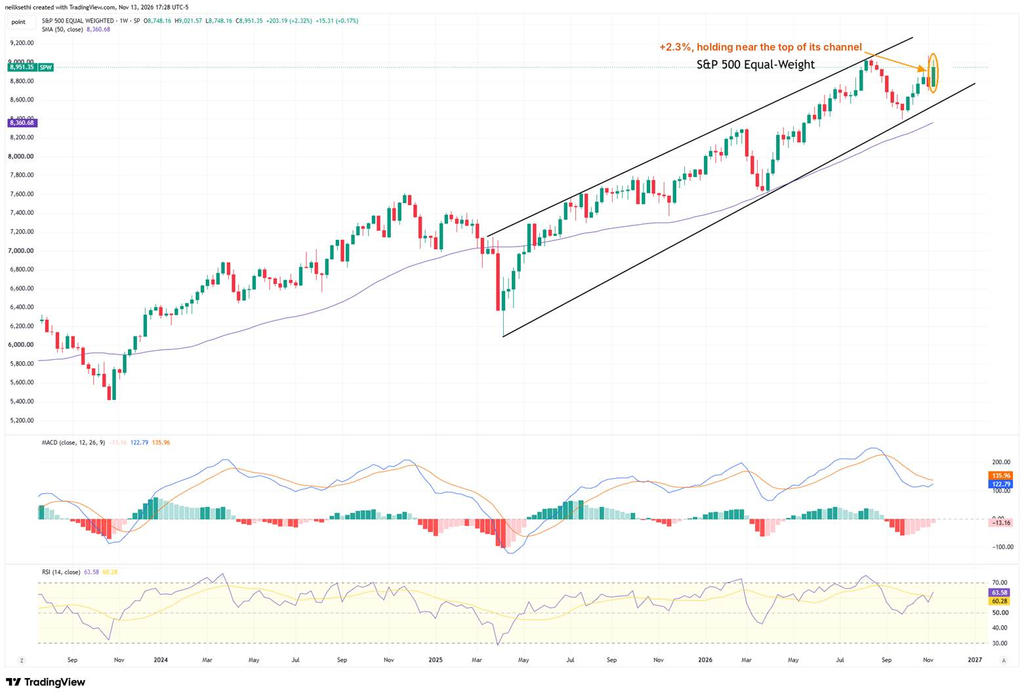
On the weekly chart, it rose 2.32%, holding in the channel it’s been in since April 2025. The weekly MACD is in “sell longs” positioning, but is close to crossing more positively, and the RSI is at 64, so definitely the best daily/weekly pair of the bunch.
2-year Treasury yield
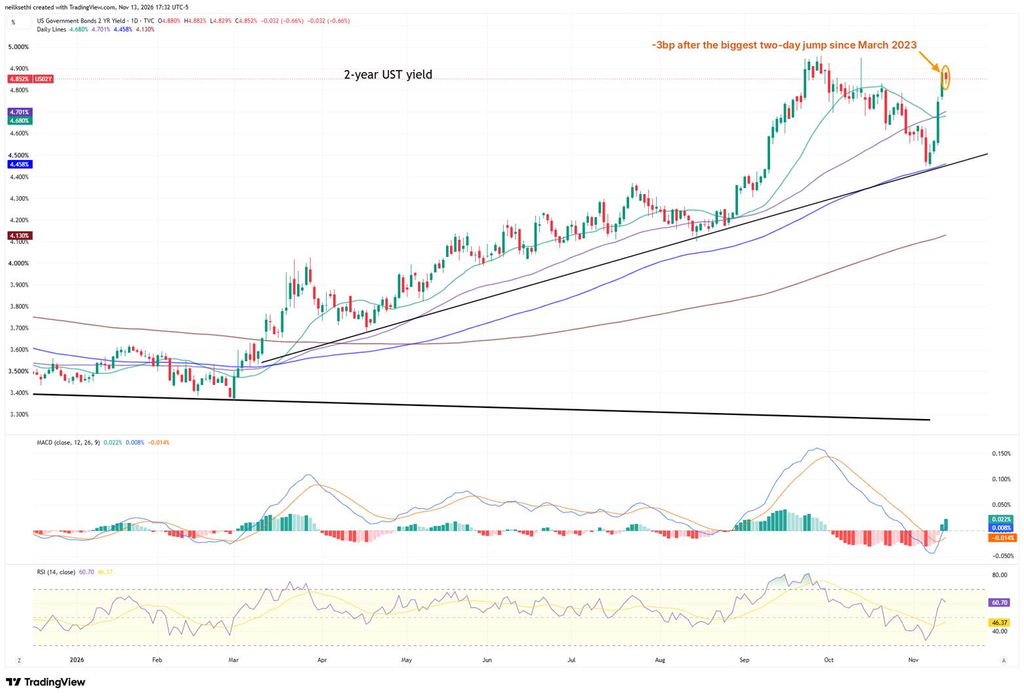
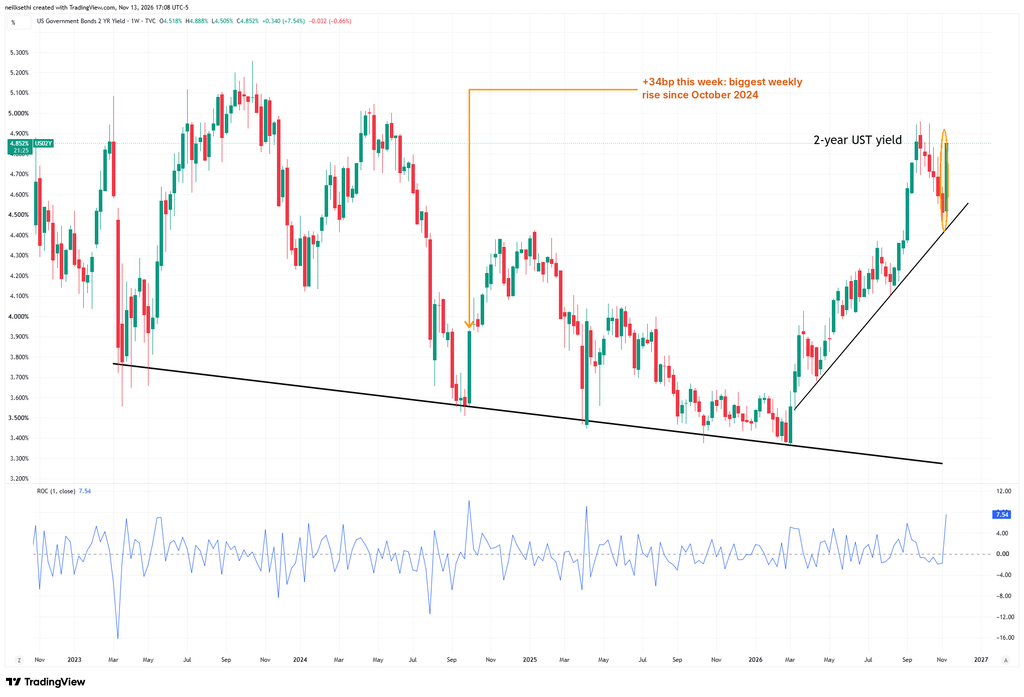
The 2-year yield slipped 3.2 basis points to 4.85% after its biggest two-day jump since March 2023, but it rose 34bp for the week, its biggest weekly gain since October 2024. It remains above its 20- and 50-DMAs (4.68% and 4.70%) and about 98bp above the midpoint of the Fed funds target range (3.875%). The MACD has crossed above zero to “buy longs” positioning, and the RSI is at 61. If this were a stock, I’d want to buy it on a pullback.
10-year yields
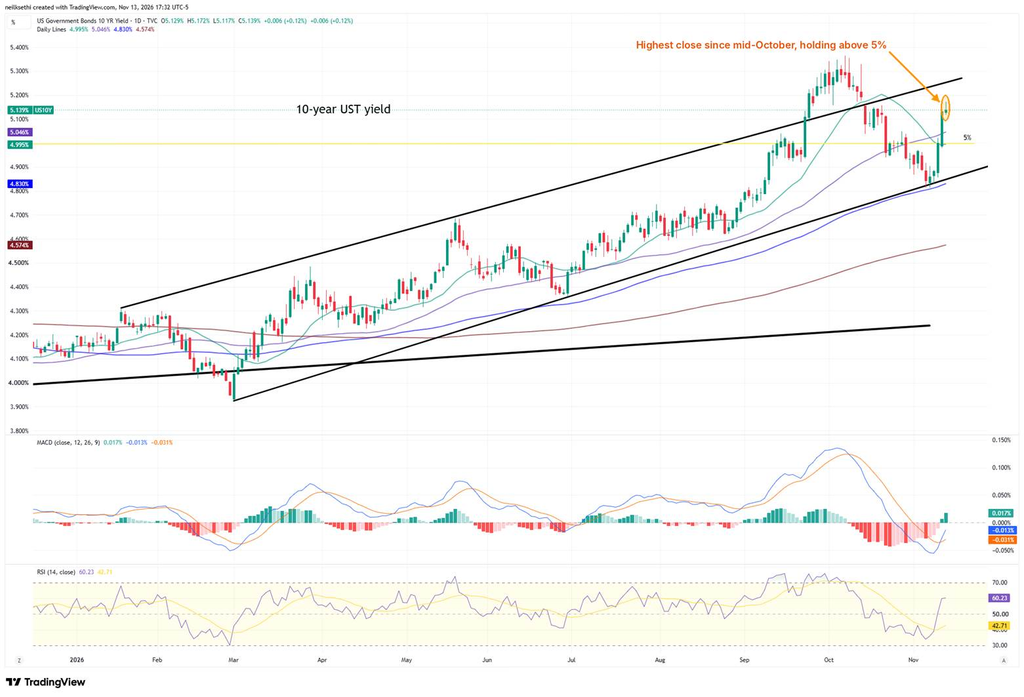
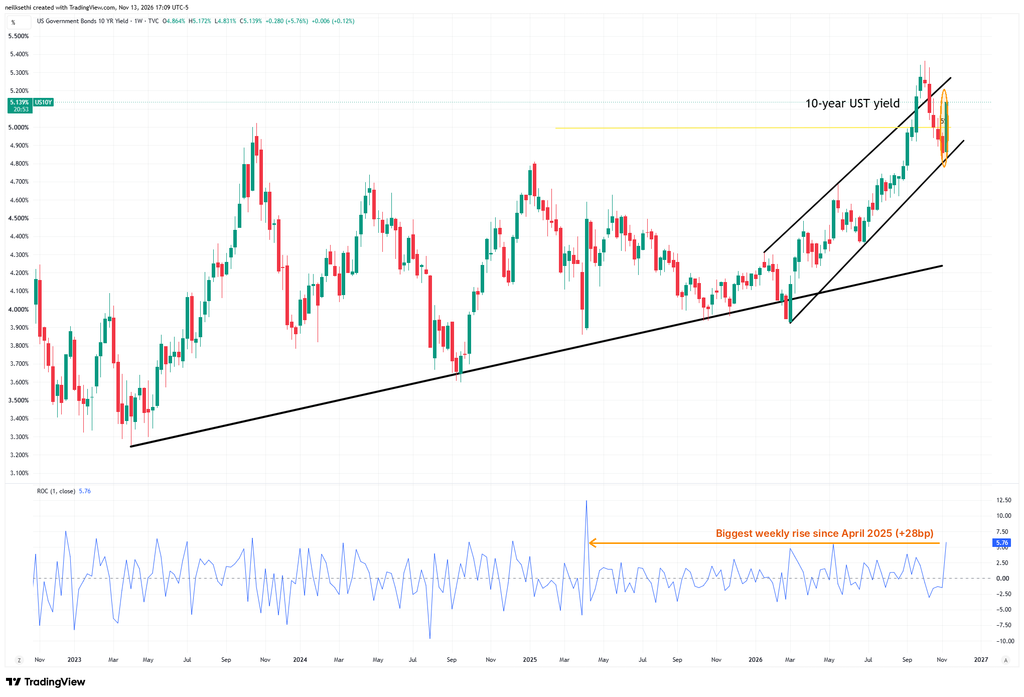
The 10-year yield edged up 0.6 basis points to 5.14%, its highest close since mid-October, after touching 5.17% intraday, holding above 5% and all its DMAs, including the 20-DMA (5.00%). It rose 28bp for the week, the most since April 2025. The MACD remains in “cover shorts” positioning, and the RSI is at 60. Another bullish chart (for higher yields).
30-year yields
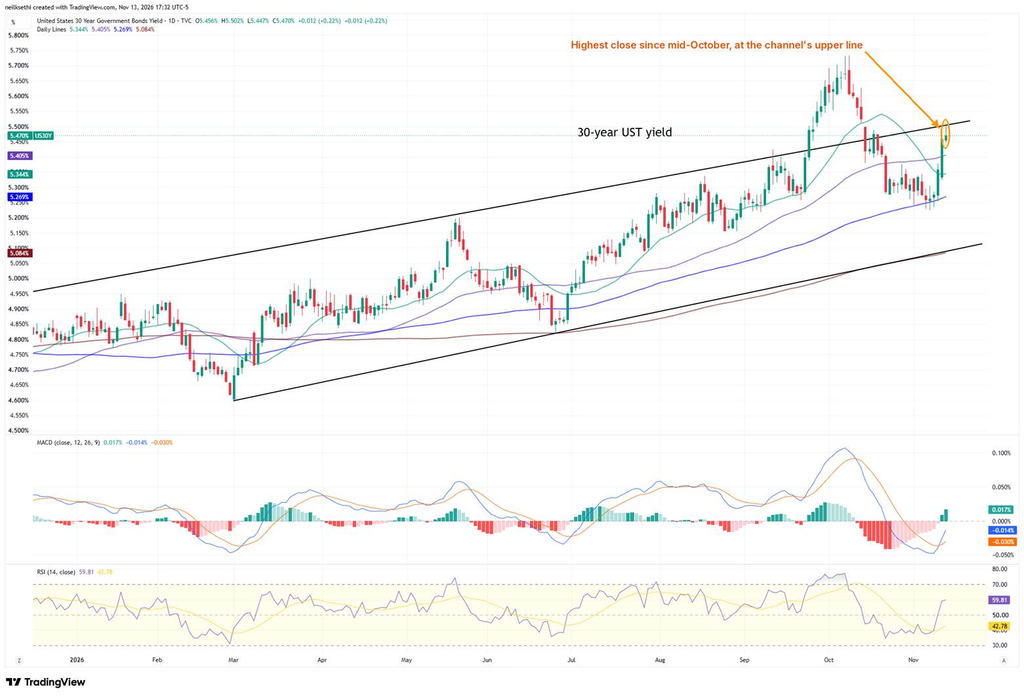
The 30-year yield rose 1.2 basis points to 5.47%, its highest close since mid-October, after topping out at 5.50% right at the upper line of the channel it fell back into in mid-October. It’s above all its DMAs and rose 21bp for the week, the most since April 2025. The MACD remains in “cover shorts” positioning, and the RSI is at 60.
VIX
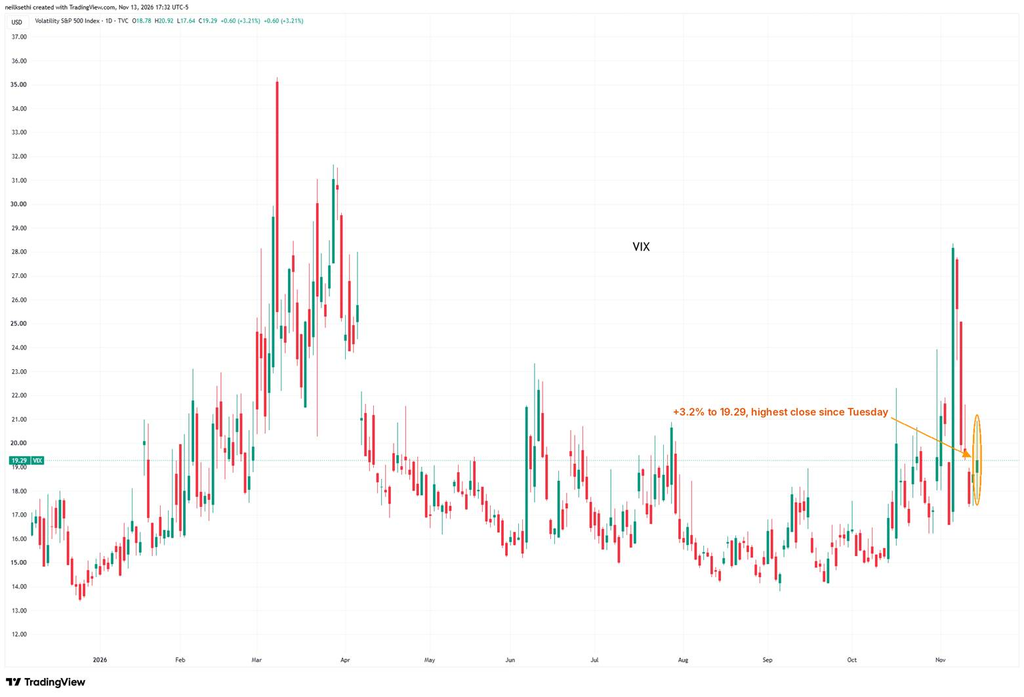
The VIX rose 3.21% to 19.29 after topping 20 intraday (20.92), its highest close since Tuesday, but it fell 25% for the week. It now implies a daily move of about 1.22% over the next 30 days.
VVIX
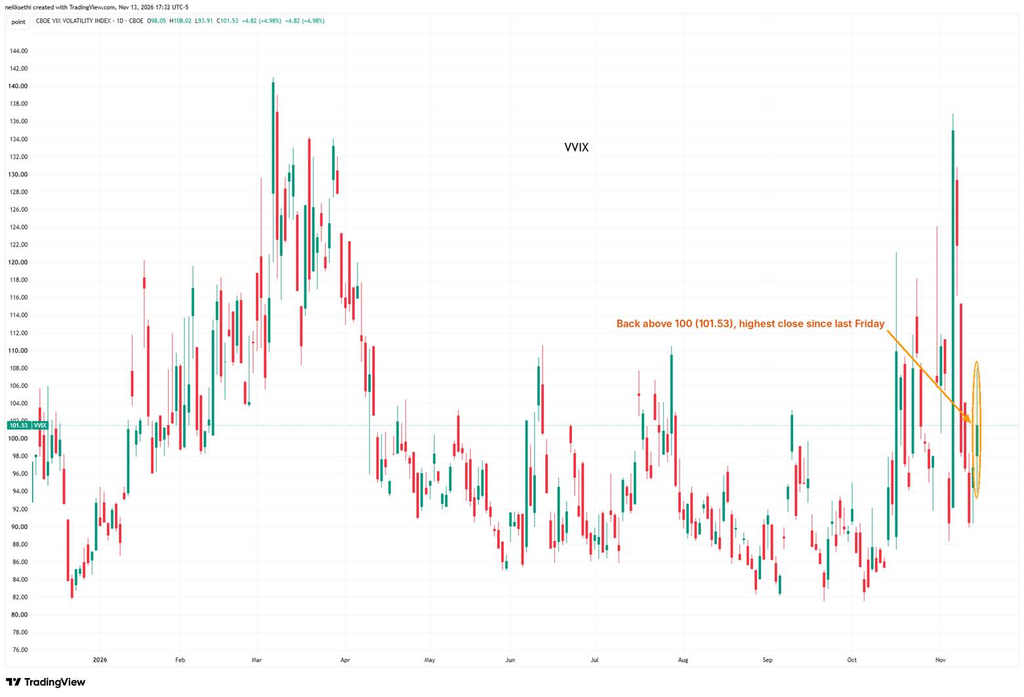
VVIX (the VIX of the VIX) rose 4.98% to 101.53 after topping out at 108.02, its highest close since last Friday, taking it back above the 100 level flagged by Charlie McElligott as indicating higher stress. The current level is consistent with “elevated” daily moves in the VIX over the next 30 days (historically, normal is 80-100, although we haven’t been below 80 since July 2024).
1-day VIX
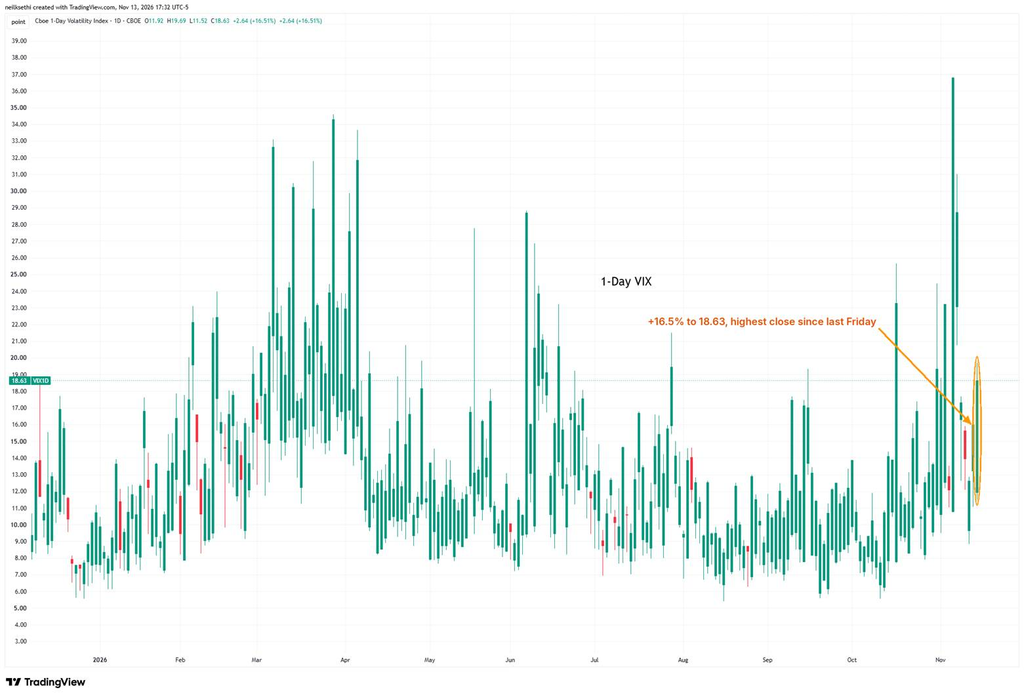
Thursday’s 1-day VIX implied a move of about 1.01% for Friday, and the S&P 500 fell 0.40%. The 1-day VIX then rose 16.5% to 18.63, its highest close since last Friday, implying a move of about 1.17% for Monday.
WTI futures (/CL)
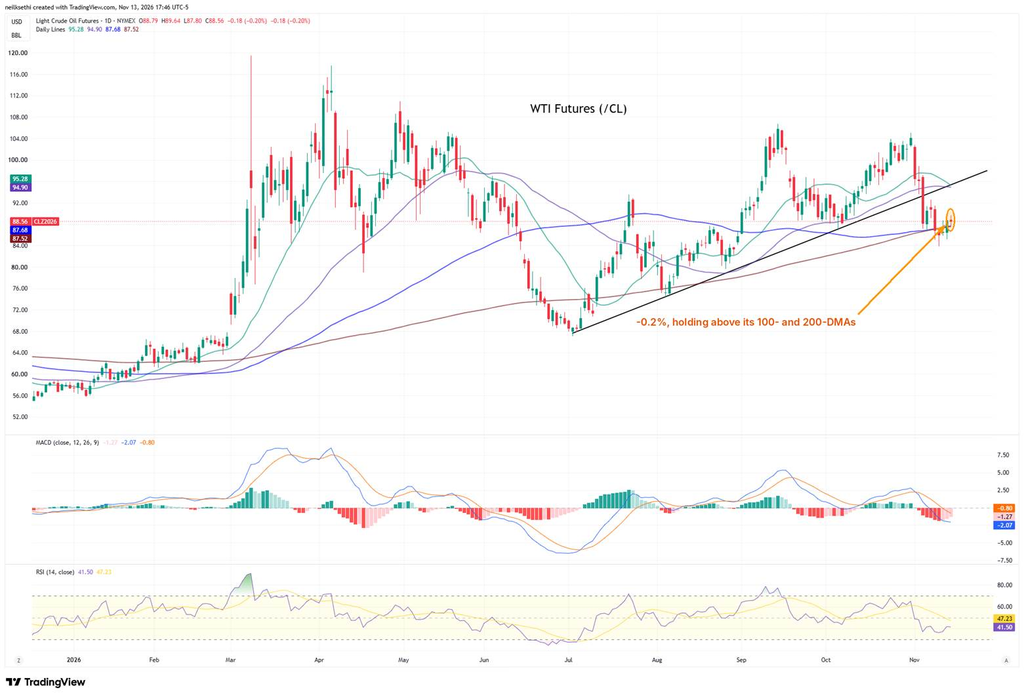
WTI futures slipped 0.20% to $88.56, holding above their 100- and 200-DMAs ($87.68 and $87.52) for a second day, but they’re still below their 20- and 50-DMAs ($95.28 and $94.90) and the uptrend line from the July low. They fell 2.2% for the week, a second straight weekly loss. The MACD is in “go short” positioning, and the RSI is at 42.
DXY
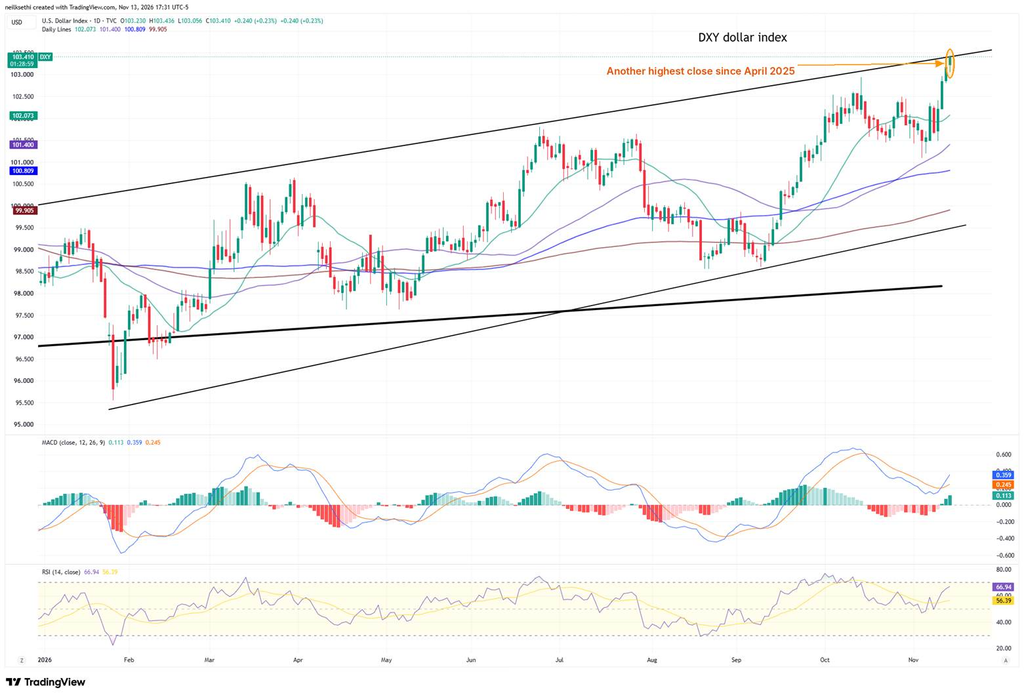
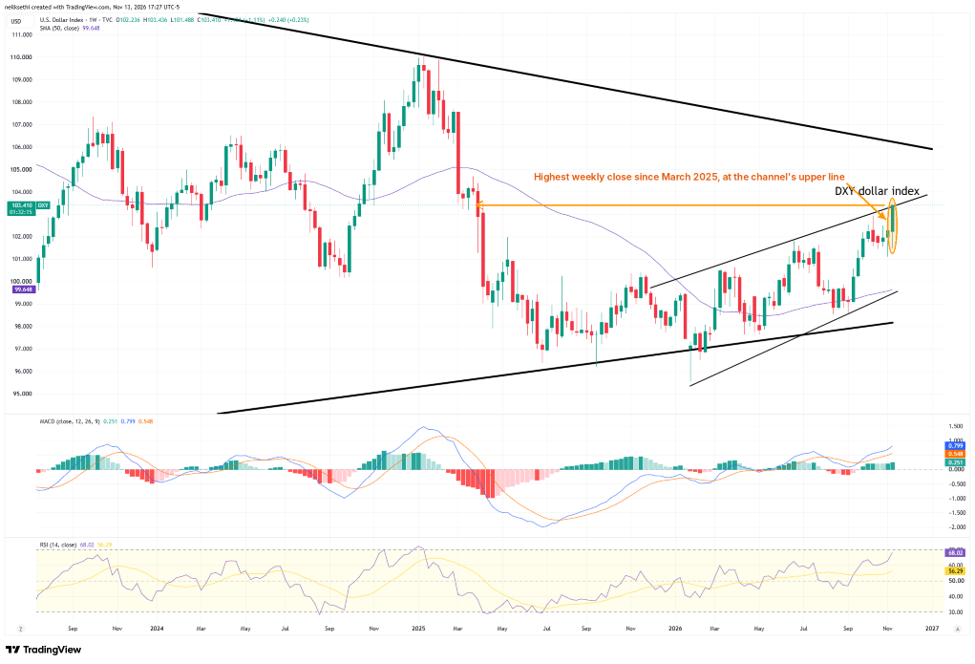
The DXY dollar index (which is fixed weighted with a heavy — 57% — allocation to the euro) rose 0.23% to 103.41, another highest close since April 2025, closing right at the line connecting its highs since December. It’s above all its DMAs, including the 20-DMA (102.07). The MACD remains in “buy longs” positioning, and the RSI is at 67. Seems a logical place for some consolidation, but we’ll see. A break above could see it run.
On the weekly chart, the DXY rose 1.11%, its highest weekly close since March 2025, testing the upper line of its rising channel. The weekly MACD is in “buy longs” positioning, and the RSI is at 68.
Gold futures (/GC)
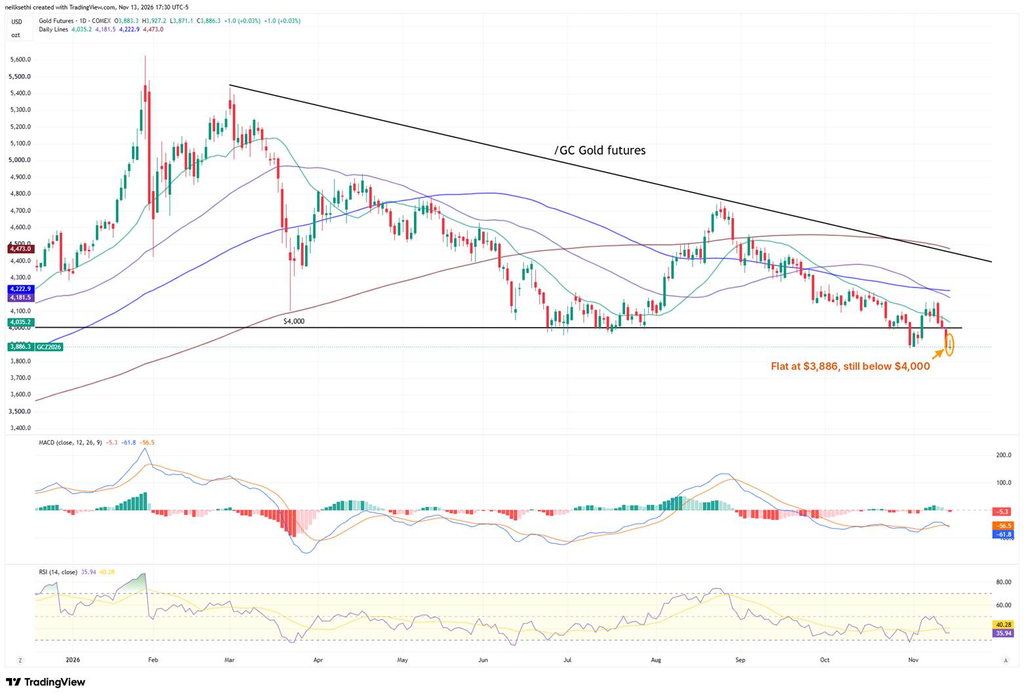
Gold futures were little changed at $3,886 (+0.03%), holding below the $4,000 line they broke Thursday and below all their DMAs, including the 20-DMA ($4,035), as well as the downtrend line from the March high. The MACD has slipped to “go short” positioning, and the RSI is at 36.
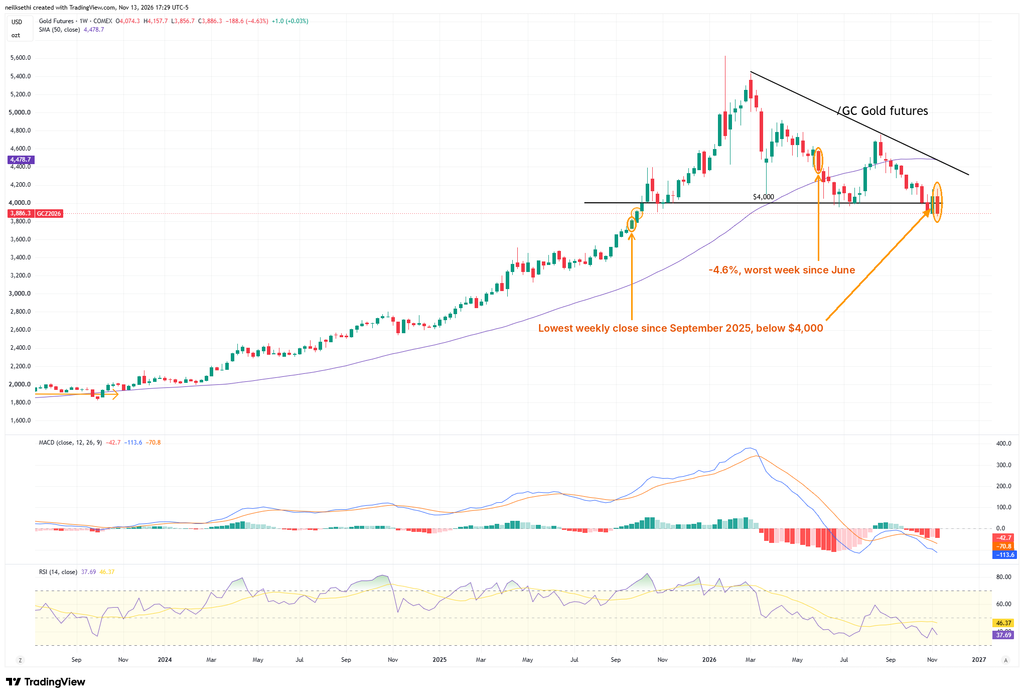
On the weekly chart, gold fell 4.63%, its worst week since June, and posted its lowest weekly close since September 2025, below the $4,000 line. The weekly MACD is in “go short” positioning, and the RSI is at 38.
Copper futures (/HG)
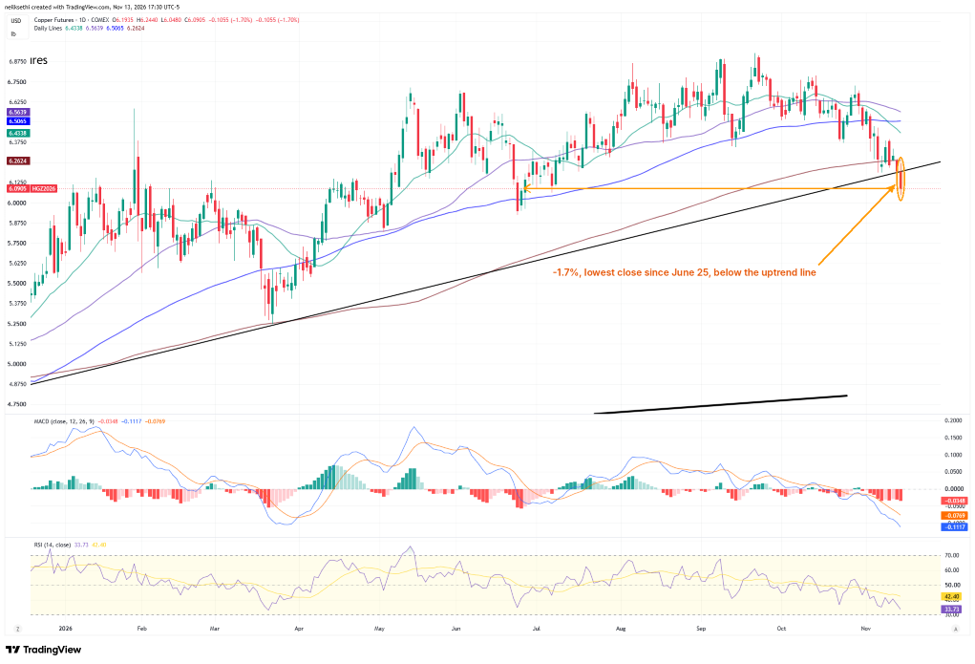
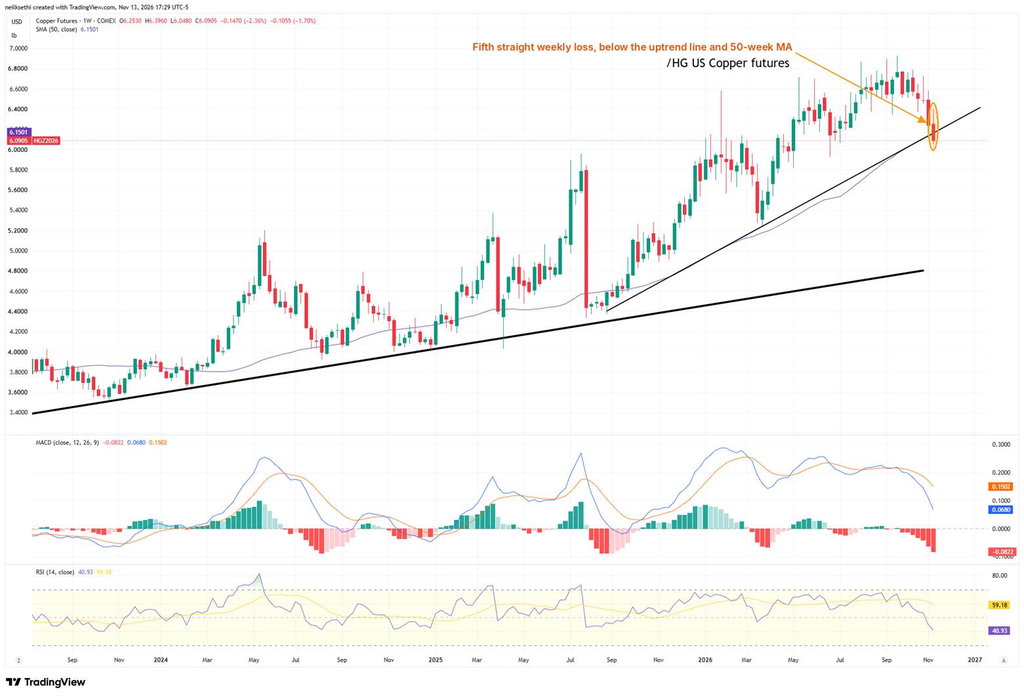
Copper futures fell 1.70% to $6.09, their lowest close since June 25, closing below the uptrend line from the March low they had dipped below intraday Thursday, a notable break. They remain below all their DMAs, including the 200-DMA ($6.26). The MACD is in “go short” positioning, and the RSI is at 34. I am now short CPER.
On the weekly chart, copper fell 2.36%, a fifth straight weekly loss, closing below the uptrend line from the August 2025 low and its 50-week MA ($6.15). The weekly MACD is in “sell longs” positioning, and the RSI is at 41. So bearish on both the daily and weekly charts.
Natural gas futures (/NG)
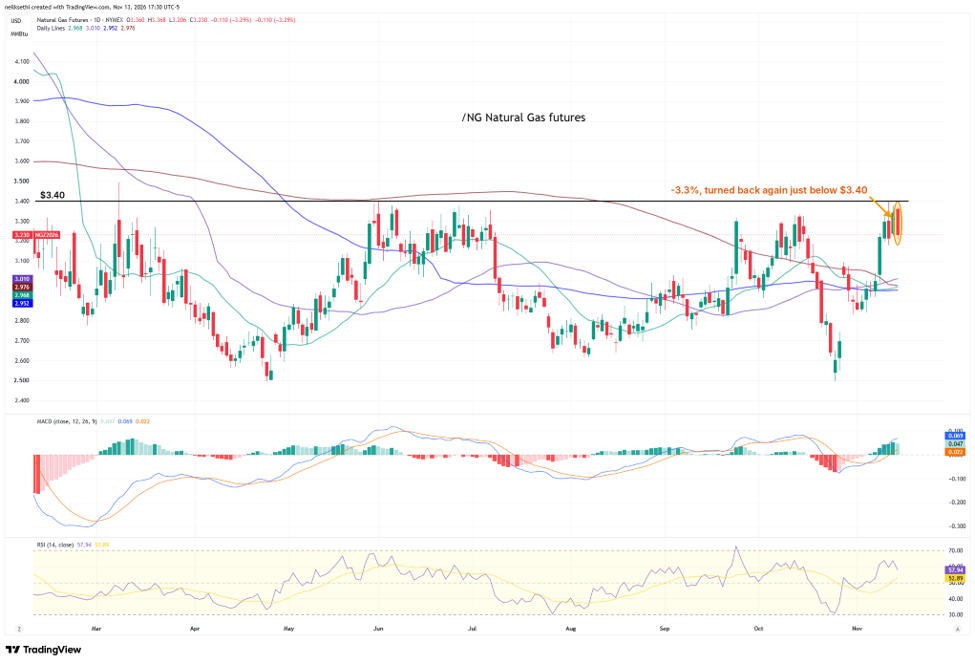
Natural gas futures fell 3.29% to $3.23, pulling back after again topping out this week just below the $3.40 level ($3.397) that has capped them since mid-February. They remain above all their DMAs. The MACD is in “buy longs” positioning, and the RSI is at 58.
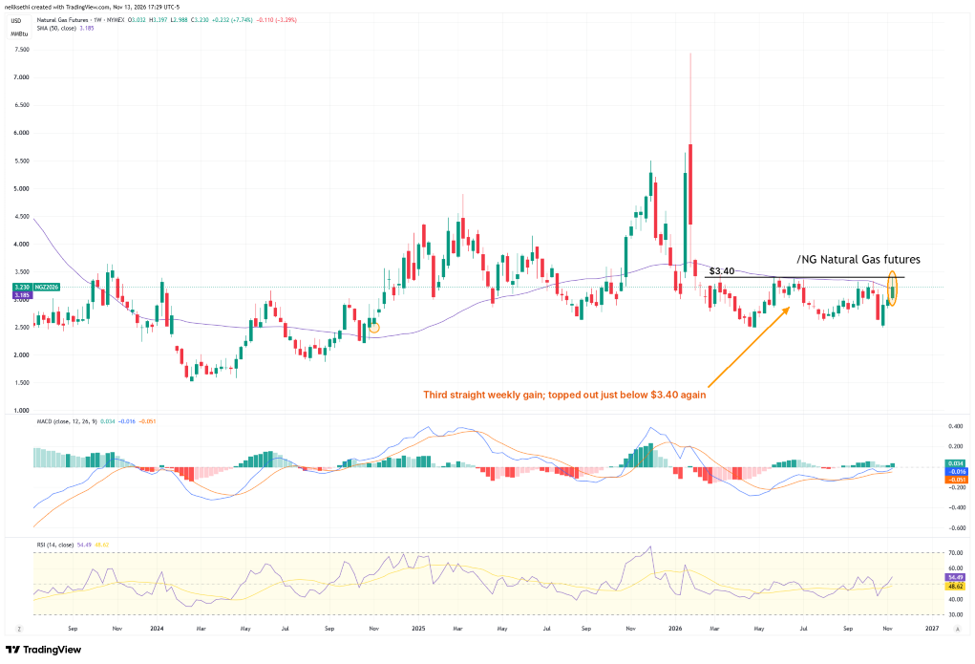
On the weekly chart, natural gas rose 7.74%, a third straight weekly gain, closing back above its 50-week MA ($3.19). The weekly MACD is in “cover shorts” positioning, and the RSI is at 54. So the charts are bullish. Can it just get over $3.40?
Bitcoin futures
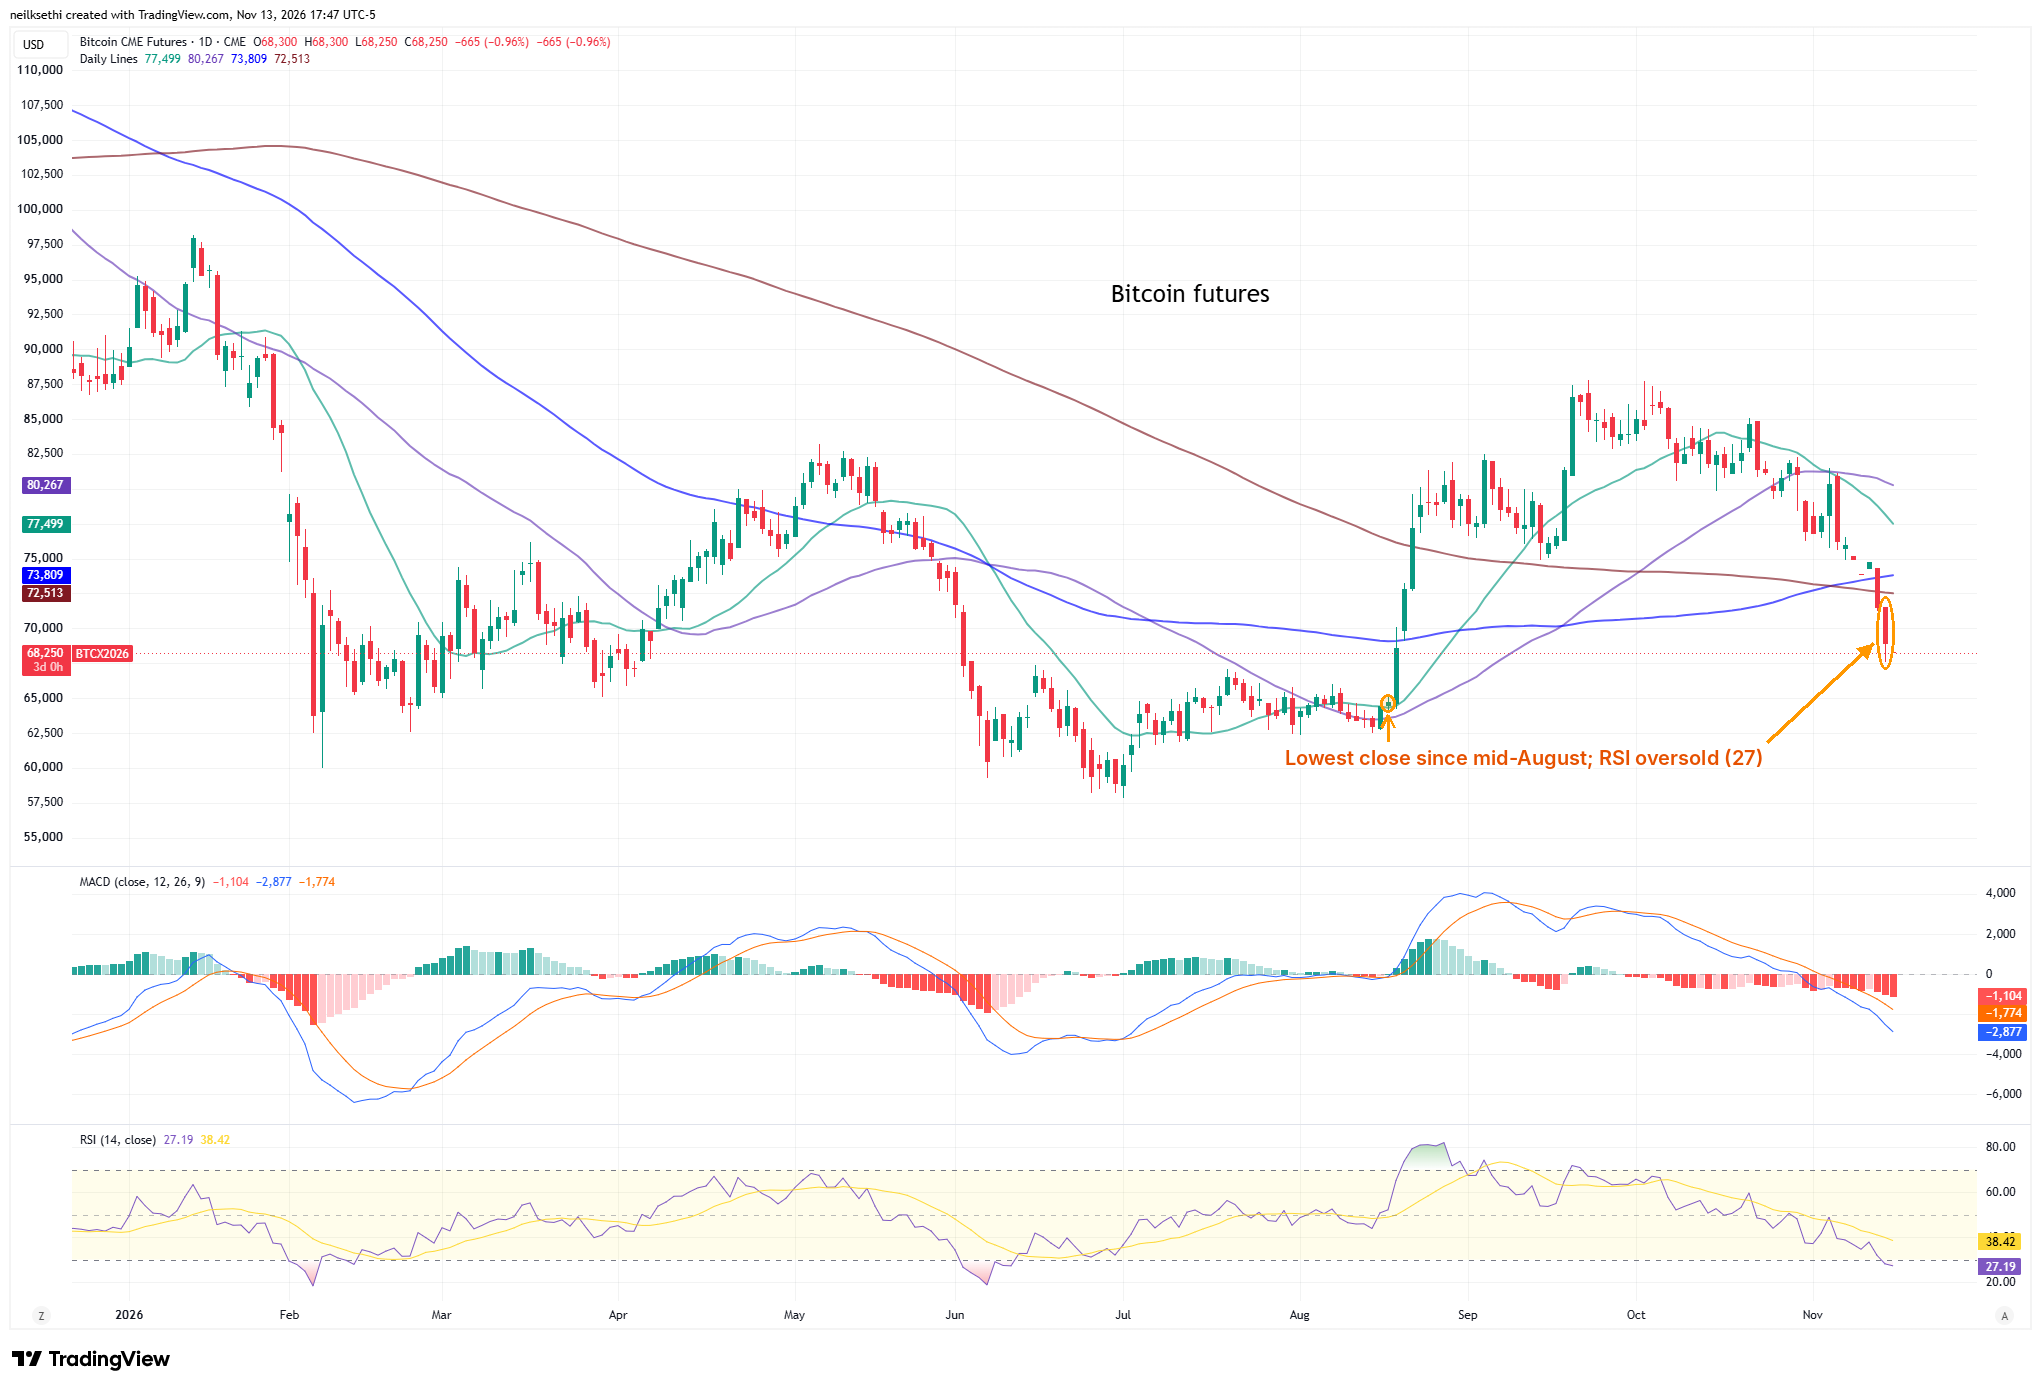
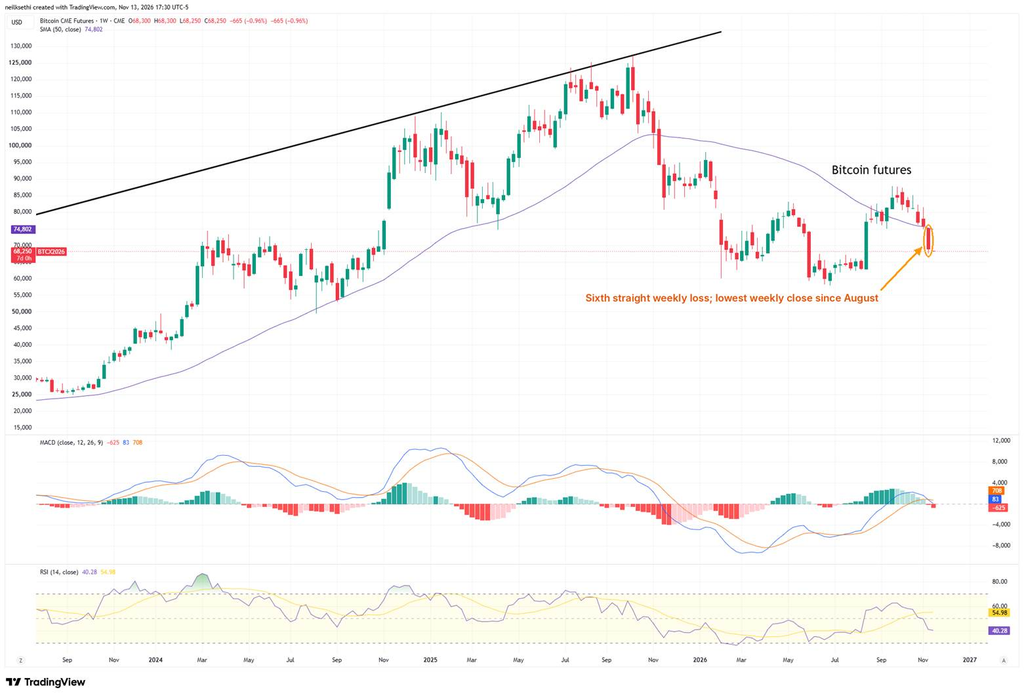
Bitcoin futures fell 4.66% (including post-market) to 68,175, their lowest close since mid-August, extending Thursday’s break below their 100- and 200-DMAs (73,809 and 72,513). They’re also below their 20- and 50-DMAs (77,499 and 80,267). The MACD is in “go short” positioning, and the RSI has dropped into oversold territory at 27 for the first time since early June.
On the weekly chart, bitcoin fell about 10%, a sixth straight weekly loss, posting its lowest weekly close since August, below $70,000 and the 50-week MA ($74,802). The weekly MACD is in “sell longs” positioning, and the RSI is at 40. I remain short.
Market breadth
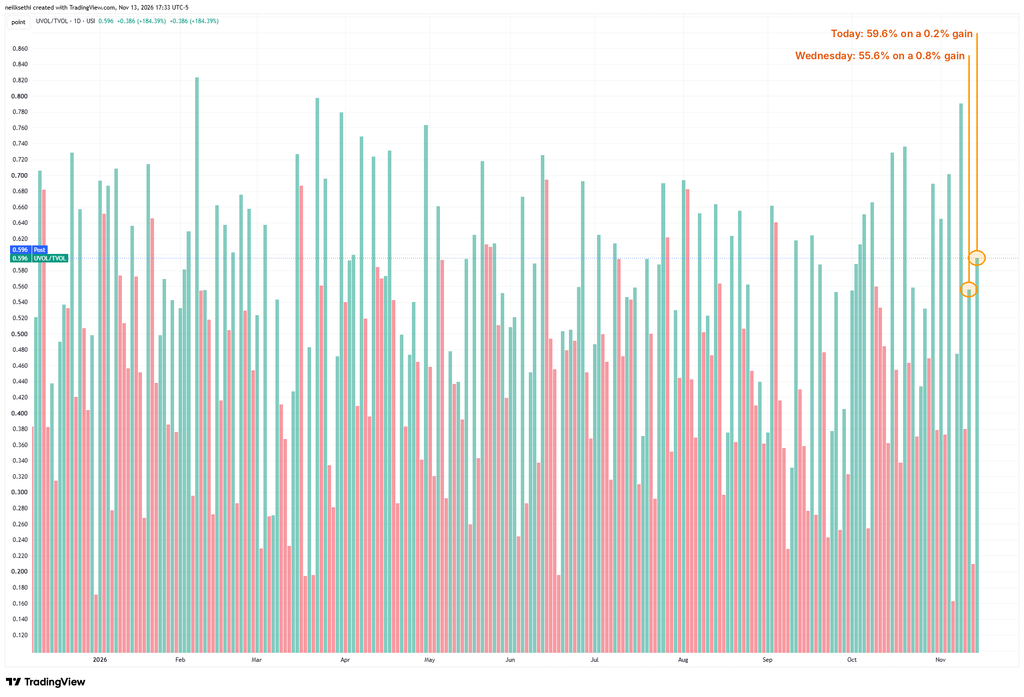
NYSE positive volume was a pleasant surprise at 59.6% on a 0.22% gain in the NYSE Composite, better than Wednesday’s 55.6%, when the index rose more (0.76%).
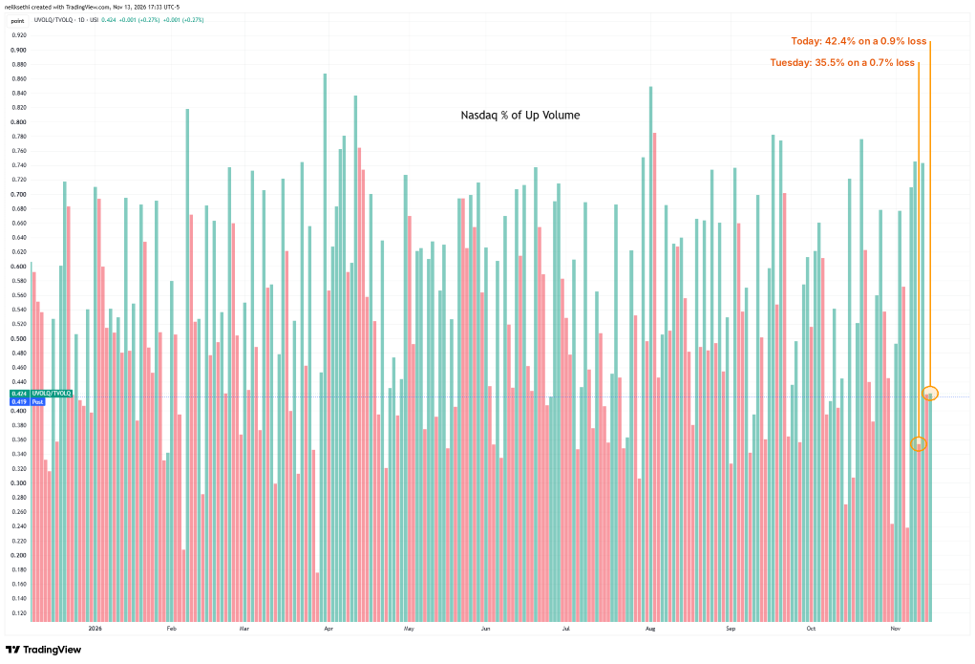
Nasdaq positive volume was 42.4% on a 0.91% loss, little changed from Thursday and better than Tuesday’s 35.5%, when the Composite fell less (0.74%).
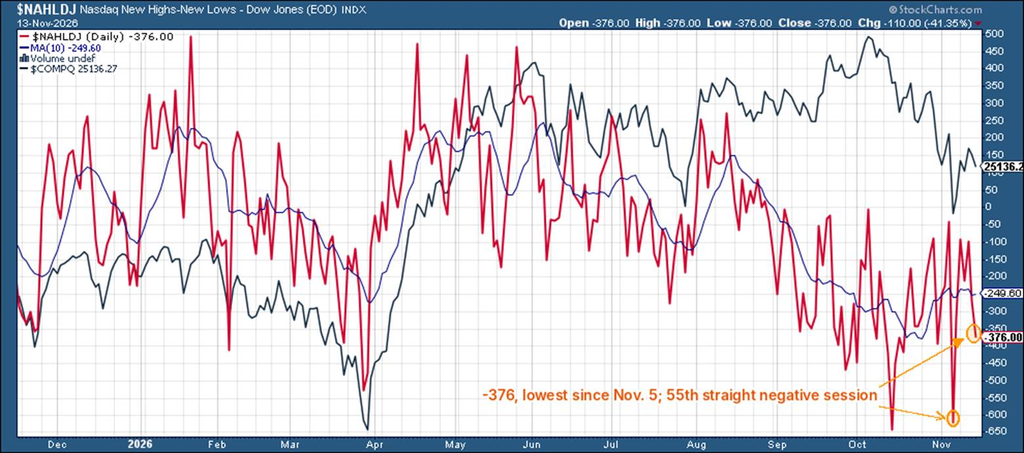
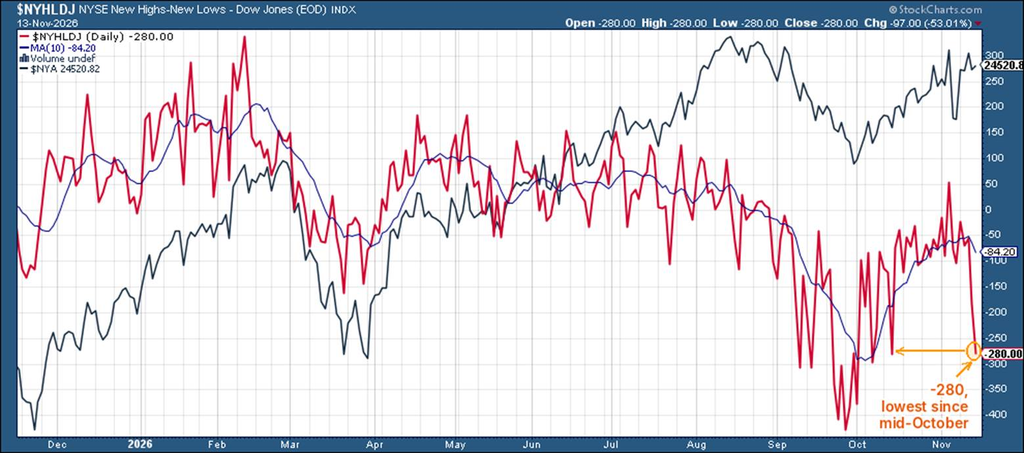
52-week highs minus lows on the Nasdaq fell to -376 from -266, its lowest since November 5, for its 55th straight negative session, extending the longest run since November 2022. On the NYSE, it fell to -280 from -183, its lowest since mid-October.
At the time of publication, in terms of securities mentioned, Sethi was long IWM, QQQ, RSP, SPY and numerous Treasury ETFs, and short IBIT and CPER.