Headline Producer Prices Cool, but Core Hits Highest Annual Rate Since 2022
October wholesale prices rose less than expected as energy stalled.
You've reached your free article limit
You've read 0 of 1 free Pro articles.
U.S. PPI Final Demand, October (month-over-month): 0.3% (estimate 0.4%; prior 1.3%; prior revised 1.4%)
— Final Demand (year-over-year): 6.5% (prior 6.3%)
— Ex-Food and Energy (month-over-month): 0.3% (estimate 0.3%; prior 0.7%; prior revised 0.8%)
— Ex-Food and Energy (year-over-year): 5.0% (prior 5.0%)
— Ex-Food, Energy and Trade (month-over-month): 0.5% (estimate 0.3%; prior 0.5%)
— Ex-Food, Energy and Trade (year-over-year): 4.9% (prior 5.0%)
EXECUTIVE SUMMARY
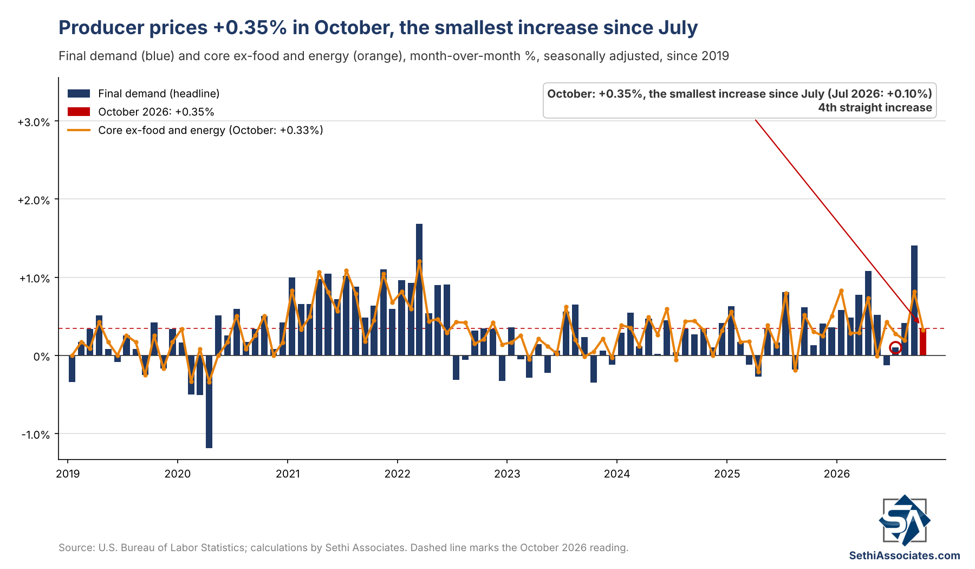
Headline below expectations. Final demand producer prices rose 0.35% in October (0.348% unrounded, which rounds to 0.3%), the smallest increase since July and below the 0.4% expected, after an upwardly revised 1.41% in September (initially 1.34%). But prices were up 6.52% from a year earlier, the highest since November 2022.
Energy stalled, the rest of goods didn’t. Goods rose 0.53%, the smallest increase in three months, as energy slipped 0.13%, its first decline since July, with diesel down 7.9%. But food jumped 1.34%, the most since February, and core goods rose 0.55%, the most since May, their 40th straight increase, the longest run in data back to December 2009.
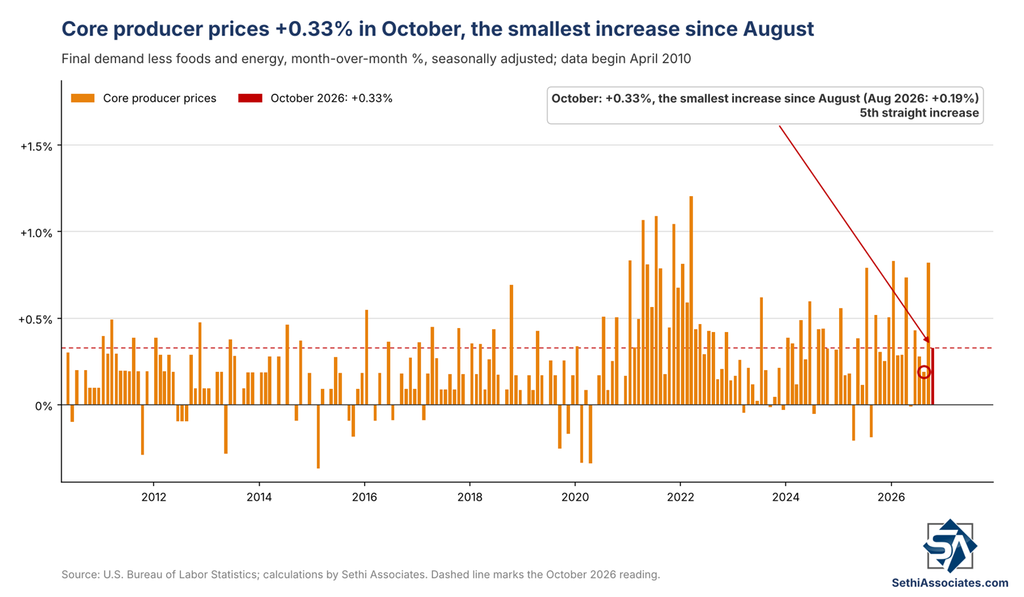
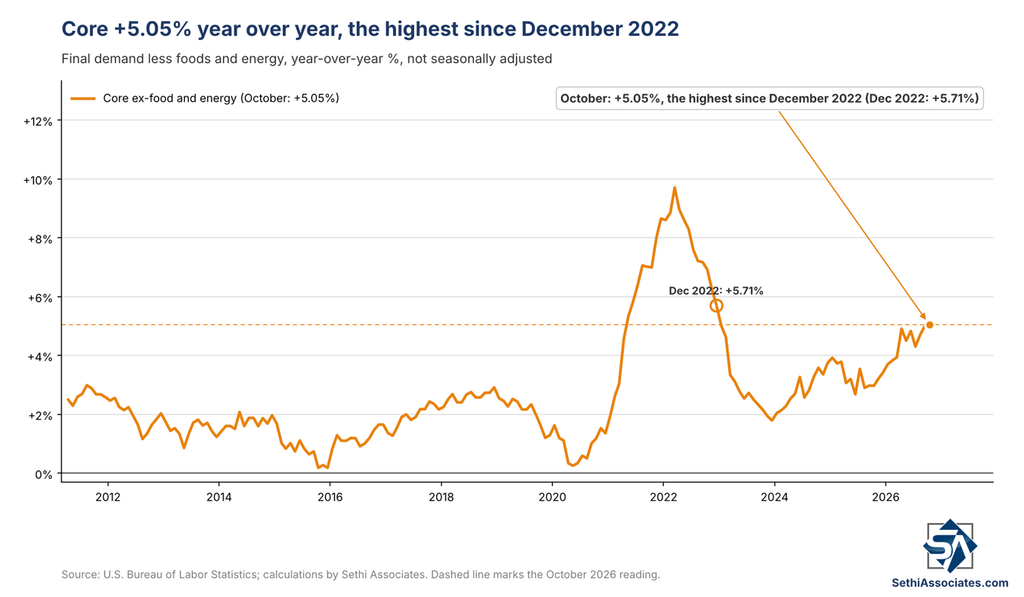
Core in line but elevated. Excluding food and energy, core producer prices rose 0.33%, in line with the 0.3% expected, after an upwardly revised 0.82% (initially 0.68%), the most since January. Year over year they were an elevated 5.05%, the highest since December 2022.
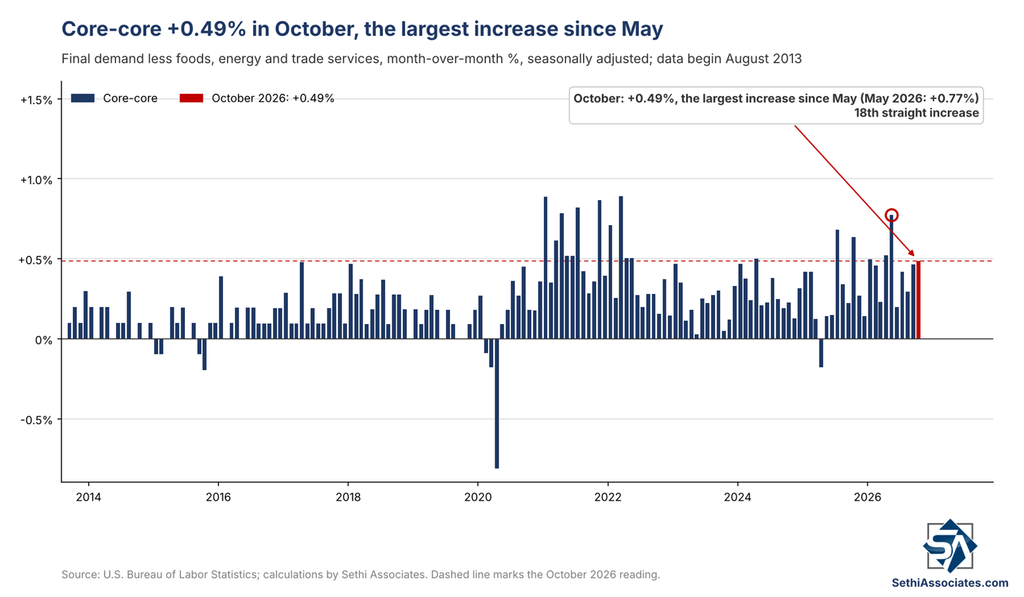
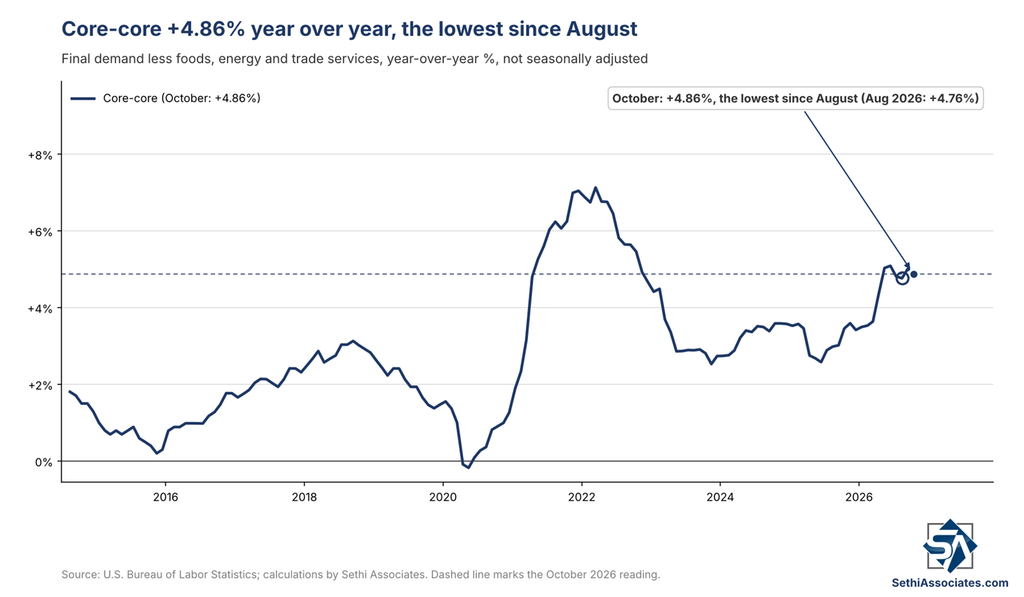
Core-core ran hot. Excluding food, energy, and trade services, which gives so-called “core-core” prices, considered a better read on underlying inflation pressures, prices rose 0.49%, the most since May, above the 0.3% expected. While the year-over-year rate eased to 4.86%, it was just off June’s 5.08%, the highest since October 2022.
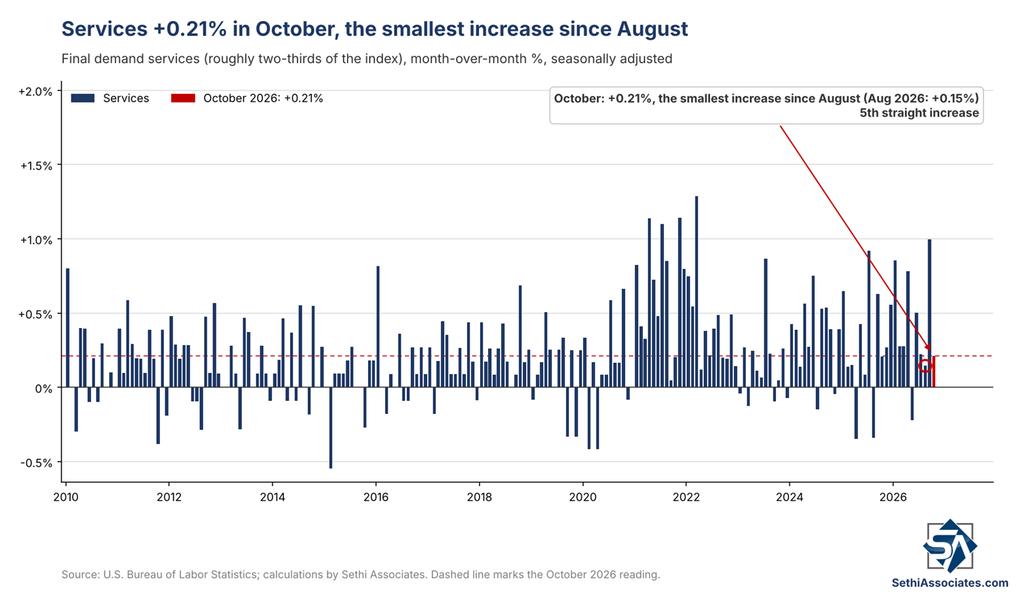
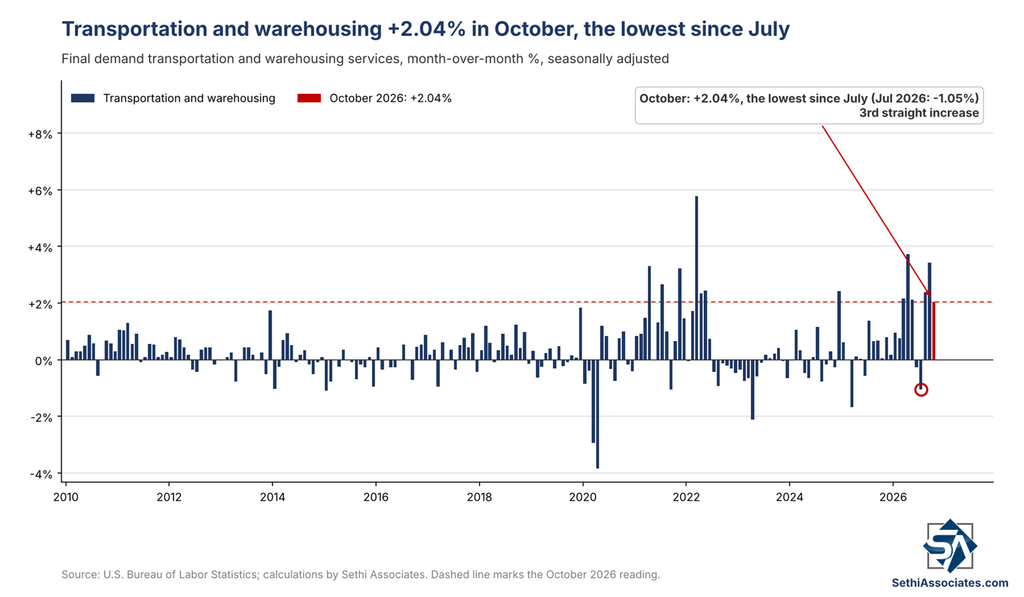
Freight drove services. Services rose 0.21%, a fifth straight increase, with three-fourths of the gain from a 2.04% rise in transportation and warehousing, led by truck freight, while trade margins fell 0.24%. Core-core services rose 0.19%.
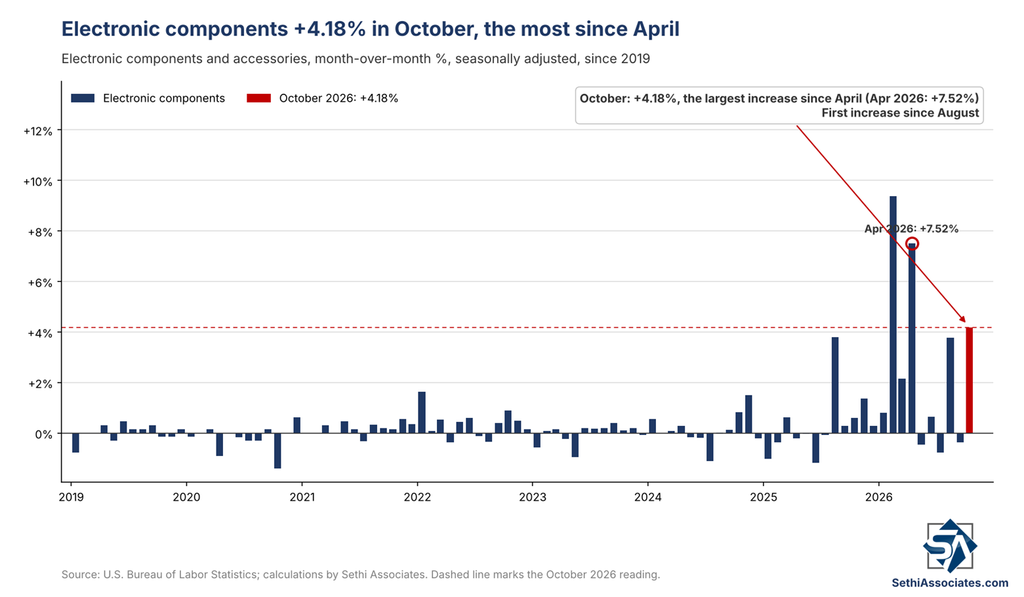
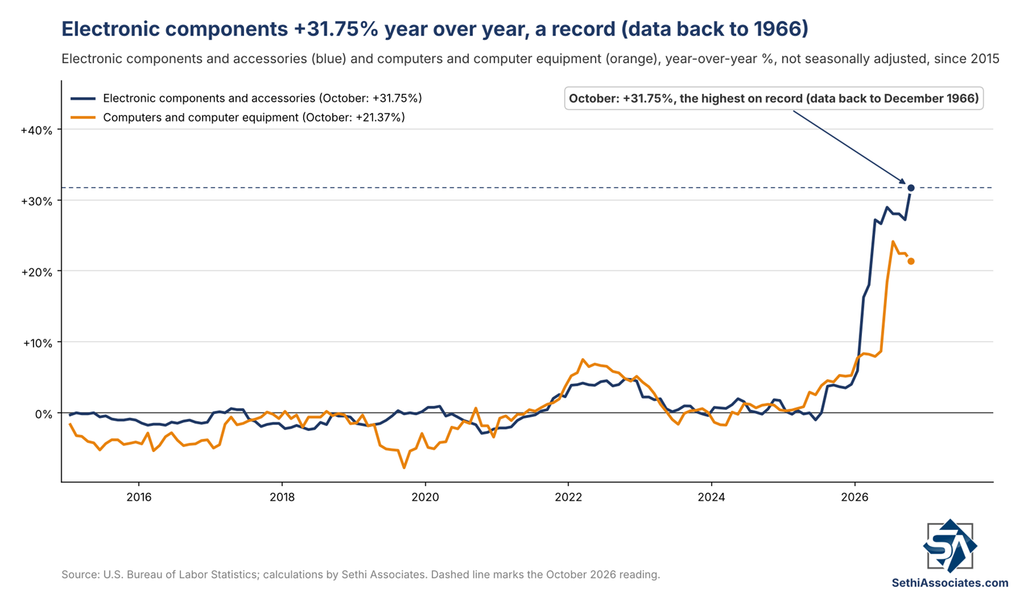
Data-center parts hit a record. Electronic components and accessories jumped 4.18%, the most since April, and are up 31.75% from a year earlier, the highest in data back to December 1966.
The pipeline split. Unprocessed goods for intermediate demand fell 3.08%, the largest decline since June, on a 10.3% drop in crude, but processed goods excluding food and energy rose 0.93%, the most since May, and intermediate demand services are up 6.80% from a year earlier, the highest since November 2022.
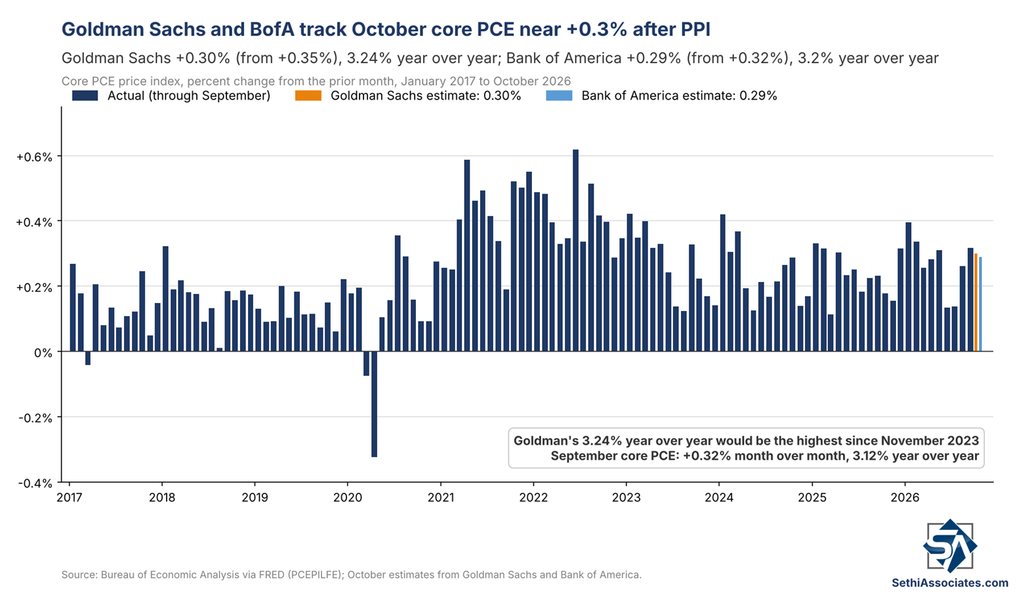
Core PCE estimates edged lower. The PPI inputs to the Fed’s preferred inflation gauge were softer than the banks expected, led by a drop in airfares. Goldman Sachs now estimates October core PCE at 0.30% (from 0.35%), or 3.24% year over year, which would be the highest since November 2023. Bank of America has it at 0.29% (from 0.32%), or 3.2% year over year.
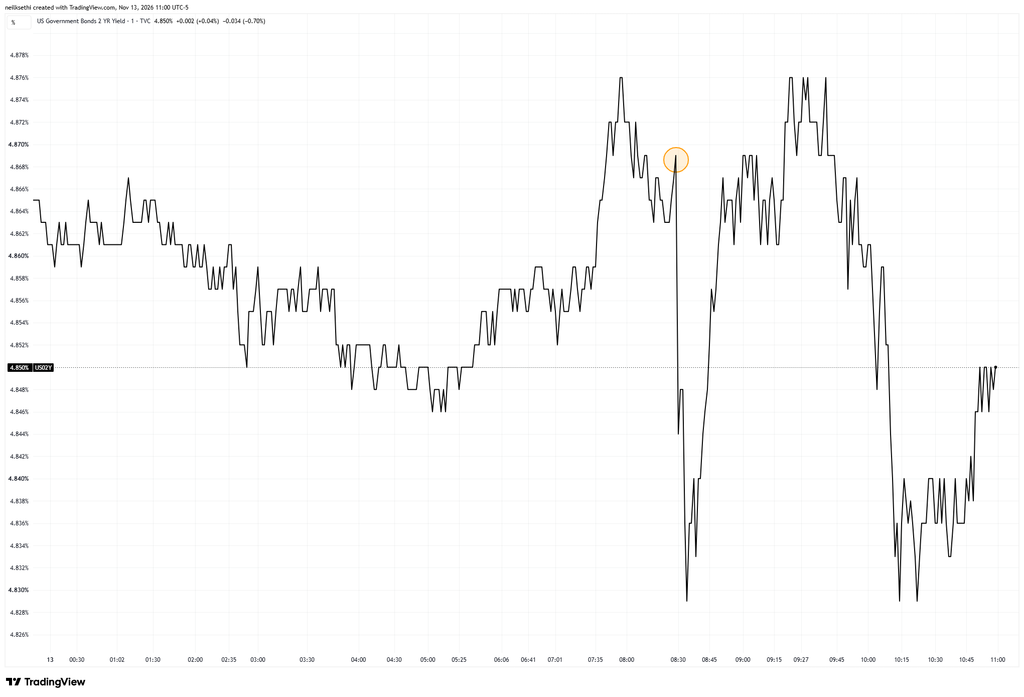
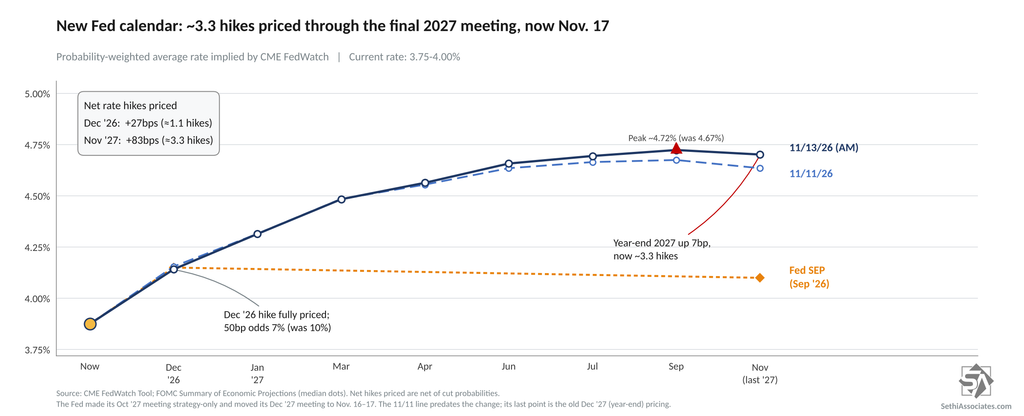
The Fed angle. Rate-hike odds held steady, with December still pricing in about a 7% chance of a half-point hike, according to CME FedWatch. The 2-year Treasury yield is lower on the session by 3 basis points, but that comes after the largest two-day gain since March 2023 (see Thursday’s Charts – Small Caps Slide as 2-Year Has Biggest Two-Day Jump Since March 2023).
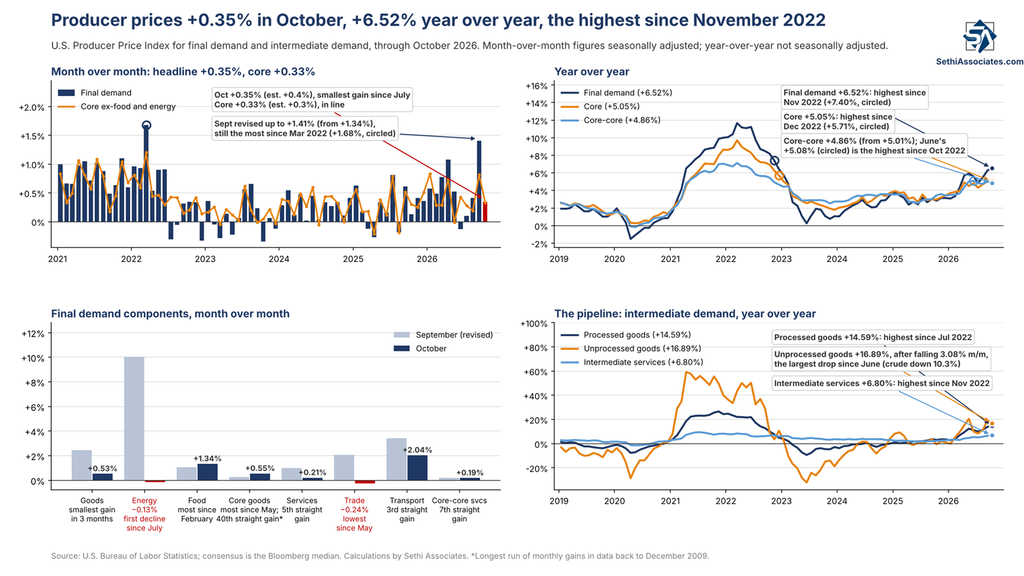
This report breaks producer prices into two components: final demand goods (those sold on to retailers and wholesalers) and intermediate demand goods (in various stages of becoming final goods). All the headline numbers, news-service quotes, and estimates refer to final demand, but I go through both. This report is the “pig in the python,” particularly for intermediate goods, which by definition are still moving through the chain toward final demand. If final-demand prices move higher, that either gets passed along to consumers (lifting the Consumer Price Index) or absorbed by companies (compressing margins).
Final Demand
October final demand producer prices rose +0.348%, the smallest increase since July, and just rounding down to 0.3% versus the 0.4% expected (Bloomberg median, per my Day Ahead). It follows +1.41% in September (revised from +1.34%), the most since March 2022, while August was revised down to +0.41% from +0.47%. It also follows Tuesday’s October CPI, where both headline and core came in above expectations.
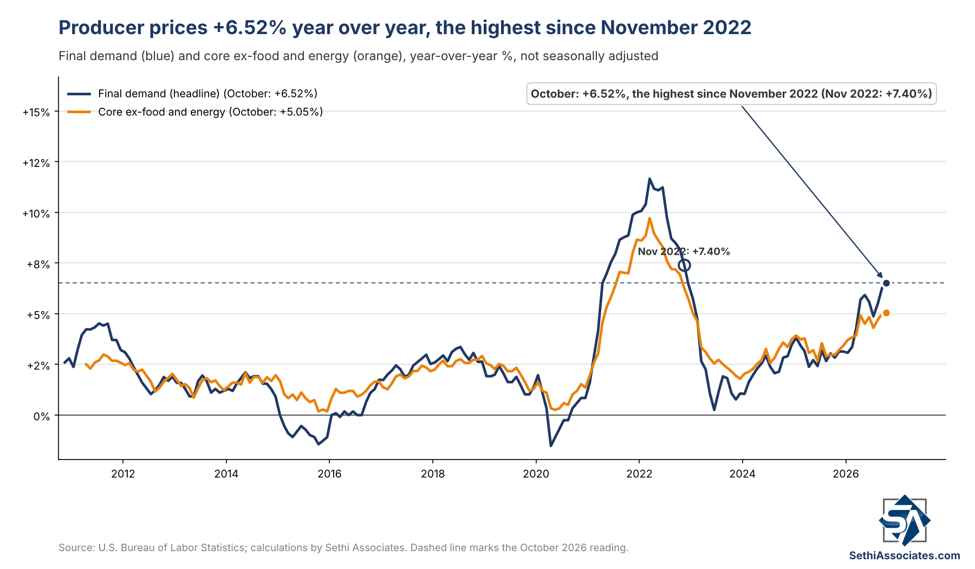
Year over year, final demand prices rose 6.52%, the highest since November 2022, up from a revised 6.29% in September.
Goods prices rose +0.53%, the smallest increase in three months, after +2.46% in September. That was revised from +2.65%, which in last month’s report was “the largest increase since data were first calculated in December 2009.” The revision leaves March 2022’s +2.49% as the record.
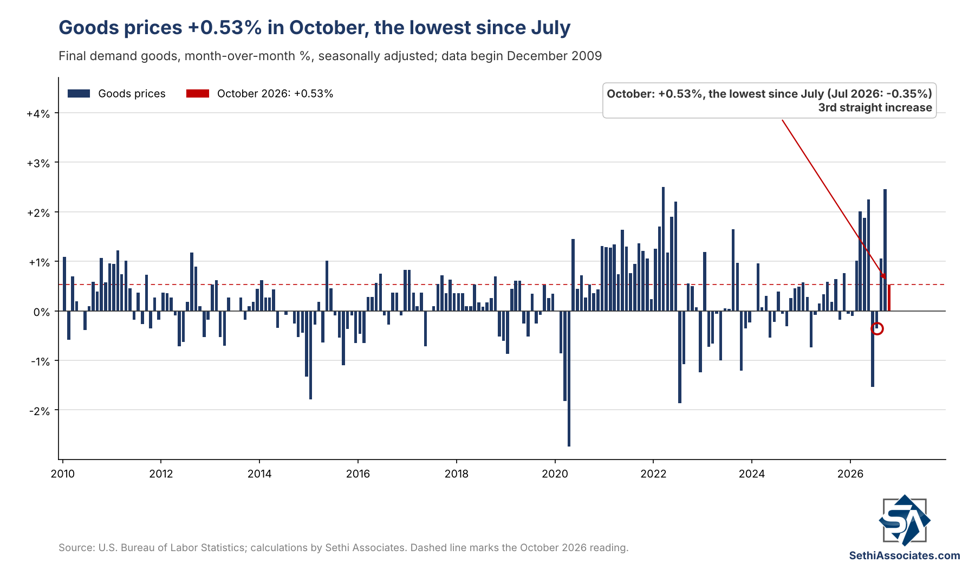
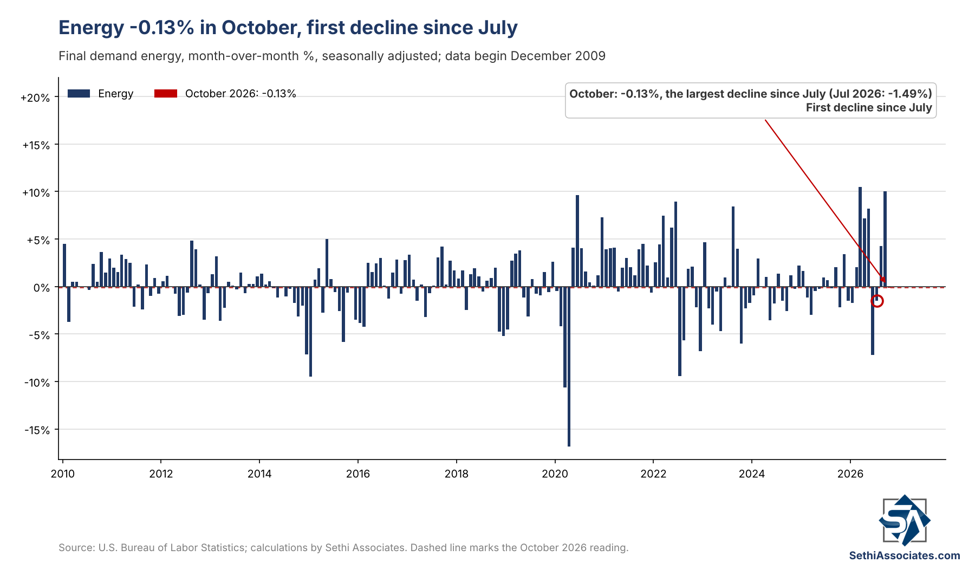
The moderation in goods prices was led by energy slipping -0.13%, its first decline since July, after +10.04% in September. That was revised down from +10.78%, so March’s +10.46% is again the largest increase on record (data back to December 2009). Diesel fuel fell 7.9%, and pork and passenger cars also declined. On the other side, basic organic chemicals rose 3.9%, and fresh and dry vegetables, gas fuels, aeronautical and navigational instruments, jet fuel, and chicken also rose.
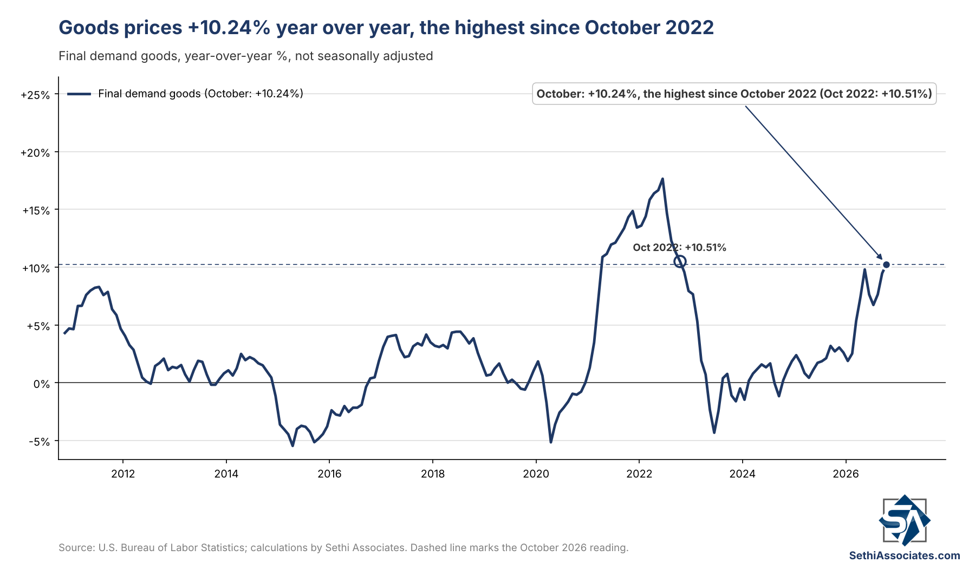
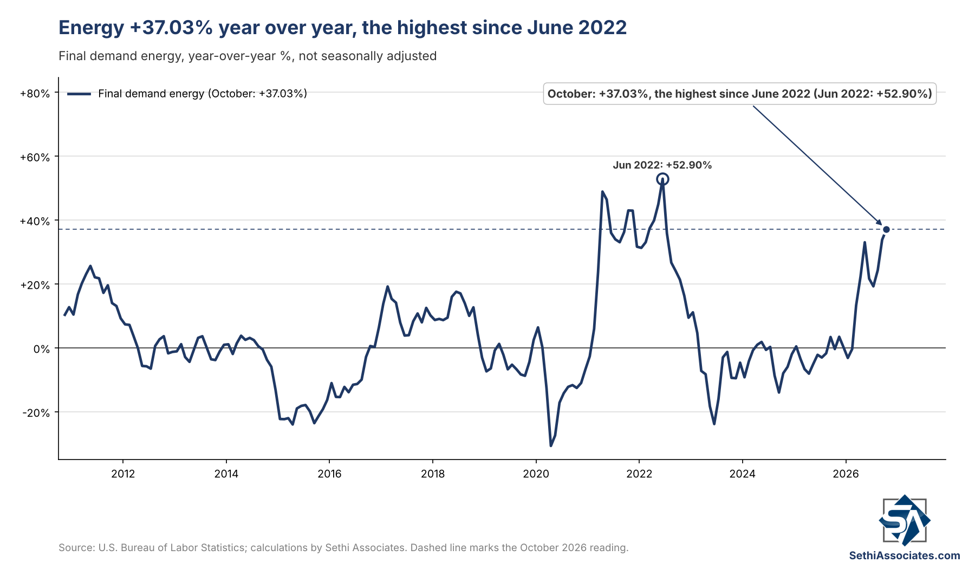
Despite the moderation in October, from a year earlier goods prices are +10.24%, the highest since October 2022, with energy +37.03%, the highest since June 2022.
Food prices jumped +1.34%, the largest increase since February, after +1.05% in September (revised from +1.22%).
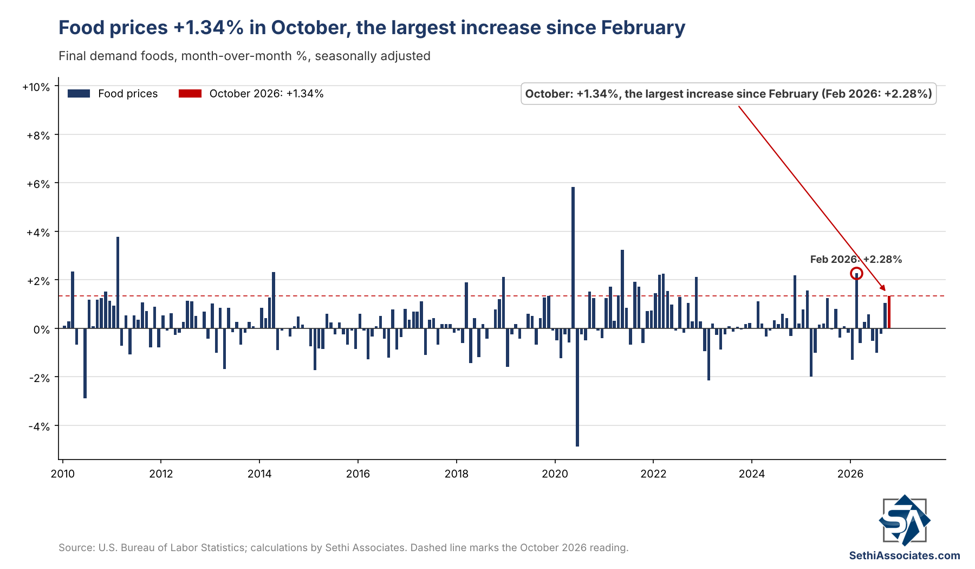
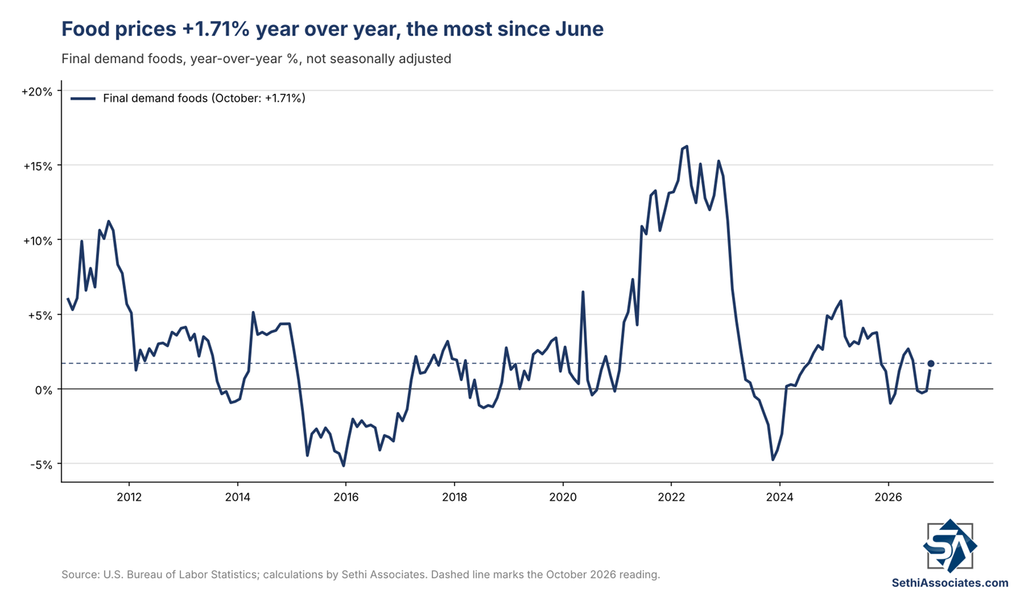
Year over year food is +1.71%, the highest since June, after three straight negative readings. Bloomberg tied the climb in food prices to the Middle East conflict, the Russia-Ukraine war and tariffs.
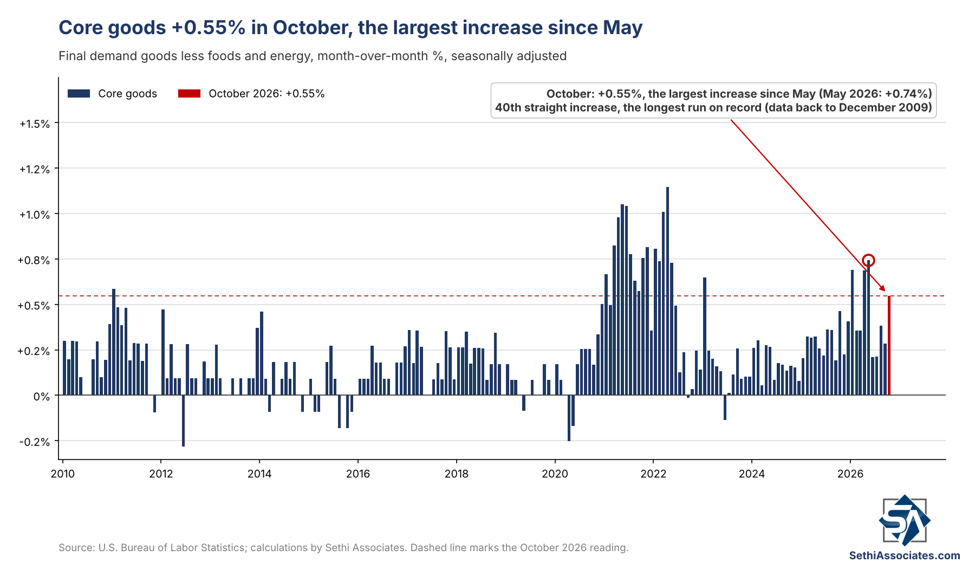
Excluding food and energy, core goods prices rose +0.55%, the largest increase since May, after +0.28% in September (revised from +0.27%). That’s 40 straight monthly increases, the longest run in data back to December 2009.
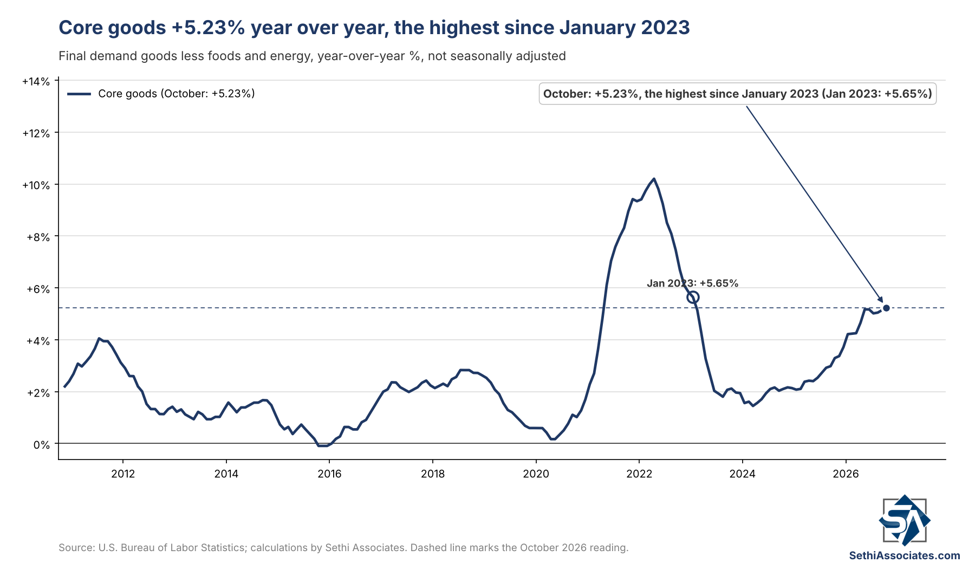
Core goods are +5.23% year over year, the highest since January 2023.
On the data-center buildout, electronic components and accessories jumped +4.18%, the most since April, after -0.37% in September (revised from -0.34%), while computers and computer equipment edged down -0.03%. Electronic components are now +31.75% year over year, the highest in data back to December 1966, topping June’s 28.97%, while computers are +21.37%, below July’s 24.14%, the highest in data back to 1991.
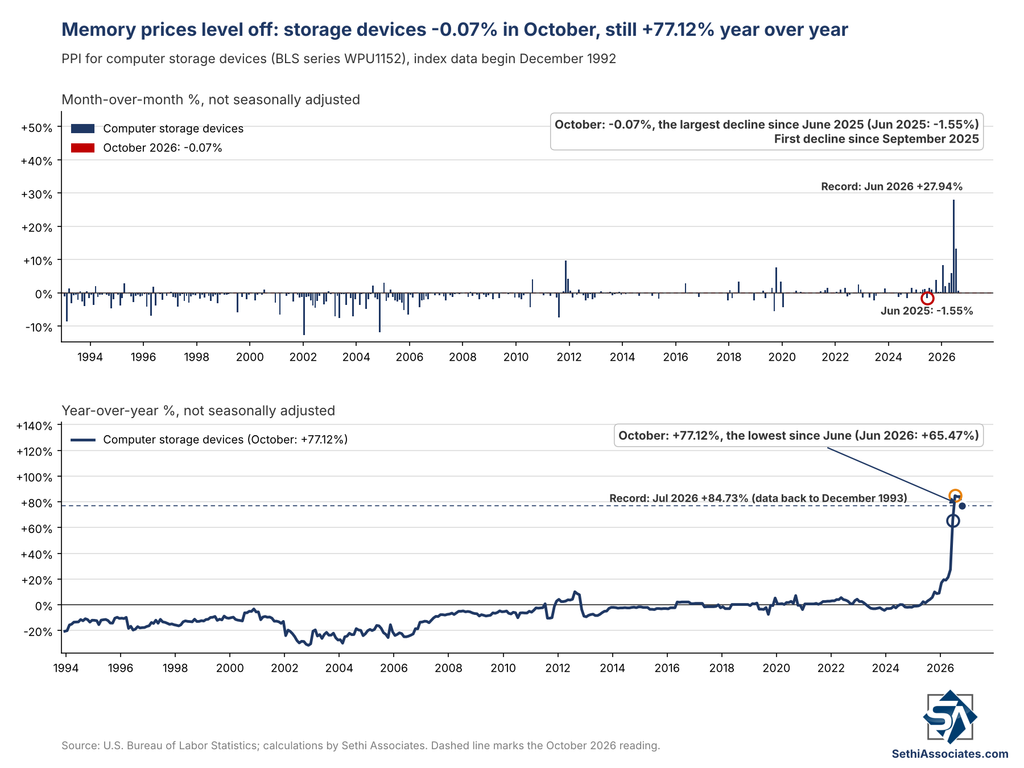
Memory looks different: computer storage devices slipped -0.07% after a flat September and jumps of +13.37% in July and +27.94% in June, the largest on record (data back to January 1993). They are still +77.12% from a year earlier, though down from July’s record +84.73%. ZeroHedge described the memory surge as having stabilized but not reversing. Final demand construction prices also rose +1.78%, the most since July.
Headline services (roughly two-thirds of the index) rose +0.21%, the fifth straight increase, after +1.00% in September (revised from +0.82%).
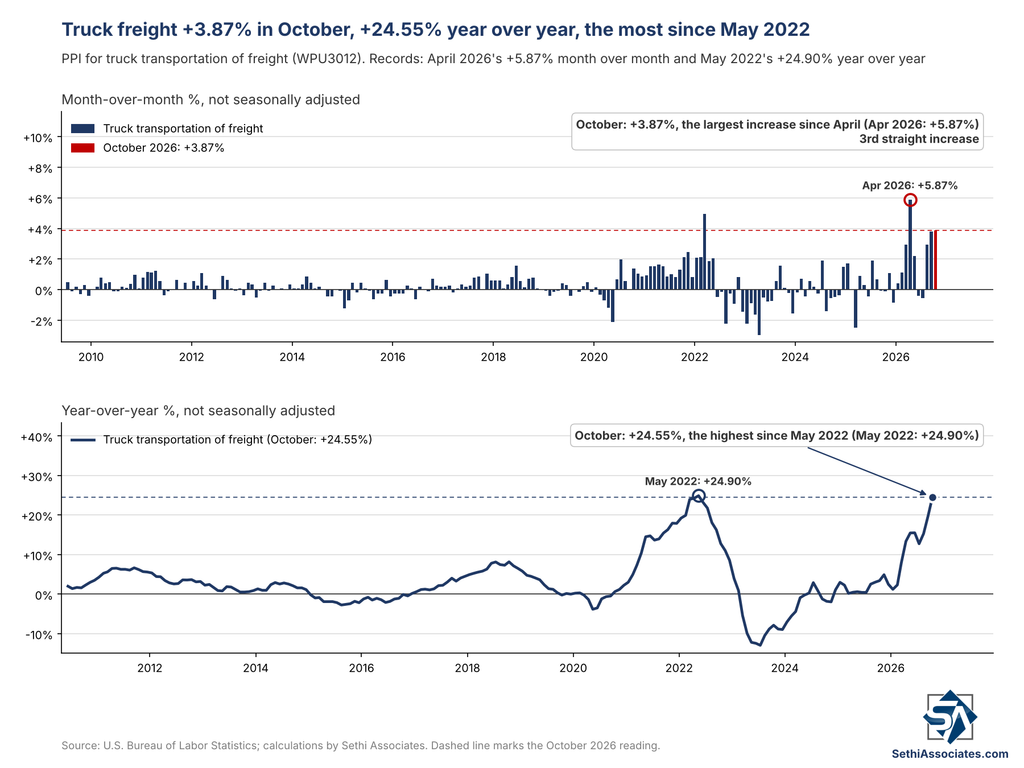
Transportation and warehousing though rose +2.04% after +3.43% in September. As the release put it, “over 80 percent of the October increase in the index for final demand services is attributable to prices for truck transportation of freight, which rose 3.9 percent.” That was the biggest monthly gain for truck freight since April’s record +5.87%, and it is now +24.55% from a year earlier, just shy of May 2022’s record +24.90%, lifted by the higher energy prices over the past year. Hospital outpatient care and hotels also rose, while machinery and vehicle wholesaling margins fell 4.2% and airfares and system software also declined.
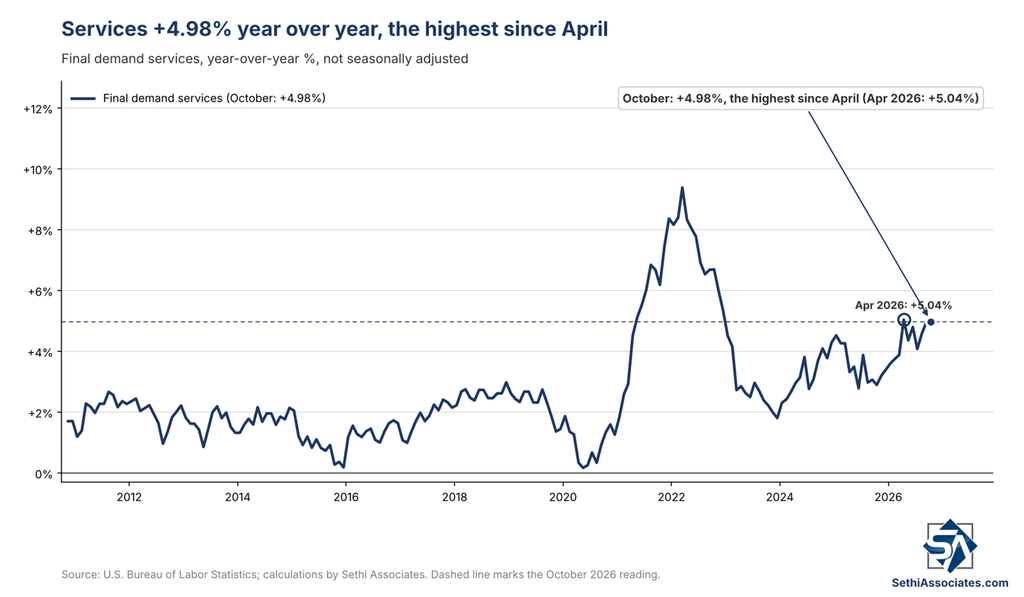
Headline services are +4.98% year over year, the highest since April, up from a revised 4.96% in September.
Excluding food and energy from the headline, core final demand producer prices rose +0.33%, in line with the 0.3% expected, after +0.82% in September (revised from +0.68%), now the most since January. Core was up 5.05% from a year earlier, the highest since December 2022, up from a revised 5.01% in September.
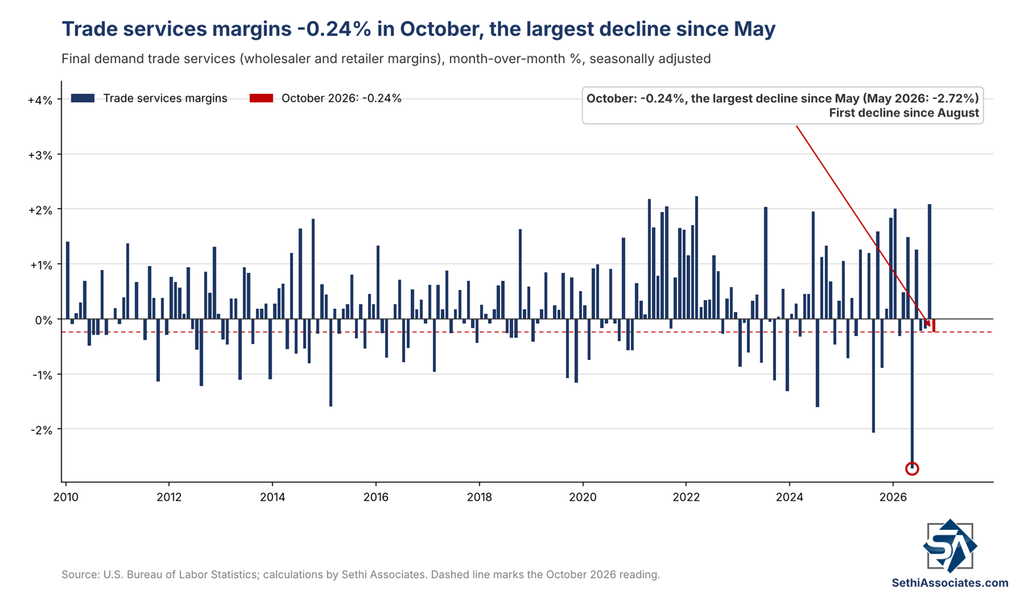
Core still includes trade services (wholesaler and retailer margins), which offer evidence on tariff pass-through: rising margins imply prices are rising faster than the cost to acquire goods, tariffs included. Trade services fell -0.24% in October, after +2.09% in September, revised up from +1.38% to the most since March 2022. So some moderation after a huge jump in September.
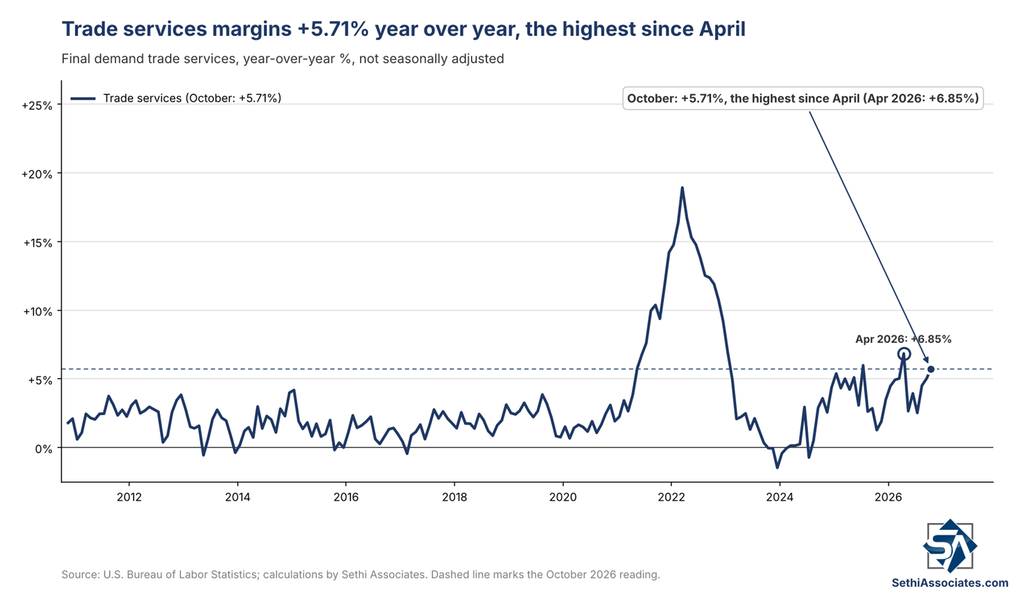
Year over year trade margins are +5.71%, the highest since April, up from a revised 5.01% in September.
Stripping out those volatile trade services gives the so-called “core-core” measure — final demand less foods, energy, and trade services — perhaps the purest read on underlying inflation in this report. It rose +0.49%, the most since May, above the 0.3% expected, after +0.47% in September (revised from +0.49%). That’s 18 straight monthly increases.
Year over year it eased to 4.86% from a revised 5.01% in September, just off June’s 5.08%, the highest since October 2022, so it remains quite elevated. September was revised down from 5.04%, so it no longer matches June.
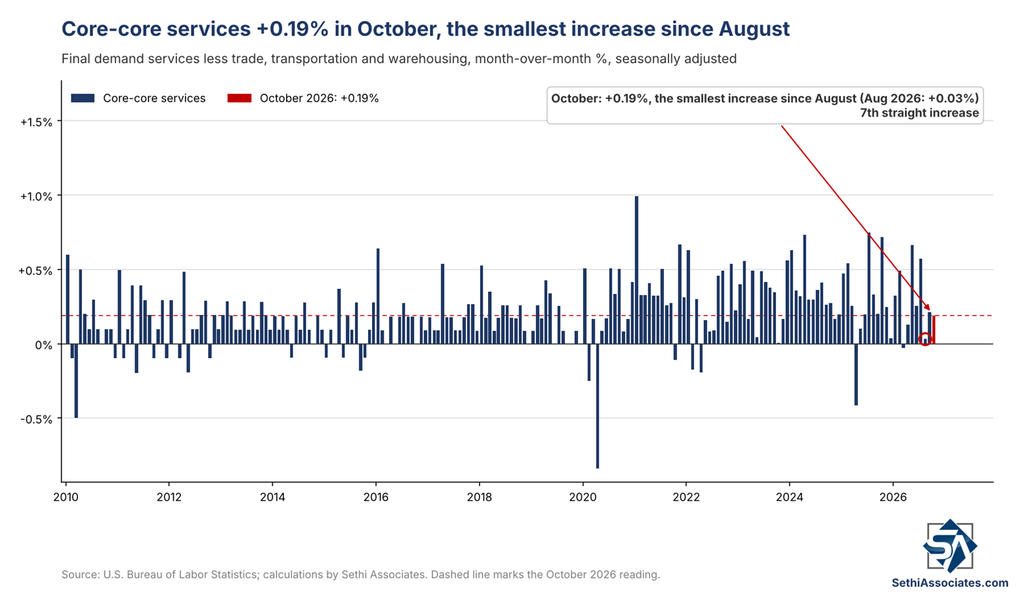
Core-core services — core final demand services less the volatile trade, transportation, and warehousing component, another of the cleaner reads on underlying inflation in this report — were more constructive rising +0.19% after +0.21% in September (revised from +0.25%).
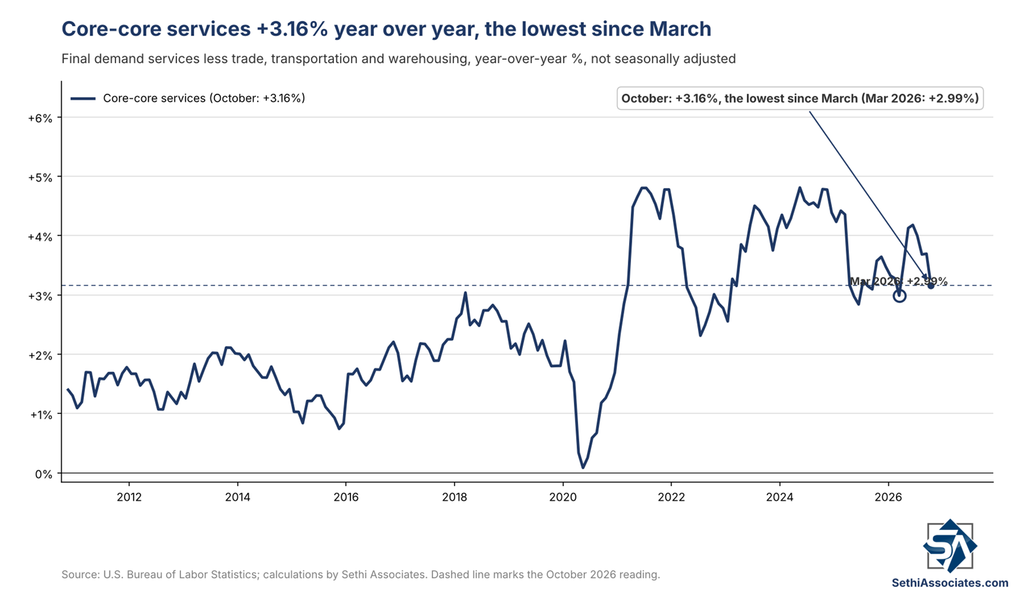
Year over year they are +3.16%, the lowest since March, down from a revised 3.69% in September. So some progress in this important metric, but still elevated, although less so than the full core-core measure.
Intermediate Demand
Intermediate demand goods and services are those still working through the chain toward final demand. In October, energy pulled goods lower at the earliest stages, while processed materials and services kept rising.
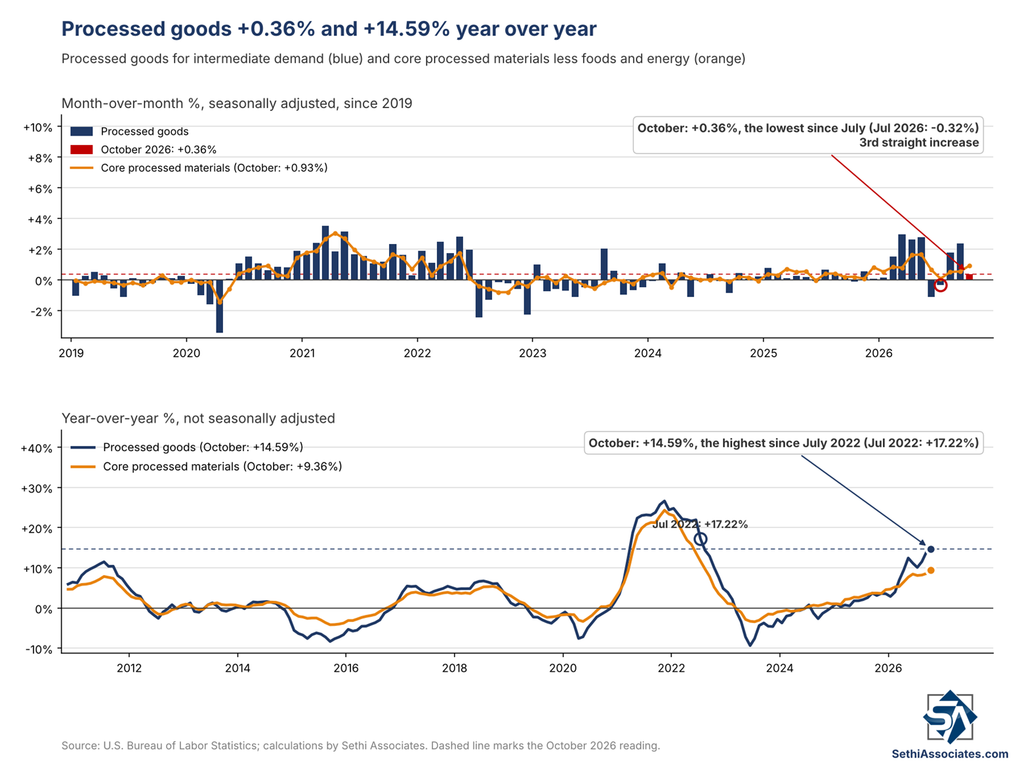
Processed goods for intermediate demand rose +0.36%, the third straight increase, after +2.36% in September (revised from +2.52%). Processed energy goods fell -1.62%, but processed materials less foods and energy rose +0.93%, the most since May, and processed foods and feeds +1.03%. Per the release, “more than 40 percent of the October advance” came from basic organic chemicals, up 3.9%, with jet fuel, electronic components, natural gas liquids, fabricated structural metal products and animal feeds also higher, while diesel, pork and lumber fell. Bloomberg noted plastic resins and materials, an input for a wide range of consumer goods, rose the most in five months.
Year over year, processed goods are +14.59%, the highest since July 2022, and the core is +9.36%, the highest since August 2022.
Unprocessed goods for intermediate demand fell -3.08%, the largest decline since June, after +6.25% in September (revised sharply from +8.37%). Unprocessed energy materials dropped -7.70%, with crude petroleum down 10.3%, while nonfood materials less energy fell -0.90% and foodstuffs -0.19%. Corn, hogs, wheat and aluminum scrap also fell, while raw milk rose 8.2%, along with natural gas and steel scrap.
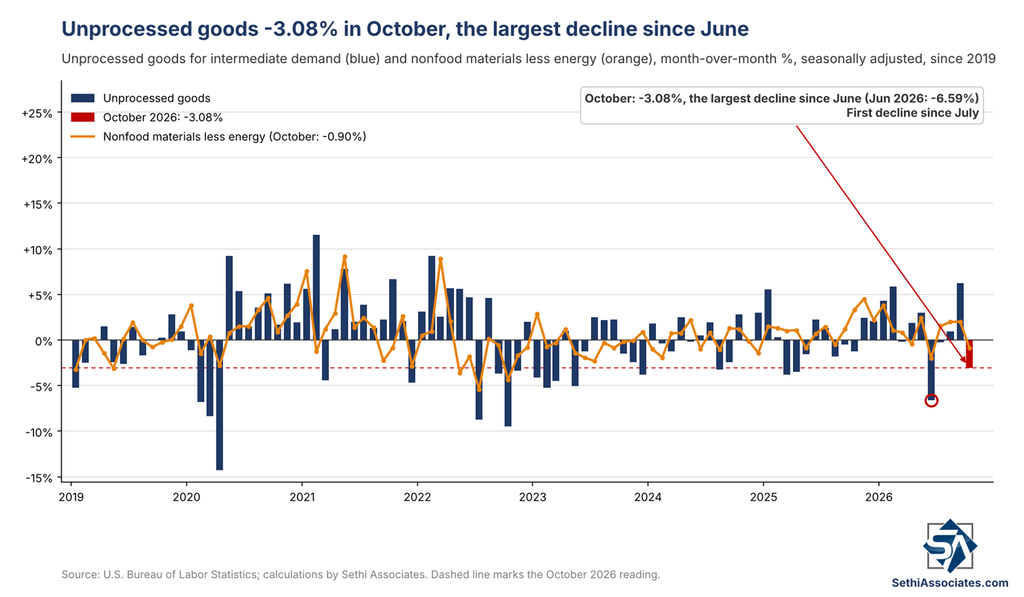
Year over year unprocessed goods are +16.89%, down from a revised 19.01% in September.
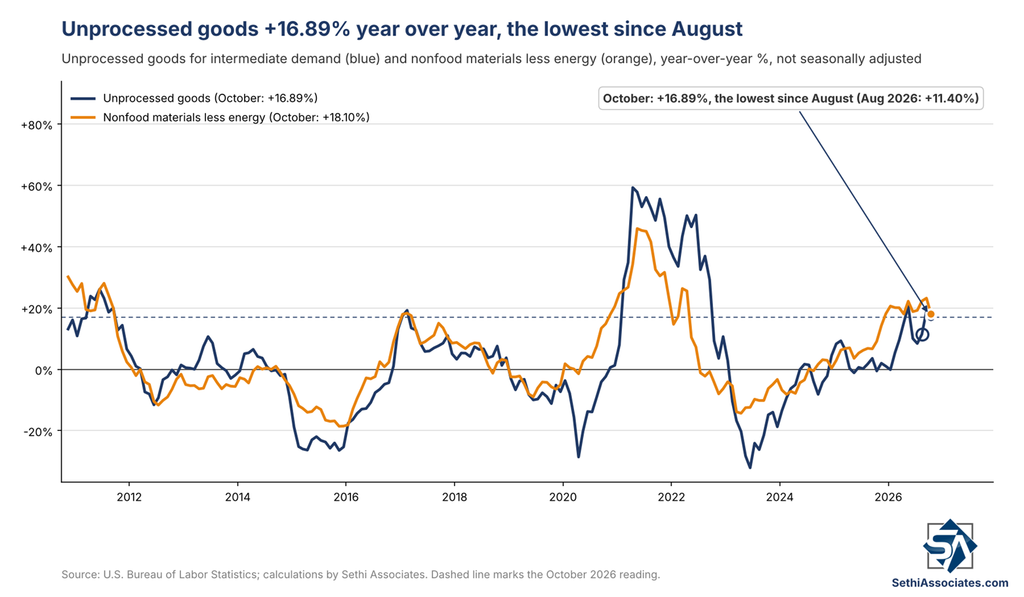
Services for intermediate demand rose +0.59%, after +1.03% in September (revised from +0.87%), with trade margins +1.59%, transportation and warehousing +1.16%, and services less trade, transportation, and warehousing +0.17%. Per the release, “thirty percent of the October increase” traced to a 9.2% jump in margins for metals, minerals, and ores wholesaling.
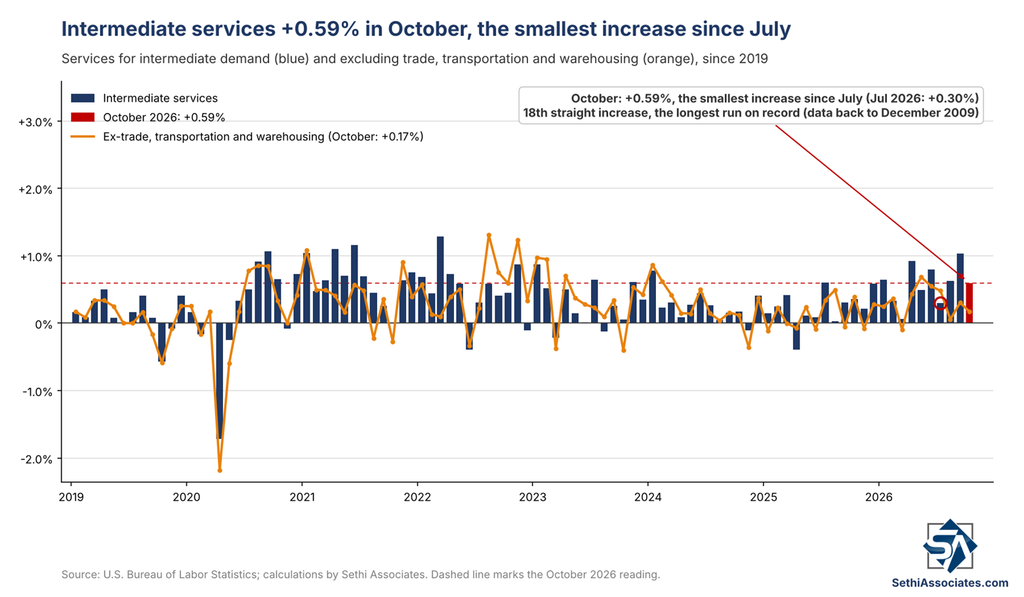
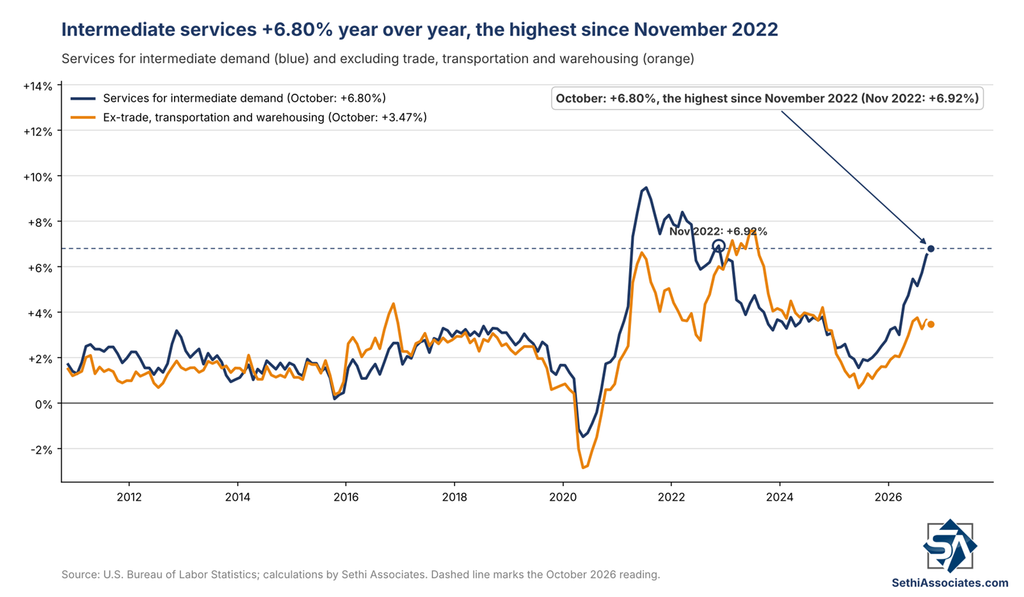
Year over year, intermediate services are +6.80%, the highest since November 2022, while core-core is +3.47%.
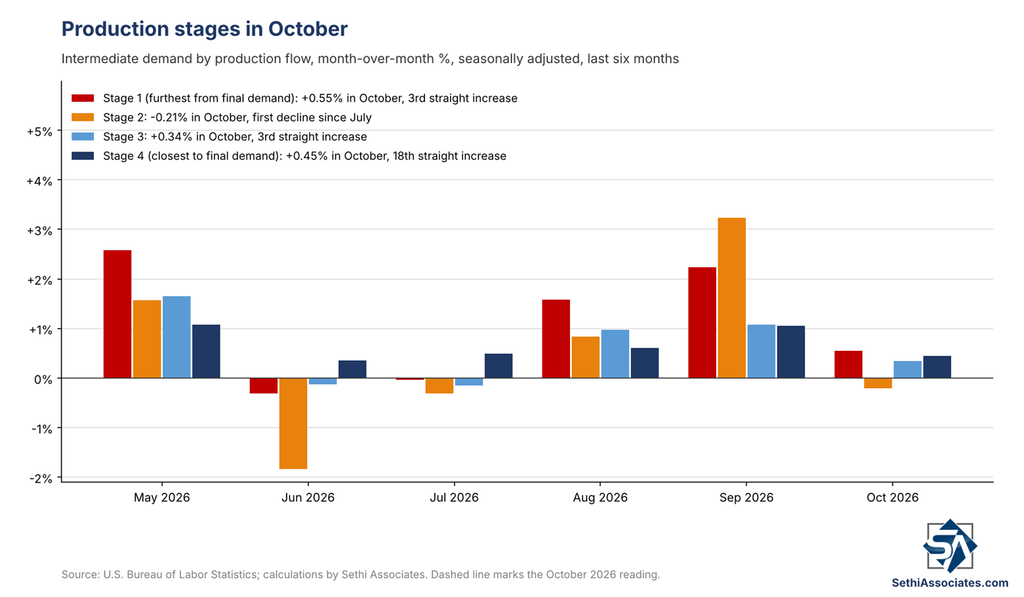
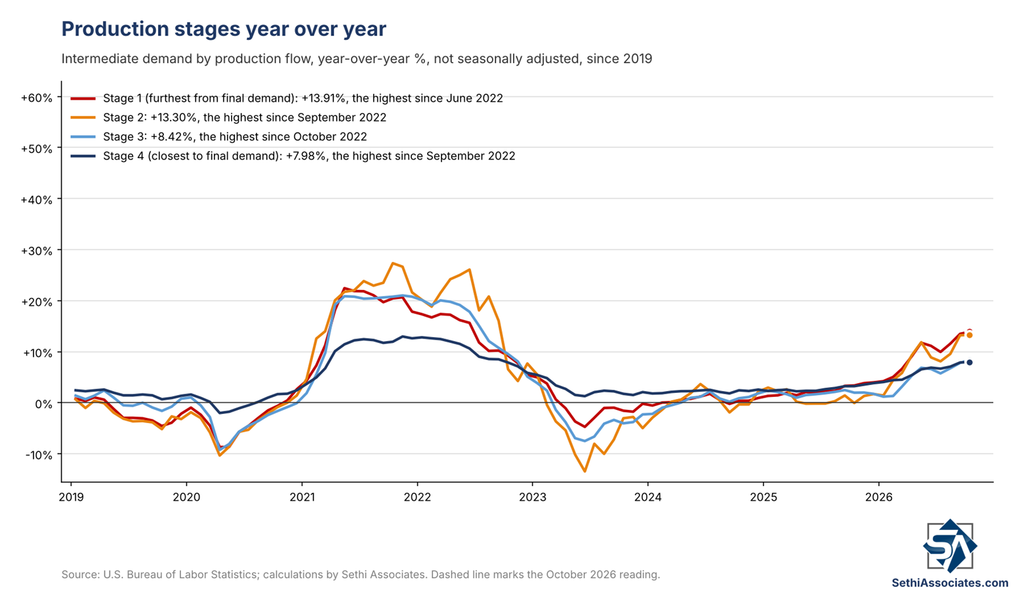
On a production-flow basis, three of the four stages rose, with stage 2 slipping on energy, but all are at the highest since 2022 on a year-over-year basis:
- Stage 1 (furthest from final demand) rose +0.55%, with goods inputs +0.27% and services inputs +0.92%. It is +13.91% year over year, the highest since June 2022.
- Stage 2 fell -0.21%, its first decline since July, with goods inputs -1.44% and services inputs +0.67%. It is +13.30% year over year, the highest since September 2022.
- Stage 3 rose +0.34%, with goods inputs +0.22% and services inputs +0.49%. It is +8.42% year over year, the highest since October 2022.
- Stage 4 (closest to final demand) rose +0.45%, with goods inputs +0.32% and services inputs +0.57%. It is +7.98% year over year, the highest since September 2022.
Fed Readthrough
Goldman Sachs said the PCE-relevant components were softer on net than it expected. Domestic airfares fell 1.8% (seasonally adjusted by Goldman) after sharp increases in August and September, and medical care was mixed but weaker on net, with PCE medical care services tracking +0.14%. It now estimates October core PCE at 0.30%, down from 0.35%, or 3.24% year over year, which by my math would be the highest since November 2023, up from 3.12% in September. It has headline PCE at 0.32% and 3.83% year over year.
Bank of America cut its October core PCE tracking by 3 basis points to 0.29% (3.2% year over year) from 0.32% (3.3%), and headline to 0.30% (3.8%) from 0.34% (3.9%). Even so, BofA said inflation is still too high and momentum has picked up in recent months, and it expects the Fed to raise rates by 25 basis points at each of its next three meetings (see BofA Now Sees Fed Hikes at Next Three Meetings).
ZeroHedge said energy is arguably peaking this month given the rapid drop in crude, but noted the pipeline for further inflation pressure remains, with intermediate demand still strong. They also pointed to the PPI-CPI spread as a signal that margin pressure is coming for American companies.
Bloomberg said the annual increase shows how this year’s supply-driven surge in energy prices, along with robust demand, is fanning inflation pressures. It cited Carl Weinberg, chief economist at High Frequency Economics, who said the firm core-core gain and rising transportation costs keep inflation risks in focus: “Transportation costs are the channel through which energy prices bleed through into core goods prices.”
Market Reaction
Bonds breathed a sigh of relief. The 2-year Treasury yield is lower on the session by 3 basis points, but that comes after the largest two-day gain since March 2023 (see Thursday’s Charts – Small Caps Slide as 2-Year Has Biggest Two-Day Jump Since March 2023).
Rate-hike odds held steady, with December still pricing in about a 7% chance of a half-point hike, according to CME FedWatch.
What to Watch
The headline miss came from energy. The parts of the report that strip energy out (core goods, core-core, freight, and processed materials) were hotter, and on a year-over-year basis there is broad inflation remaining in the pipeline. October PCE comes out November 25, the day before Thanksgiving, and how much of this flows into core PCE is the number to watch, although as Goldman and BofA note, the readthrough seems to be better than feared. November PPI is due December 15.
Source: Bureau of Labor Statistics.