Thursday’s Charts – Small Caps Slide as 2-Year Has Biggest Two-Day Jump Since March 2023
The 2-year yield had its biggest two-day jump since March 2023 and the dollar hit another 19-month high, while gold fell to its lowest in more than a year and the S&P 500’s run of higher lows ended.
You've reached your free article limit
You've read 0 of 1 free Pro articles.

This is the companion to tonight’s evening update (The Bounce Stalls as Nvidia Ousts Huang and Yields Jump).
In short, Nvidia’s ouster of CEO Jensen Huang and another jump in Treasury yields, as bond traders returned from the holiday to continued hawkish Fed talk, higher oil prices and a weak 30-year auction, stalled the burgeoning Tech rally.
Note on all charts the colored lines are moving averages (the average price over the lookback period — days on the daily charts, weeks on the weekly charts):
20 = green
50 = purple
100 = blue
200 = brown
MACD = Moving average convergence/divergence line, a measure of momentum that compares longer term and shorter term momentum to gauge if a move is strengthening or weakening. This is probably my favorite individual indicator.
RSI = Relative Strength Index (basically what it sounds like) = measures the strength of the move comparing gains to losses over the given lookback window (I use the standard 14 periods).
Note: There was an issue annotating some of the charts tonight. It should be fixed tomorrow.
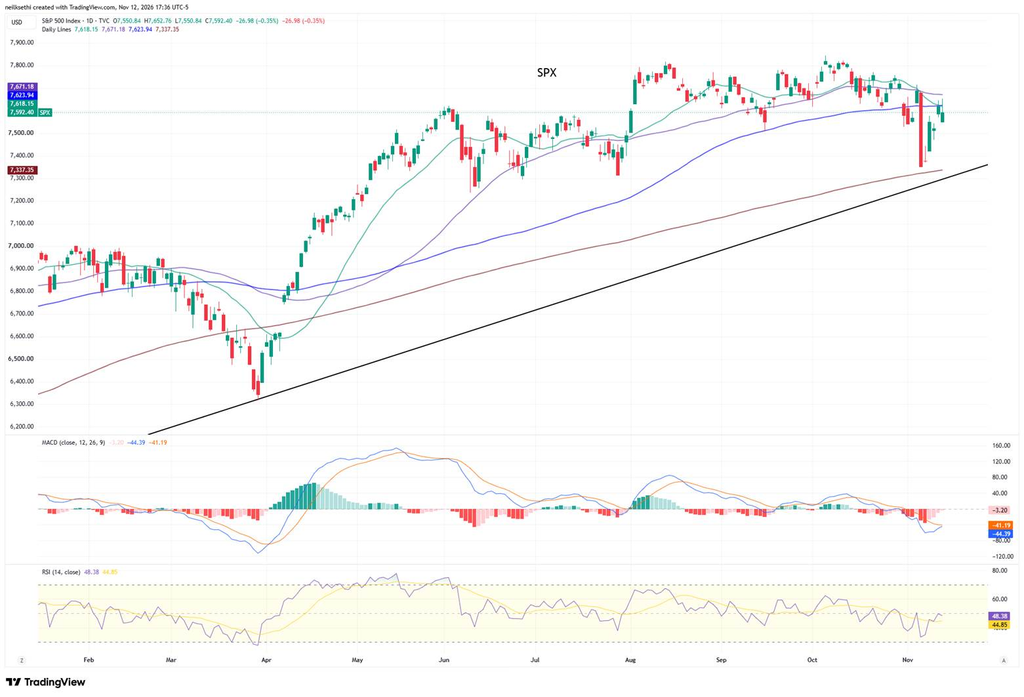
S&P 500
The S&P 500 fell 0.35% to 7,592. It opened at its low of the day (7,551), below Wednesday’s 7,572, ending its run of four straight higher lows. It then topped its 20- and 100-DMAs (7,618 and 7,624) intraday, getting as high as 7,653, before turning back to close below both for a second day, and it remains below its 50-DMA (7,671). The MACD remains in “go short” positioning, and the RSI is at 48. I remain long for now.
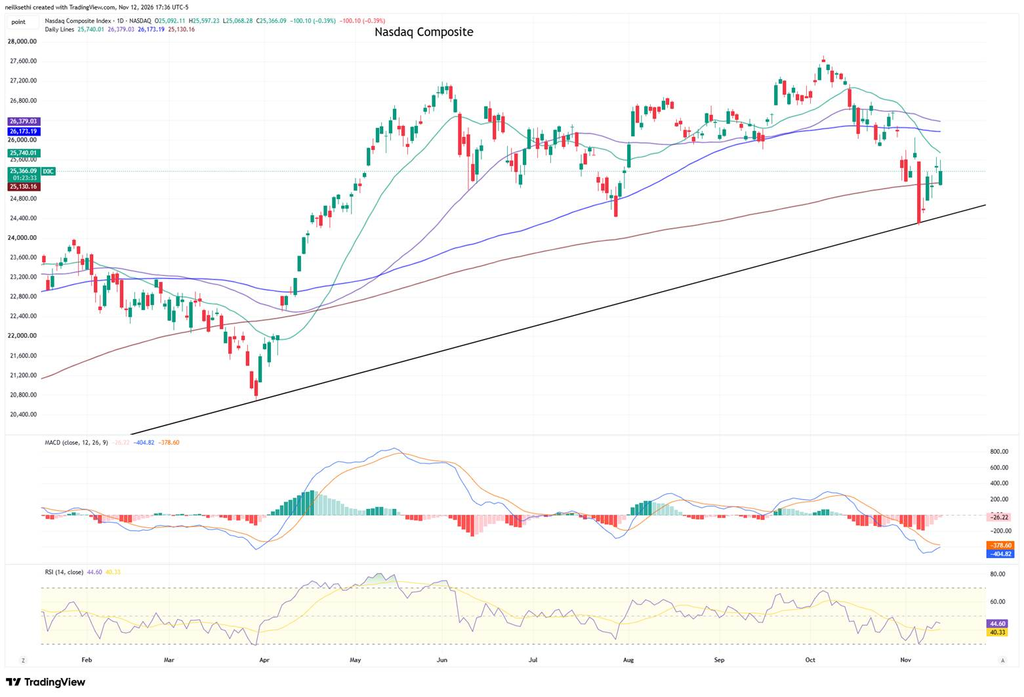
Nasdaq Composite
The Nasdaq Composite fell 0.39% to 25,366 after dropping as much as 1.6% to 25,068, below its 200-DMA (25,130), but it recovered to close back above it. It’s still below its 20-, 50- and 100-DMAs (25,740, 26,379 and 26,173). The MACD remains in “go short” positioning, and the RSI is at 45.
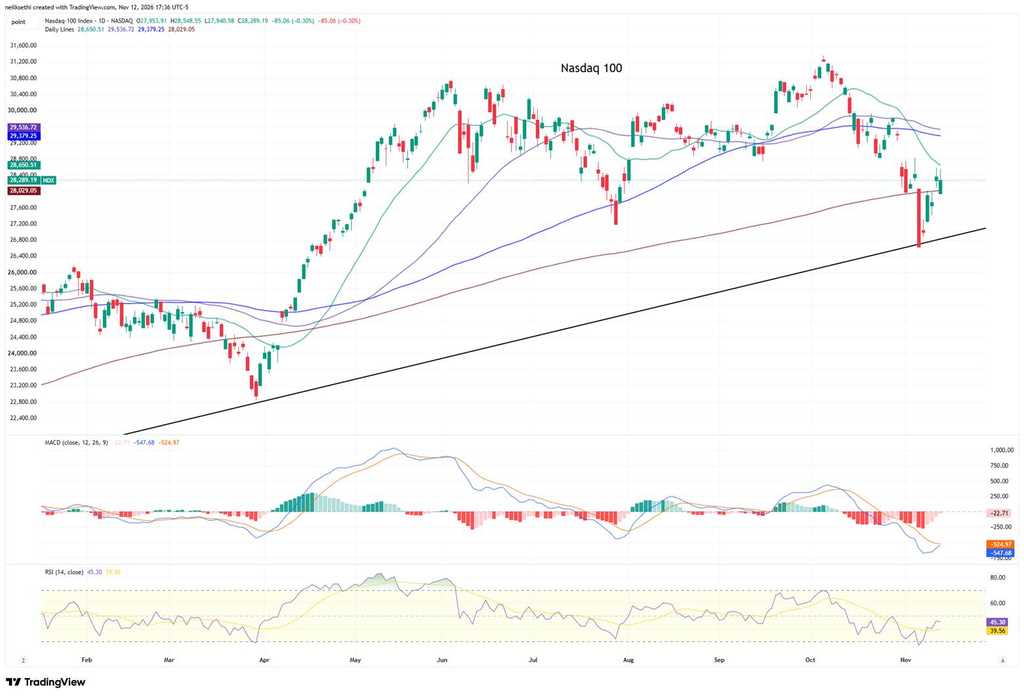
Nasdaq-100 (QQQ)
The Nasdaq-100 fell 0.30% to 28,289 after dropping as much as 1.5% to 27,941, below its 200-DMA (28,029), but it recovered to close above it for a second day. It’s still below its 20-, 50- and 100-DMAs (28,651, 29,537 and 29,379). The MACD remains in “go short” positioning, and the RSI is at 45. I remain long for now.
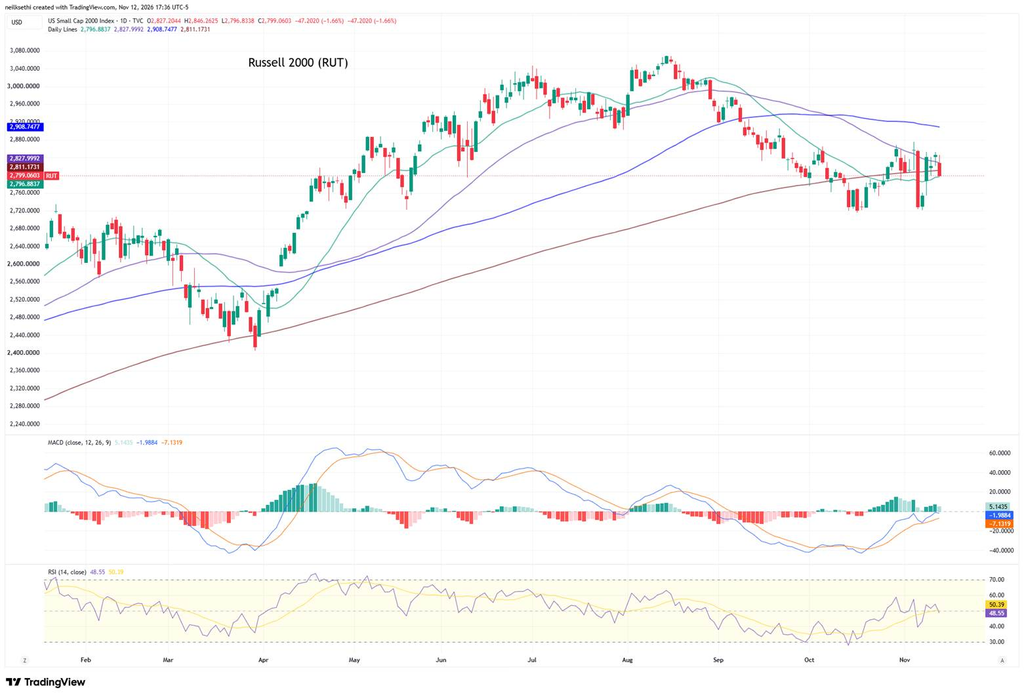
Russell 2000 (RUT)
The Russell 2000 fell 1.66% to 2,799, its worst day in a week, falling back below its 50- and 200-DMAs (2,828 and 2,811) and closing just above its 20-DMA (2,797). It’s still well below its 100-DMA (2,909). The MACD remains in “cover shorts” positioning, and the RSI is at 49. I remain long for now.
Equal-weighted SPX (RSP)
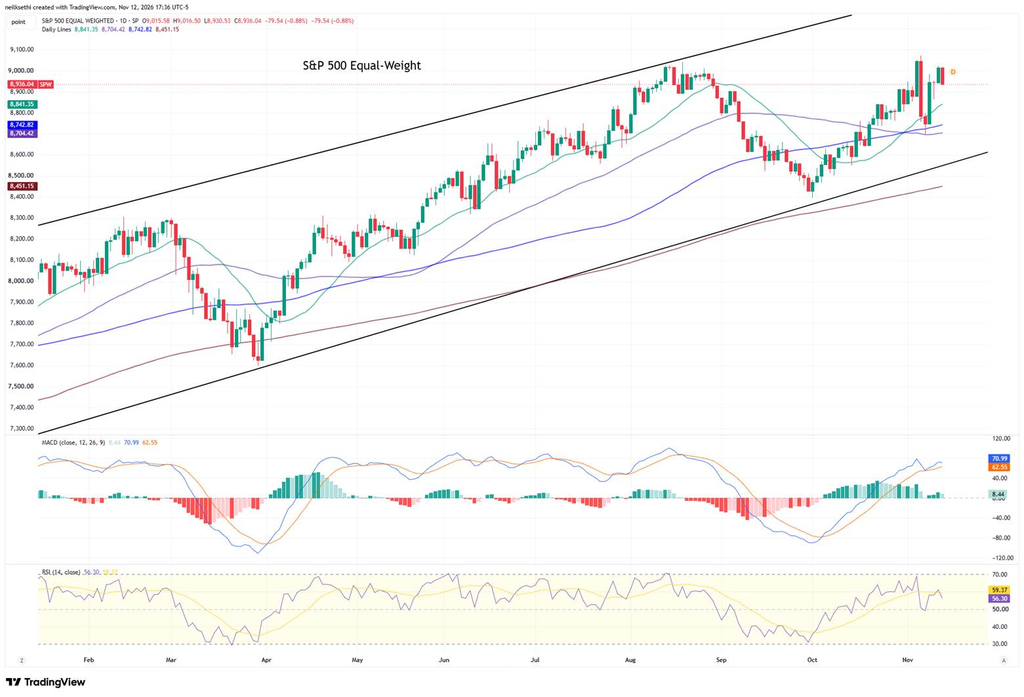
The equal-weighted S&P 500 fell 0.88% to 8,936, lagging the cap-weighted index for a second day, but it remains above all its moving averages, including its 20-DMA (8,841), and within its uptrend channel. The MACD remains in “buy longs” positioning, and the RSI is at 56. I remain long.
2-year Treasury yield
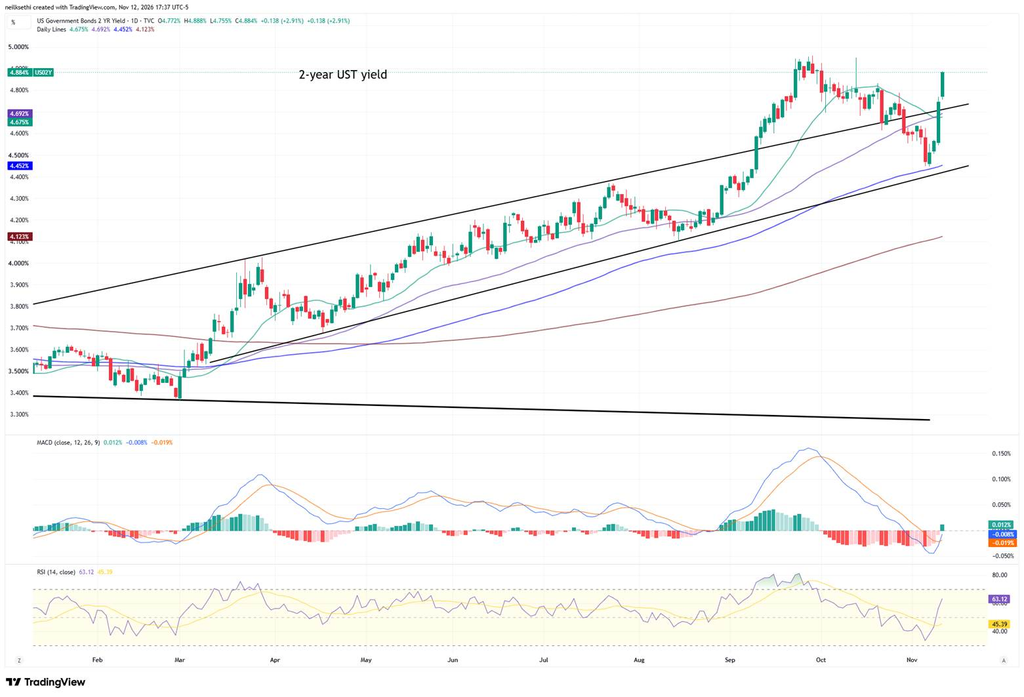
The 2-year yield rose 13.8 basis points to 4.88%, giving it a two-day gain of 31.8bp, the biggest since March 2023, and its highest close since September 29, leaving it within about eight basis points of its late-September high. That extended its move back above its 20- and 50-DMAs (4.68% and 4.69%) and the channel line it broke below in late October. The MACD has moved to “cover shorts” positioning, and the RSI is at 63 showing some momentum for higher yields.
It’s now about 101bp above the midpoint of the Fed funds target range (3.875%), back to pricing in a few more rate hikes. I remain long.
10-year yields
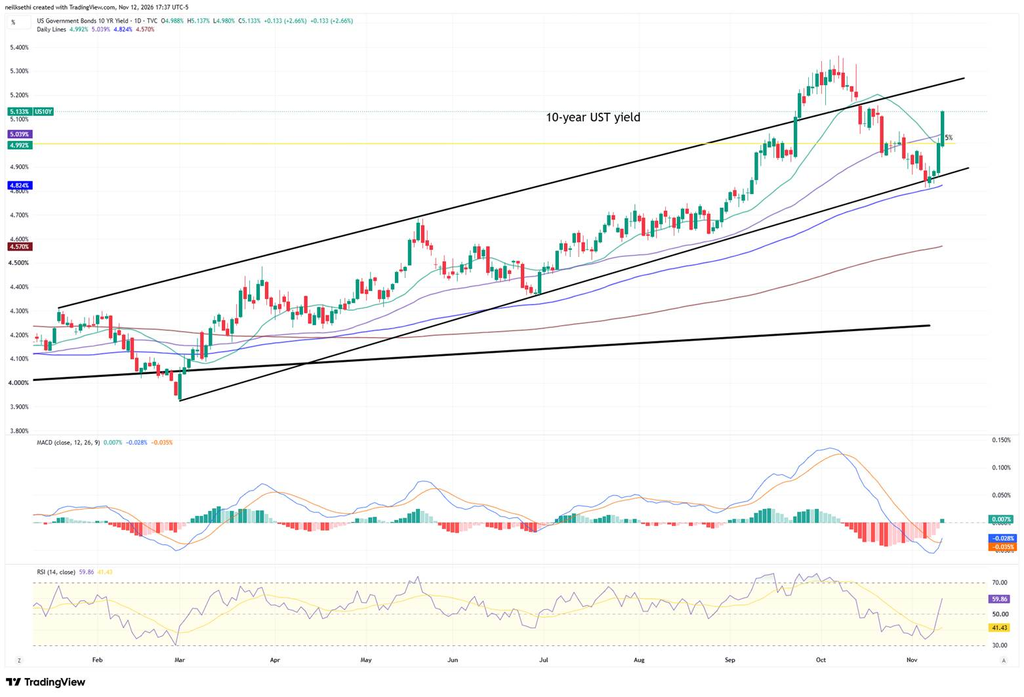
The 10-year yield rose 13.3 basis points to 5.13%, its biggest gain since September 23 and its highest close since October 21. That took it back above the 5% level and its 20- and 50-DMAs (4.99% and 5.04%), keeping it inside the rising channel it’s been in since March. The MACD has moved to “cover shorts” positioning, and the RSI is at 60 showing some momentum for higher yields. I remain long but trimmed some today.
30-year yields
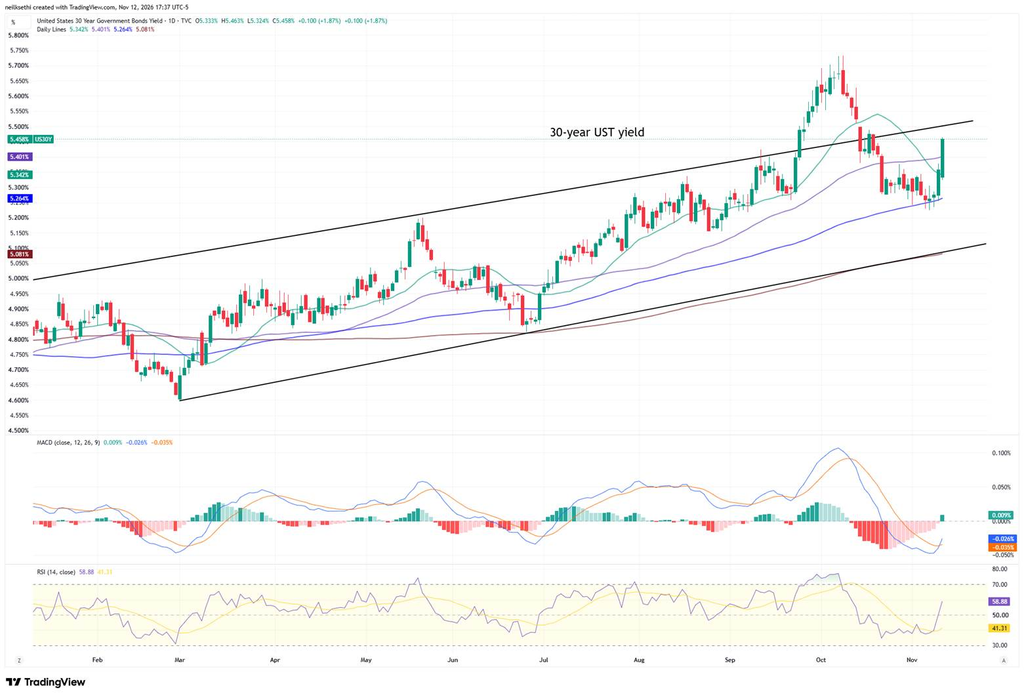
The 30-year yield rose 10 basis points to 5.46%, its biggest gain since May 15 and its highest close since October 19, as the 30-year auction tailed on weaker demand. That took it back above its 20- and 50-DMAs (5.34% and 5.40%), leaving it just below the upper line of the channel it fell back into in mid-October. The MACD has moved to “cover shorts” positioning, and the RSI is at 59, again showing momentum for higher yields. I remain long via TLT.
VIX
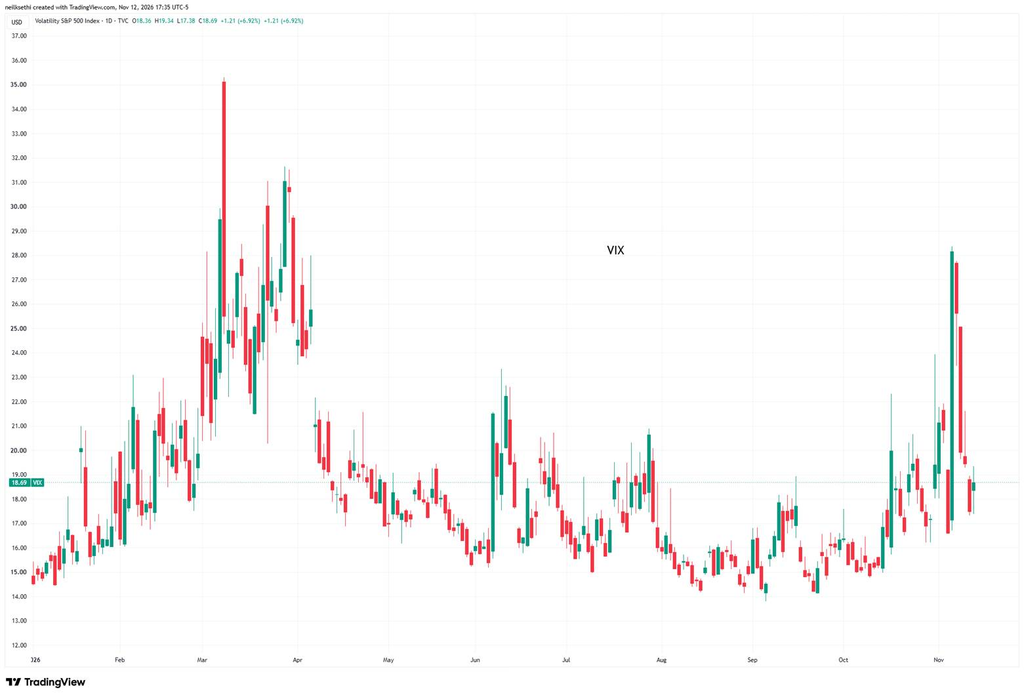
The VIX rose 6.92% to 18.69 after topping out at 19.34, its highest close since Tuesday (19.45), after falling 38% over the prior four sessions. It now implies a daily move of about 1.18% over the next 30 days.
VVIX
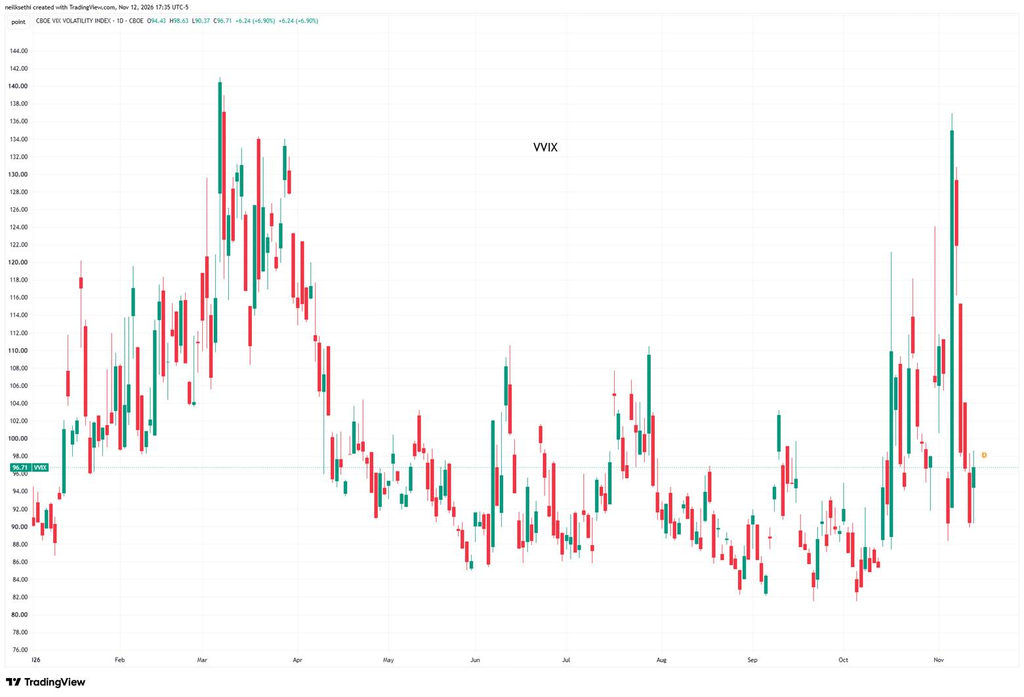
VVIX (the VIX of the VIX) rose 6.90% to 96.71 after topping out at 98.63, its highest close since Monday, reversing Wednesday’s 6.37% drop. The current level is consistent with “moderate” daily moves in the VIX over the next 30 days (historically, normal is 80-100, although we haven’t been below 80 since July 2024), and it remains below the 100 level flagged by Charlie McElligott as indicating higher stress.
1-day VIX
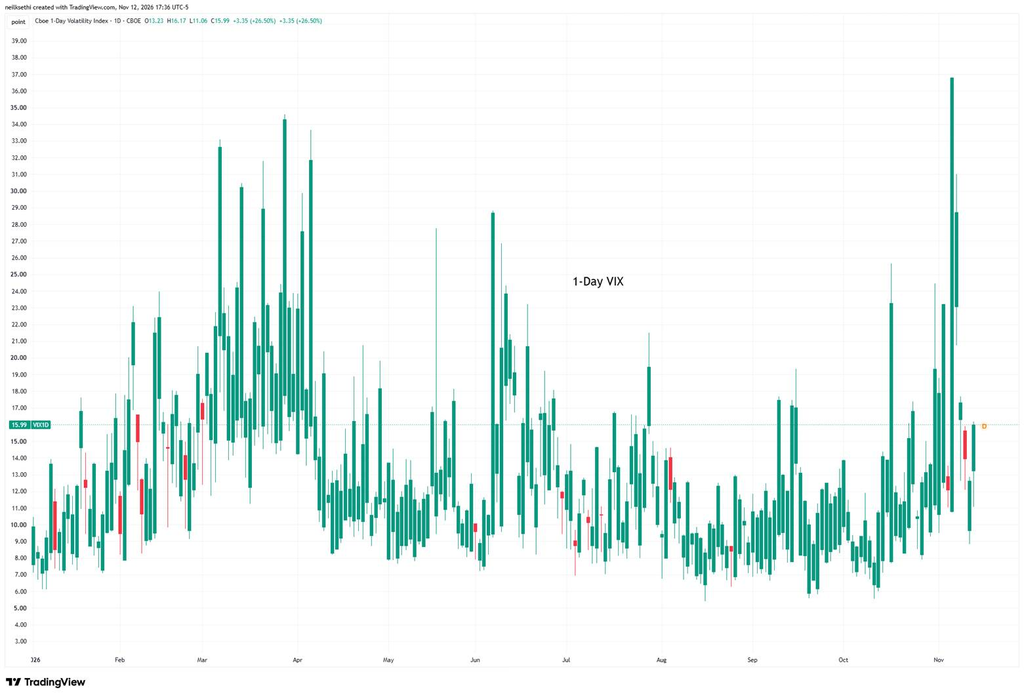
Wednesday’s 1-day VIX implied a move of about 0.80% for Thursday, and the S&P 500 fell 0.35%. The 1-day VIX then jumped 26.5% to 15.99, its highest close since Monday, implying a move of about 1.01% for Friday, which brings October PPI.
WTI futures (/CL)
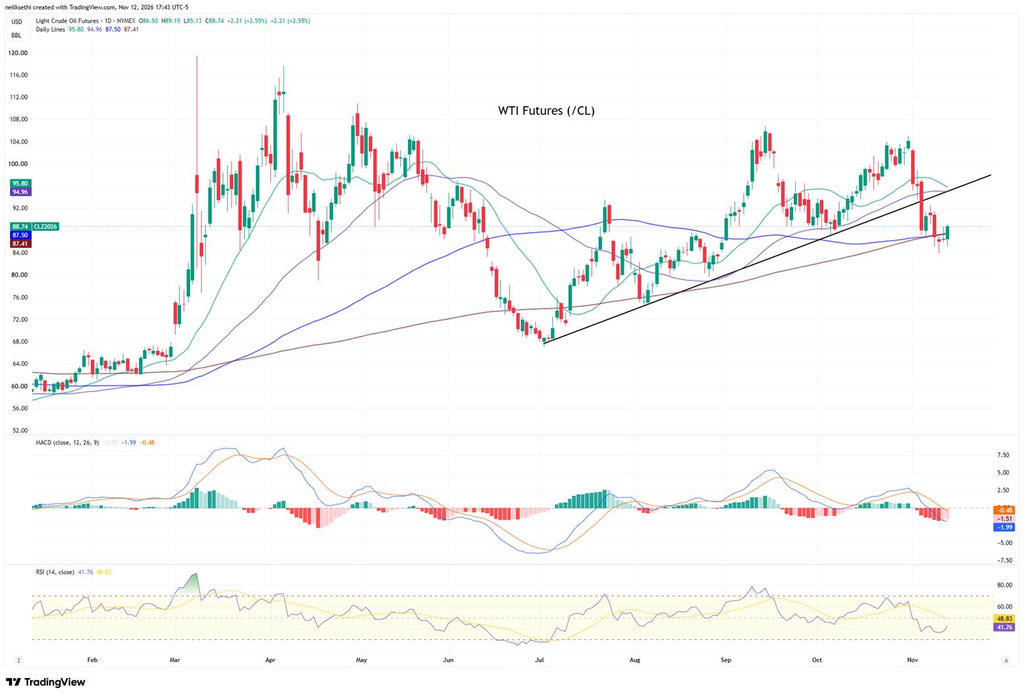
WTI futures rose 2.55% to $88.74, their highest close since November 6, reversing an early drop to $85.13 after President Trump said the US doesn’t need a deal with Iran. That took them back above their 100- and 200-DMAs ($87.50 and $87.41), which they had topped intraday Wednesday but closed below. They’re still below their 20- and 50-DMAs ($95.80 and $94.96) and the uptrend line from the July low. The MACD is in “go short” positioning, and the RSI is at 42.
DXY
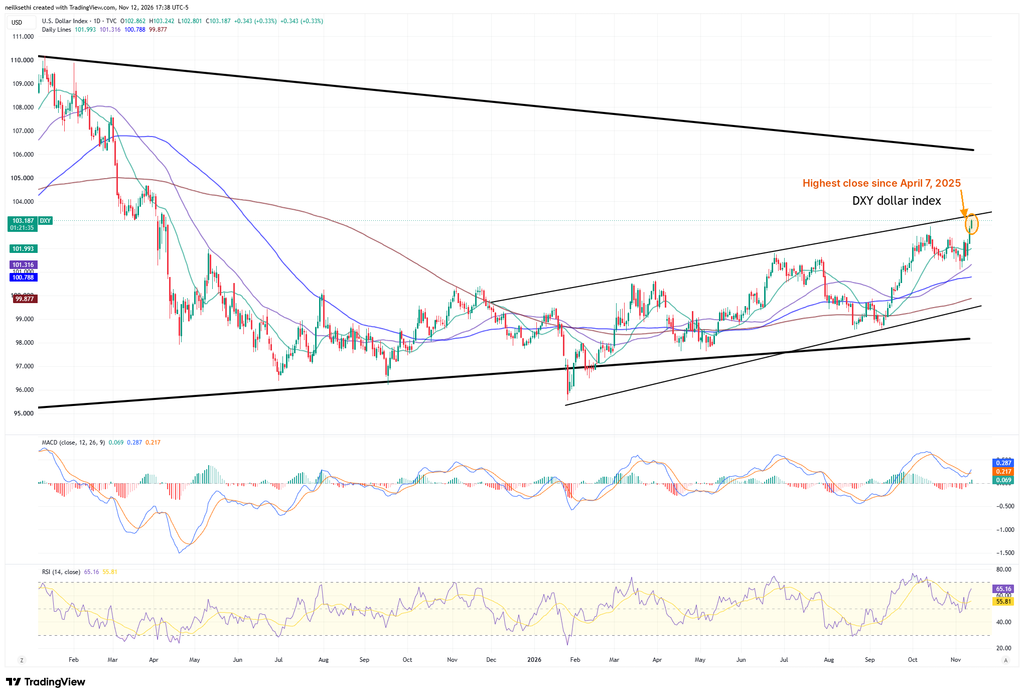
The DXY dollar index (which is fixed weighted with a heavy — 57% — allocation to the euro) rose 0.33% to 103.19, another highest close since April 7, 2025, leaving it just below the line connecting its highs since December. It’s above all its moving averages, including the 20-DMA (101.99). The MACD remains in “buy longs” positioning, and the RSI is at 65.
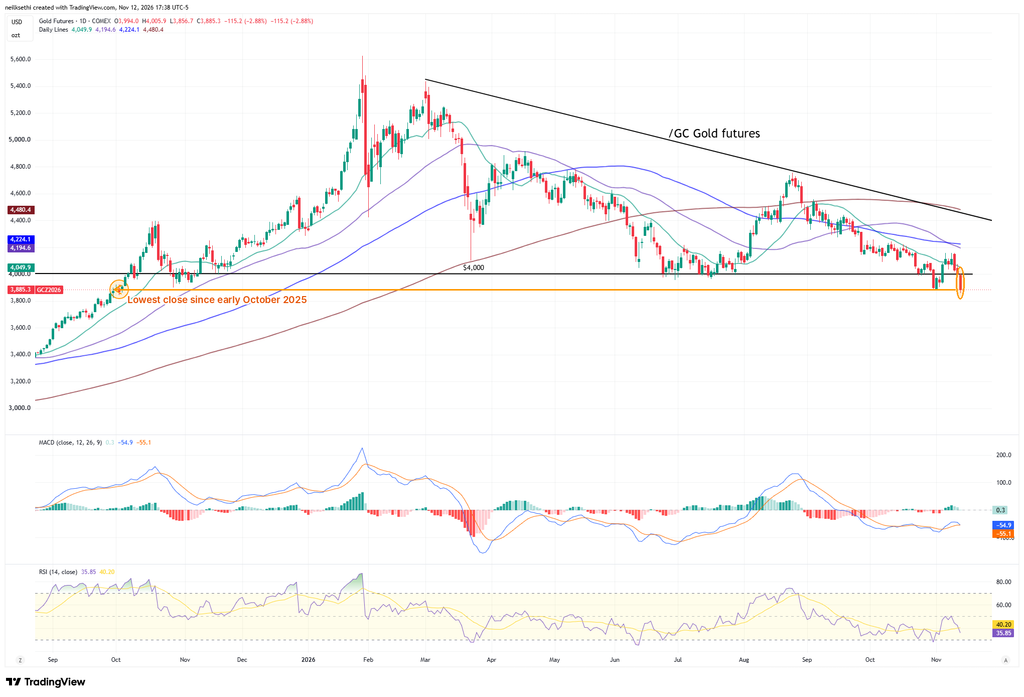
Gold futures (/GC)
Gold futures fell 2.88% to $3,885 (including post-market) after dropping as low as $3,857, their worst day since October 30 and their lowest close since early October 2025 (circled), taking out their early-November lows below the $4,000 line. They’re below all their moving averages, including the 20-DMA ($4,050), and the downtrend line from the March high. The MACD remains in “cover shorts” positioning, barely, and the RSI is at 36.
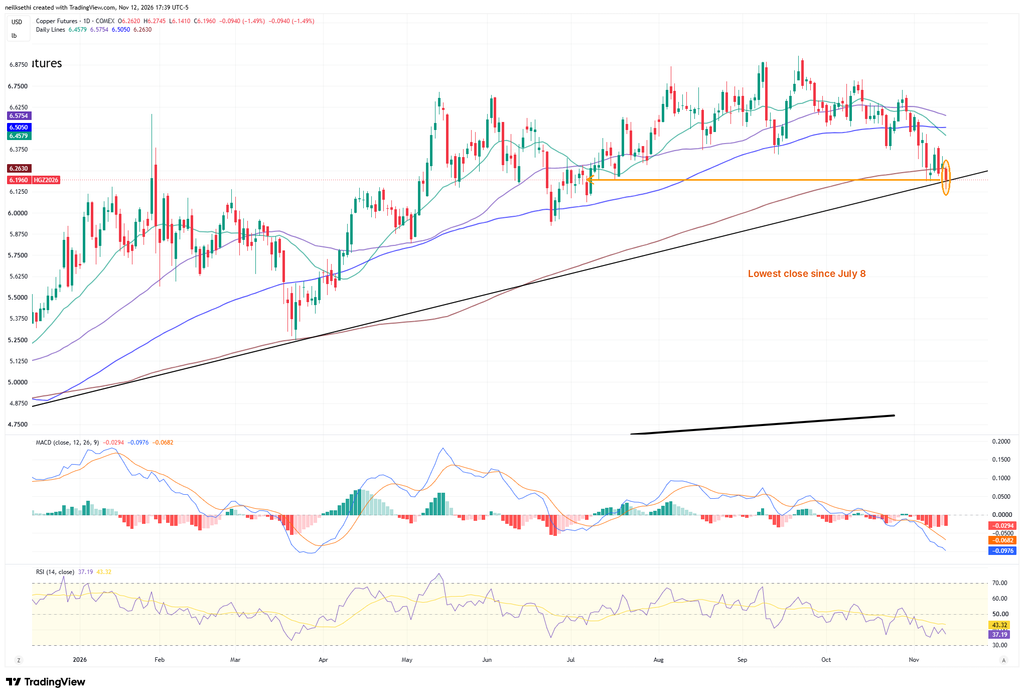
Copper futures (/HG) and the copper ETF (CPER)
Copper futures fell 1.49% to $6.20 (including post-market), their lowest close since July 8, slipping back below their 200-DMA ($6.26) and closing right on the uptrend line from the March low after dipping below it intraday ($6.14). They’re below all their moving averages. The MACD is in “go short” positioning, and the RSI is at 37.
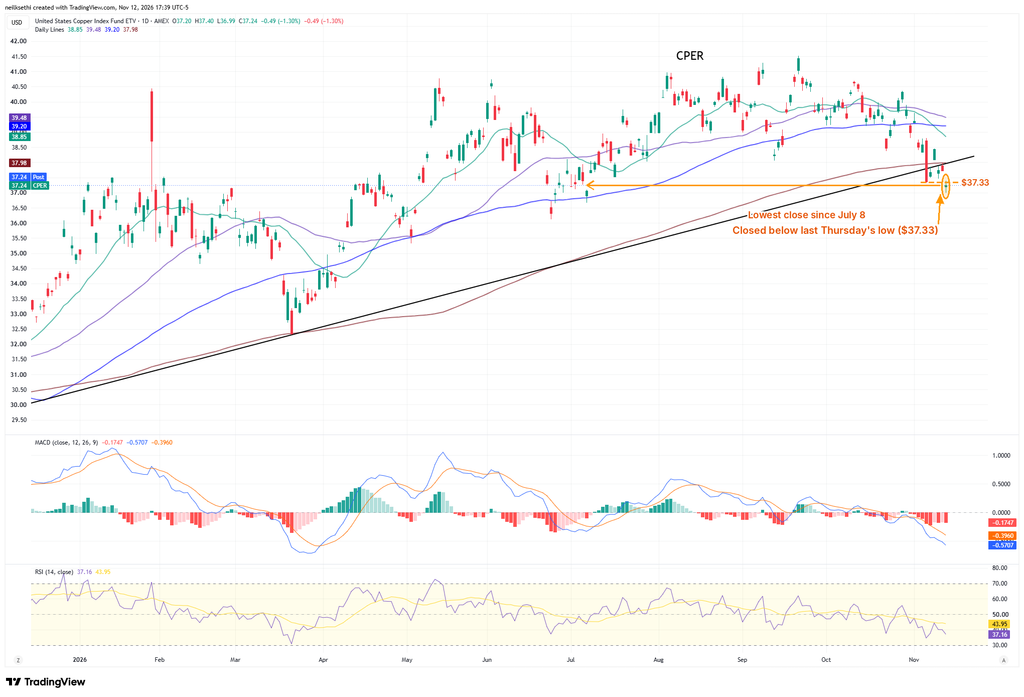
The copper ETF (CPER) fell 1.30% to $37.24, its lowest close since July 8, closing below last Thursday’s low ($37.33) after dipping as low as $36.99. It remains below all its moving averages, including the 200-DMA ($37.98), and the uptrend line. The MACD is in “go short” positioning, and the RSI is at 37. I sold my position as it broke below that Thursday low.
Natural gas futures (/NG)
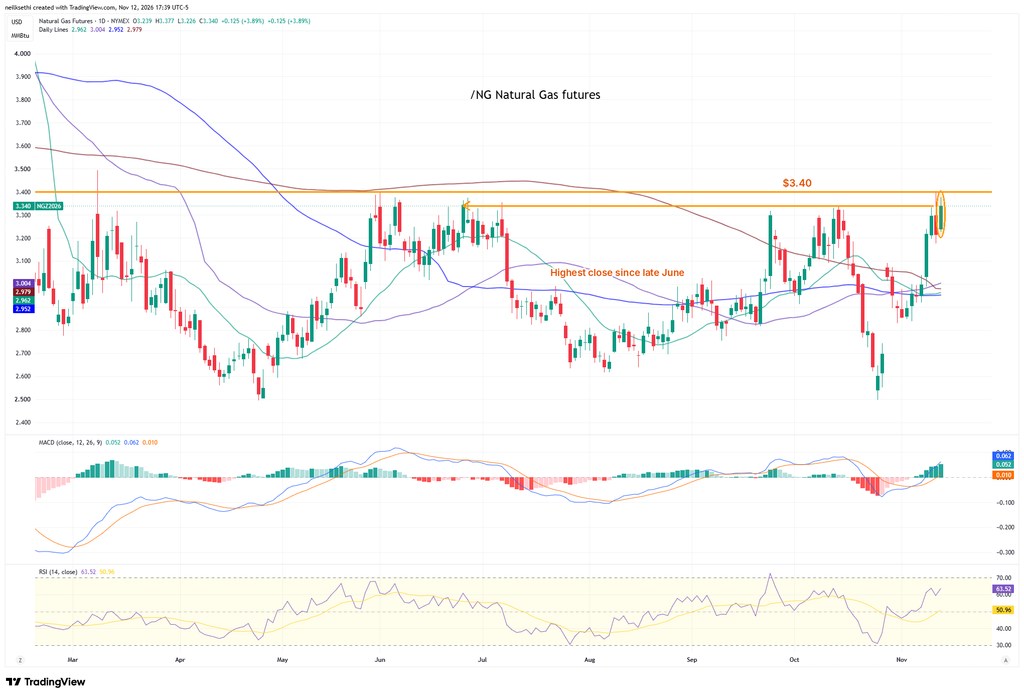
Natural gas futures rose 3.89% to $3.34 (including post-market), their highest close since late June, but they again topped out just below the $3.40 level that has capped their moves since mid-February ($3.377). They remain above all their moving averages. The MACD is in “buy longs” positioning, and the RSI is at 64.
Bitcoin futures
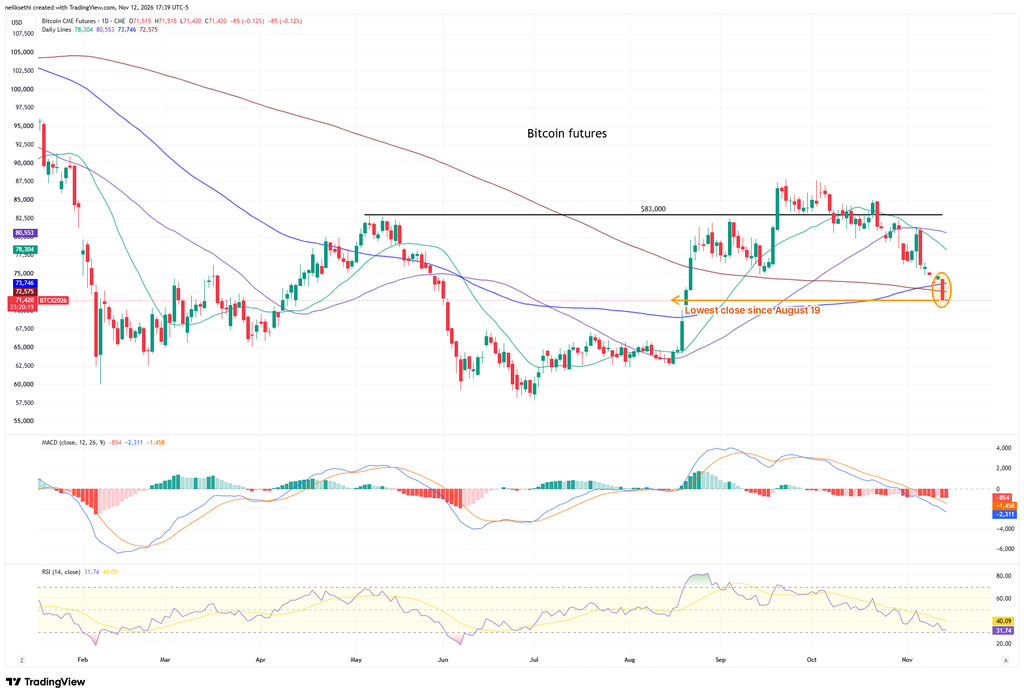
Bitcoin futures fell 4.18% to 71,605, their lowest close since August 19, breaking below both their 100- and 200-DMAs (73,746 and 72,575). They’re also below their 20- and 50-DMAs (78,304 and 80,553) and the $83,000 level. The MACD is in “go short” positioning, and the RSI is at 32. I went short IBIT this morning.
Market breadth
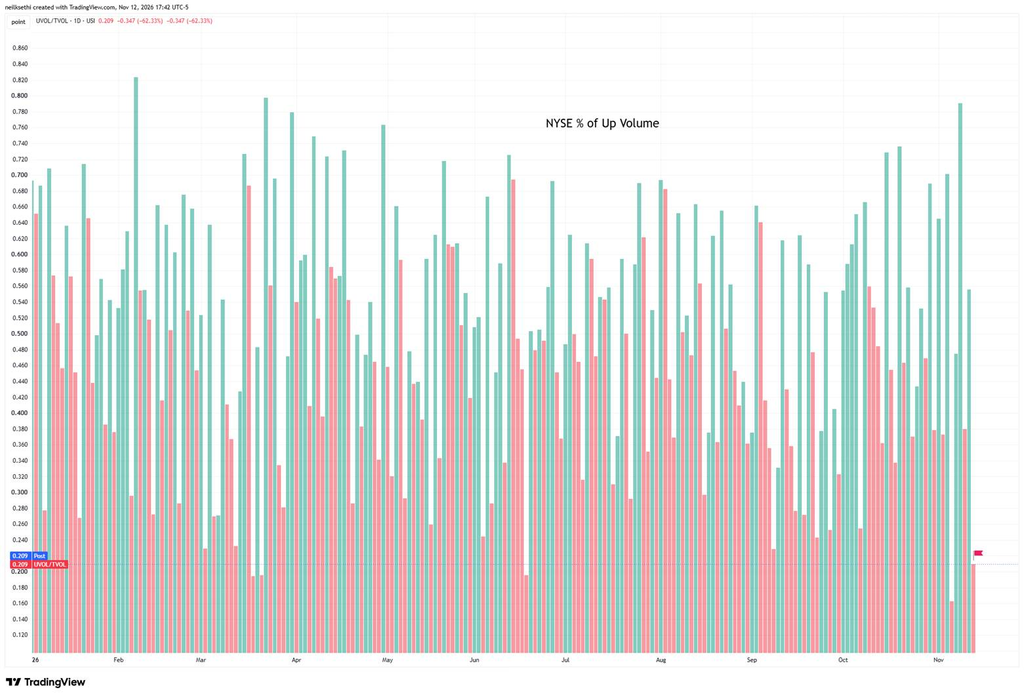
NYSE positive volume was very weak at 20.9% (the second worst since June) on a 0.74% loss in the NYSE Composite. That compares with 37.9% on October 30, when the index fell more (0.91%)
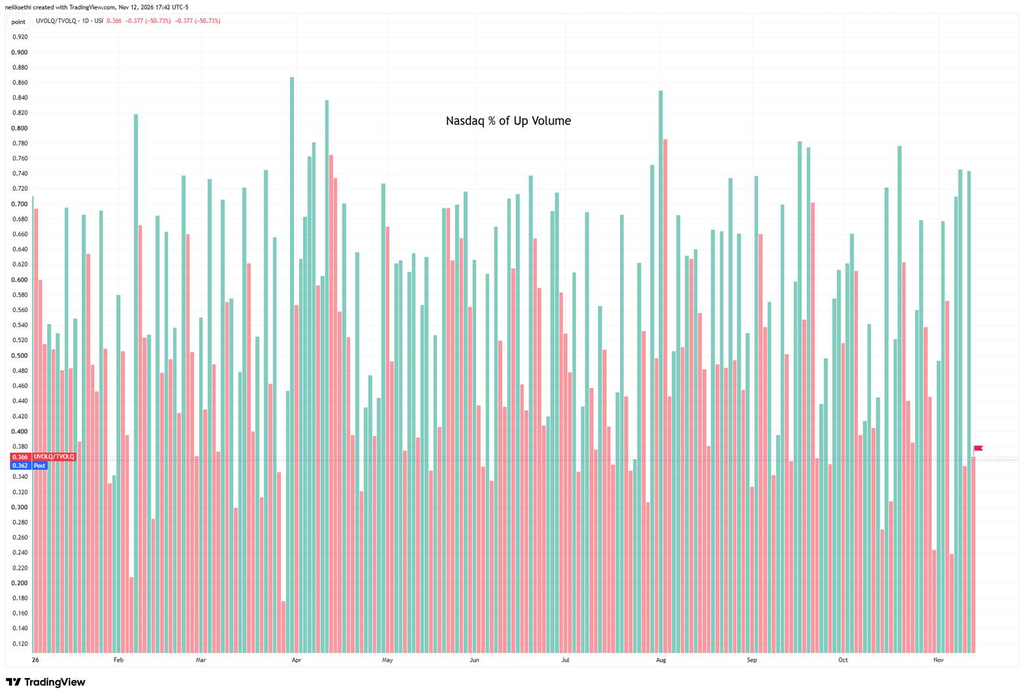
Nasdaq positive volume was not great either at 36.6%, its lowest since Tuesday, on a 0.39% loss.
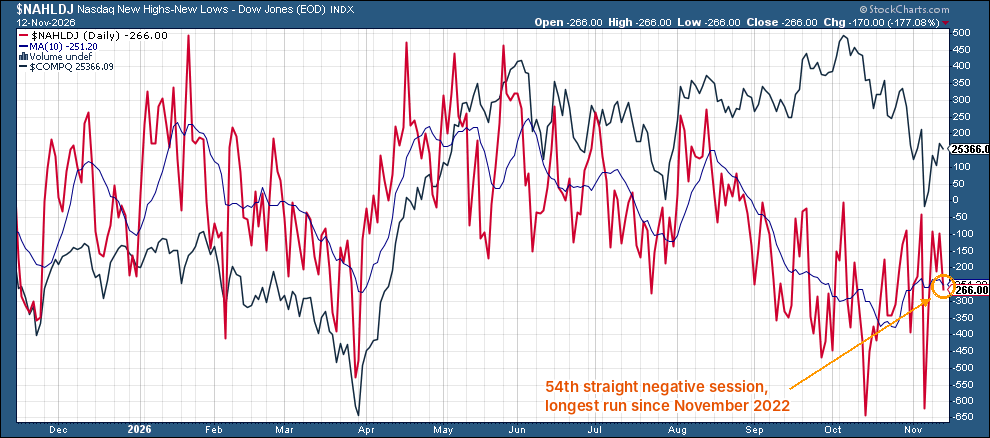
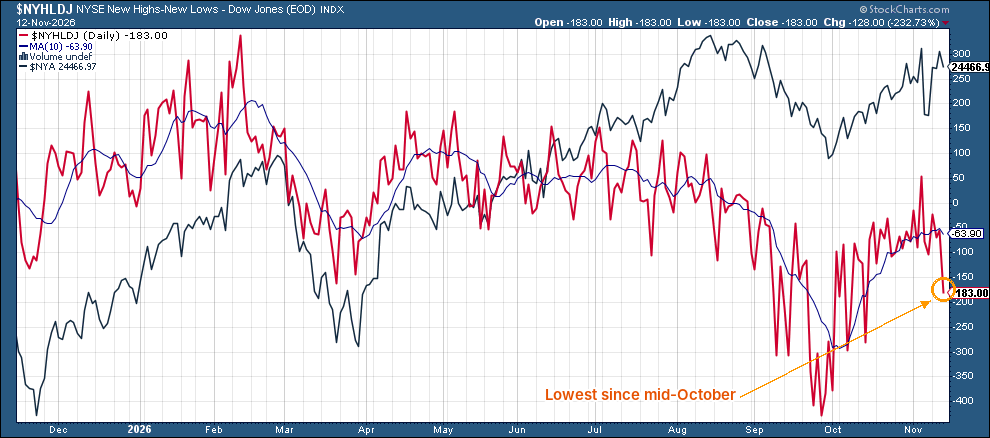
52-week highs minus lows on the Nasdaq fell to -266 from -96, its lowest since last Friday (-319), for its 54th straight negative session, extending the longest run since November 2022. On the NYSE, it fell to -183 from -55, its lowest since mid-October.
At the time of publication, in terms of securities mentioned, Sethi was long IWM, QQQ, RSP, SPY and numerous Treasury ETFs, and short IBIT. In the last 24 hours Sethi sold CPER, shorted IBIT and sold some of his short term Treasury ETFs (reallocation).