Producer Prices Jump the Most Since 2022 on Record Energy Surge
After Wednesday’s hot CPI print, PPI comes in even hotter, more than double estimates in a broad advance led by a record jump in energy prices.
You've reached your free article limit
You've read 0 of 1 free Pro articles.
U.S. PPI Final Demand, September (month-over-month): 1.3% (estimate 0.6%; prior 0.4%; prior revised 0.5%)
— Final Demand (year-over-year): 6.3% (estimate 5.4%; prior 5.4%; prior revised 5.6%)
— Ex-Food and Energy (month-over-month): 0.7% (estimate 0.3%; prior 0.2%)
— Ex-Food and Energy (year-over-year): 5.0% (estimate 4.4%; prior 4.6%; prior revised 4.8%)
— Ex-Food, Energy and Trade (month-over-month): 0.5% (prior 0.3%)
— Ex-Food, Energy and Trade (year-over-year): 5.0% (prior 4.7%; prior revised 4.8%)
Quick Summary
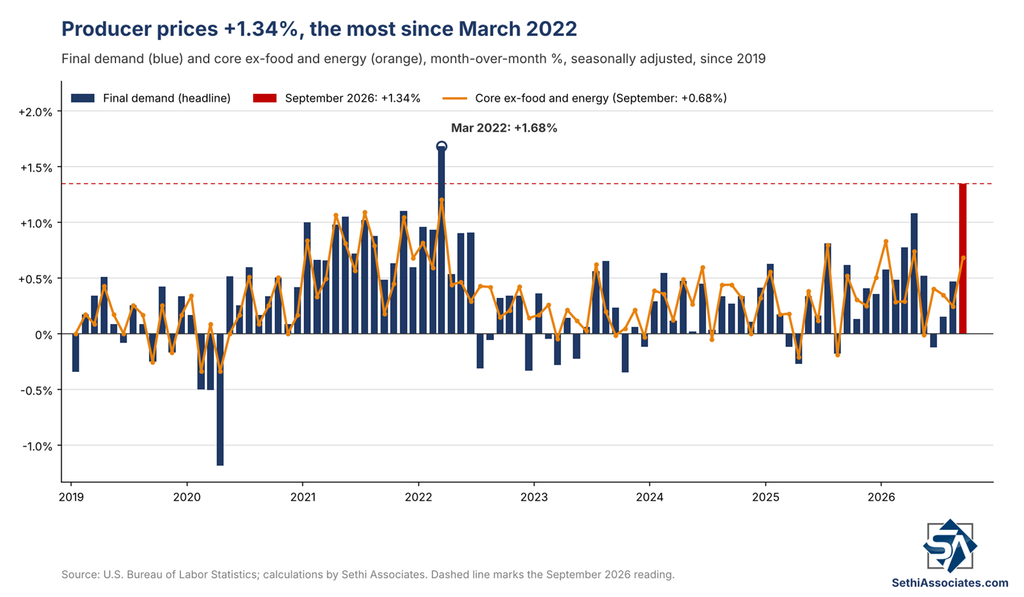
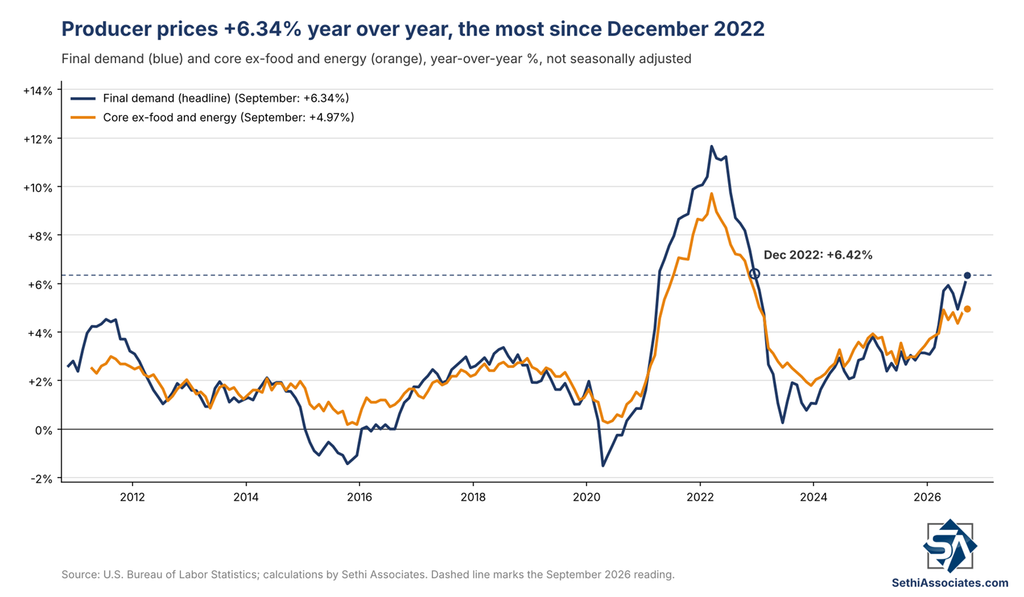
- Final demand producer prices rose 1.34% in September, the most since March 2022, more than double the 0.6% expected, after an upwardly revised 0.47% gain in August (initially reported as 0.40%). Prices were up 6.34% from a year earlier, the most since December 2022, above the 5.4% expected.
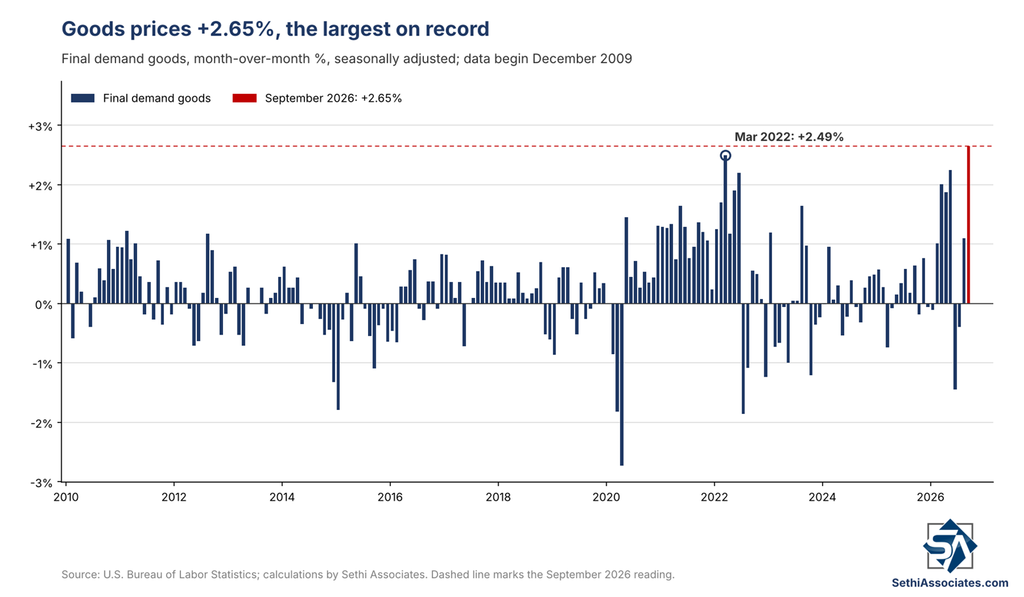
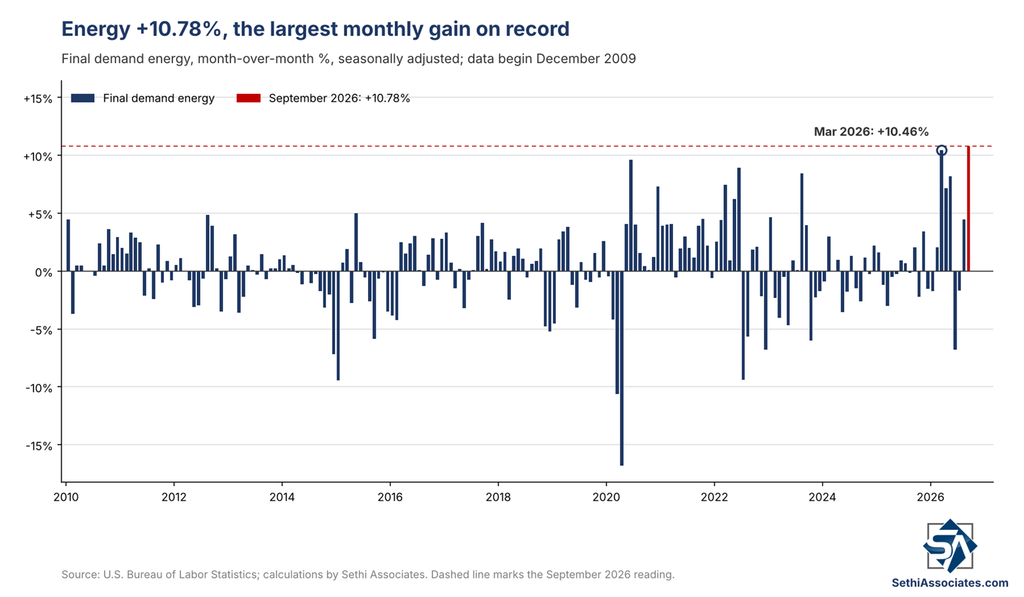
- Energy posts a record jump. Final demand goods jumped 2.65%, the largest increase since data were first calculated in December 2009, with over 80% of the gain from a 10.78% surge in energy, the most on record, and gasoline (up 20.3%) alone accounting for half the goods increase.
- Core ran hot too. Excluding food and energy, producer prices rose 0.68%, the most since April, more than double the 0.3% expected, and 4.97% from a year earlier, the most since January 2023. Excluding food, energy, and trade services, prices rose 0.49% and 5.04% year over year, matching June for the most since October 2022.
- Services firmed up 0.82%, the most since January, with nearly half the gain from a 1.38% rise in trade services margins, the most since April and potentially reflecting tariff pass-through, and transportation and warehousing up 3.44%, also the most since April. Core-core services rose 0.25%.
- The pipeline surged. Unprocessed goods for intermediate demand jumped 8.37%, the most since February 2022, and processed goods rose 2.52%, the most since May, both driven by energy. Year over year they are up 21.50% and 14.14%, respectively, and stage 2 of the production flow rose 3.88%, the most since February 2022.
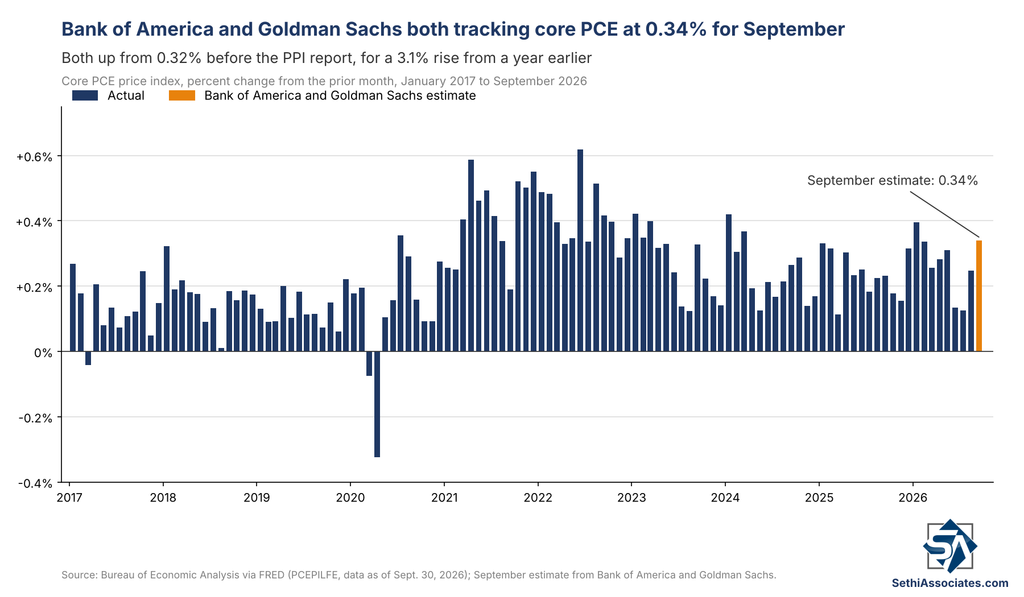
- The Fed angle. Inputs to the Fed’s preferred inflation gauge were mixed, with airfares up 5% but healthcare categories relatively soft, according to Bloomberg. Bank of America and Goldman Sachs both raised their September core PCE estimates to 0.34% month over month from 0.32%, which would lift the year-over-year rate to about 3.1%. Surprisingly, Treasury yields fell sharply, with the 2-year down 7 basis points and the 10- and 30-year down 13 basis points, while odds of an October hike slipped to 29% from 33%.
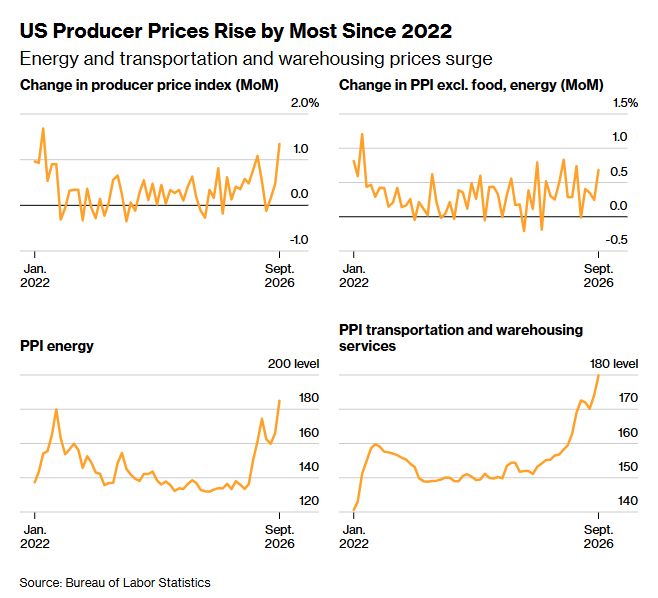
This report breaks producer prices into two components: final demand goods (those sold on to retailers and wholesalers) and intermediate demand goods (in various stages of becoming final goods). All the headline numbers, news-service quotes, and estimates refer to final demand, but I go through both. This report is the “pig in the python,” particularly for intermediate goods, which by definition are still moving through the chain toward final demand. If final-demand prices move higher, that either gets passed along to consumers (lifting the Consumer Price Index) or absorbed by companies (compressing margins).
Final Demand
September final demand producer prices came in well above expectations at +1.34%, the most since March 2022 (+1.68%), more than double the 0.6% expected and above all estimates in a Bloomberg survey. It follows an upwardly revised +0.47% gain in August (initially reported as +0.40%), while July was revised up to +0.15% (initially reported as unchanged). On a year-over-year basis, final demand prices rose 6.34%, the most since December 2022, above the 5.4% expected, up from a revised 5.61% in August and topping the 5.92% in May.
Goods prices jumped +2.65%, “the largest increase since data were first calculated in December 2009,” topping the +2.49% in March 2022, after +1.09% in August. “Over 80 percent of the broad-based rise” came from energy, which surged +10.78%, the most on record, topping March’s +10.46%, after +4.46% in August (revised from +4.16%).
Half of the goods increase traced to gasoline, which jumped 20.3%. Diesel fuel, fresh and dry vegetables, jet fuel, residential electric power, and crude petroleum also rose. In contrast, chicken eggs dropped 39.7%, and thermoplastic resins and materials and commercial electric power also declined. ZeroHedge noted the energy index “is now at a record high (clearly tracking diesel prices more than crude).”
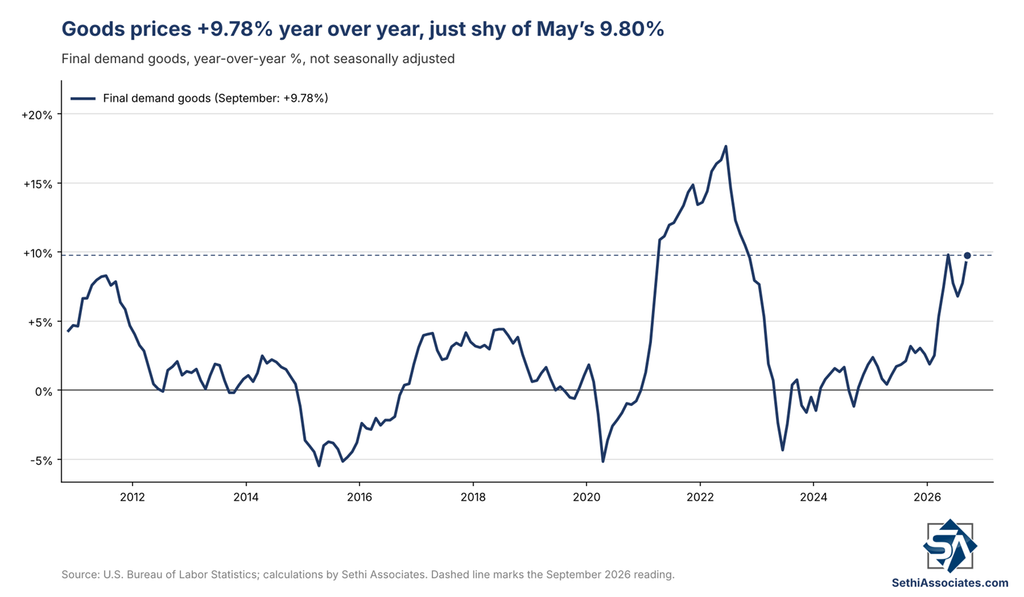
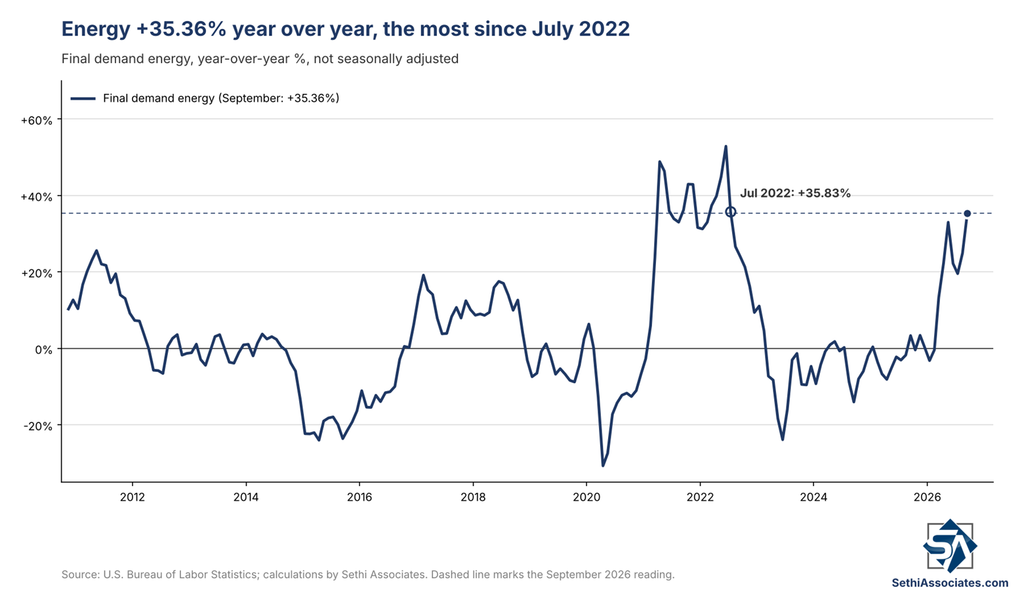
From a year earlier goods prices were +9.78%, just shy of May’s 9.80%, which was the highest since October 2022, led by energy +35.36%, the most since July 2022, topping May’s 33.01%.
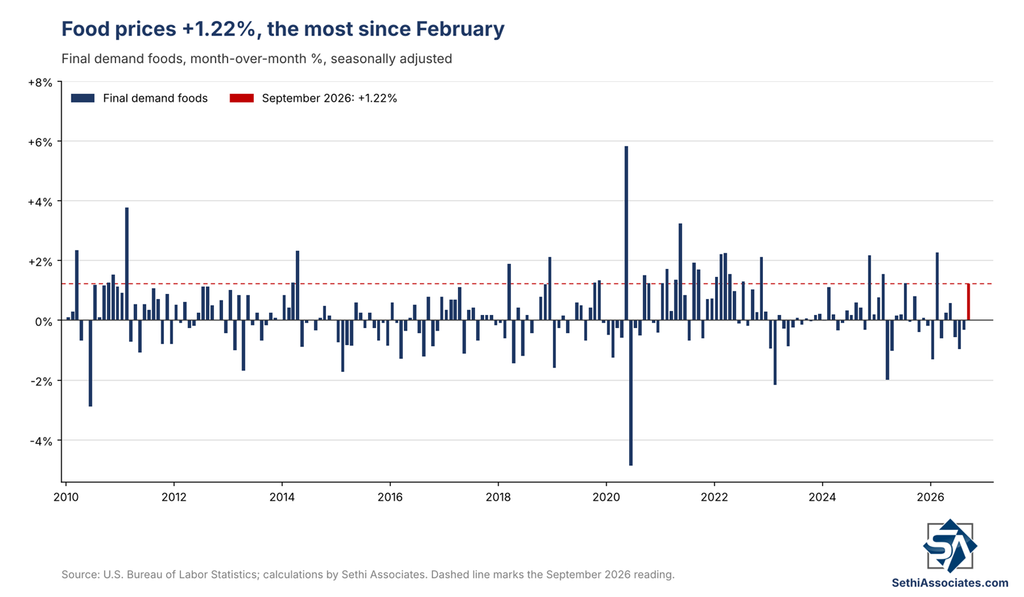
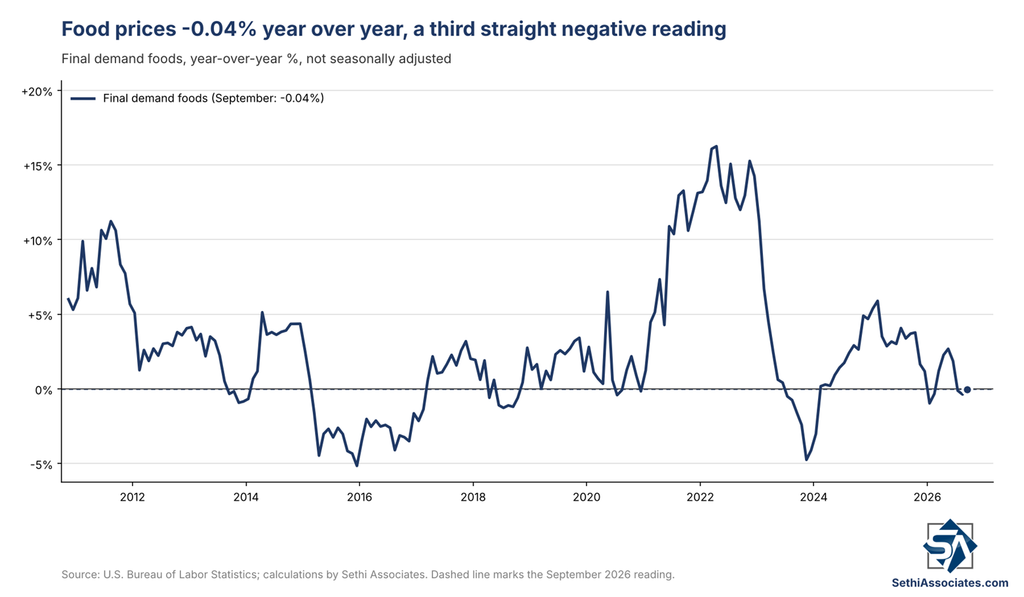
Food prices jumped +1.22% m/m, the most since February, but were -0.04% y/y. That follows three straight monthly declines, including -0.32% in August (revised from +0.11%), and it is the third straight negative year-over-year reading.
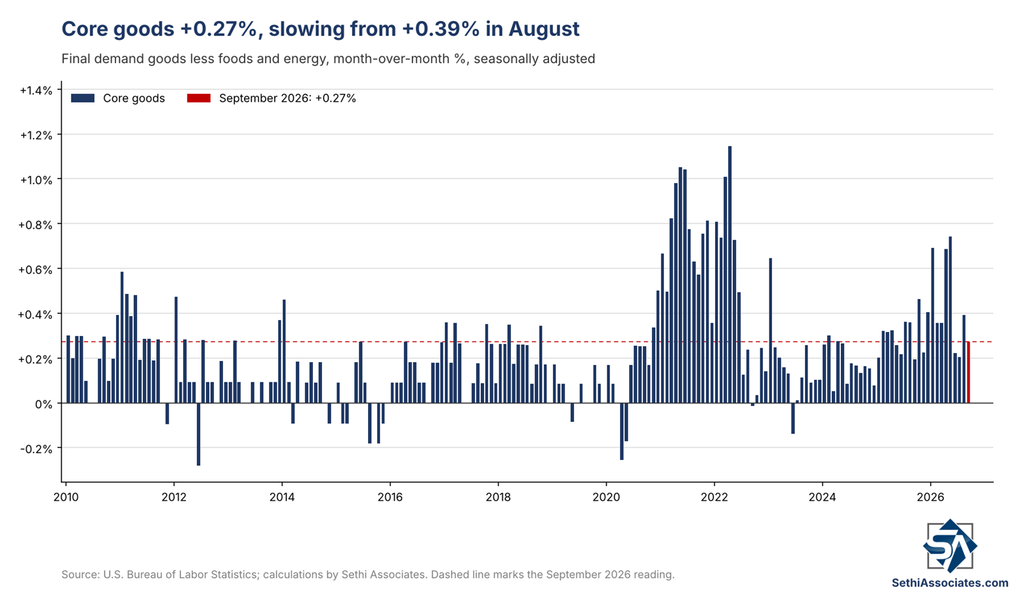
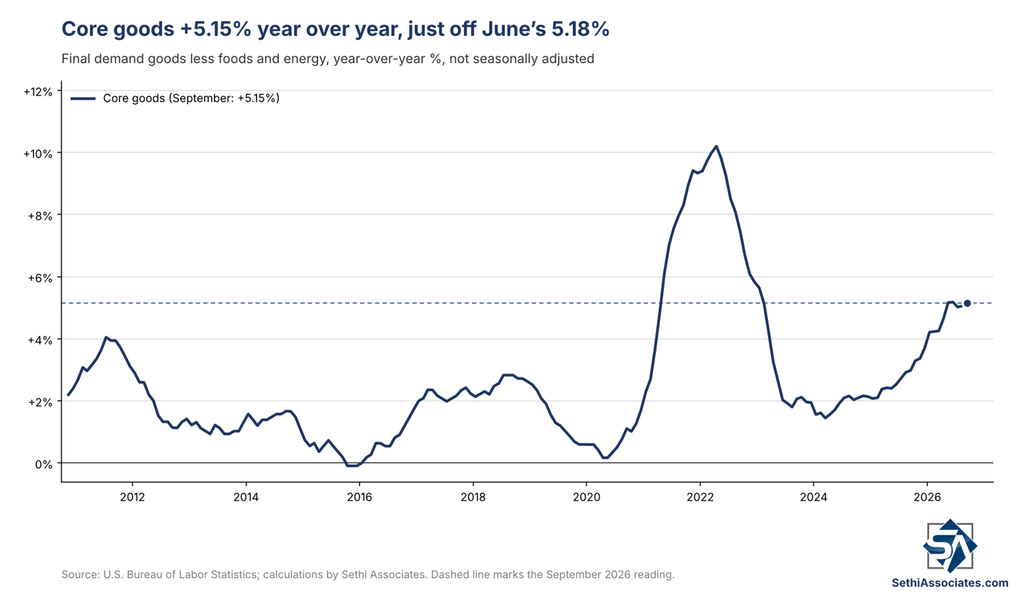
Excluding food and energy, core goods prices rose +0.27%, slowing from +0.39% in August. They are +5.15% y/y, just off June’s 5.18%, which was the highest since January 2023.
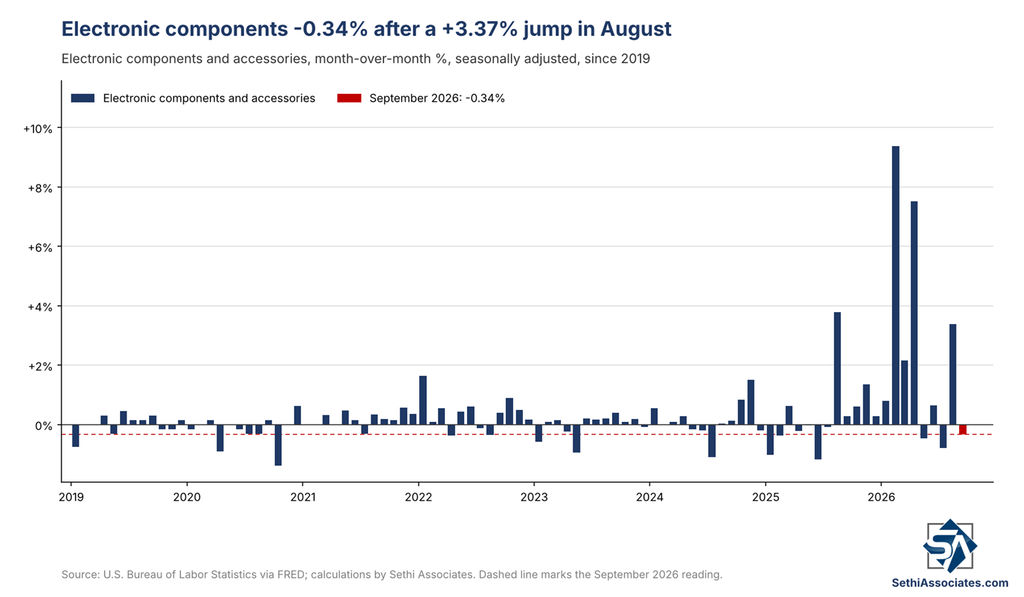
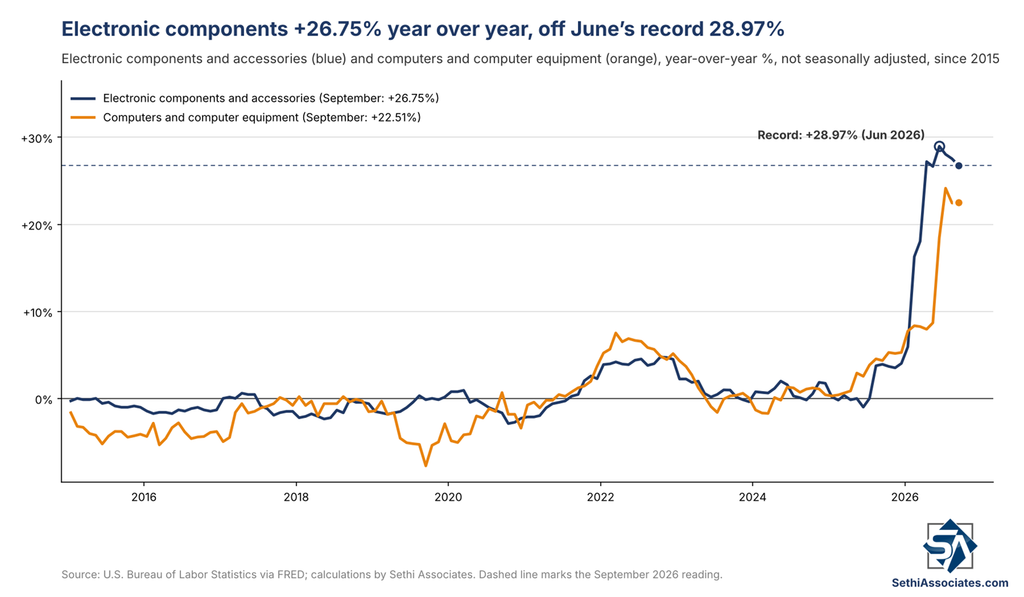
Beyond energy, there was “a slight moderation in categories relevant to the data center buildout,” as Bloomberg put it: electronic components and accessories fell -0.34% (chart), their second decline in three months, after a +3.37% jump in August (revised from +3.45%), while computers and computer equipment edged up +0.10% and broader construction costs were essentially flat (+0.03%). Electronic components and accessories are still +26.75% y/y, easing from 27.54% in August and further off June’s 28.97%, the highest in data going back to 1966, while computers and computer equipment are +22.51% y/y, just below July’s 24.14%, the highest in data going back to 1991.
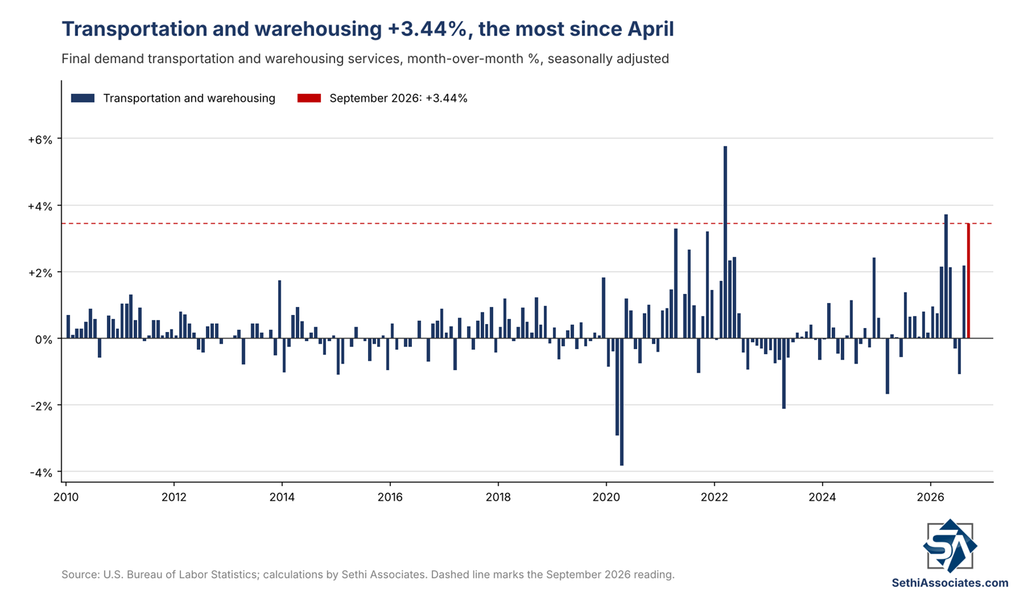
Headline services (roughly 66% of the index) rose +0.82%, the most since January (+0.86%), the fourth consecutive increase. Nearly half the advance came from trade services margins (more below), while transportation and warehousing services rose +3.44% (chart), the most since April’s +3.73% which was the most since March 2022, after +2.18% in August (revised from +2.26%). Truck transportation of freight and airline passenger services were among the indexes that rose. As Carl Weinberg, chief economist at High Frequency Economics, put it in a note cited by Bloomberg: “The jolt to transportation prices affects every good in the economy, since inputs to manufacturing move to factories and goods at all stages of production move from producer to wholesaler to retailer by truck, train or rail. This is how increases in energy prices ‘bleed through’ to prices of core goods.”
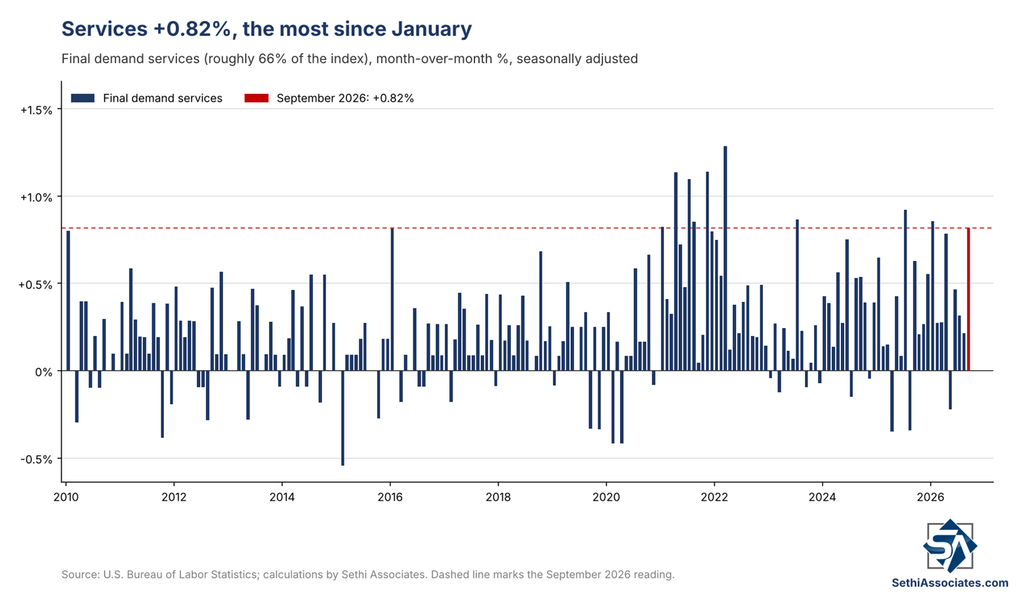
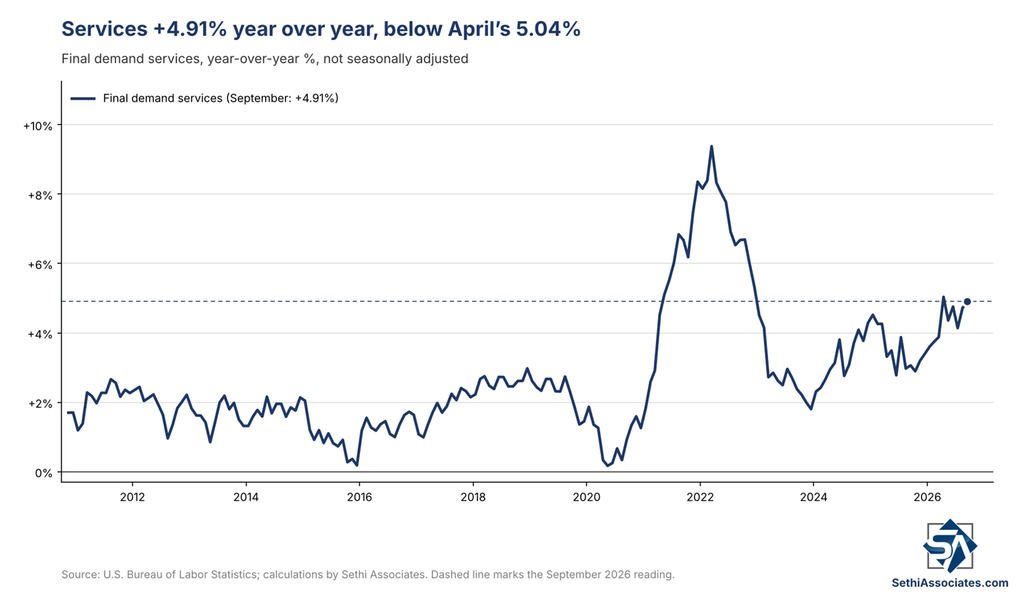
Headline services are +4.91% y/y, up from a revised 4.72% in August but below April’s 5.04%, which was the highest since December 2022.
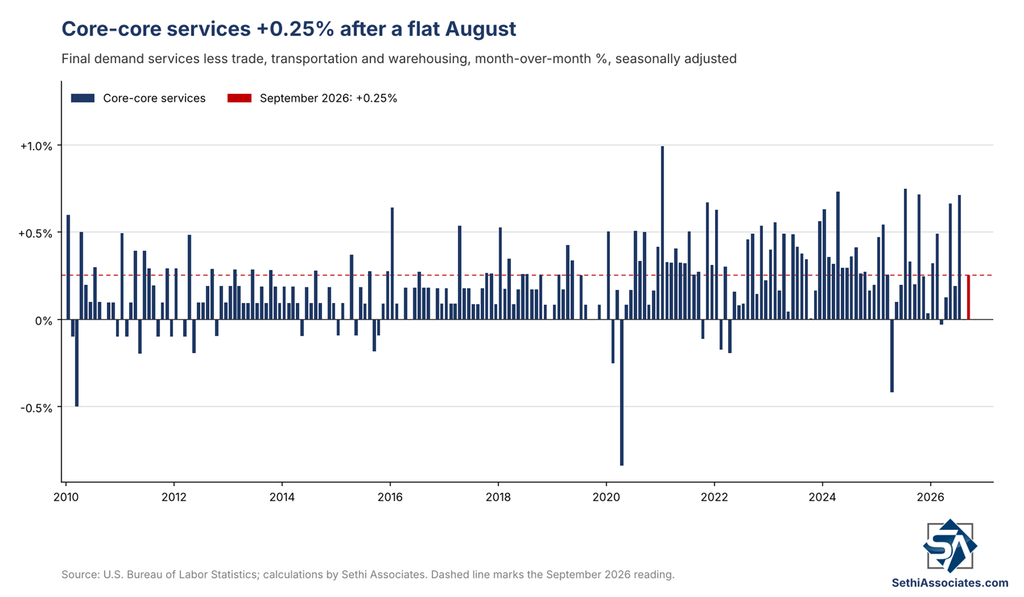
Core-core services — core final demand services less the volatile trade, transportation, and warehousing component — a metric of underlying inflation pressures — rose +0.25% after an essentially flat August (revised from +0.02%), and below July’s +0.71%, which was the most since October 2025. Traveler accommodation services rose, while securities brokerage, dealing, and investment advice fell. ZeroHedge though noted portfolio management costs “ticked up along with stocks yet again.”
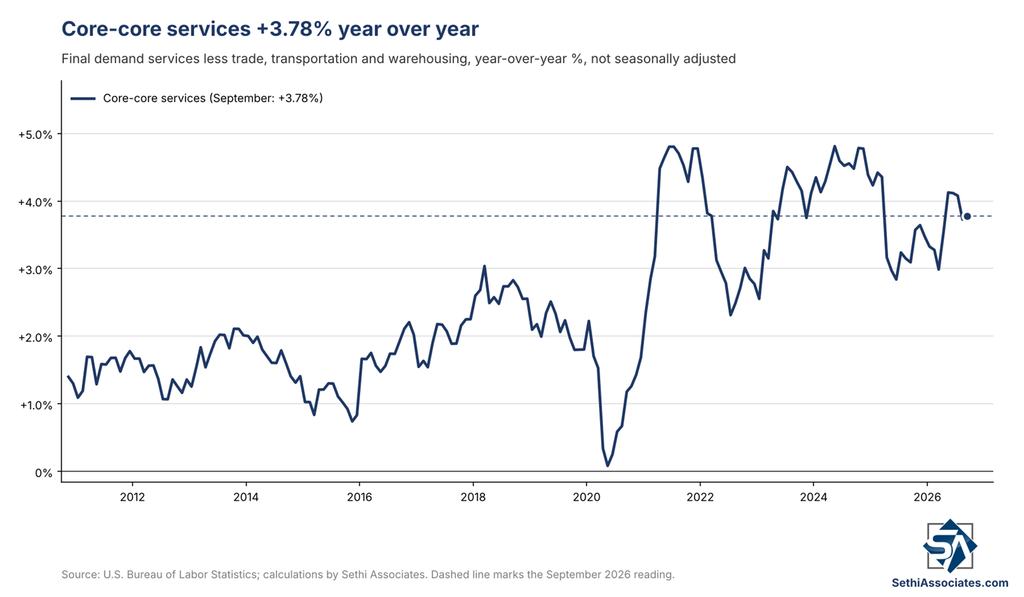
Core-core services (one of the key metrics from this report reflecting underlying inflation) were +3.78% y/y, up from a revised 3.73% in August but below May’s 4.13%, which was the most since March 2025.
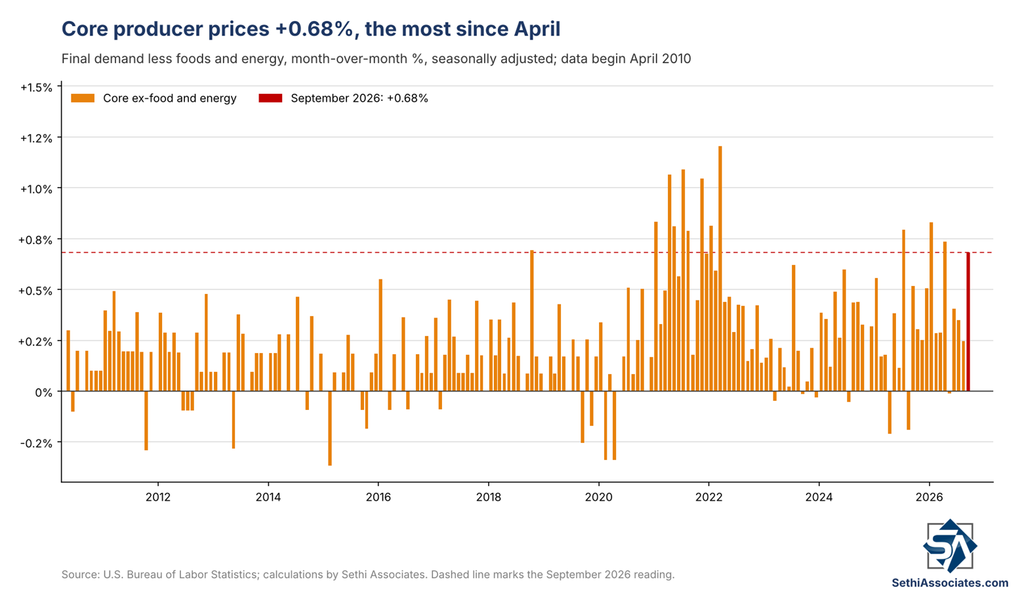
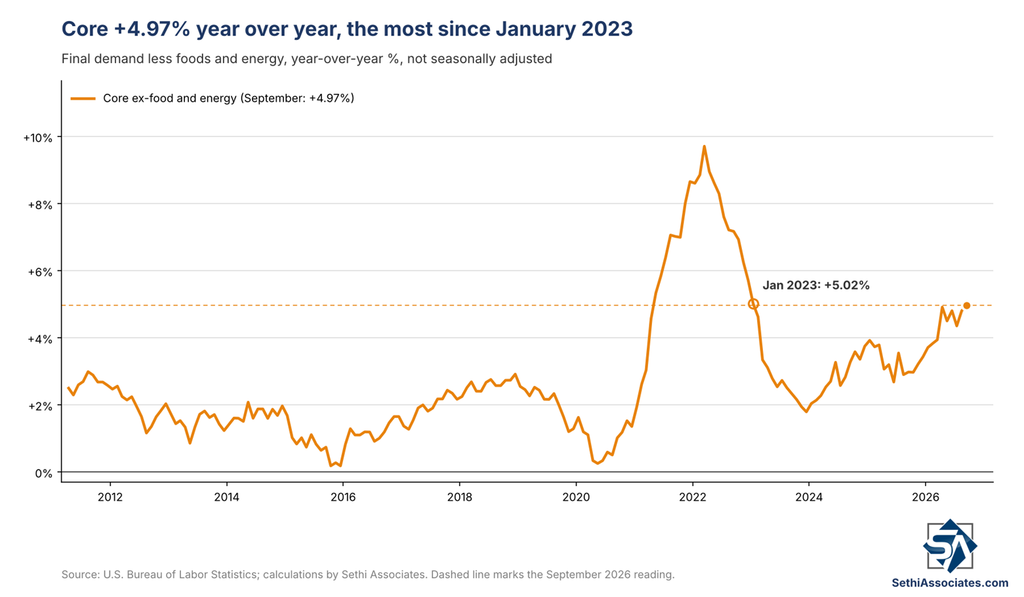
Excluding food and energy from the headline, core final demand producer prices rose +0.68%, the most since April, more than double the 0.3% expected and up from +0.25% in August (revised from +0.16%). Core was up 4.97% from a year earlier, the most since January 2023, well above the 4.4% expected and up from a revised 4.81% in August.
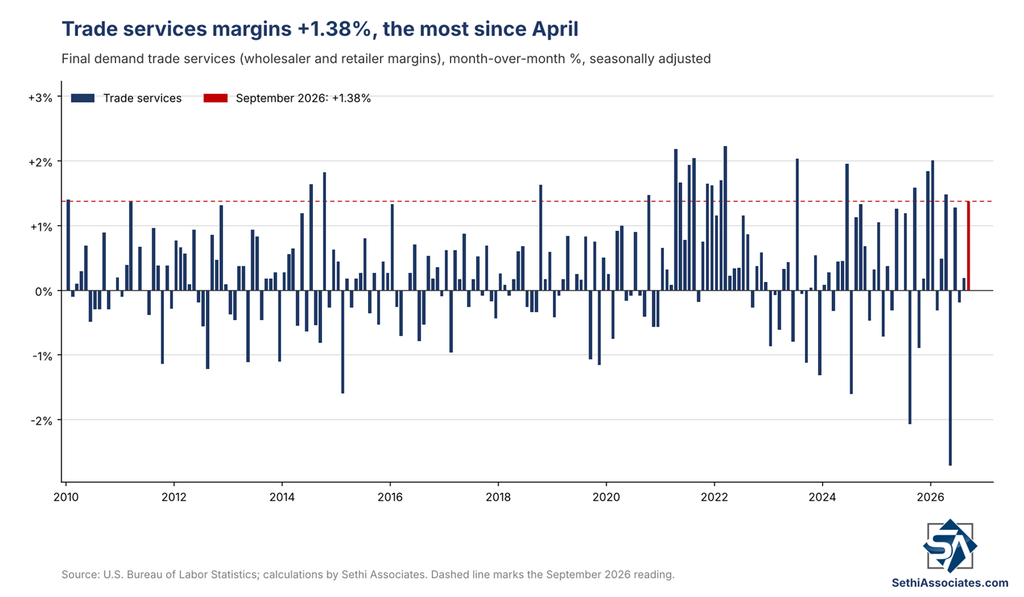
Core final demand producer prices still include the previously noted volatile trade services category (wholesaler and retailer margins), which offers evidence on tariff pass-through — rising margins imply prices are rising faster than the cost to acquire goods, tariffs included. Trade services jumped +1.38% in September, the most since April (+1.48%), potentially reflecting tariff pass-through, while August was revised to +0.19% from -0.24% (initially reported as a second straight decline).
Over 20% of the services increase traced to margins for machinery and vehicle wholesaling, up 3.9%, and food and alcohol wholesaling and food retailing also rose, while margins for automotive fuels and lubricants retailing dropped 30.3%. Bloomberg noted margins “have been under scrutiny for clues on the extent to which companies are absorbing tariff-related costs or passing them on to customers.”
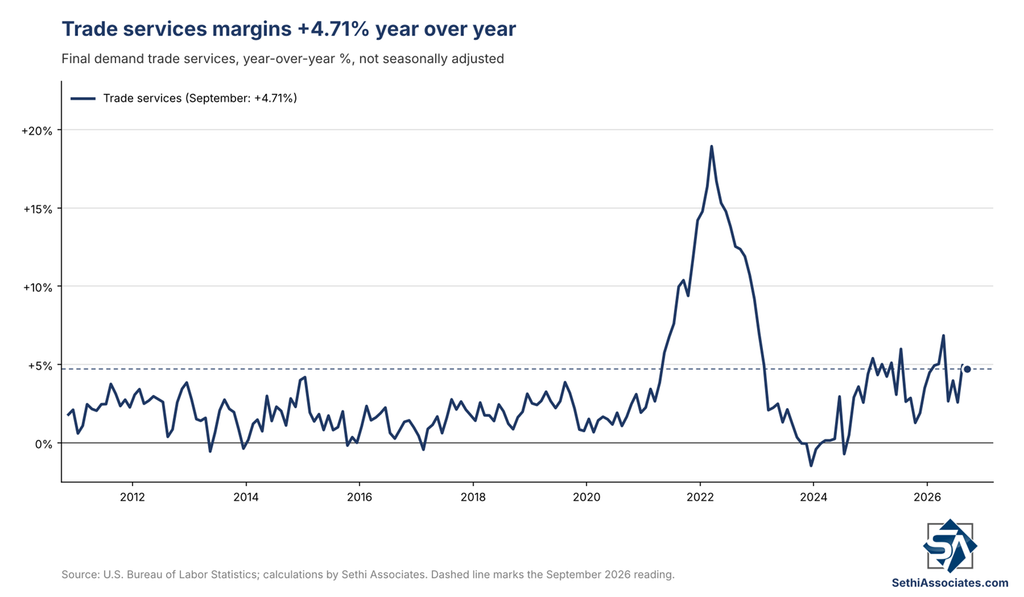
Trade margins are +4.71% y/y, down from a revised 4.96% in August and below April’s 6.85%, which was the highest since January 2023. That still reflects a fair amount of tariff pass-through.
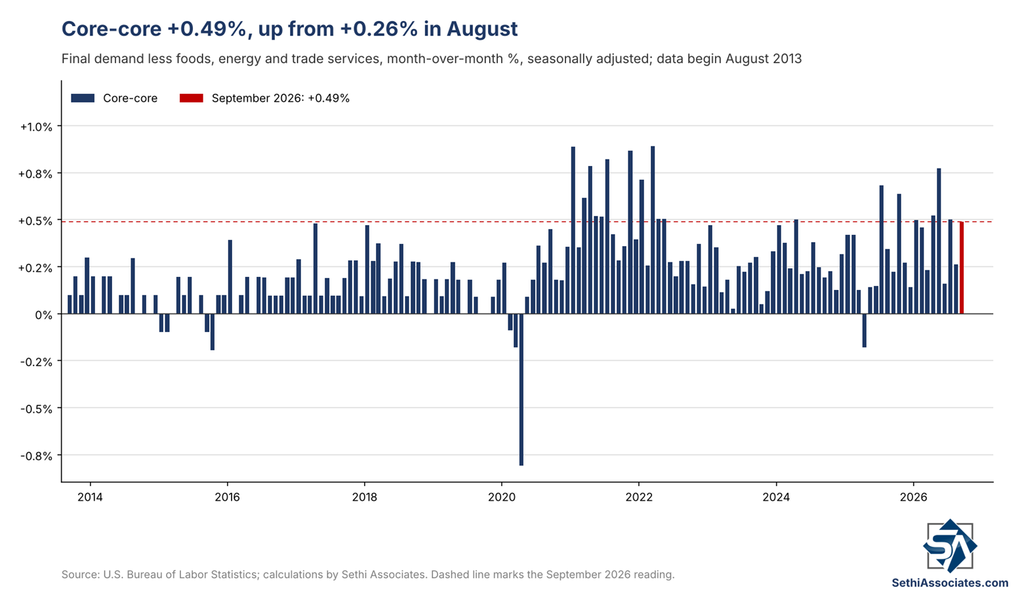
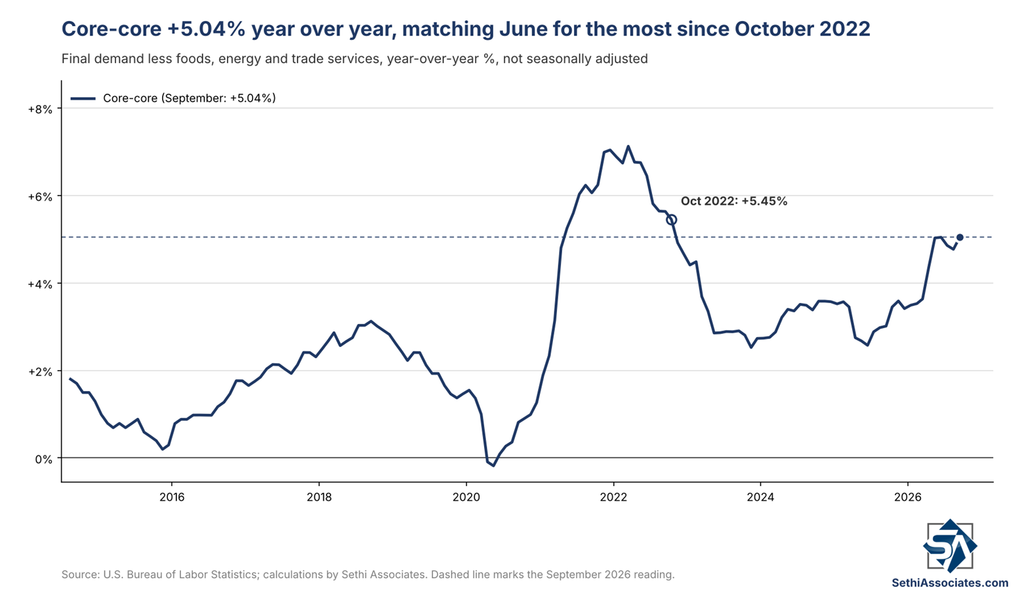
Stripping out trade services gives the so-called “core-core” measure — final demand less foods, energy, and trade services — perhaps the most “pure” metric on underlying inflation from this report — which rose +0.49%, up from +0.26% in August and just shy of July’s +0.50%, though below May’s +0.77%, which was the most since March 2022. Year over year it rose to an elevated 5.04%, matching June for the most since October 2022, up from a revised 4.77% in August.
Intermediate Demand
Intermediate demand goods and services are those still working through the chain toward final demand. As with headline PPI, price increases were “broad-based” in September, again led by energy.
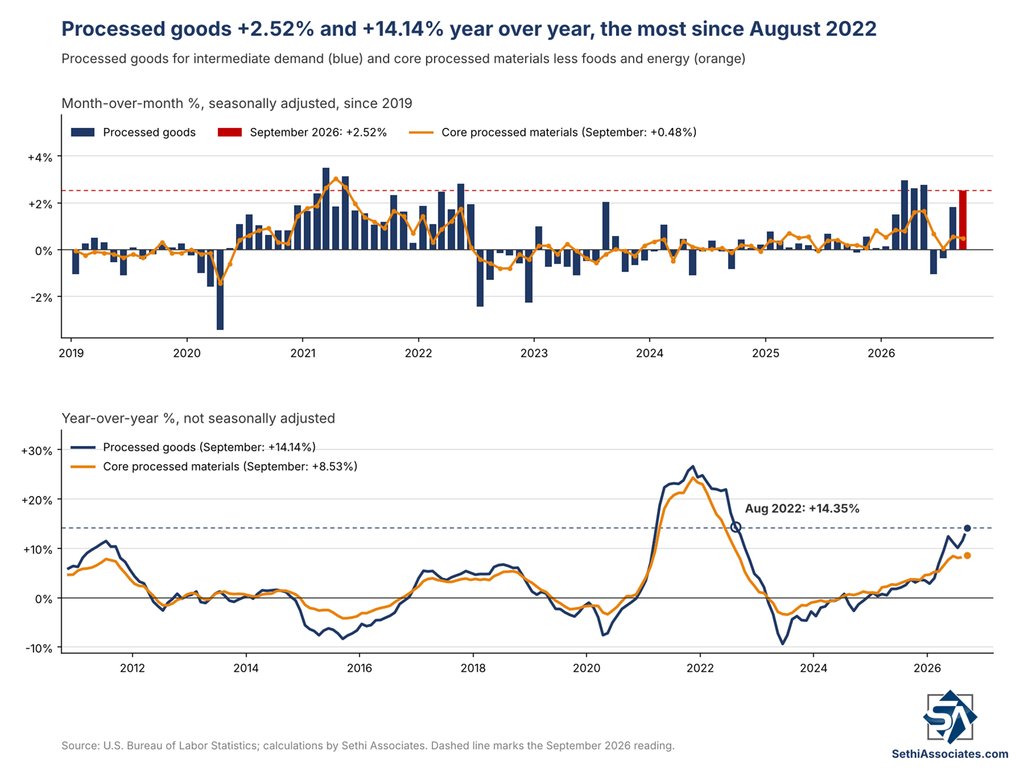
Processed goods for intermediate demand rose +2.52%, the most since May (+2.78%), after +1.82% in August, with over 80% of the gain from processed energy goods, up +10.17%, the most since March’s +12.82%, which was the largest on record (diesel fuel up 21.0% accounted for nearly half the advance; gasoline, jet fuel, lubricating oil base stocks, prepared animal feeds, and fabricated structural metal products also higher). Commercial electric power fell 0.6%, and thermoplastic resins and dry sausage also declined.
Core intermediate demand processed goods less foods and energy rose +0.48%, slowing from +0.56% in August, while processed foods and feeds rose 0.40%.
Year over year, intermediate demand processed goods are up +14.14%, the most since August 2022, topping May’s 12.41%, and core is up +8.53%, also the most since August 2022, topping June’s 8.42%.
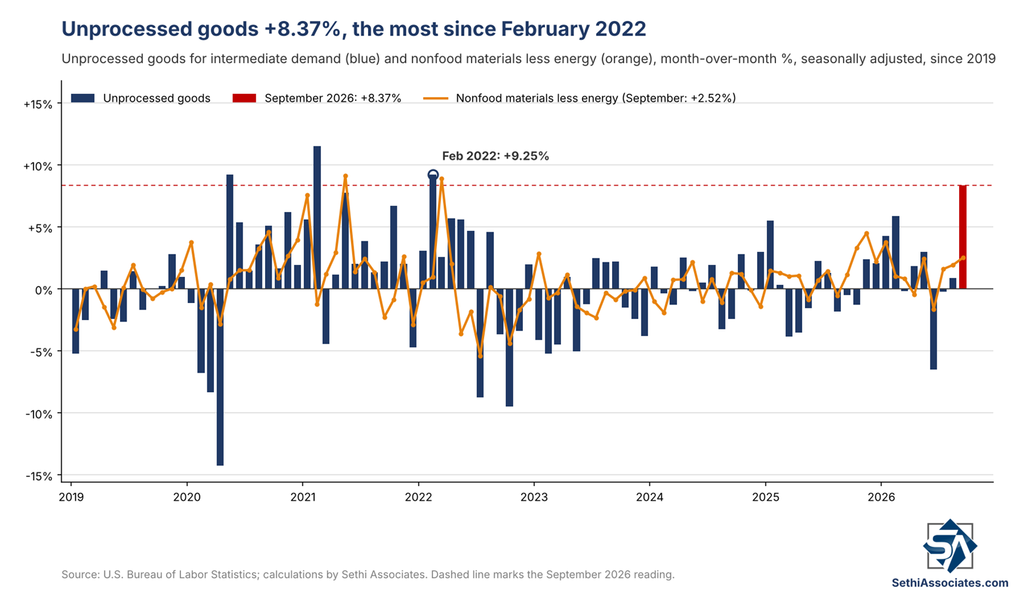
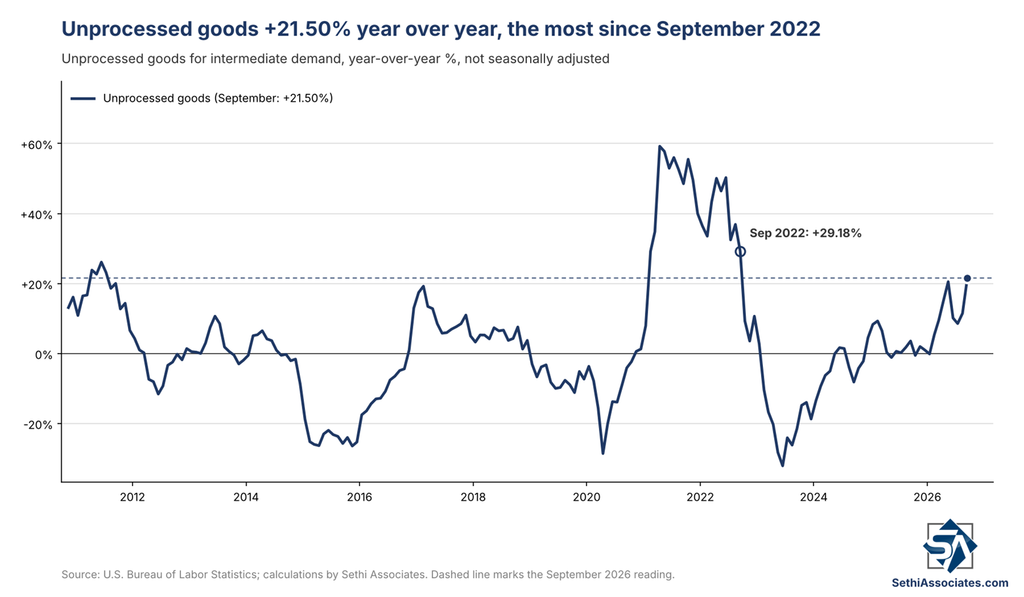
Unprocessed goods for intermediate demand jumped +8.37%, the most since February 2022 (+9.25%), after +0.87% in August (revised from +1.07%). Over 80% of the advance came from unprocessed energy materials, up +22.24%, the most since February 2021, led by crude petroleum (up 28.3%). But unprocessed nonfood materials less energy still rose +2.52%, the most since January, and unprocessed foodstuffs rose +0.78%. Grains; hay, hayseeds, and oilseeds; natural gas; fresh and dry vegetables; and nonferrous metal ores also rose, while raw milk fell 12.3%, and slaughter chickens and aluminum base scrap also declined. Year over year, unprocessed goods are up 21.50%, the most since September 2022, topping May’s 20.52% and up from a revised 11.47% in August.
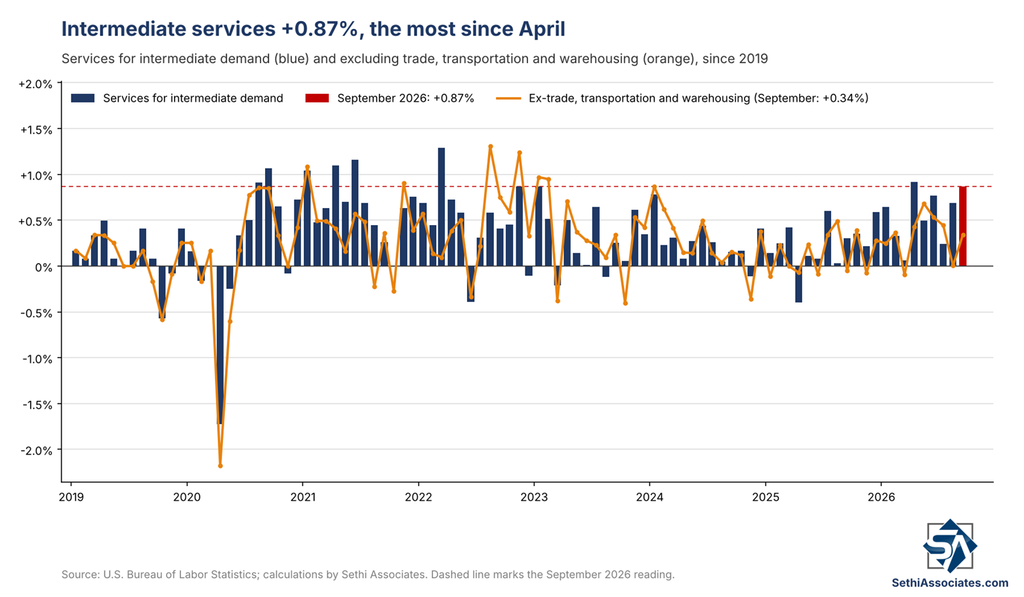
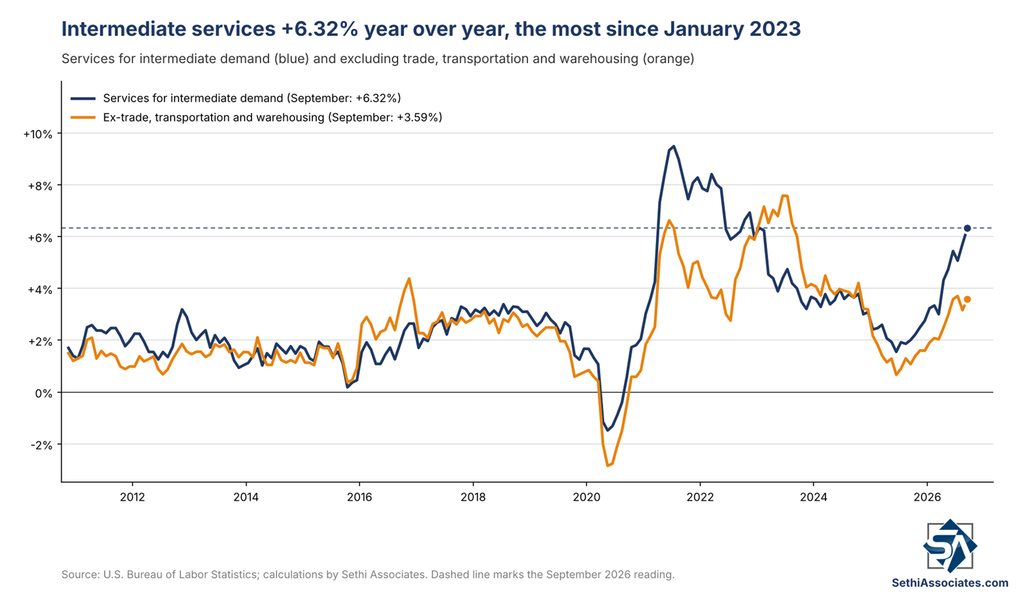
Services for intermediate demand rose +0.87%, the most since April (+0.92%), with over 40% of the gain from trade services margins (up +1.96%), while transportation and warehousing services rose +1.81% and services less trade, transportation, and warehousing rose +0.34% after an essentially flat August. Food and alcohol wholesaling rose 6.7%, nearly a quarter of the advance; truck freight, machinery and equipment parts and supplies wholesaling, airline passenger services, courier, messenger, and postal services, and traveler accommodation also rose; but securities brokerage, dealing, and investment advice fell -2.9%. Year over year, services for intermediate demand are up 6.32%, the most since January 2023, while core-core is up 3.59%, up from a revised 3.16% in August but below July’s 3.70%, which was the most since October 2024.
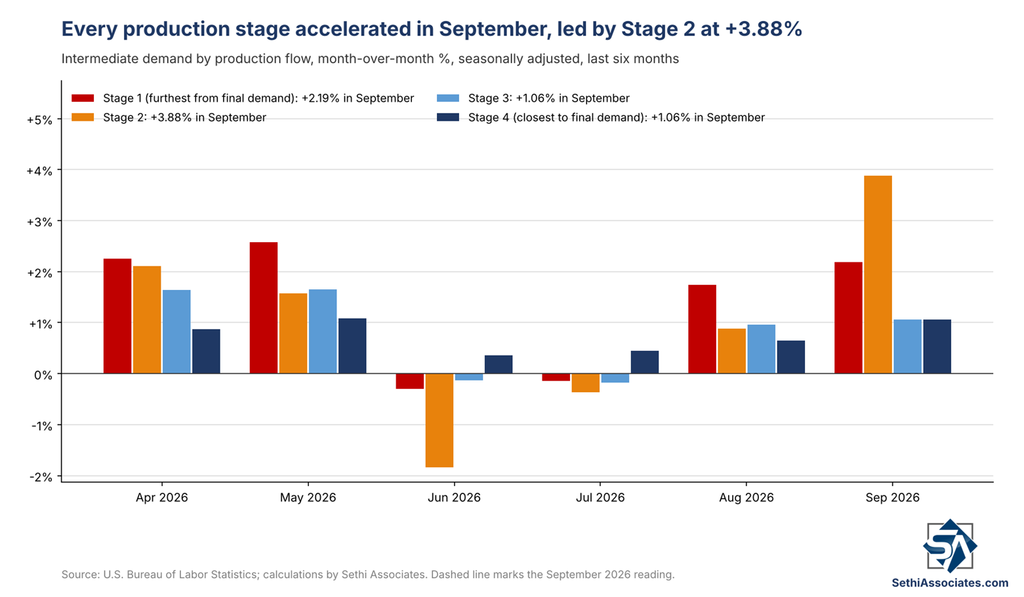
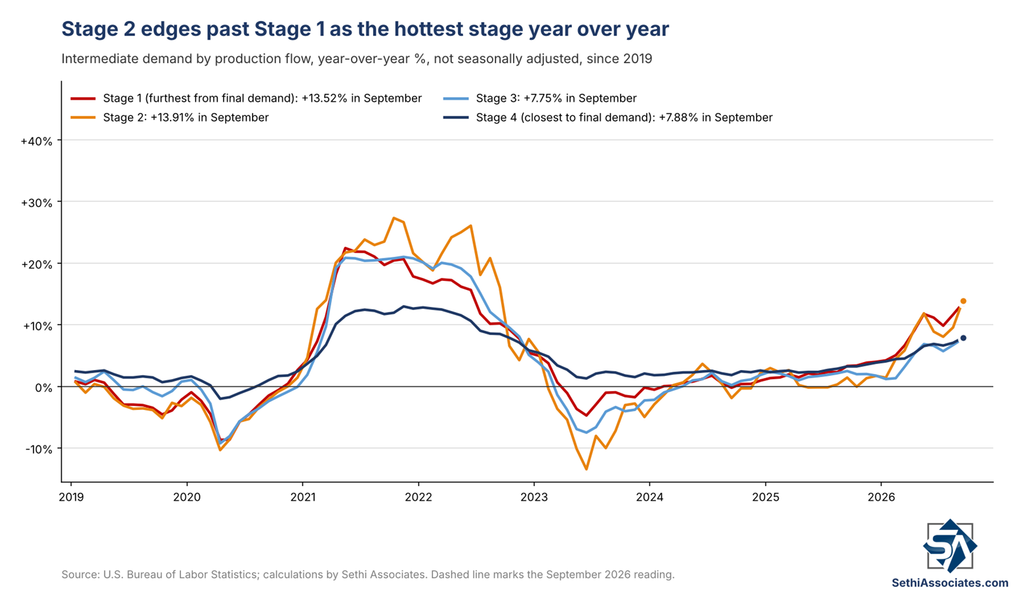
On a production-flow basis, every stage of intermediate demand accelerated from August:
- Stage 1 (furthest from final demand) rose +2.19%, the most since May (+2.58%), with goods inputs up +3.05% (diesel fuel, gasoline, grains, crude petroleum) and services inputs up +1.09%. Up +13.52% year over year, the most since June 2022.
- Stage 2 rose +3.88%, the most since February 2022, with goods inputs up +8.92% (crude petroleum, diesel fuel, gas fuels). Up +13.91% year over year, the most since September 2022, edging past Stage 1 as the most elevated stage on an annual basis.
- Stage 3 rose +1.06%, the most since May (+1.65%), with goods inputs up +1.31%. Up +7.75% year over year, the most since November 2022.
- Stage 4 (closest to final demand) rose +1.06%, the most since May (+1.08%), with goods inputs up +1.22% and services inputs up +0.92%. Up +7.88% year over year, the most since October 2022.
Fed Readthrough
Components that feed the Fed’s preferred inflation gauge, the Personal Consumption Expenditures price index, were “more mixed,” according to Bloomberg: “A gauge of airfares jumped 5% on the month, but various healthcare categories were relatively soft.”
Bloomberg Economics’ Troy Durie said “PPI components that feed into PCE — namely airfares — came in above expectations, putting more pressure on PCE inflation,” adding that “producer-price inflation firmed in September as higher energy prices translated to higher transportation costs and wholesalers recovered margins.” Some economists nudged up their core PCE estimates after the release, predicting a rise of either 0.3% or 0.4%, according to Bloomberg.
Goldman Sachs likewise said core producer prices and core-core were “both above expectations,” and based on details in the CPI and PPI reports it estimates the September core PCE price index rose 0.34% (up from 0.32% before the PPI report), corresponding to a year-over-year rate of 3.12%, with headline PCE seen up 0.51% on the month and 3.64% from a year earlier. Goldman also noted the “old methodology” core PPI — finished goods excluding food and energy — rose a more modest 0.2%, while core intermediate producer prices and crude materials less food and energy rose 0.5% and 2.5%, respectively. On policy, Goldman said “while the inflation data of the last two days have raised the possibility of an October hike, we continue to see a second hike in December as the most likely outcome pending comments from Chairman Warsh later today.”
Bank of America also raised its September core PCE tracking estimate to 0.34% month over month from 0.32% after the PPI data, while it sees headline PCE at 0.52% (3.7% year over year). Economist Stephen Juneau said “airfares were very strong in Sep PPI, but legal services and healthcare components that read through into PCE were a bit soft,” and flagged “more uncertainty around this estimate than normal given the recent methodology changes to legal services, computer software and accessories, and portfolio management and investment advice.” Although “markets remain highly skeptical about an Oct hike,” the bank is sticking with its call that the Fed will raise rates this month, “at least until we hear from Chair Warsh tonight.”
Market Reaction
Very surprisingly, Treasury yields moved sharply lower following the data, with the 2-year down 7 basis points and the 10- and 30-year down 13 basis points.

Odds of a rate hike at the October meeting slipped to 29% from 33%, and nearly 10 basis points of hikes came out of 2027, to 74 basis points from 83 yesterday. That came even as Bloomberg said the report “likely keeps Federal Reserve officials on track for additional interest-rate increases in the months ahead, especially after a separate report Wednesday showed a key measure of consumer prices rose faster than expected in September.” ZeroHedge framed it as inflation “broadening out,” with services costs “soaring too as energy costs spread across the economy.”

The Bureau of Economic Analysis is scheduled to release September PCE data on October 29.
