Existing Home Sales Fall to Lowest Since 2010 but the Worst May Be Yet to Come
October closings dropped 5.5% to their slowest pace in 16 years, with the West hitting a record low, and months’ supply rose to the most since 2015. September’s record-low contract signings point to more weakness ahead.
You've reached your free article limit
You've read 0 of 1 free Pro articles.

U.S. Existing-Home Sales October: 3.75 million (estimate 3.85 million; previous 3.99 million; previous revised 3.97 million)
– Existing-Home Sales (month-over-month): -5.5% (estimate -3.5%; previous 1.5%; previous revised 1.0%)
– Median Home Price For Existing Homes: $416,700, up 0.4% from October 2025 (previous $417,500, up 1.3% from September 2025)
Executive Summary
- October existing-home sales fell 5.5% to an annual rate of 3.75 million, the lowest since August 2010, a bigger drop than the 3.5% decline expected and the largest since January. Sales were down 8.8% from a year earlier. Months’ supply of homes at the current sales pace jumped to 5.1, the highest since late 2015.
- Sales fell in every region but the Northeast. The West dropped to its slowest pace in data back to 1999 and condo sales hit a record low.
- The median price still rose, but just 0.4% from a year earlier to $416,700, the smallest gain since February. It was the 40th straight annual increase.
- NAR’s affordability index fell to 100.7, the lowest since mid-2025. These closed sales were mostly from contracts signed in August and September when mortgage rates averaged 6.67% and 6.86%. With mortgage rates averaging 7.33% in October, and contract signings at a record low in September, closings are likely to stay weak through year-end.
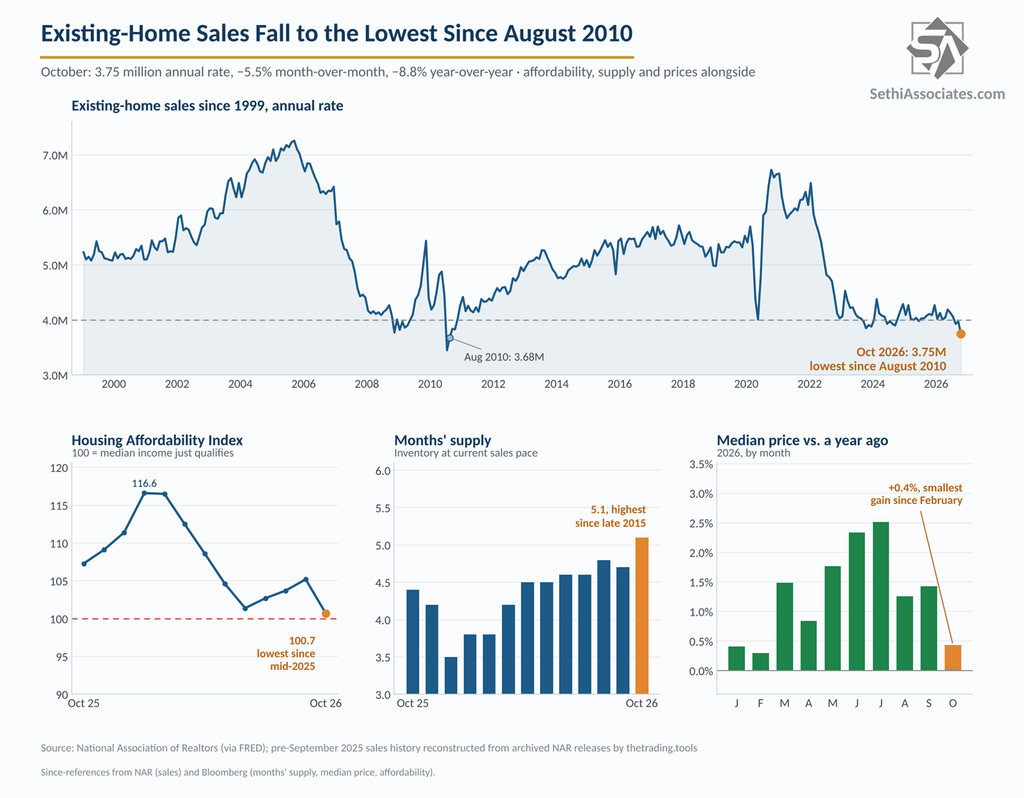
Existing home sales historically made up about 90% of US home sales, fell to as low as two-thirds after the pandemic as supply dried up and builders leaned on incentives, and are back to around 85% over the past year. Sales are counted when a contract closes, so October’s figures mostly reflect contracts signed in August and September. All figures are seasonally adjusted and month-over-month unless noted.
October Sales
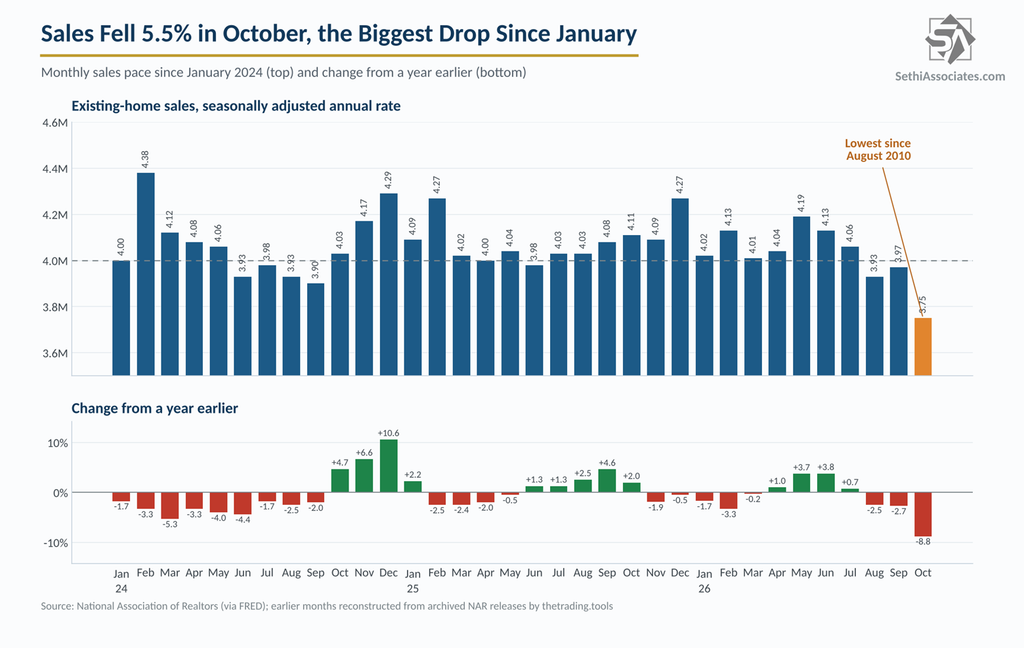
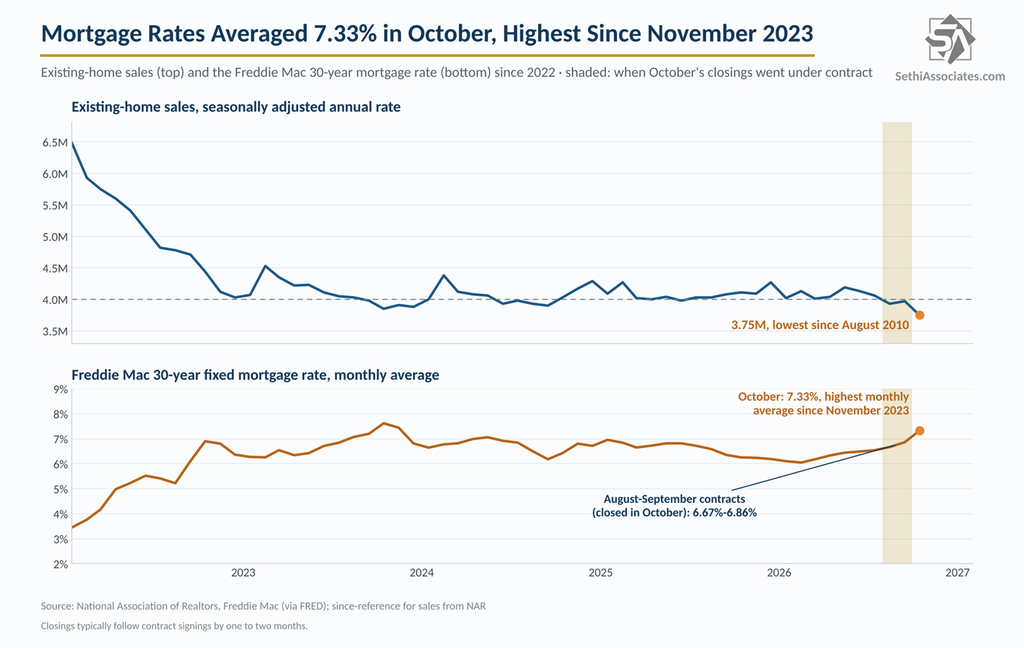
Sales of previously owned homes fell 5.5% in October to an annual rate of 3.75 million, the lowest since August 2010, according to the National Association of Realtors. That was well below the 3.85 million economists expected and the biggest monthly drop since January. Sales have now been below 4 million for three straight months.
September’s increase was revised down to 1.0% (3.97 million) from the 1.5% gain first reported in last month’s piece. From a year earlier, sales fell 8.8%, a third straight annual decline and much steeper than September’s revised 2.7% drop.
Before seasonal adjustment, October sales were 317,000, down 11.7% from 359,000 a year earlier with one fewer working day, according to housing expert Bill McBride of CalculatedRisk. That was just 3% above the record low for the month of October set in 2010. Year-to-date sales are now down 0.5% from 2025.
“Home buying is difficult when mortgage rates have climbed to their highest levels since 2000, aside from a single month in 2023,” said NAR Chief Economist Lawrence Yun.
By Region
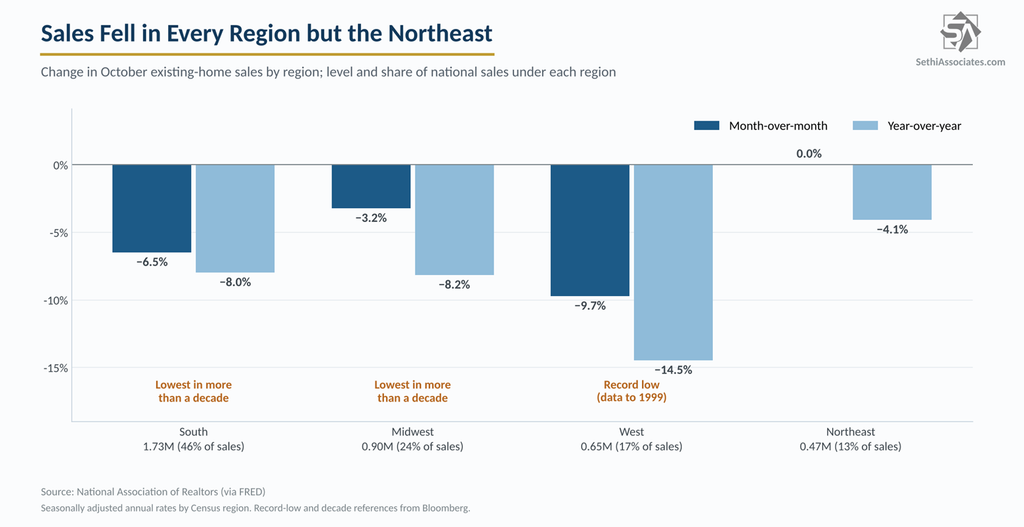
Sales fell in the South, Midwest and West and were flat in the Northeast, and all four regions were down from a year earlier. The West fell 9.7% to 650,000, the slowest pace in data back to 1999, and was down 14.5% from a year earlier, according to Bloomberg. The South, about 46% of sales, fell 6.5% to 1.73 million (down 8.0% year-over-year), and the Midwest fell 3.2% to 900,000 (down 8.2%), both the lowest in more than a decade, per Bloomberg. The Northeast held at 470,000, down 4.1% from a year earlier and still above March’s record low of 430,000.
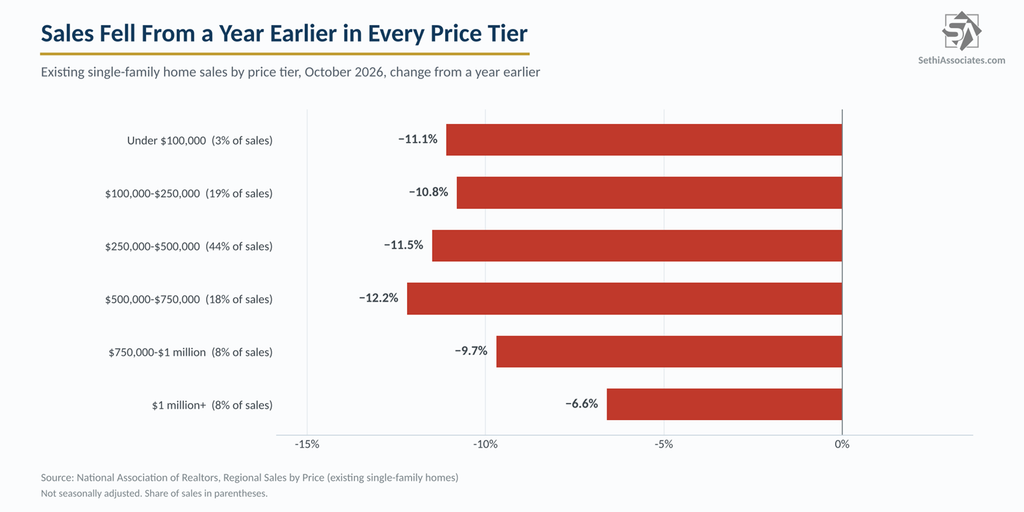
Sales also fell from a year earlier in every price tier for single-family homes, including homes priced at $1 million and up (down 6.6%), which had been the only tier still growing in August and September. The $500,000 to $750,000 band fell the most, down 12.2%. In the West, sales of homes priced between $500,000 and $1 million were down 17.6% to 18.6%.
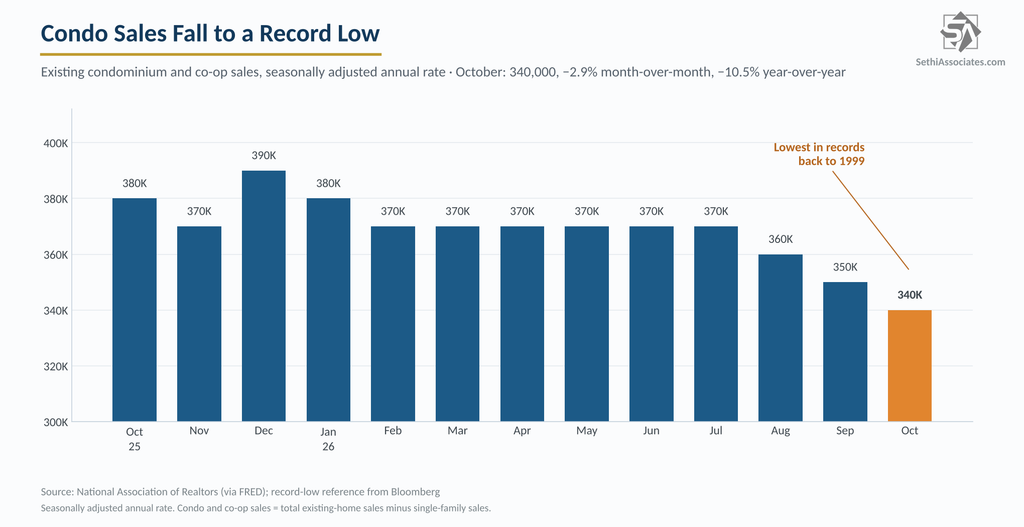
Single-family sales fell 5.8% to 3.41 million (down 8.6% year-over-year). Condo and co-op sales fell 2.9% to 340,000 (down 10.5%), the lowest in records back to 1999, per Bloomberg.
Prices
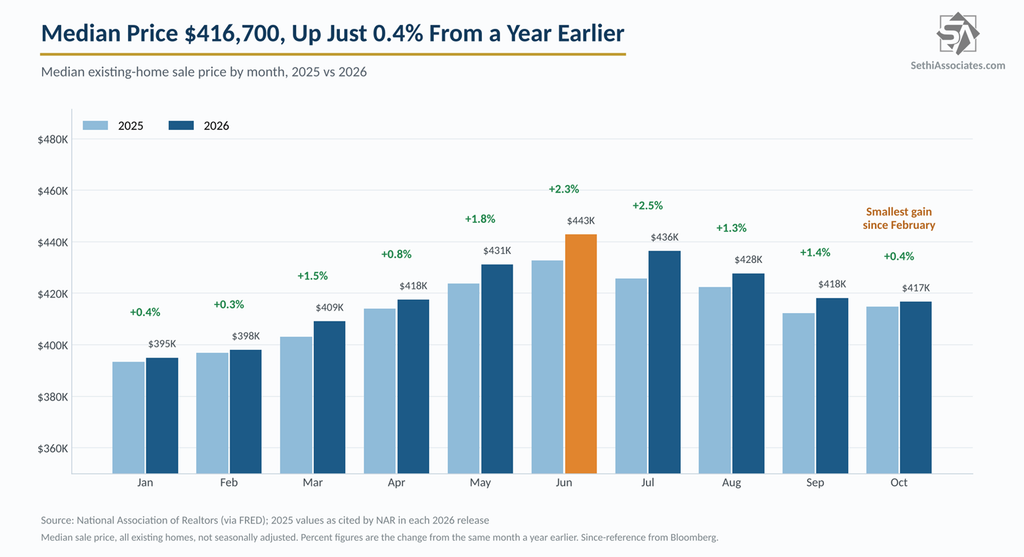
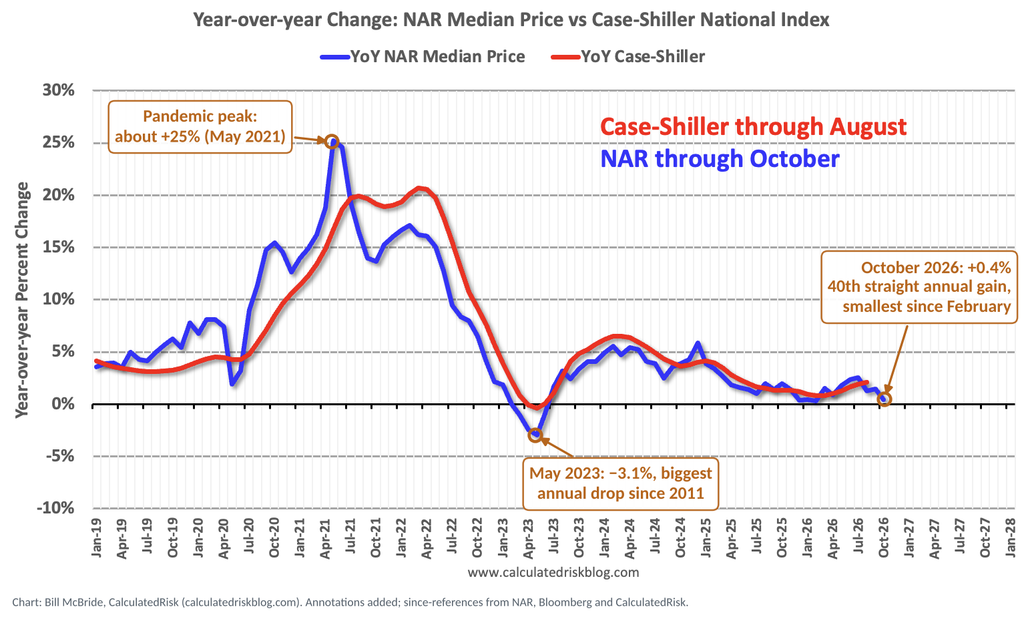
The median price rose just 0.4% from a year earlier to $416,700, the smallest gain since February, per Bloomberg, “marking the 40th consecutive month of year-over-year price increases,” according to NAR. It’s down 5.9% from June’s record $442,800, which McBride notes is “somewhat larger than the normal seasonal decrease” through October.
Regionally, the Northeast was up 3.2% to $519,600 and the Midwest up 1.5% to $324,300, while the South slipped 0.4% to $360,900 and the West was unchanged at $624,300.
Redfin data cited by Bloomberg show 36% of homes sold in October had at least one price drop, the highest share in its records.
Inventory and Supply
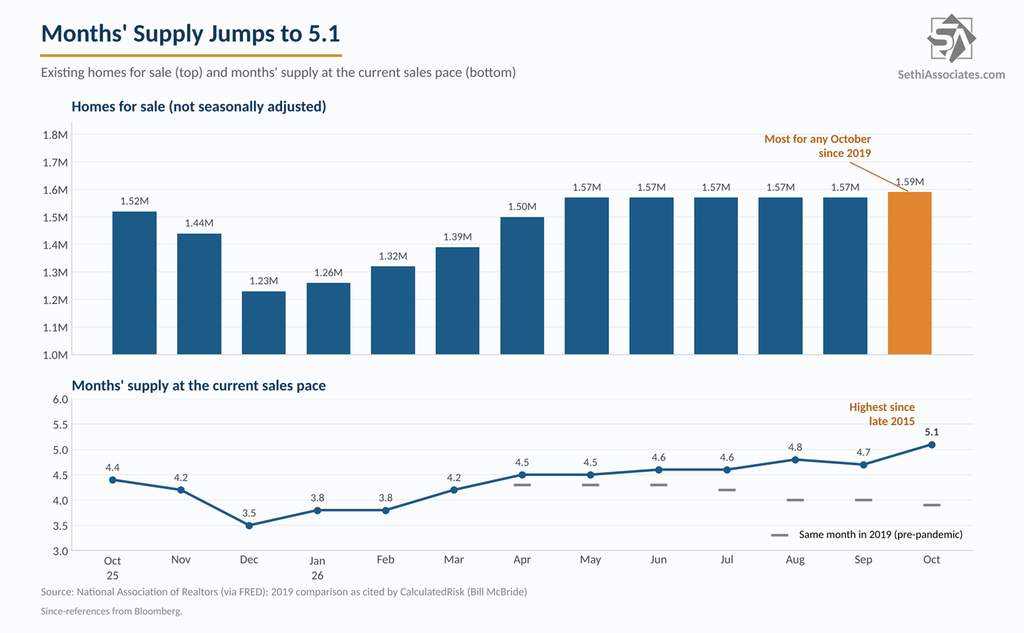
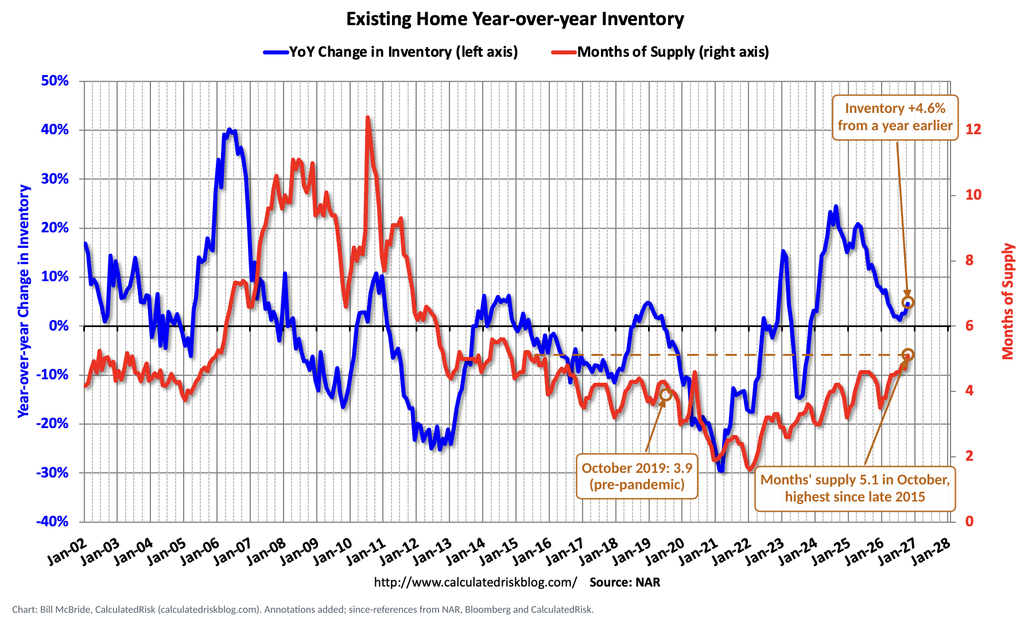
With buyers pulling back, months’ supply jumped to 5.1 from 4.7, the highest since late 2015, according to Bloomberg. Yun had also flagged months’ supply at its highest since 2015 at NAR’s NXT conference on November 6.
Inventory rose 1.3% to 1.59 million homes, up 4.6% from a year earlier and the most for any October since 2019, per Bloomberg. September’s inventory was revised down to 1.57 million from 1.60 million. McBride notes months’ supply was 3.9 in October 2019, so there’s “much more supply now” than before the pandemic even though inventory is still below 2019 levels, because sales have fallen even more. Homes took a median 35 days to sell, up from 33 in September and 34 a year earlier.
Bloomberg Intelligence analyst Drew Reading said in a November 9 note that active listings kept rising even as new listings weakened, a sign price relief may be building, according to Bloomberg.
Affordability and Rates
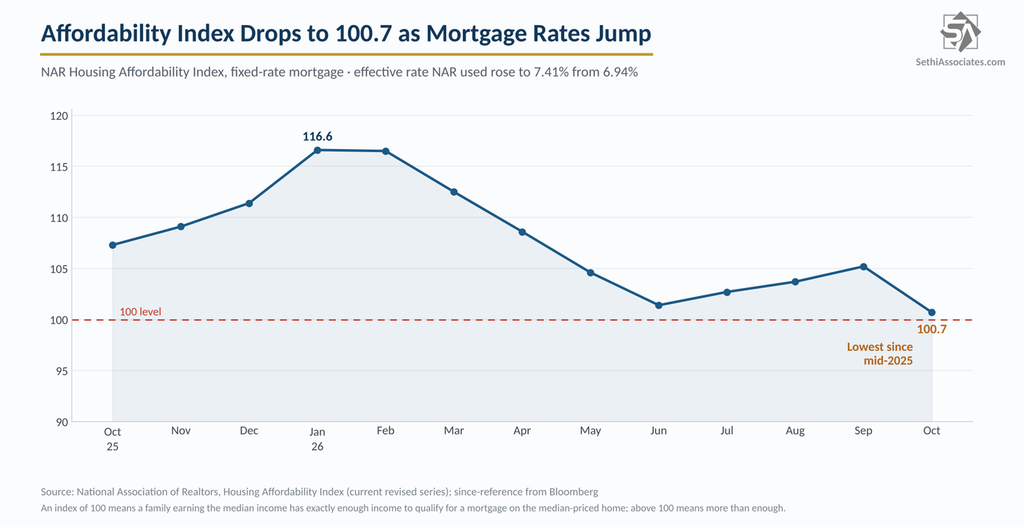
NAR’s Housing Affordability Index fell to 100.7 from 105.2 in September and 107.3 a year earlier, making homes the least affordable since mid-2025, per Bloomberg. Affordability fell from a year earlier in all four regions, led by the Northeast (down 8.7%). The mortgage rate NAR uses in the index jumped to 7.41% from 6.94%, lifting the payment on a median-priced single-family home to 24.8% of median family income from 23.8%. An index of 100 means a median-income family earns just enough to qualify for a mortgage on a median-priced home.
As mentioned earlier, because these are closed sales, they mostly reflect contracts signed 30 to 60 days earlier. The 30-year fixed mortgage rate averaged 6.67% in August and 6.86% in September, then climbed to 7.33% in October, according to Freddie Mac, the highest monthly average since November 2023 and up from 6.25% a year earlier. The weekly mortgage rate peaked at 7.40% on October 8 and 15 and has since eased to 7.18% as of November 5.
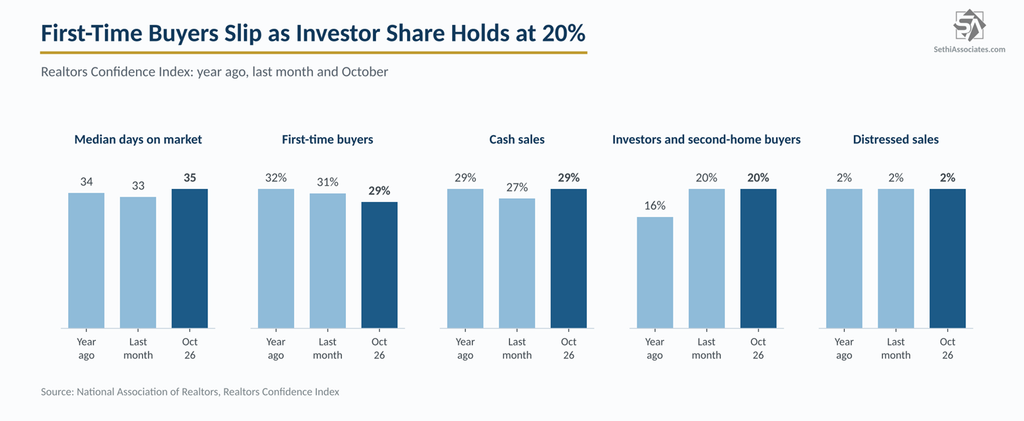
First-time buyers made up 29% of sales, down from 31% in September and 32% a year earlier. Investors and second-home buyers held at 20%, up from 16% a year earlier, and cash sales rose to 29% from 27%. Distressed sales stayed at 2%.
What to Watch
November closings will reflect contracts signed in September and October, when rates averaged 6.86% and 7.33%, and with September’s pending home sales falling to a record low of 66.0 in data back to 2001, more weakness may lie ahead.
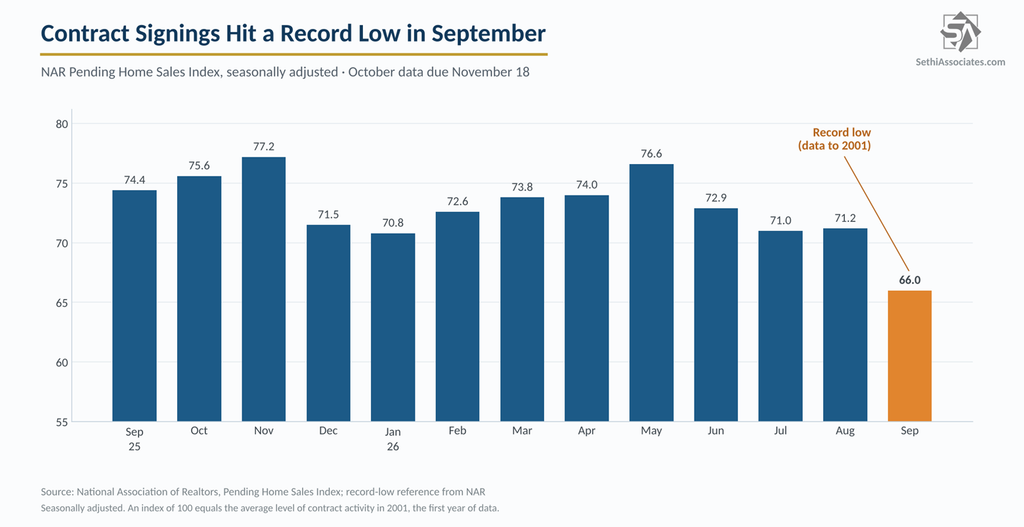
Yun sees a silver lining. “Based on the current underwhelming home sales pace at a time of consistent job growth, there could be sizable pent-up demand if mortgage rates decline,” he said.
McBride expects November sales, which compare with 4.09 million in November 2025, to fall from a year earlier “to another cycle low,” and says 2026 sales are very likely to finish “at the lowest level since 1995.” He called October “a very weak report, with sales down YoY and inventory up,” adding that “more inventory and less sales could impact house prices in the coming months.”
National Association of Realtors existing-home sales release