Existing Home Sales Edge Up, But NAR Warns of Potential Drop to Come
September existing-home sales rose 1.5% from August, but NAR’s chief economist cautioned Q4 closings could be ‘measurably down’ as affordability slips year-over-year for the first time this year.
You've reached your free article limit
You've read 0 of 1 free Pro articles.

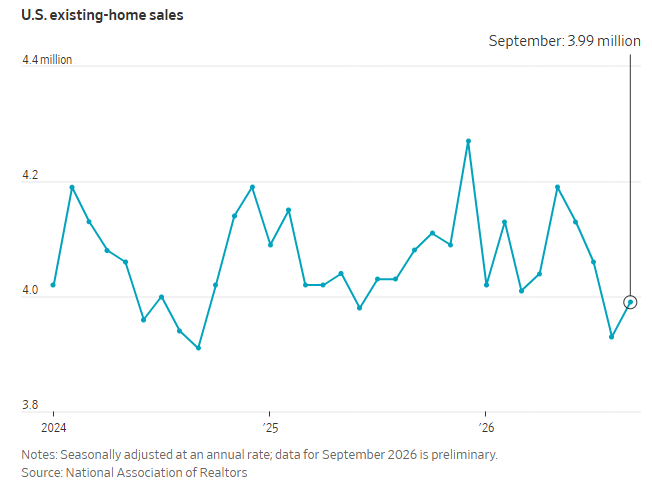
US Existing-Home Sales September: 3.99 million (estimate 3.95 million; previous 3.98 million; previous revised 3.93 million)
– Existing-Home Sales (month-over-month): 1.5% (estimate -0.8%; previous -2.0%; previous revised -3.2%)
– Median Home Price For Existing Homes: $417,500, up 1.3% from September 2025 (previous $429,100, up 1.6% from August 2025)
Executive Summary
- September existing-home sales rose 1.5% month-over-month, the first increase since May, versus the 0.8% decline expected, to 3.99 million. That still left sales below 4 million for a second straight month after August was revised down to 3.93 million. Sales fell 2.2% year-over-year, a second straight annual decline.
- Median sale prices eased as is seasonally normal to $417,500, up 1.3% year-over-year, marking the 39th consecutive month of year-over-year price increases.
- Inventory rose 1.9% month-over-month to 1.60 million homes, the highest since 2019, and was up 4.6% year-over-year, with months’ supply holding at 4.8, the highest in a decade.
- The National Association of Realtors’ Housing Affordability Index rose to 105.4 from 103.7 in August, a third straight monthly improvement, but fell 1.2% year-over-year, its first annual decline this year.
- September sales largely reflect contracts signed in July and August, when mortgage rates averaged 6.54% and 6.67% respectively. October closings will reflect August and September contracts at 6.67% and 6.86%. “The fourth-quarter outlook for closing activity will clearly be down, maybe even measurably down,” said NAR Chief Economist Lawrence Yun.
Note: All figures are month-over-month unless otherwise noted. Existing-home sales account for around 90% of US home sales. Sales are calculated when a contract closes, so these are contracts that were executed one to three months ago. New-home sales, which make up the remainder of home sales, are based on contract signings, and will be released in a later report.
September existing-home sales (closings) rose 1.5% from August to 3.99 million, the first increase since May, versus a 0.8% decline expected. That still left sales below 4 million for a second straight month, with August revised down to 3.93 million from 3.98 million, a 3.2% decline rather than the 2.0% initially reported.
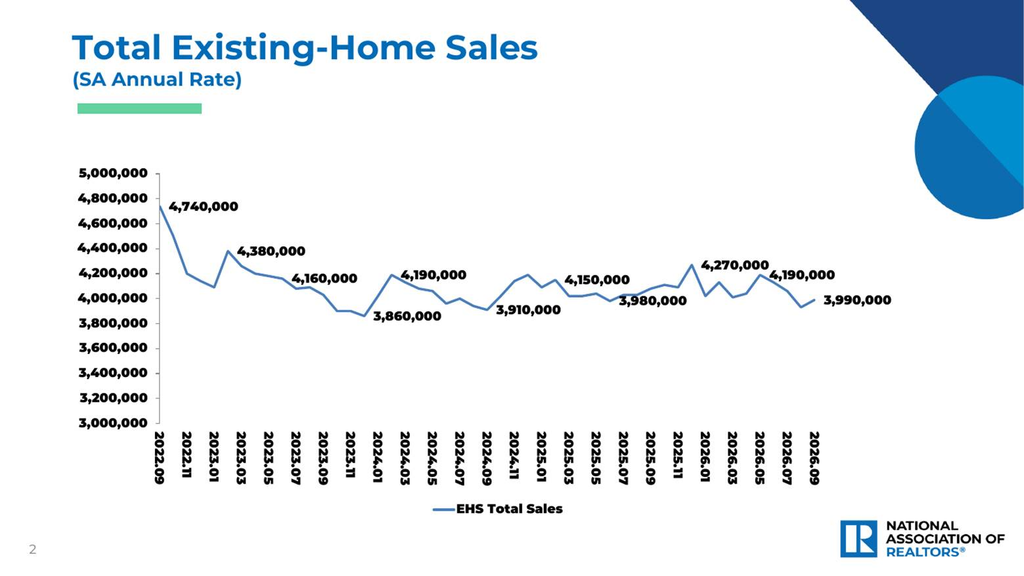
Sales fell 2.2% year-over-year, a second straight annual decline after a downwardly revised 2.5% drop in August. Note as these are closings, contracts were signed one to three months earlier.
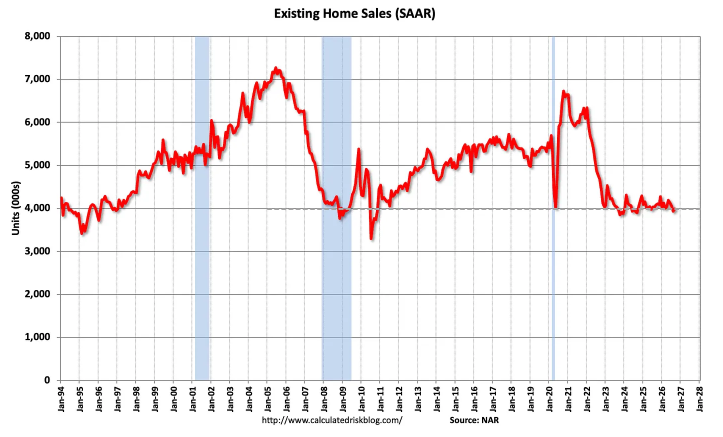
“Despite the small monthly gain on a seasonally adjusted basis, August and September marked the two slowest months for home sales this year,” said NAR Chief Economist Lawrence Yun. “Further increases in mortgage rates in recent weeks mean fewer buyers can qualify to purchase a home.”
Sales rose in the South and West, held steady in the Midwest and fell in the Northeast, while year-over-year sales declined in all four regions. The South, accounting for nearly half of sales, rose 2.8% month-over-month to 1.86 million, down 0.5% year-over-year. The West also rose 2.8% to 730,000 but was down 5.2% year-over-year, the steepest annual decline of any region. The Midwest was unchanged at 930,000, down 2.1% year-over-year. The Northeast fell 2.1% to 470,000, down 4.1% year-over-year.
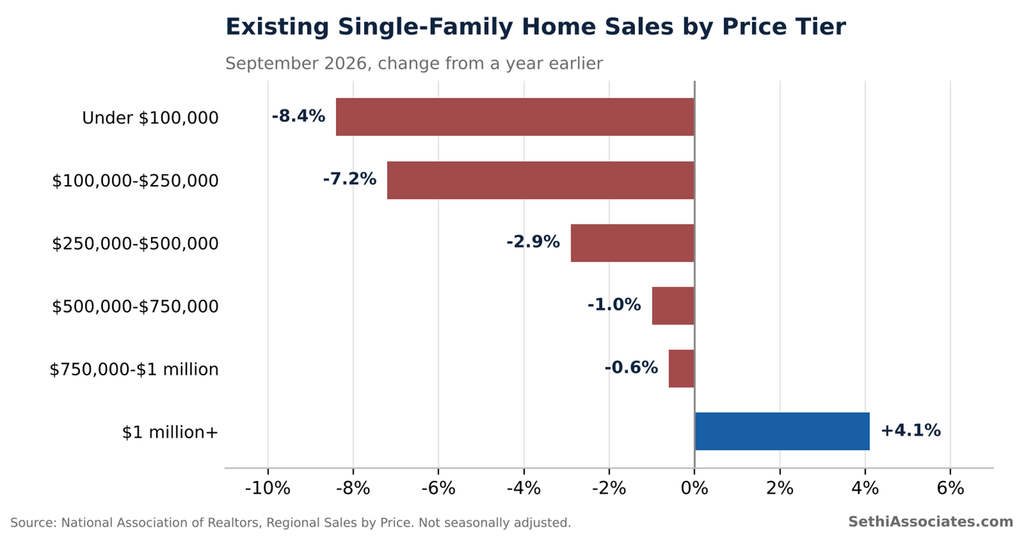
Breaking sales down by price tier (not seasonally adjusted, single-family), the weakness was again concentrated at the low end. Nationally, sales under $100,000 were down 8.4% year-over-year and the $100,000 to $250,000 band down 7.2%, while the $1 million-plus segment was again the only one to grow, up 4.1%. That pattern was most pronounced in the Midwest, where sales under $250,000 were down double digits while the $750,000 to $1 million band rose 12.4% and $1 million-plus rose 16.1%, and the Northeast, where sales under $100,000 fell 17.5%. The West bucked the trend, with sales under $100,000 up 23.6% and $1 million-plus down 1.9%, though homes under $250,000 make up just 5% of sales there.
Inventory rose 1.9% month-over-month to 1.60 million homes, the highest level since 2019 according to NAR, and was up 4.6% year-over-year.

Months’ supply of existing homes for sale at the current sales pace held at 4.8, unchanged from a downwardly revised August and up from 4.5 a year earlier, which Bloomberg notes keeps it at the more-than-decade high reached in August. That compares with 4.0 months in September 2019, per housing expert Bill McBride. For single-family homes alone, seasonally adjusted months’ supply rose to 4.6 from 4.5 in August.

“Higher inventory and lengthening days on market give buyers improved negotiating power,” Yun said. “Home sellers need to be realistic about local market conditions, which could require price discounts and other incentives to attract buyers.”
Redfin noted in a report this week that 14.5% of homebuying deals that went under contract in September fell through, the highest share on record outside of March and April 2020. Nearly 1 in 5 sellers with active listings cut their asking price, and 60.5% of homes sold below their original list price.

Median sale prices eased as is normal for this time of year to $417,500 and are now down 5.7% from June’s all-time record high of $442,800 (revised up from $440,600), but McBride notes that is somewhat larger than the normal seasonal decline through September. They were up 1.3% year-over-year, matching August’s downwardly revised 1.3% gain, marking the 39th consecutive month of year-over-year price increases and extending a streak of annual price increases dating back to mid-2023.


Regionally, median prices were firmer year-over-year outside of the West: Northeast up 4.7% to $523,600, Midwest up 3.1% to $329,600, South up 0.2% to $361,000, and West down 0.3% to $613,600.
Affordability as measured by NAR’s Housing Affordability Index rose to 105.4 from a downwardly revised 103.7 in August, a third straight monthly improvement. But it fell 1.2% year-over-year from 106.7, its first annual decline this year. The monthly gain came even as the effective mortgage rate NAR uses in the index rose to 6.94% from 6.75%, as the median single-family price eased to $422,700 from $433,600 and median family income rose to $113,145.
Year-over-year affordability declined in three of the four regions: Northeast down 4.5%, Midwest down 3.1% and South down 0.4%, while the West rose 1.0%.

In looking forward, The Wall Street Journal and McBride both noted September sales largely reflect contracts signed in July and August, when mortgage rates averaged 6.54% and 6.67% respectively. October closings will reflect August and September contracts at 6.67% and 6.86%, which McBride says “suggests more weakness ahead,” with October sales likely to be down year-over-year from 4.11 million in October 2025. With the sharpest rate increases coming in September and October, he adds that full-year sales are likely to finish down year-over-year “and be at the lowest level since 1995.”
“The fourth-quarter outlook for closing activity will clearly be down, maybe even measurably down,” Yun added on a call with reporters, according to Bloomberg. “We are seeing more delays in the contracts with these rising interest rates.”
Realtor.com Chief Economist Danielle Hale estimated the recent jump in mortgage rates adds a “$19,000 shock” for would-be buyers with a $2,000 monthly budget. “The reset in rates over the last five weeks has shaved a little more than 6% off of the purchasing power of buyers across every budget, which is almost twice the typical price-savings advantage of buying in this less competitive season,” Hale said.

Some Other Stats From the Report:
- 33 days: Median time on market for properties, up from 31 days in August and unchanged from September 2025.
- 31% of sales were first-time homebuyers, up from 30% in August and 30% one year ago.
- 27% of transactions were cash sales, unchanged from last month and down from 30% one year ago.
- 20% of transactions were individual investors or second-home buyers, up from 15% both last month and one year ago.
- 2% of sales were distressed sales (foreclosures and short sales), unchanged from last month and one year ago.
- Single-family sales rose 2.0% month-over-month to 3.64 million, down 1.9% year-over-year (median price $422,700, up 1.2% year-over-year), while condos fell 2.8% to 350,000, down 5.4% year-over-year (median price $363,700, up 1.2% year-over-year).
