Pending Home Sales Plunge to a Record Low
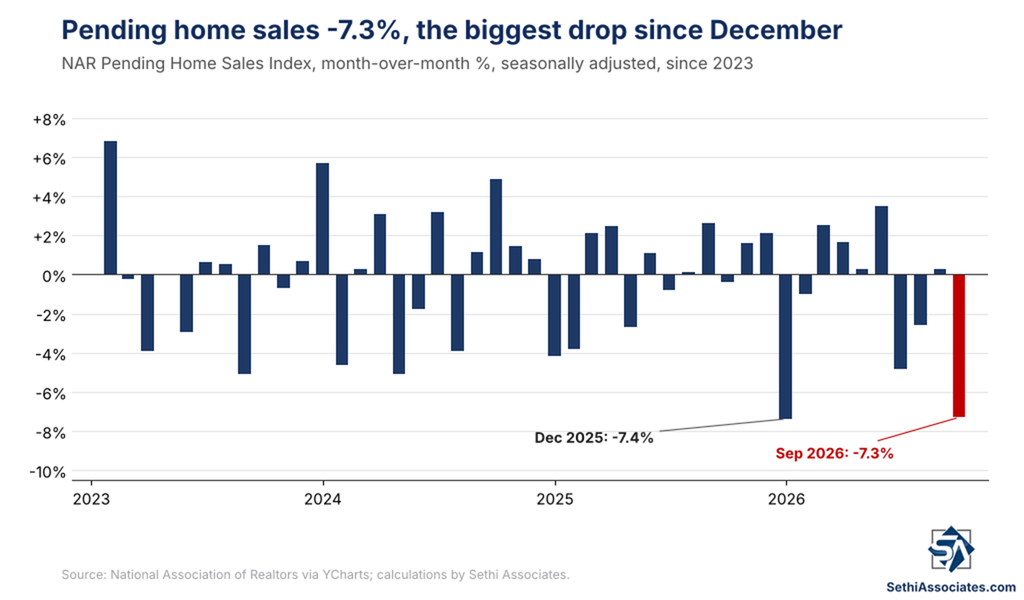
Contract signings for existing homes see the biggest drop since December, sending the index to its lowest level in data back to 2001.
You've reached your free article limit
You've read 0 of 1 free Pro articles.

US Pending Home Sales (M/M) Sep: -7.3% (est -0.5%; prev 0.3%)
Pending Home Sales NSA (Y/Y): -12.6% (est -3.9%; prev -4.9%; prev R -4.7%)
Executive Summary
- September pending home sales (contract signings for existing homes) plunged 7.3% from August (month-over-month), the biggest drop since December, far worse than the 0.5% decline expected.
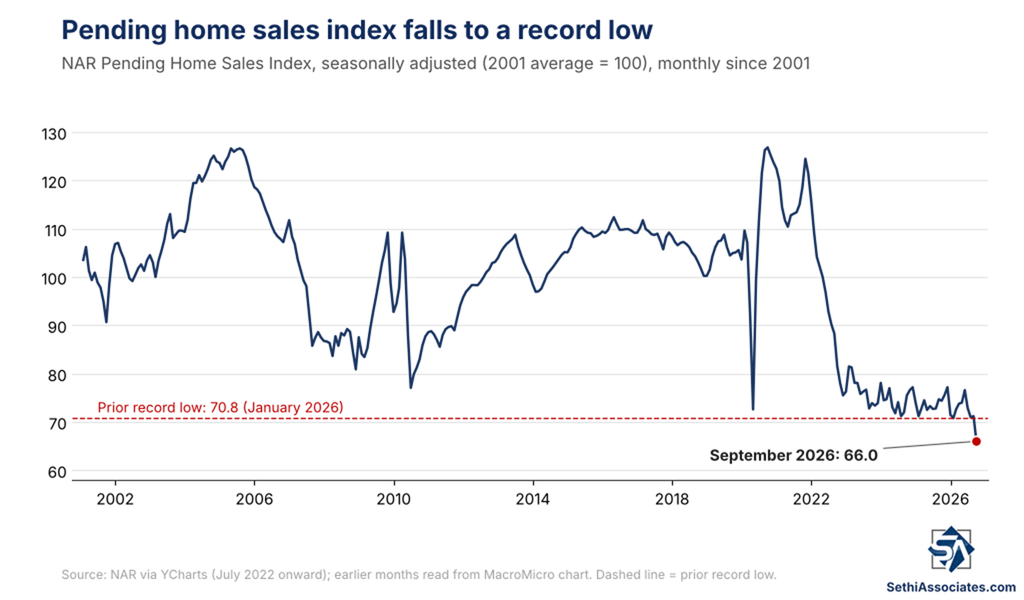
- The index level (sales pace) fell to 66.0, a record low in data back to 2001, well below January’s prior all-time low of 70.8 (revised from 70.9). “A reading of 100 is equal to the average level of contract activity during 2001, which was the first year to be examined.”
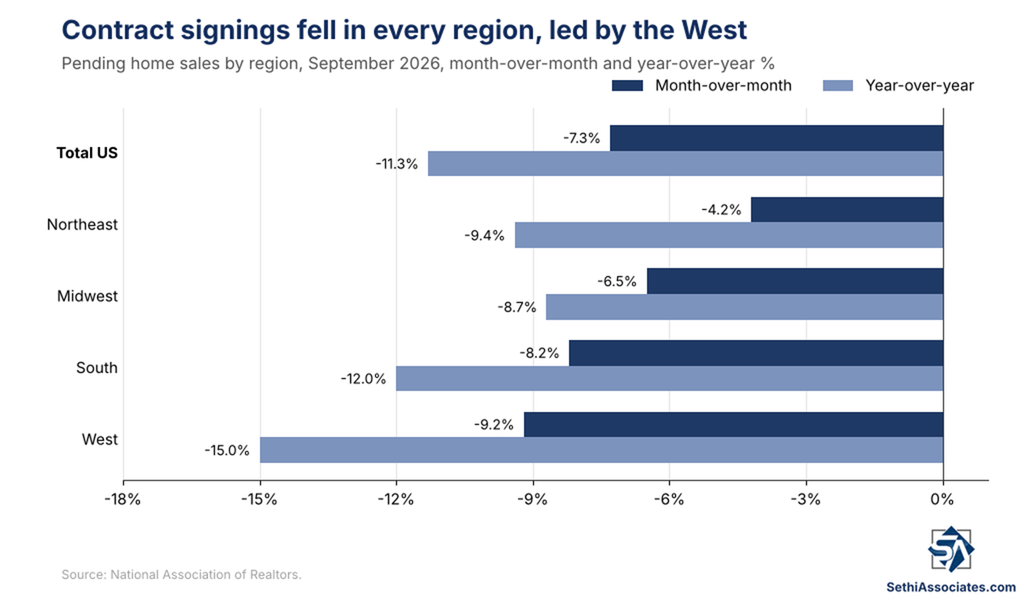
- Contract signings fell in all four regions both month-over-month and year-over-year, led by the West (-9.2% month-over-month, -15.0% year-over-year).
- “Market conditions weakened in September due to fast-rising mortgage rates,” said NAR Chief Economist Dr. Lawrence Yun. “Although job growth and income gains can support home purchases, housing affordability is more affected by changes in mortgage rates.”
Existing home sales historically represented 90% of home sales in the US but fell to as low as two-thirds post-pandemic due to low supply (which has improved) and home builder incentives for new homes (elevating new home sales). Existing home sales are now back to around 85% (over the past year). Pending home sales are contract signings for existing home sales, not actual transactions, so a little more forward looking. Contract signings usually lead sales by about 45 to 60 days but also can be misleading when contract cancellations are high (as they are currently).
September pending home sales plunged 7.3%, the biggest monthly drop since December, far worse than the 0.5% decline expected, after August’s 0.3% gain.
The index level (sales pace) fell to 66.0, the lowest on record (to 2001), well below January’s prior all-time low of 70.8 (revised from 70.9). “A reading of 100 is equal to the average level of contract activity during 2001, which was the first year to be examined.”
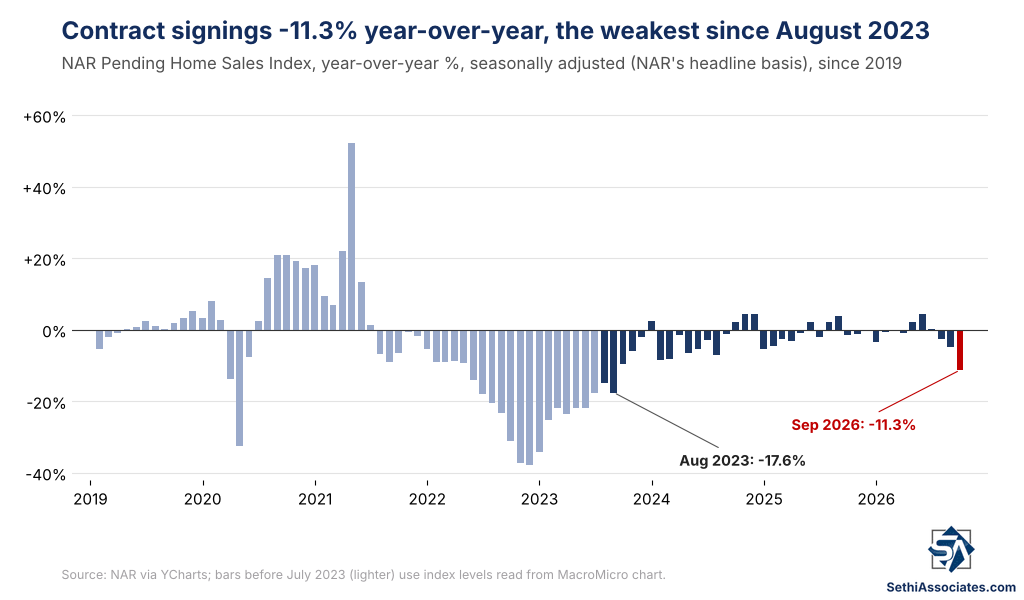
From a year earlier, contract signings fell 11.3% on a seasonally adjusted basis (NAR’s headline figure), the weakest since August 2023, after August’s -4.7%.
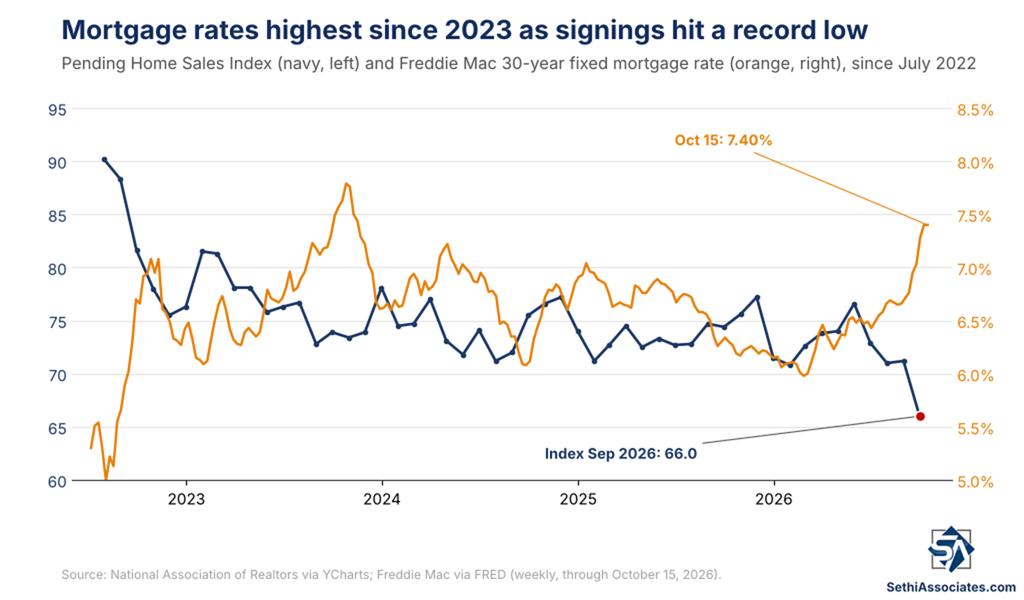
“Market conditions weakened in September due to fast-rising mortgage rates,” said NAR Chief Economist Dr. Lawrence Yun. “Although job growth and income gains can support home purchases, housing affordability is more affected by changes in mortgage rates.”
In that regard, 30-year mortgage rates per Freddie Mac averaged 6.86% in September, the highest since January 2025, and have since climbed to 7.40% as of October 15, the highest since November 2023.
“Given that mortgage rates have already risen much more than the Federal Reserve’s short-term interest rate hikes, mortgage rates could be topping out,” Yun said. “However, increasing energy prices and the resulting inflationary pressure are highly uncertain.”
Regionally, pending home sales declined in all four US regions. The West had the largest drop at -9.2%, followed by the South, the US’s biggest home-selling region, -8.2%, the Midwest -6.5%, and the Northeast -4.2%. Year-over-year, all four regions declined — the West -15.0%, the South -12.0%, the Northeast -9.4%, and the Midwest -8.7%.
“Despite the difficulty of obtaining a mortgage, the limited number of distressed properties is ensuring steady home prices,” Yun added. “Buyers and sellers may simply be holding back until mortgage rates move favorably.”
The report also noted:
“At the local level, pending home sales fell year-over-year even in the strongest markets. Among the 50 largest metro areas, the following 10 markets posted the smallest annual declines in pending home sales, according to data from Realtor.com® Economics:”
1. Nashville–Davidson–Murfreesboro–Franklin, TN (-2.0%)
2. Hartford–West Hartford–East Hartford, CT (-2.1%)
3. San Francisco–Oakland–Fremont, CA (-3.5%)
4. San Jose–Sunnyvale–Santa Clara, CA (-4.6%)
5. Buffalo–Cheektowaga, NY (-5.6%)
6. Richmond, VA (-5.8%)
7. Austin–Round Rock–San Marcos, TX (-5.9%)
8. Pittsburgh, PA (-6.2%)
9. Memphis, TN-MS-AR (-6.3%)
10. San Antonio–New Braunfels, TX (-7.1%)
Because houses typically go under contract a month or two before they’re sold, the pending home sales data tend to be a leading indicator of closings captured in the monthly previously owned home sales reports.
https://www.nar.realtor/newsroom/pending-home-sales-decreased-7-3-percent-in-september