Blue Wave Sends the Dow to Its Best Day Since April 2025 as AI Beneficiaries Sink
A Democratic sweep of Congress supercharged the rotation trade, with hyperscalers joining a rally that lifted almost everything except semiconductors and AI power and data center names.
You've reached your free article limit
You've read 0 of 1 free Pro articles.

Executive Summary
The election that I said last night would “suck up most of the oxygen” Wednesday certainly did that after a Democratic sweep of Congress. Outside of AI names and Energy, the latter sinking on expectations for a quicker end to the Iran conflict, markets cheered the result, sending the Dow Jones Industrial Average to its best day since April 2025 as oil, the dollar, and Treasury yields tumbled.
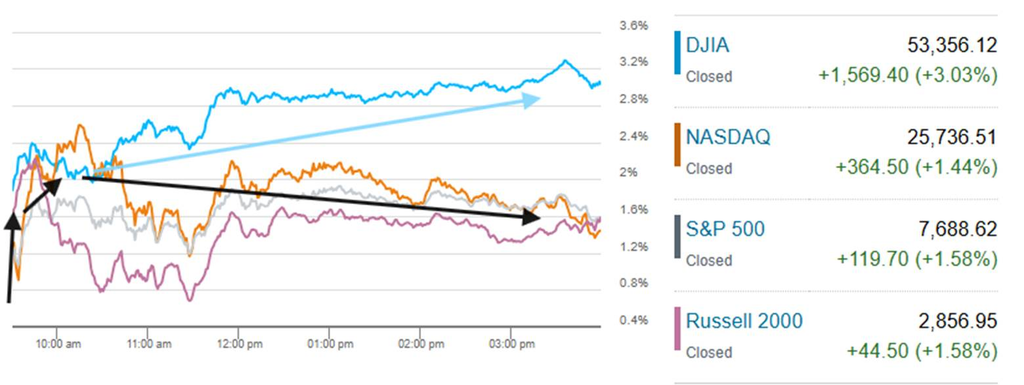
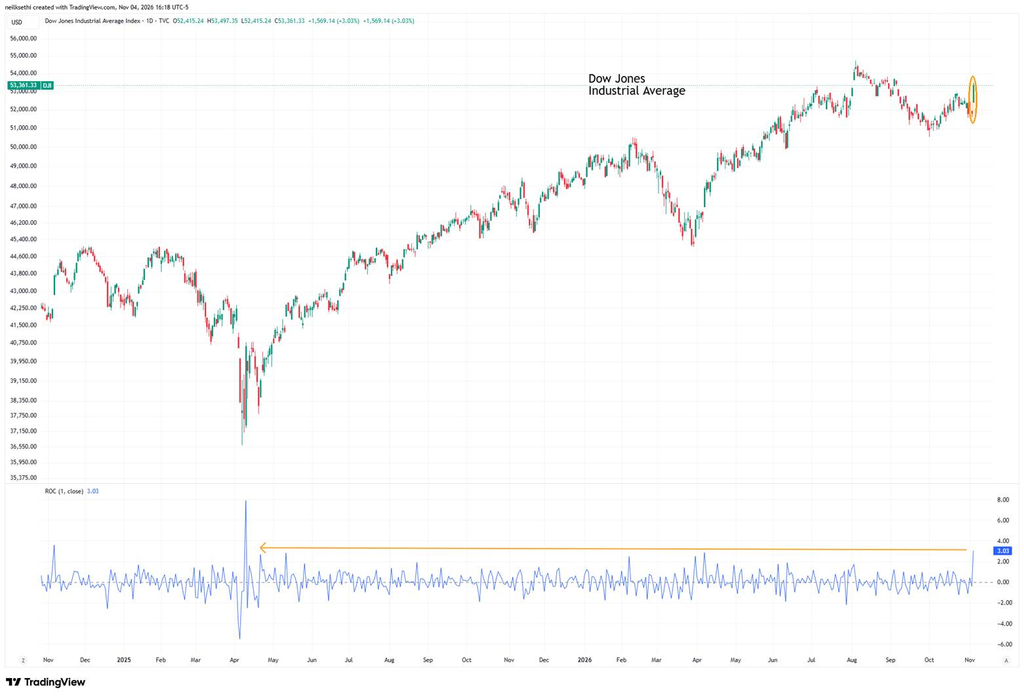
The Dow Jones Industrial Average (DJIA) jumped 3.0%, or nearly 1,570 points, to its highest close since September 4 and, according to MarketWatch, its best post-midterm day since 1982 (see chart below). The S&P 500 (+1.6%) had its best day since August 4 and the Nasdaq (+1.4%) its best since September 21 despite a host of AI beneficiaries seeing sharp declines sending the Philadelphia Semiconductor Index (SOX) down 3.1%. The Russell 2000 (+1.6%) closed (barely) above its 50-day moving average for the first time since August 27.
Schwab

Most of the gains came ahead of the open, with the Nasdaq, S&P 500 and Russell 2000 ending little changed from their opening levels, while the DJIA drifted higher. It was a big turnaround from where markets stood at midnight, when Nasdaq-100 and S&P 500 futures were down over 1% as the early returns came in. But futures reversed higher from there, with the Wall Street Journal crediting the turnaround on President Trump acknowledging the Democratic wins and saying he looked forward to working with Democrats.
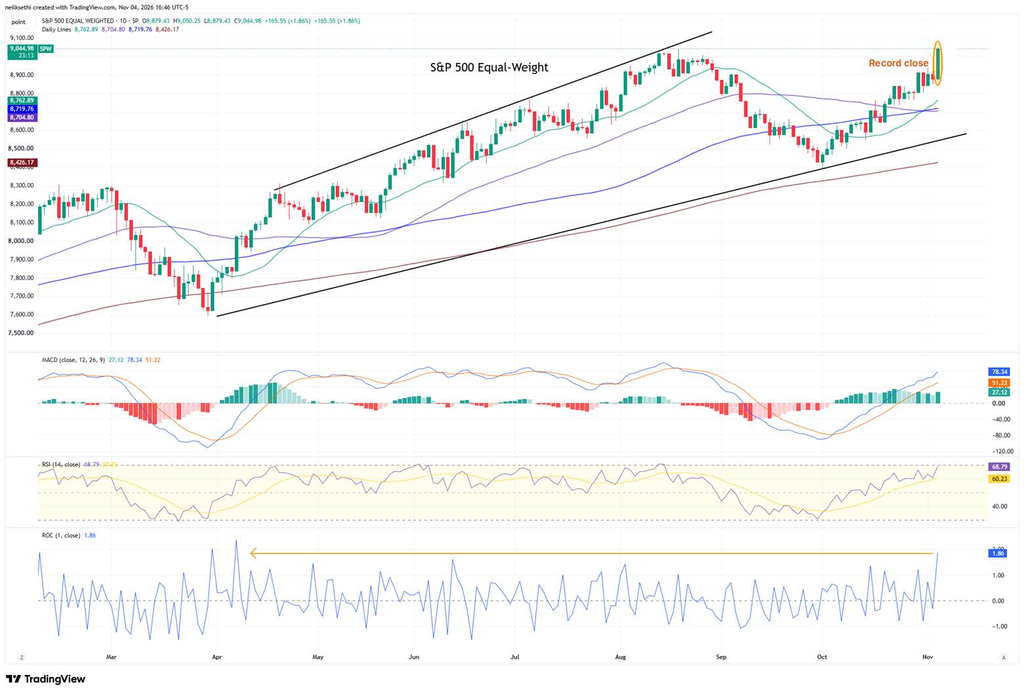
Wednesday’s rally was broad. The equal-weighted S&P 500 rose 1.9% to a record close, and 375 S&P 500 stocks rose while 127 fell. Nine of 11 sectors gained, seven of them by around 3% or more.
The big exception as noted was the AI buildout trade. Investors weighed tighter data center rules from Democrats in Congress and several statehouses, including Texas, where Goldman estimates about 25% of planned US capacity sits (more here: Blue Wave Puts Data Centers in the Crosshairs, but Wall Street Sees Delays, Not a Halt). Power producers and data center builders fell about 10% to 15%, and the SOX dropped to its lowest close since April 28. That held the Nasdaq-100 to a 0.9% gain, even as the hyperscalers rallied on a more positive outlook for their cash flows and fewer new data centers raising the value of those they already own.
Oil fell more than 8% after a long social-media post by Vice President JD Vance (
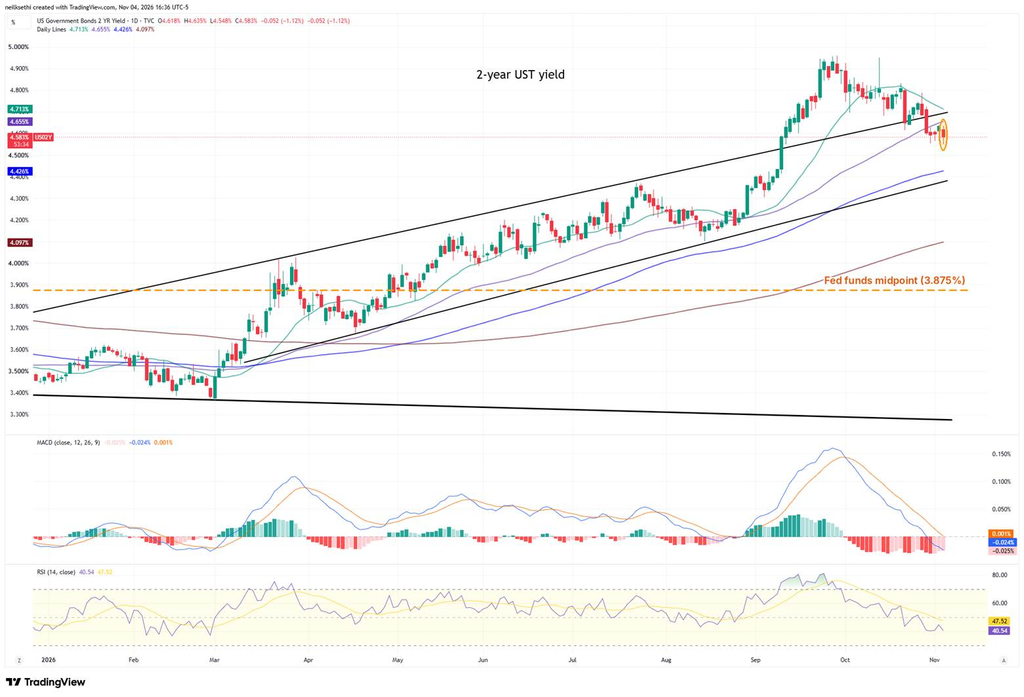
Treasury yields fell with the AI names and oil, with the 2-year yield down 3 basis points to 4.59% and the 10-year down 6 basis points to 4.89%, both their lowest cash session closes since early September, per Briefing.com. That came despite a refunding announcement that disappointed bond bulls by leaving 20- and 30-year auction sizes unchanged and tipping potential supply increases next year (more here: Treasury Refunding Disappoints Bond Bulls).
Fed rate hike bets were little changed, with the odds of a December hike at 82% (from 79%) and 53 basis points of hikes priced through December 2027 (from 59), per CME FedWatch.
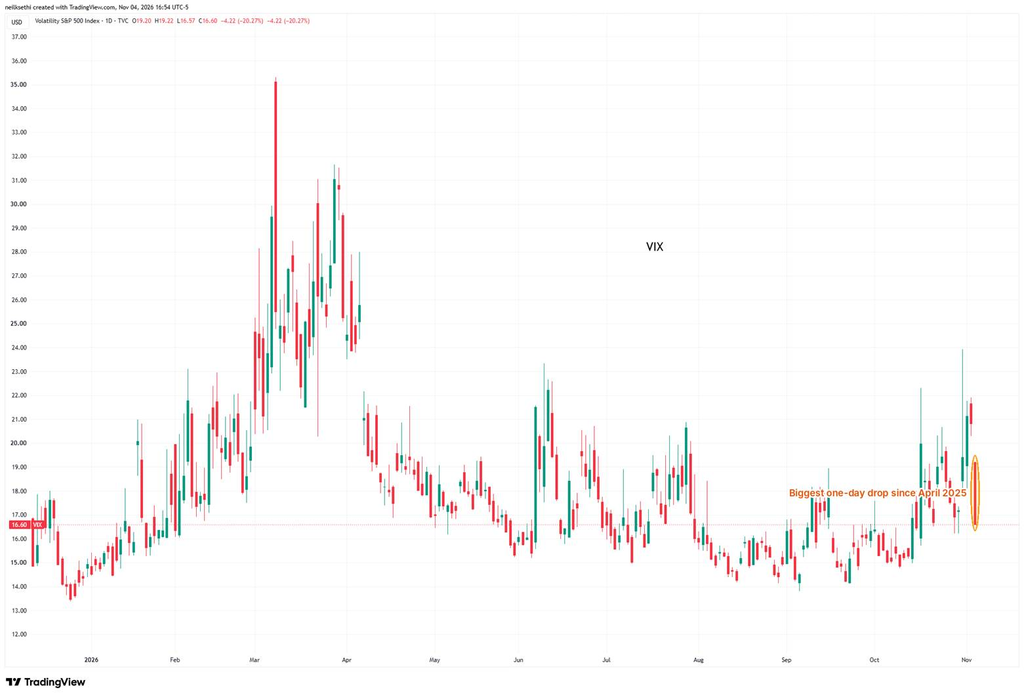
The VIX fell 20% to 16.60, its biggest one-day drop since April 2025 (more here: Investor ‘Fear’ Is Dropping the Most Since April 2025). Gold rose 3.3%, its best day since August 5, back above $4,000, and bitcoin gained about 3%, back above $80,000. The dollar had its worst day in two months, per Bloomberg.
In economic data, October ADP private payrolls rose 86,000, beating the 75,000 consensus (more here: ADP Hiring Beats as Job-Switchers’ Pay Growth Hits Fastest Pace Since 2024).
The ISM services index eased to 54.5 from 54.9 (54.8 consensus), but saw all 10 of its components in expansion for only the second time since 2021 (more here: ISM Services Cools, But 12-Month Average Rises for 10th Straight Month). S&P Global’s final services PMI was revised down to 56.1 from the 57.9 flash but remained “comfortably above the survey average” (more here: S&P Services PMI Decelerates as Sentiment Slides).
The September trade deficit narrowed to $105.0 billion, and Goldman nudged its Q4 GDP tracking estimate up to 1.9%, while the Atlanta Fed’s GDPNow eased to 3.44% (more here: Updates From Q4 GDP Trackers).
After the close, Qualcomm (QCOM) fell about 6% after topping estimates but giving disappointing guidance (TipRanks), and Expedia (EXPE) about 9% despite what looked to be a solid quarter and a guidance raise (TipRanks), both giving back their regular-session gains. AppLovin (APP), though, jumped about 24% on a third-quarter beat and strong outlook (Benzinga)
Chipmaker Arm Holdings (ARM) also fell about 2% after its forecast met estimates (Bloomberg).
Thursday is a lighter day, with Q3 productivity and unit labor costs, October Challenger announced job cuts and hiring, jobless claims and a Bank of England decision with ConocoPhillips (COP), Parker Hannifin (PH) and Southern Co. (SO) reporting before the open and Airbnb (ABNB) after the close. Friday brings us the Employment Situation report for October.
Market Commentary
Equities:
- “Now with this blue wave, I think it’ll slow it down even more… I think we could see at least 10 to 15 gigawatts of the expected build not come online. That’s why I think it’s going to be really challenging for the AI infra trade,” said Altimeter Capital’s Brad Gerstner, speaking on the All-In Podcast livestream about the election’s implications for the data center buildout.
- Famed AI bull Dan Ives of Wedbush Securities put it like this: “There is no way to sugarcoat that Democrats taking control, especially over the Senate, will create some major hurdles for AI and tech legislation in the Beltway over the next 2 years.”
- Hyperscalers “already have compute. They have the data centers. So if you’re pulling up the drawbridge, you’re giving them their moat,” said Michael Antonelli, a market strategist at Baird Private Wealth Management. “You’re reducing the odds that we start doing things that make no sense just to chase the next capex dollar,” he added.
- “While a ‘blue wave’ could spark volatility in certain sectors, such as tech and AI, given growing public opposition to the buildout of data centers, we believe markets can grind higher regardless of the outcome as investors applaud falling uncertainty,” said Justin Buell at Continuity Group.
- Markets “like gridlock — they don’t like a party with too much power,” said Andrew Slimmon of Morgan Stanley Investment Management. Speaking with CNBC’s “Squawk Box Europe,” Slimmon also said that if the result increases the push for a resolution to the Middle East conflict, that may bring oil prices lower. “That’s been an issue for the Fed, and inflation, and part of the reason that rates are higher.”
- “There’s just going to be even more pressure to end the war,” said Peter Boockvar, chief investment officer at One Point BFG Wealth Partners. “The American people have obviously expressed their displeasure with inflation and the price of gasoline, amongst other things, and maybe this just pushes for an end to it. We’ll have to see.”
- “Yes, potential worries over AI regulation are high, but the reality is markets hate uncertainty and now with the election out of the way, we are seeing buyers step in across the board,” said Ryan Detrick at Carson Group. “And let’s not forget that history shows a big rally post-midterm elections is quite normal and we could be seeing history repeat once again this year.”
- Democrats’ resounding win across both the House and Senate presents “the best possible outcome for markets,” said Nannette Hechler-Fayd’herbe, head of investment strategy at Lombard Odier.
- “The results could act as a clearing event removing some uncertainty, though developments around the AI theme and geopolitics are the primary forces driving markets heading into the final two months of the year,” said Angelo Kourkafas, senior strategist at Edward Jones. “If we do see election-driven volatility it may present an opportunity for long-term investors to lean into it.”
- Since 1946, stocks have been higher one year after every midterm vote, including all four times both the House and Senate flipped to the party opposing the president, said Keith Lerner at Truist Advisory Services, per Bloomberg. “That supports our base case of giving the bull market the benefit of the doubt, but earnings, the economy, interest rates, valuations, and market trends remain more important to our view,” he added.
- Citadel Securities’ Scott Rubner sees US stocks set for gains into year-end as the election removes a source of uncertainty, earnings stay strong and lackluster positioning leaves room for renewed buying, per Bloomberg.
- “Gridlock is good,” said Jason Pride at Glenmede. “Markets have historically fared better when no single party can push through legislation on party-line votes. This sort of backdrop has generally been supportive for equities.”
- “Equity investors are breathing some kind of relief that the president is going to accept the results,” said Ron Albahary, chief investment officer of multifamily office LNW.
- The rebound “was in part due to the president’s initial tone and reaction to the results,” said Jay Woods, chief market strategist at Freedom Capital Markets. “Still more uncertainty looms, but one thing is certain, there will be gridlock and historically this is good for the market.”
- “If Donald Trump and the Trump administration really changes tack and becomes more willing to cooperate and reach out across the aisle, that would be a significant positive for the U.S. stock market and the U.S. economy,” said Joachim Klement, head of strategy at London-based brokerage Panmure Liberum.
Stock and Sector Breakdown
Schwab
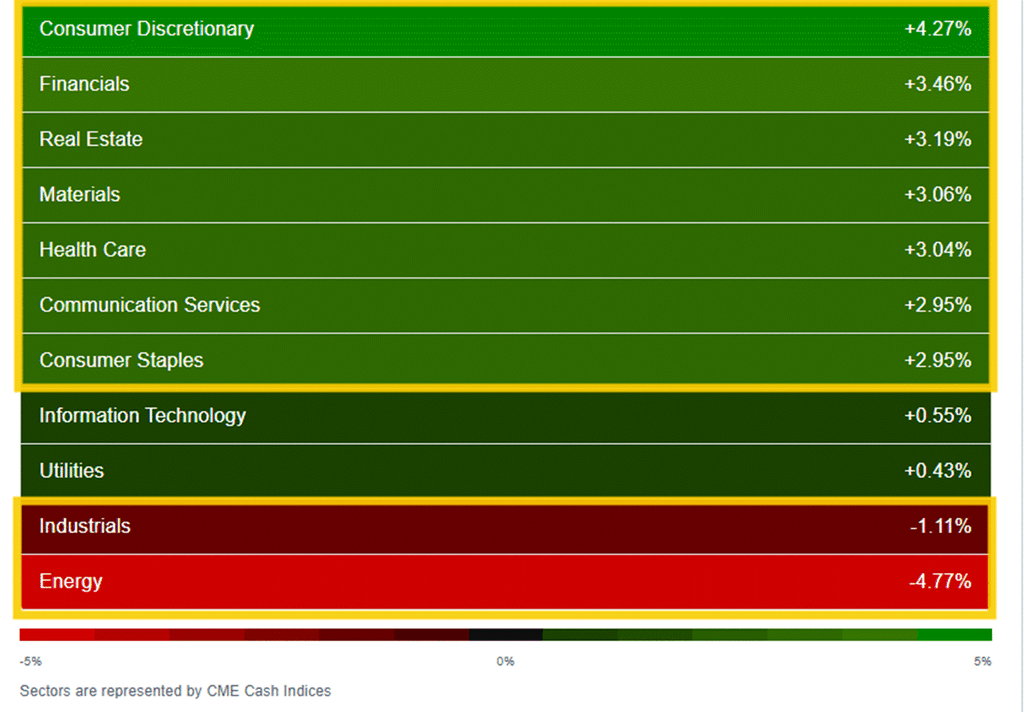
Nine of 11 sectors were higher and seven of them by around 3% or more. Consumer Discretionary (+4.27%) led, followed by Financials (+3.46%), which had their biggest gain since April 2025 to close at a record (see my X post below). Real Estate (+3.19%), Materials (+3.06%), Health Care (+3.04%), Communication Services (+2.95%) and Consumer Staples (+2.95%) all rose about 3%, with Health Care and Staples also closing at records, per Briefing.com. Tech (+0.55%) and Utilities (+0.43%) lagged. That ended Tech’s streak in the top two or bottom two sectors at 13 sessions.
To the downside, Energy (-4.77%) had its second-worst day since April 2025 as oil sank, and Industrials (-1.11%) fell on the data center selloff. 3M (MMM) (+10%) stood out there after resolving its firefighting-foam PFAS injury claims and authorizing a $6 billion buyback, per Briefing.com.
Mosaic (MOS) (+17%) was the best performer in the S&P 500, as investors looked past a third-quarter loss to its outlook and cost cuts (Investing.com). Fidelity National Information Services (FIS) (-24%) was the worst after it cut its 2026 outlook, guided to lower 2027 earnings and said its CFO is leaving (Investing.com).
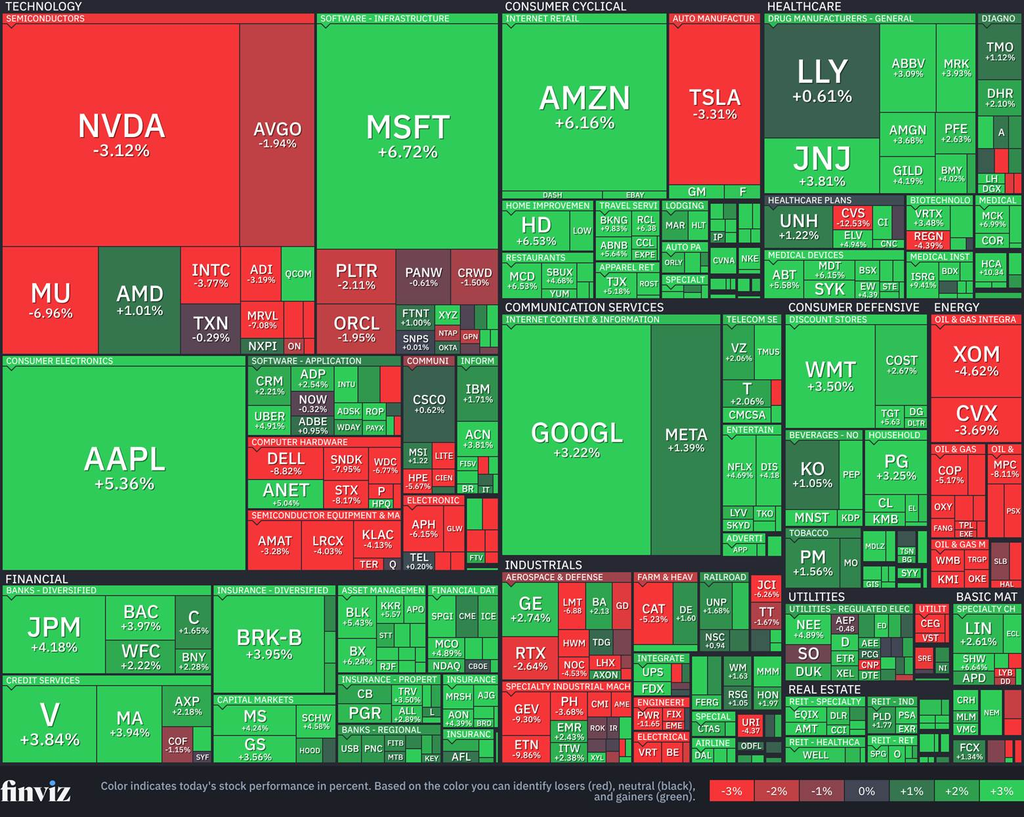
The AI power and data center trade took the brunt of the election fallout, a sharp reversal from Tuesday’s gains. Power producers Vistra (VST) and NRG Energy (NRG) fell about 14%. About a dozen builders and suppliers, from Comfort Systems USA (FIX) to Vertiv (VRT) and Eaton (ETN), dropped roughly 9% to 15%. Chris Versace thinks the selloff overstates the damage (Why Midterm Change Won’t Disrupt the AI Buildout as Much as Feared), while Bret Jensen lays out the headwinds (Could AI Trade Short Circuit Soon?).
Chips fell too, with Micron (MU) and Sandisk (SNDK) down 7% to 8%, and Nvidia (NVDA) about 3%. Advanced Micro Devices (AMD) gave back most of its 7% after-hours jump to finish up 1%, which Stephen Guilfoyle wrote about today (New AMD Price Target as Blue Wave Dampens Strong Earnings). Arista Networks (ANET) held on to a 4.5% gain after its report, with Versace raising his price target (New Arista Networks Price Target After Beat-And-Raise Quarter) and Bob Lang watching it try to break its downtrend (Chart of the Day: Arista Networks Tries to Break Downtrend).
Health care was a big winner, with hospital operators and Medicaid-focused insurers rallying on hopes a Democratic Congress could delay Medicaid cuts and extend enhanced Affordable Care Act subsidies, per Reuters. Centene (CNC) rose about 13%, and Universal Health Services (UHS) and HCA Healthcare (HCA) about 10%. CVS Health (CVS) went the other way, falling about 13% after announcing plans to split into two companies (TipRanks).
Defense stocks and other names seen benefiting from the Trump administration fell, with Lockheed Martin (LMT) down about 7%, L3Harris Technologies (LHX) about 6% and Trump Media & Technology Group (DJT) about 25%.
Earnings drove other big moves. Zimmer Biomet (ZBH) raised its outlook and CDW (CDW) reported strong sales and earnings growth, with both up about 13% (TipRanks), along with Stanley Black & Decker (SWK). Block (XYZ) (+15%) and Booking Holdings (BKNG) (+10%) built on or reversed their after-hours moves. Trimble (TRMB) (-17%) missed on sales and cut its GAAP profit outlook (Benzinga), and Datadog (DDOG) (-14%) fell on a soft fourth-quarter sales forecast (Benzinga).
Consumer names led as oil and yields fell. Homebuilders jumped, with the iShares U.S. Home Construction ETF (ITB) up 7.6%, and Dollar Tree (DLTR) and Dollar General (DG) rose about 9% on hopes lower gas prices free up shoppers’ budgets, per Briefing.com. McDonald’s (MCD) (+7%) rallied after its US sales fell less than feared as diners spent more per visit (Bloomberg).
Among the megacaps, Microsoft (MSFT) rose nearly 7%, Amazon (AMZN) 6%, Apple (AAPL) 5% and Alphabet (GOOGL) 3%, on bets tighter data center rules protect the hyperscalers that already have capacity (see Antonelli’s quote above) and slower spending will boost cash flows that have been under pressure. Tesla (TSLA) and Nvidia though fell about 3%. Versace trimmed Apple into the strength (Trimming Our Apple Exposure on Wednesday’s Market Strength) and added to Meta Platforms (META) (+1%) (We’re Picking Up Shares of This Social Media Powerhouse, Starting New Power Position).
The number of large SPX winners (up over 3%) jumped to 225 from 47 Tuesday, while large losers (down over 3%) rose to 85 from 31.
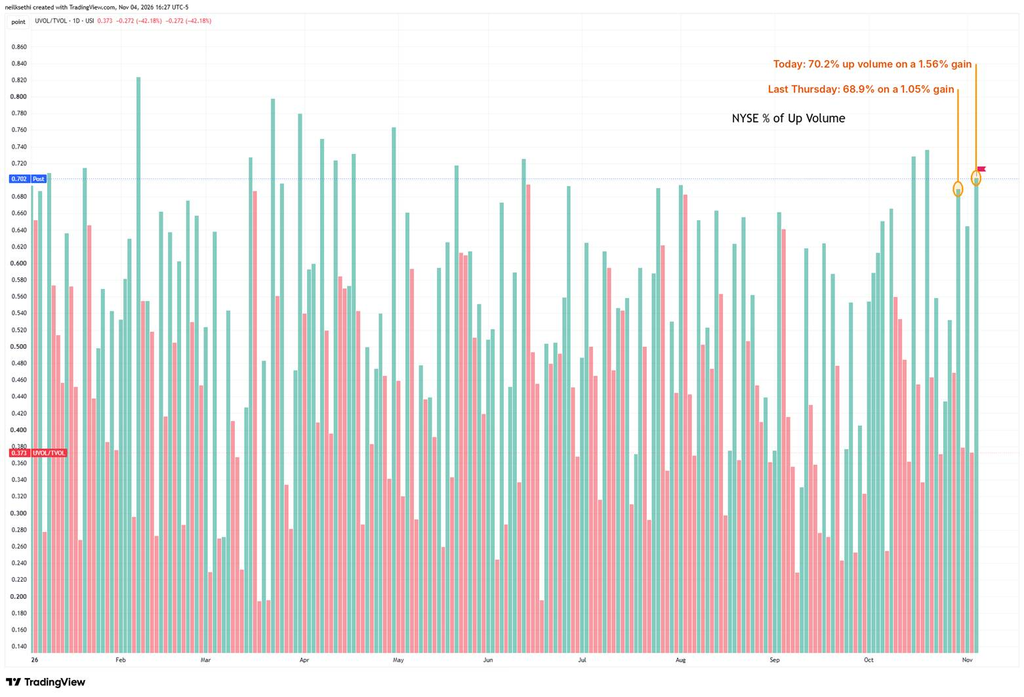
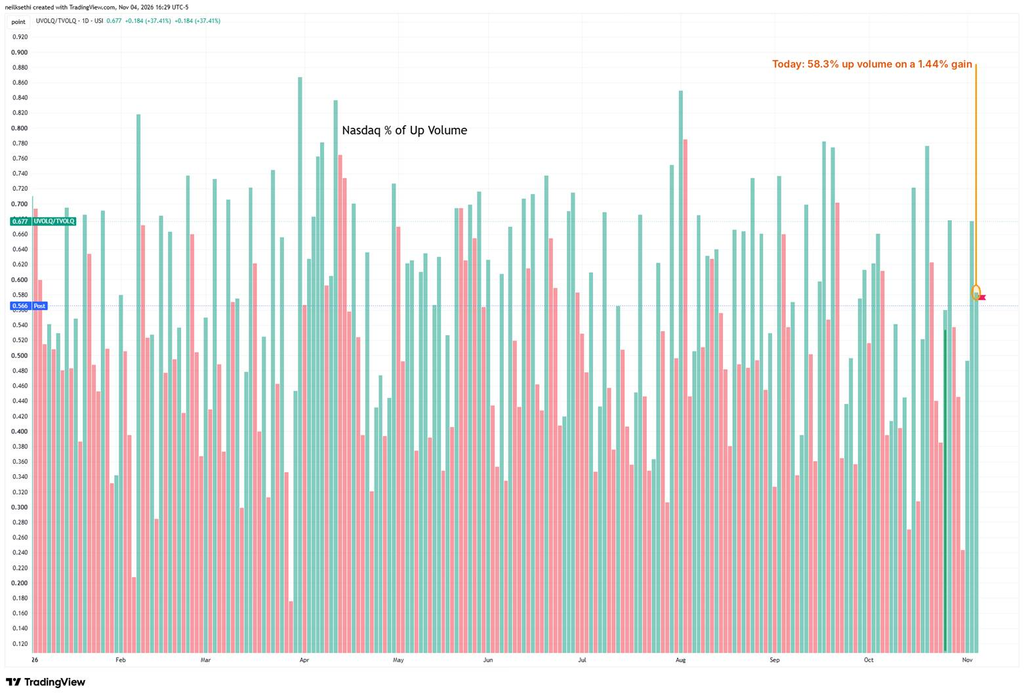
NYSE positive volume was decent at 70.2% on a 1.56% gain, though only a bit better than last Thursday’s 68.9%, which came on a much smaller 1.05% gain. The Nasdaq lagged at 58.3% despite a 1.44% gain, as heavy selling in chips and AI infrastructure names weighed.
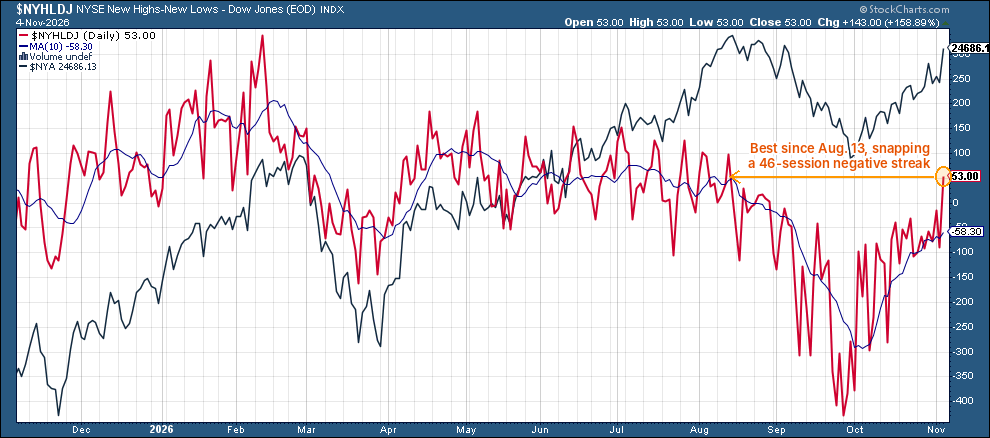
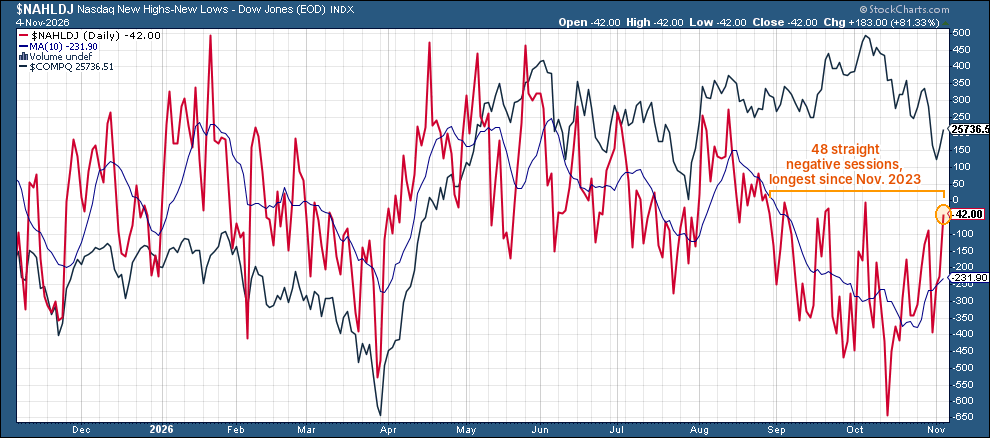
52-week highs minus lows flipped positive on the NYSE to +53 from -90 Tuesday, its best reading since August 13. That snapped a 46-session streak of more new lows than highs, the longest in at least 17 years of FactSet data, per MarketWatch. The Nasdaq improved to -42 from -225, its best since October 6, but it was still its 48th straight negative session, the longest since the 49-day stretch that ended November 14, 2023, according to FactSet.
Some other stock-specific commentary from TheStreet Pro:
Stephen Guilfoyle — Ondas Tops the Short List, but That’s Not What Has Me Concerned
Chris Versace — Deflated Truck Demand Could Send Paccar’s Rebound on a Detour
James “Rev Shark” DePorre — Watching This Rare-Disease Biotech as Hyperscalers Lead Post-Election Market
Ed Ponsi — What Apple and Palantir Are Telling Us About This Market
A Look At The Charts
Note on all charts the colored lines are moving averages (the average price over the lookback period — days on the daily charts, weeks on the weekly charts):
20 = green
50 = purple
100 = blue
200 = brown
Exception is monthly charts where blue is 10-month moving average and brown is 20-month moving average.
MACD = Moving average convergence/divergence line, a measure of momentum that compares longer term and shorter term momentum to gauge if a move is strengthening or weakening. This is probably my favorite individual indicator.
RSI = Relative Strength Index (basically what it sounds like) = measures the strength of the move comparing gains to losses over the given lookback window (I use the standard 14 periods).
SPX
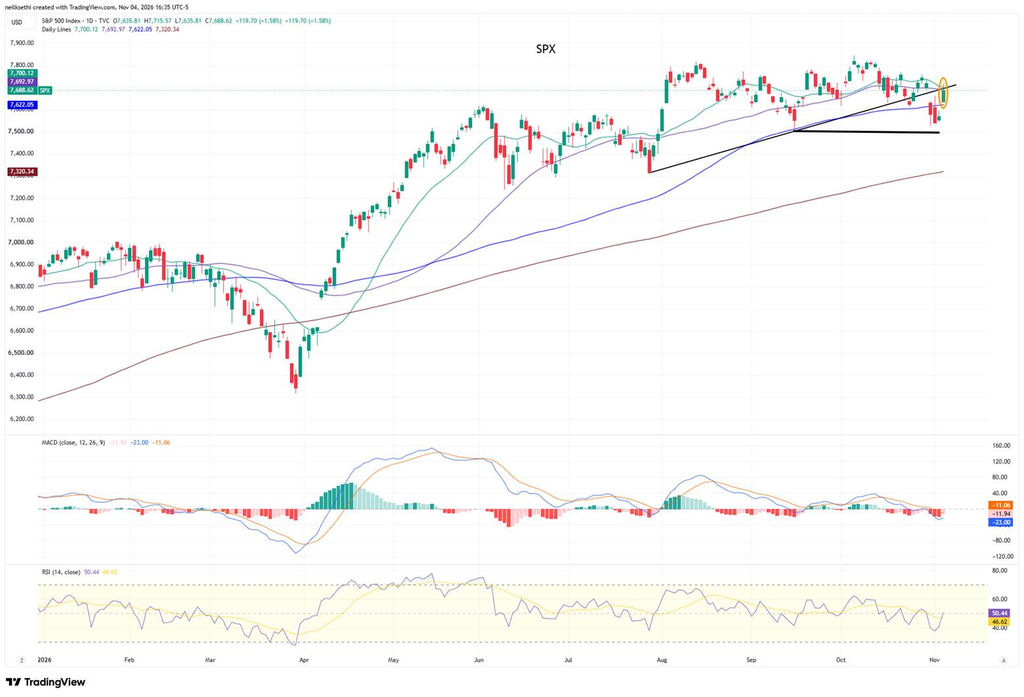
The SPX rose 1.58% to 7,689, its best day since August 4. It tagged its 20- and 50-DMAs (7,700 and 7,693) and the uptrend line from the July low that it broke last week before closing just under all three. The MACD remains in “go short” positioning, and the RSI is back at 50. One good push would likely take it through those moving averages and flip the indicators positive, which would have me adding to SPY.
Doug Kass, meanwhile, went back to shorting the SPY (Back Shorting SPY).
Nasdaq Composite
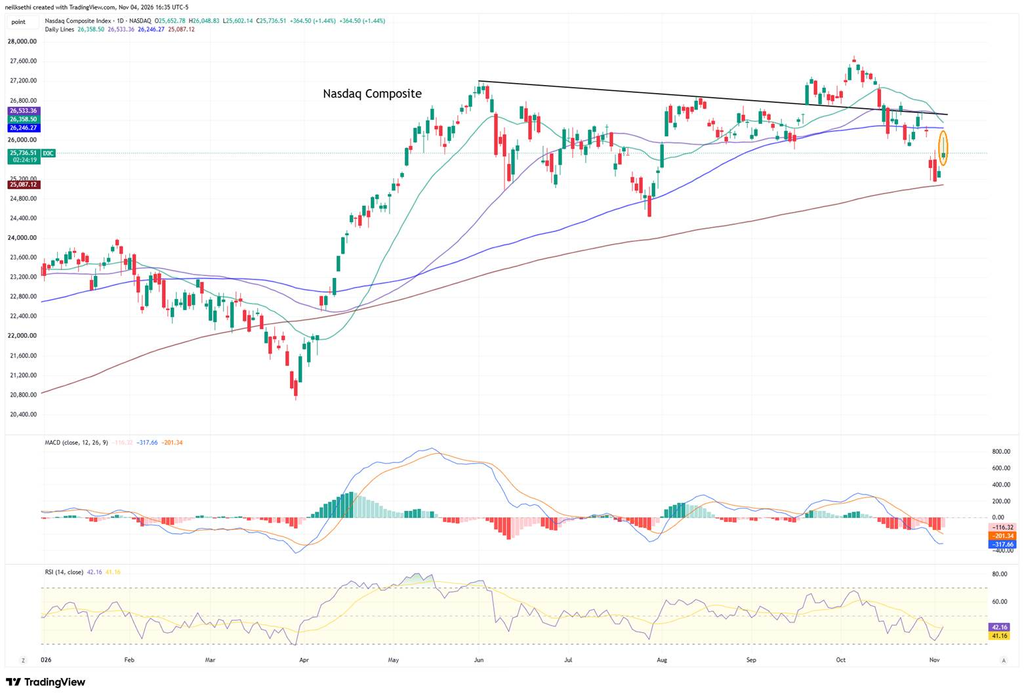
The Nasdaq Composite rose 1.44% to 25,737, its best day since September 21, and is now 2.6% above its 200-DMA (25,087). It’s still below its 20-, 50- and 100-DMAs and the downtrend line from its June high, with the MACD in “go short” positioning and the RSI at 42. So for now just a bounce.
The Nasdaq-100 (QQQ)
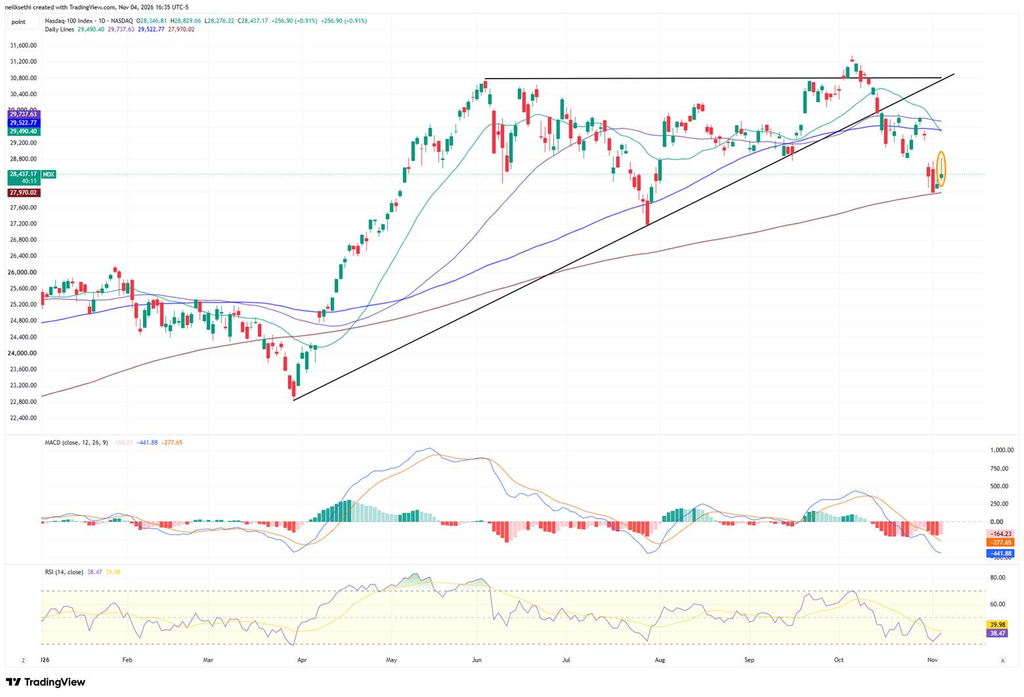
The Nasdaq-100 lagged, rising 0.91% to 28,437, 1.7% above its 200-DMA (27,970) and 8.9% below its October 6 record. It remains well below the uptrend line from the April low that it broke in October, with the MACD in “go short” positioning and the RSI at 38.
As I noted, I bought some QQQ Monday with a stop 1% below the 200-DMA, still just a trade for now looking for a bounce.
The Russell 2000 (IWM)
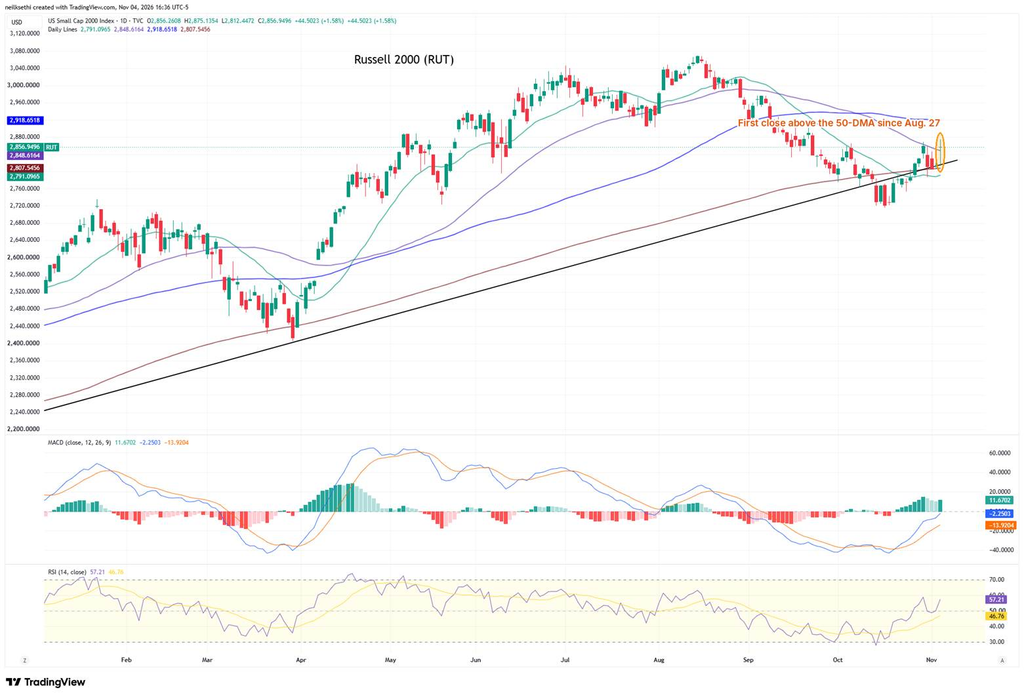
The Russell 2000 rose 1.58% to 2,857, its best day since October 20, bouncing off its long-term uptrend line to close above its 50-DMA (2,849) for the first time since August 27. The MACD is in “cover shorts” positioning and about to cross above zero, and the RSI is at 57.
As I noted, I’ve been holding my IWM position and wanted to see it get back over that 50-DMA, so this is a good first step. Next up is the 100-DMA (2,919).
The equal-weighted SPX (RSP)
The equal-weighted SPX rose 1.86%, its best day since April 8, to a record close of 9,045, topping its August 13 record (9,018) and beating the cap-weighted index by about 0.3 point. It remains above all its moving averages, with the MACD in “buy longs” positioning and the RSI at 69, just shy of overbought.
The 2-year Treasury
The 2-year yield fell 5.2 basis points (including post-market) to 4.58%, about 70bp above the midpoint of the Fed funds target range (3.875%), so still calling for a couple of rate hikes. It’s below its 20- and 50-DMAs (4.71% and 4.66%), with the 100-DMA (4.43%) next. The MACD is in “go short” positioning, and the RSI is at 41.
Fed rate hike bets were little changed, with a December hike at 82% (from 79%) and 53 basis points priced through December 2027 (from 59), per CME FedWatch.
10-year yields
The 10-year yield fell 8.2 basis points (including post-market) to 4.88%, its lowest close since September 9. That takes it further below the 5% level and its 20- and 50-DMAs (5.06% and 5.01%), toward the bottom of its uptrend channel and its 100-DMA (4.80%). The MACD is in “go short” positioning, and the RSI is at 37.
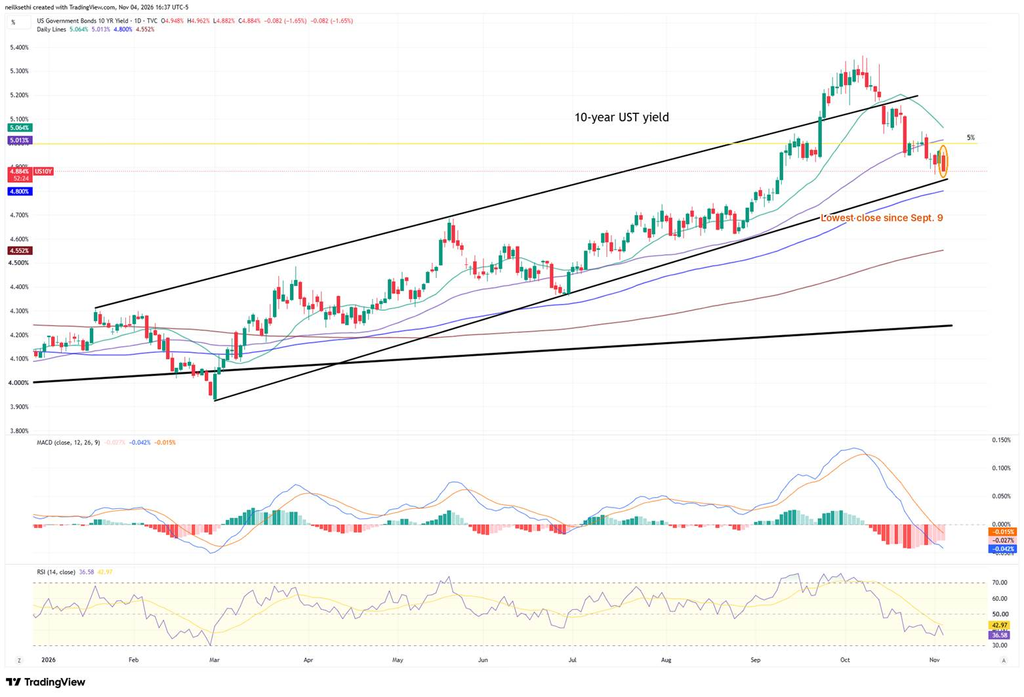
Since I’m now showing the moving averages on the yield charts, I thought this Reuters piece Christophe Barraud flagged was interesting. It sees the rising 20-week moving average (similar to the 100-DMA), near 4.81%, as the key line, and says analysts won’t treat the slide as durable until the 10-year breaks below it and stays there (see my X post below).
30-year yields
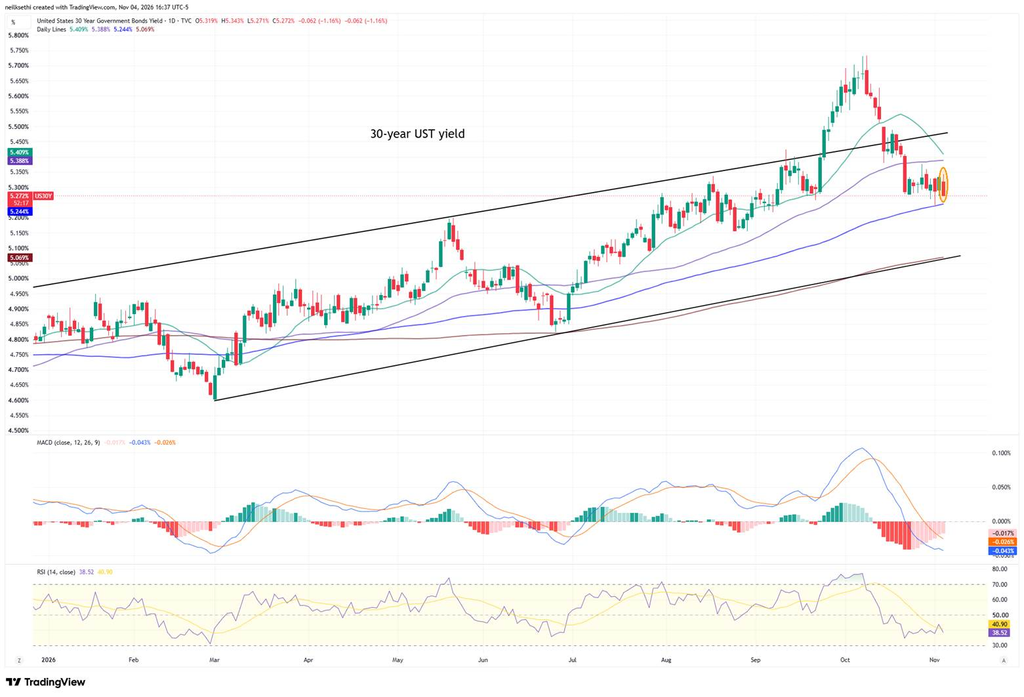
The 30-year yield fell 6.2 basis points (including post-market) to 5.27%, toward its 100-DMA (5.24%), even after Treasury kept long-bond auction sizes unchanged in its refunding announcement and tipped potentially more supply to come as I wrote about in the Stock Market Today page today. The MACD is in “go short” positioning, and the RSI is at 39.
VIX
The VIX fell 20.27%, the most since April 2025, to 16.60, its lowest close since October 15 and back below its long-run average of about 19. The roughly 4-point drop was the largest since this past April. It now implies a daily move of about 1.05% over the next 30 days.
VVIX
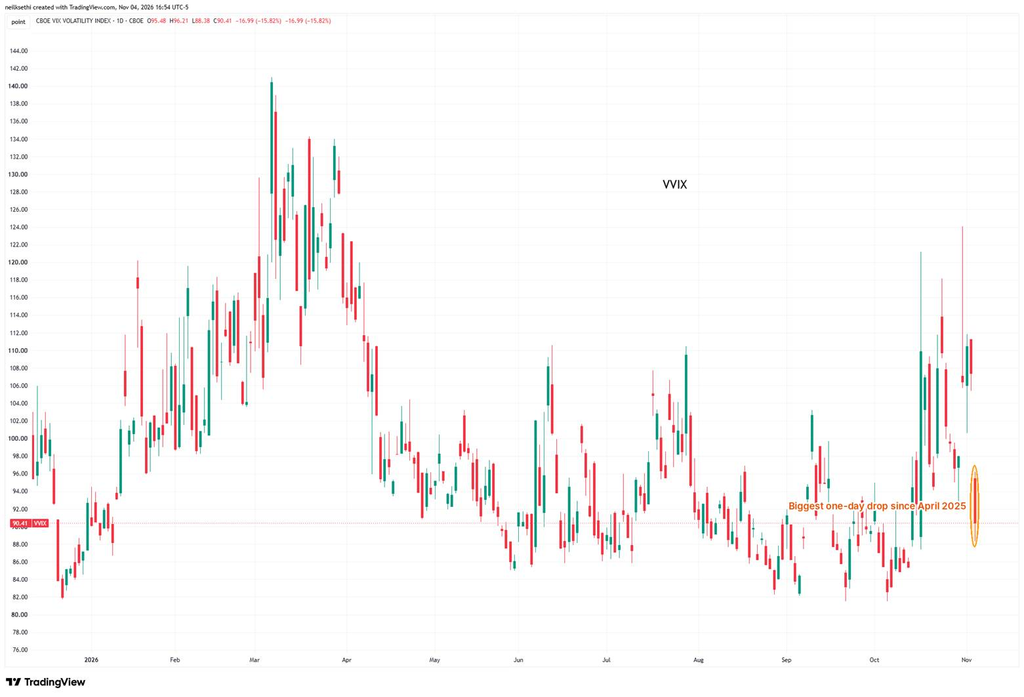
The VVIX (the VIX of the VIX) fell 15.82% to 90.41, its biggest one-day drop since April 2025 and its lowest close since October 13. The current level is consistent with “moderate” daily moves in the VIX over the next 30 days (historically, normal is 80-100, although we haven’t been below 80 since July 2024), and it’s back below the 100 level flagged by Charlie McElligott as indicating higher stress.
1-day VIX
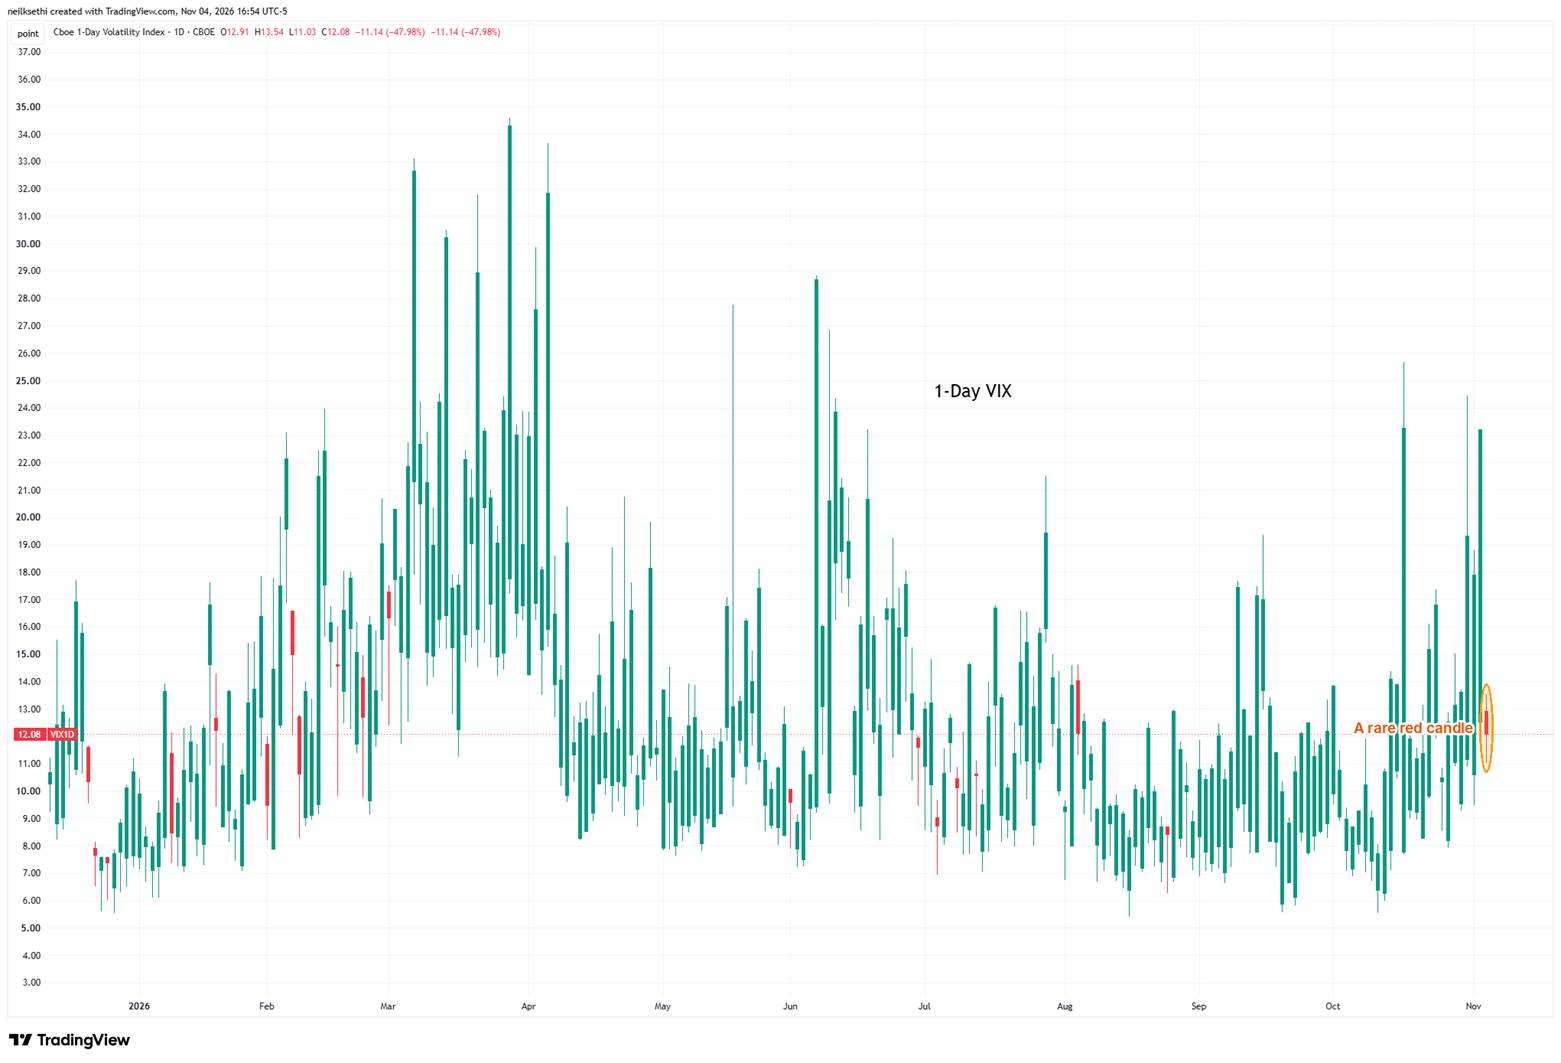
Tuesday’s 1-day VIX reading implied a move of about 1.44% for Wednesday, and the SPX came in a bit above that at 1.58%, so it did a pretty good job. The 1-day VIX then fell 47.98% to 12.08, its lowest close since October 26, implying a move of about 0.76% for Thursday.
Note the red candle, which is rare for this index. It normally closes above where it opened, since by the end of the day it’s pricing an entire extra session. So a red candle means implied volatility shrank by more than that built-in lift. It has closed above its open in about 93% of sessions this year, and today was only the 16th red candle of 2026 and the first since August 25.
WTI futures (/CL)
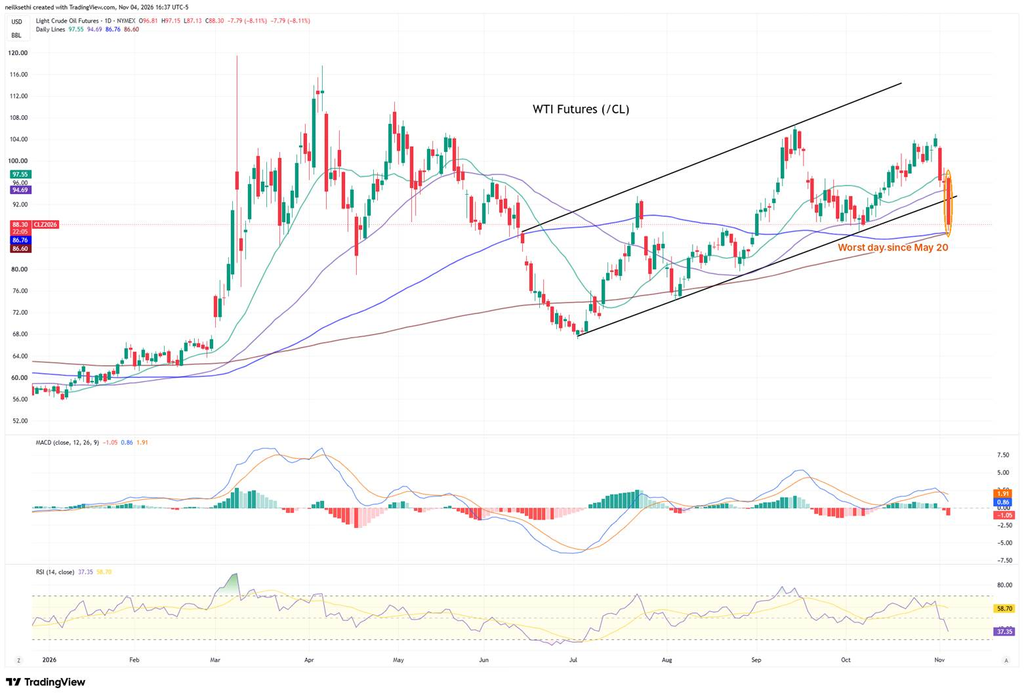
WTI futures, which TradingView has at December currently, fell 8.11% (including post-market) to $88.30, their worst day since May 20. They broke below the bottom of their uptrend channel from the July low and their 50-DMA ($94.69), and now sit just above their 100- and 200-DMAs (both around $86.70). The MACD is in “sell longs” positioning, and the RSI is at 37.
DXY
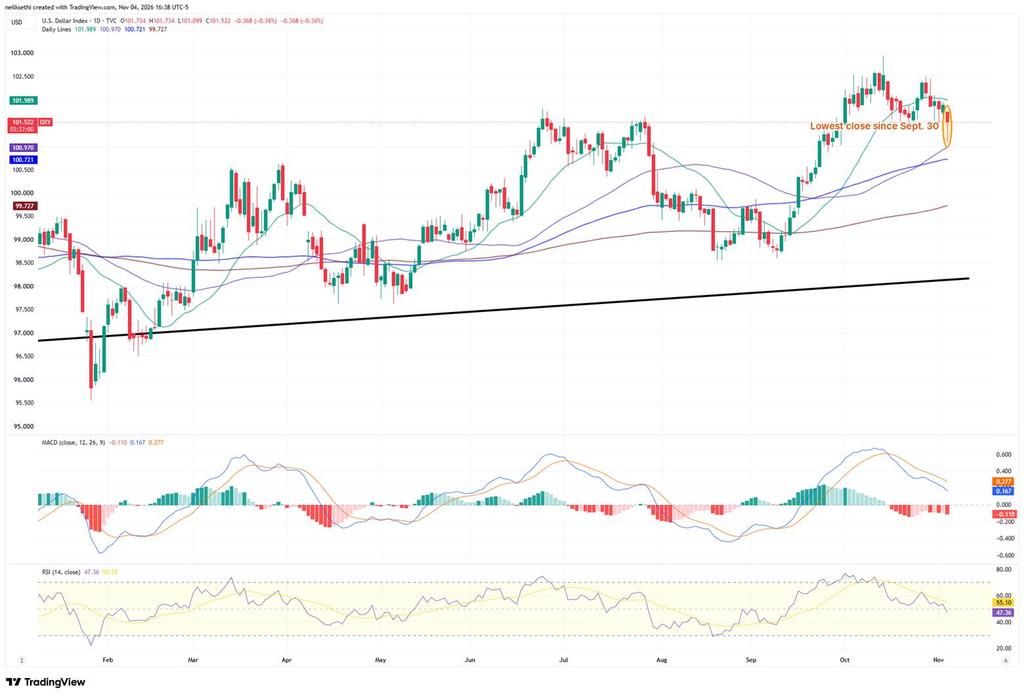
The DXY dollar index (which is fixed weighted with a heavy — 57% — allocation to the euro) fell 0.36% to 101.52, its lowest close since September 30, staying between its 20-DMA (101.99) and 50-DMA (100.97). The MACD remains in “sell longs” positioning, and the RSI is at 47. As I mentioned Tuesday “in the short term, the easier path is lower.”
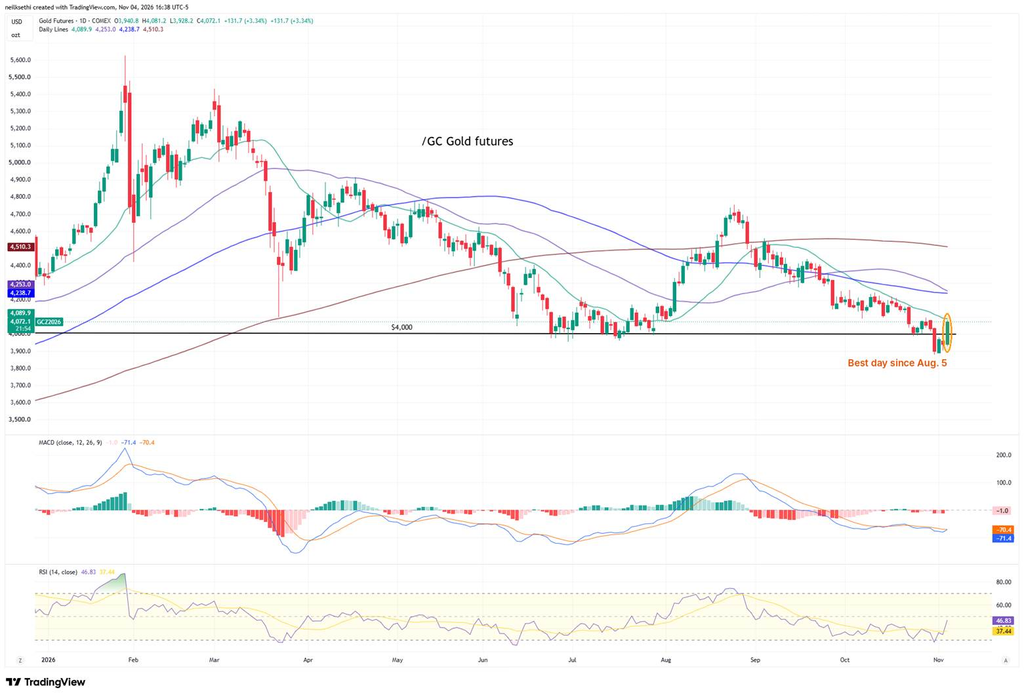
Gold futures (/GC)
Gold futures rose 3.34% (including post-market) to $4,072, their best day since August 5, back above $4,000 but just shy of their 20-DMA ($4,090). The MACD is still in “go short” positioning but about to cross above its signal line, and the RSI is at 47. I’m getting interested.
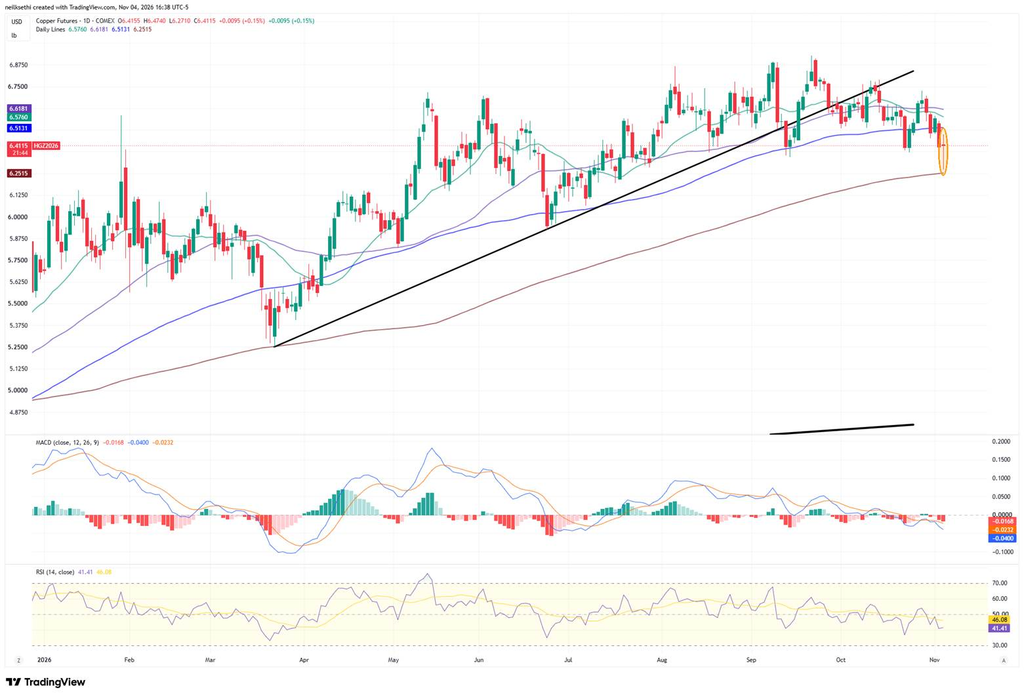
US copper futures (/HG)
Copper futures edged up 0.15% (including post-market) to $6.41 after trading as low as $6.27 intraday. They remain below their 20-, 50- and 100-DMAs but above their 200-DMA ($6.25), with the MACD in “go short” positioning and the RSI at 41.
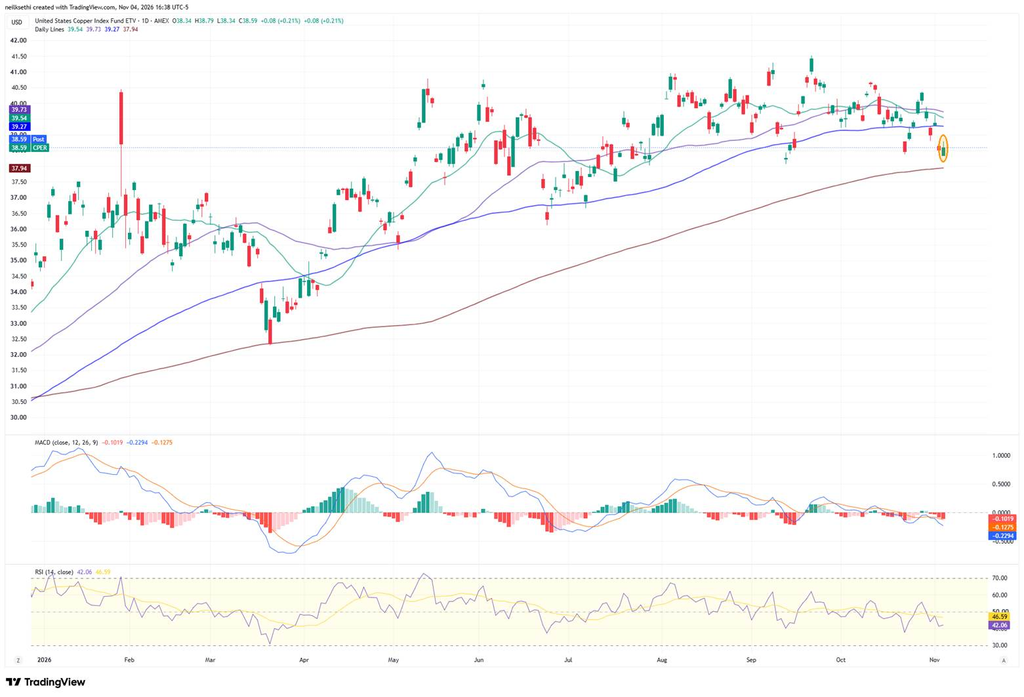
The copper ETF (CPER) rose 0.21% to $38.59, holding above its October 22 closing low ($38.47) and its 200-DMA ($37.94). As I noted, I’ll hold it unless it breaks the 200-DMA.
US natural gas futures (/NG)
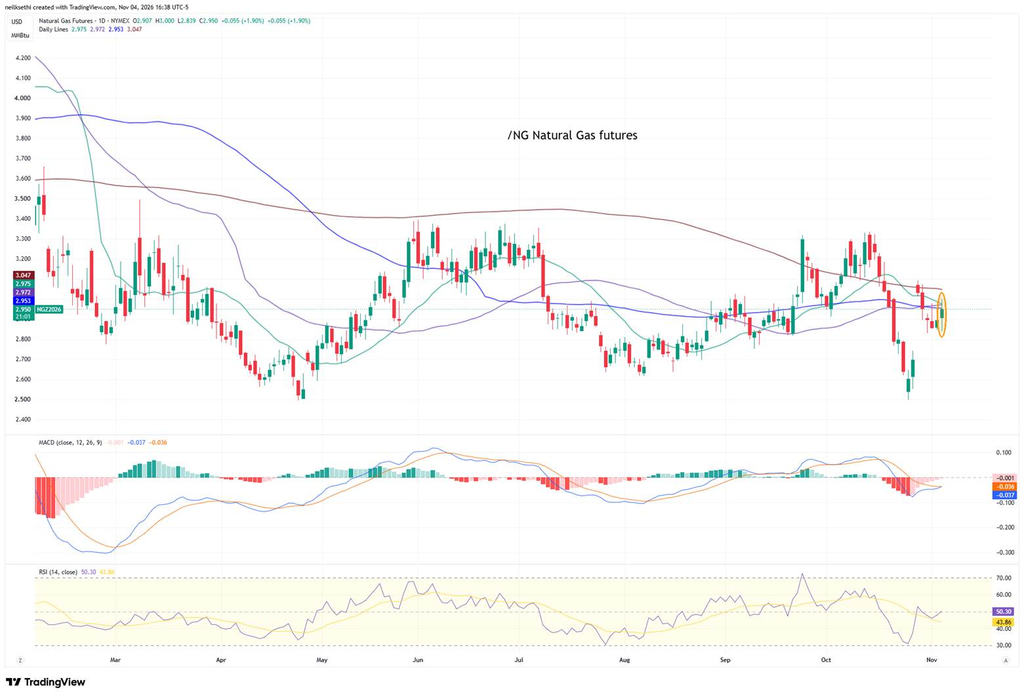
Natural gas futures rose 1.90% (including post-market) to $2.95, right at their 20-, 50- and 100-DMAs (all between $2.95 and $2.98) but below their 200-DMA ($3.05). The MACD is in “go short” positioning by a hair, and the RSI is at 50.
Bitcoin futures
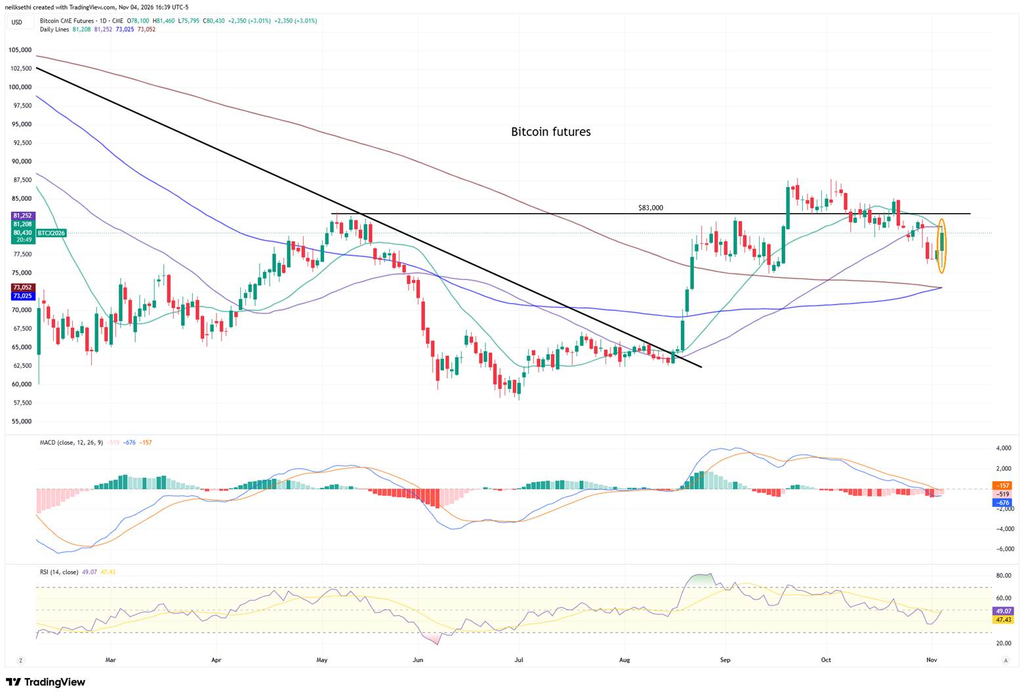
Bitcoin futures like equities reversed overnight losses to rise 3.01% to $80,430, back above $80,000 but just below their 20- and 50-DMAs (both around $81,200). The MACD is in “go short” positioning, and the RSI is at 49.
More From TheStreet Pro
Helene Meisler — Do Stocks Always Rally Following the Midterm Elections?
James “Rev Shark” DePorre — The Market Impact of a Democratic Landslide: Sector Winners and Losers
Stephen Guilfoyle — Blue Wave Brings Tsunami of Questions
Chris Versace — Blue Wave Pops Market, But Can It Overcome Technical Hurdles?: 8 Key Items Shaping the Stock Market Wednesday
Doug Kass —
- Oscillator Less Overbought
- Boockvar on Midterms, Data Centers, Oil
- Block Inc. Up, DJT Down: Upside, Downside Movers in the A.M.
- Boockvar on ADP Jobs Report, Treasury
- SPY Short Update
- Tech (XLK) Vs. Financials (XLF) Vs. Energy (XLE)
- Boockvar on ISM Services
- More Tales From Nvidia: Hundreds of Billions Dollars of Capex for Limited Use Cases (Issue #270!)
- Performance Under a Democratic Congress and Republican President
- A Little-Known Fact
Note: Doug posted 24 Diary entries today; these are the market ones
And From Me If You Missed It
- The Day Ahead: Election Results, Refunding, ADP and Services PMIs
- Treasury Refunding Disappoints Bond Bulls
- Blue Wave Puts Data Centers in the Crosshairs, but Wall Street Sees Delays, Not a Halt
- ADP Hiring Beats as Job-Switchers’ Pay Growth Hits Fastest Pace Since 2024
- S&P Services PMI Decelerates as Sentiment Slides
- ISM Services Cools, But 12-Month Average Rises for 10th Straight Month
- Investor ‘Fear’ Is Dropping the Most Since April 2025
- Updates From Q4 GDP Trackers
Miscellaneous
Wrap-Up — Blue Wave Puts the Rotation Into Overdrive
I wrote yesterday (Tuesday’s Tech Bounce Holds as Elections Take the Stage):
Of course there’s the election (I somehow made it this far without talking about it). I am hopeful that we get some sort of resolution by tomorrow morning that gives us clarity on the path forward. I think whatever it is, markets will come to grips with it fairly quickly. That still leaves the risk of how President Trump responds, but we’ll just have to deal with that if/when it happens.
And I certainly got my wish (in terms of clarity), as voters couldn’t have been clearer that they are frustrated by a multiplicity of issues over the past two years. As many predicted, the resounding Democratic victory pressured AI-related shares, as well as those seen benefiting from Trump’s presidency such as defense and Trump Media. But what I don’t think most predicted is that those losses would be swamped by a surge in the broader market, including the hyperscalers that have been funding the AI buildout.
So, effectively, the election result put the rotation we had been seeing into overdrive. While I think today’s move is extreme, I also think it may prove to be more than a one-day event. But, as always, we’ll just have to see how things progress.
The Day Ahead — A Lighter Day as We Await Jobs Friday
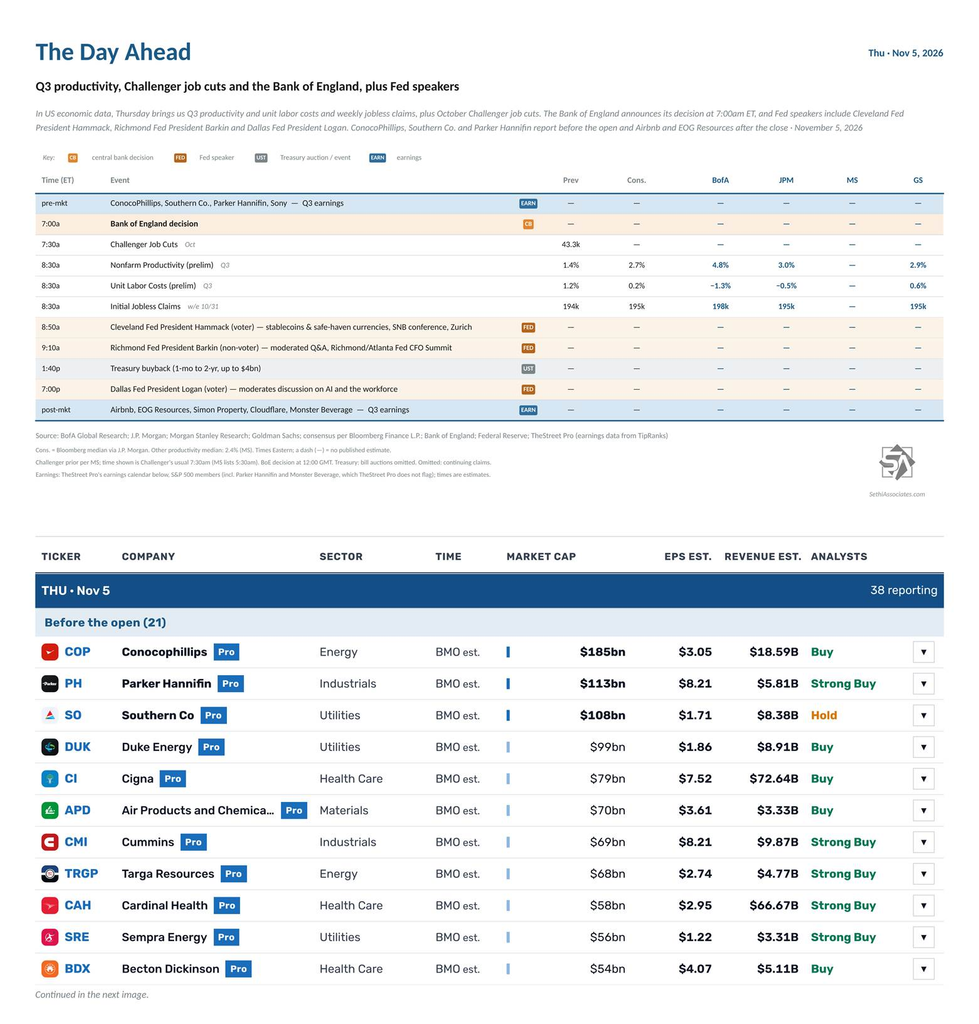
In US economic data, Thursday brings us Q3 productivity and unit labor costs, plus October Challenger job cuts/hires. We’ll also get the weekly unemployment claims.
Cleveland Fed President Hammack (voter) speaks on stablecoins and safe-haven currencies in Zurich at 8:50am ET, Richmond Fed President Barkin (non-voter) participates in a moderated Q&A at 9:10am ET, and Dallas Fed President Logan (voter) moderates a discussion on AI and the workforce at 7pm ET.
The Bank of England announces its decision at 7am ET.
There are no non-Bill (>1yr in maturity) US Treasury auctions, but Treasury holds a buyback of up to $4 billion of 1-month to 2-year securities at 1:40pm ET.
Also, a White House committee is scheduled to hold a closed hearing on allegations against Fed Governor Lisa Cook and whether there’s cause for her removal, per Bloomberg (via Barraud).
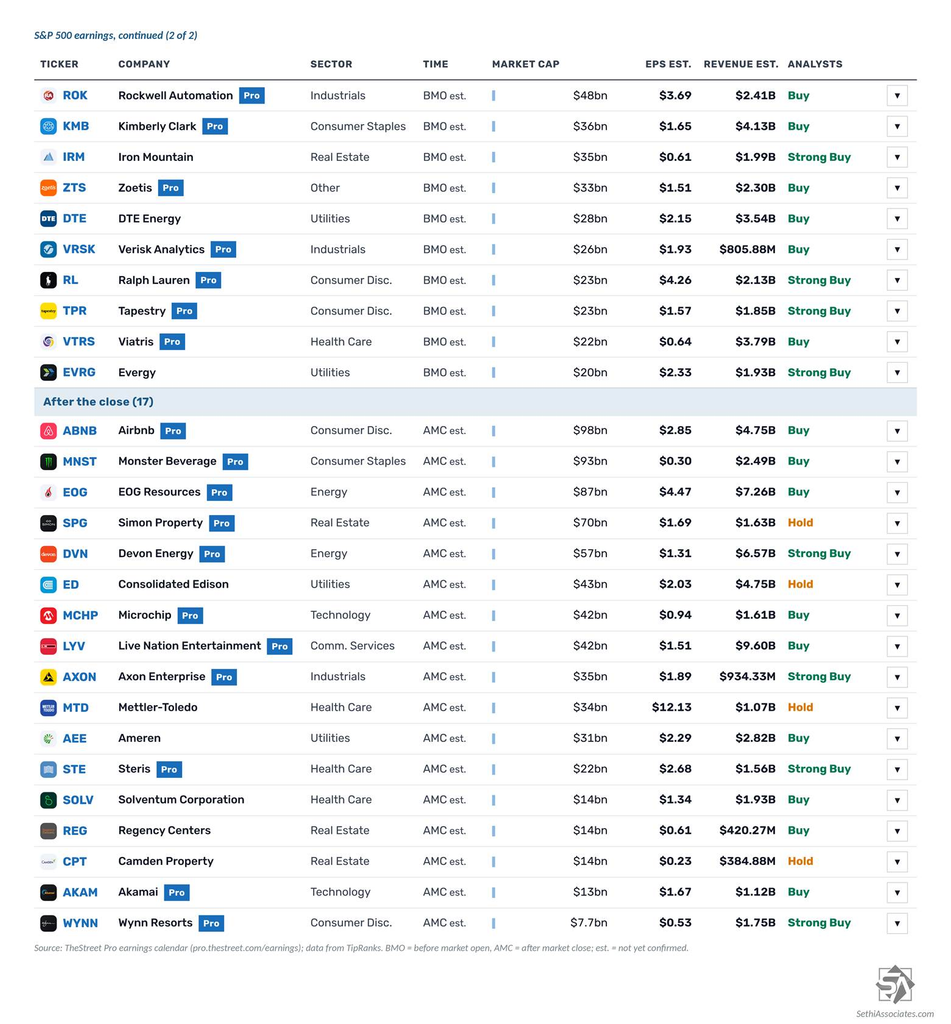
38 S&P 500 components report, three of them with market caps over $100bn:
Before the open: ConocoPhillips (COP), Parker Hannifin (PH), Southern Co. (SO), Duke Energy (DUK), Cigna (CI), Air Products (APD), Cummins (CMI), Targa Resources (TRGP), Cardinal Health (CAH), Sempra (SRE), Becton Dickinson (BDX), Rockwell Automation (ROK), Kimberly-Clark (KMB), Iron Mountain (IRM), Zoetis (ZTS), DTE Energy (DTE), Verisk Analytics (VRSK), Ralph Lauren (RL), Tapestry (TPR), Viatris (VTRS) and Evergy (EVRG)
After the close: Airbnb (ABNB), Monster Beverage (MNST), EOG Resources (EOG), Simon Property (SPG), Devon Energy (DVN), Consolidated Edison (ED), Microchip Technology (MCHP), Live Nation (LYV), Axon (AXON), Mettler-Toledo (MTD), Ameren (AEE), Steris (STE), Solventum (SOLV), Regency Centers (REG), Camden Property (CPT), Akamai (AKAM) and Wynn Resorts (WYNN)
Outside the S&P 500, Sony (SONY), National Grid (NGG) and ArcelorMittal (MT) report before the open, Cloudflare (NET) after the close, and Toyota (TM) at a time not yet announced.
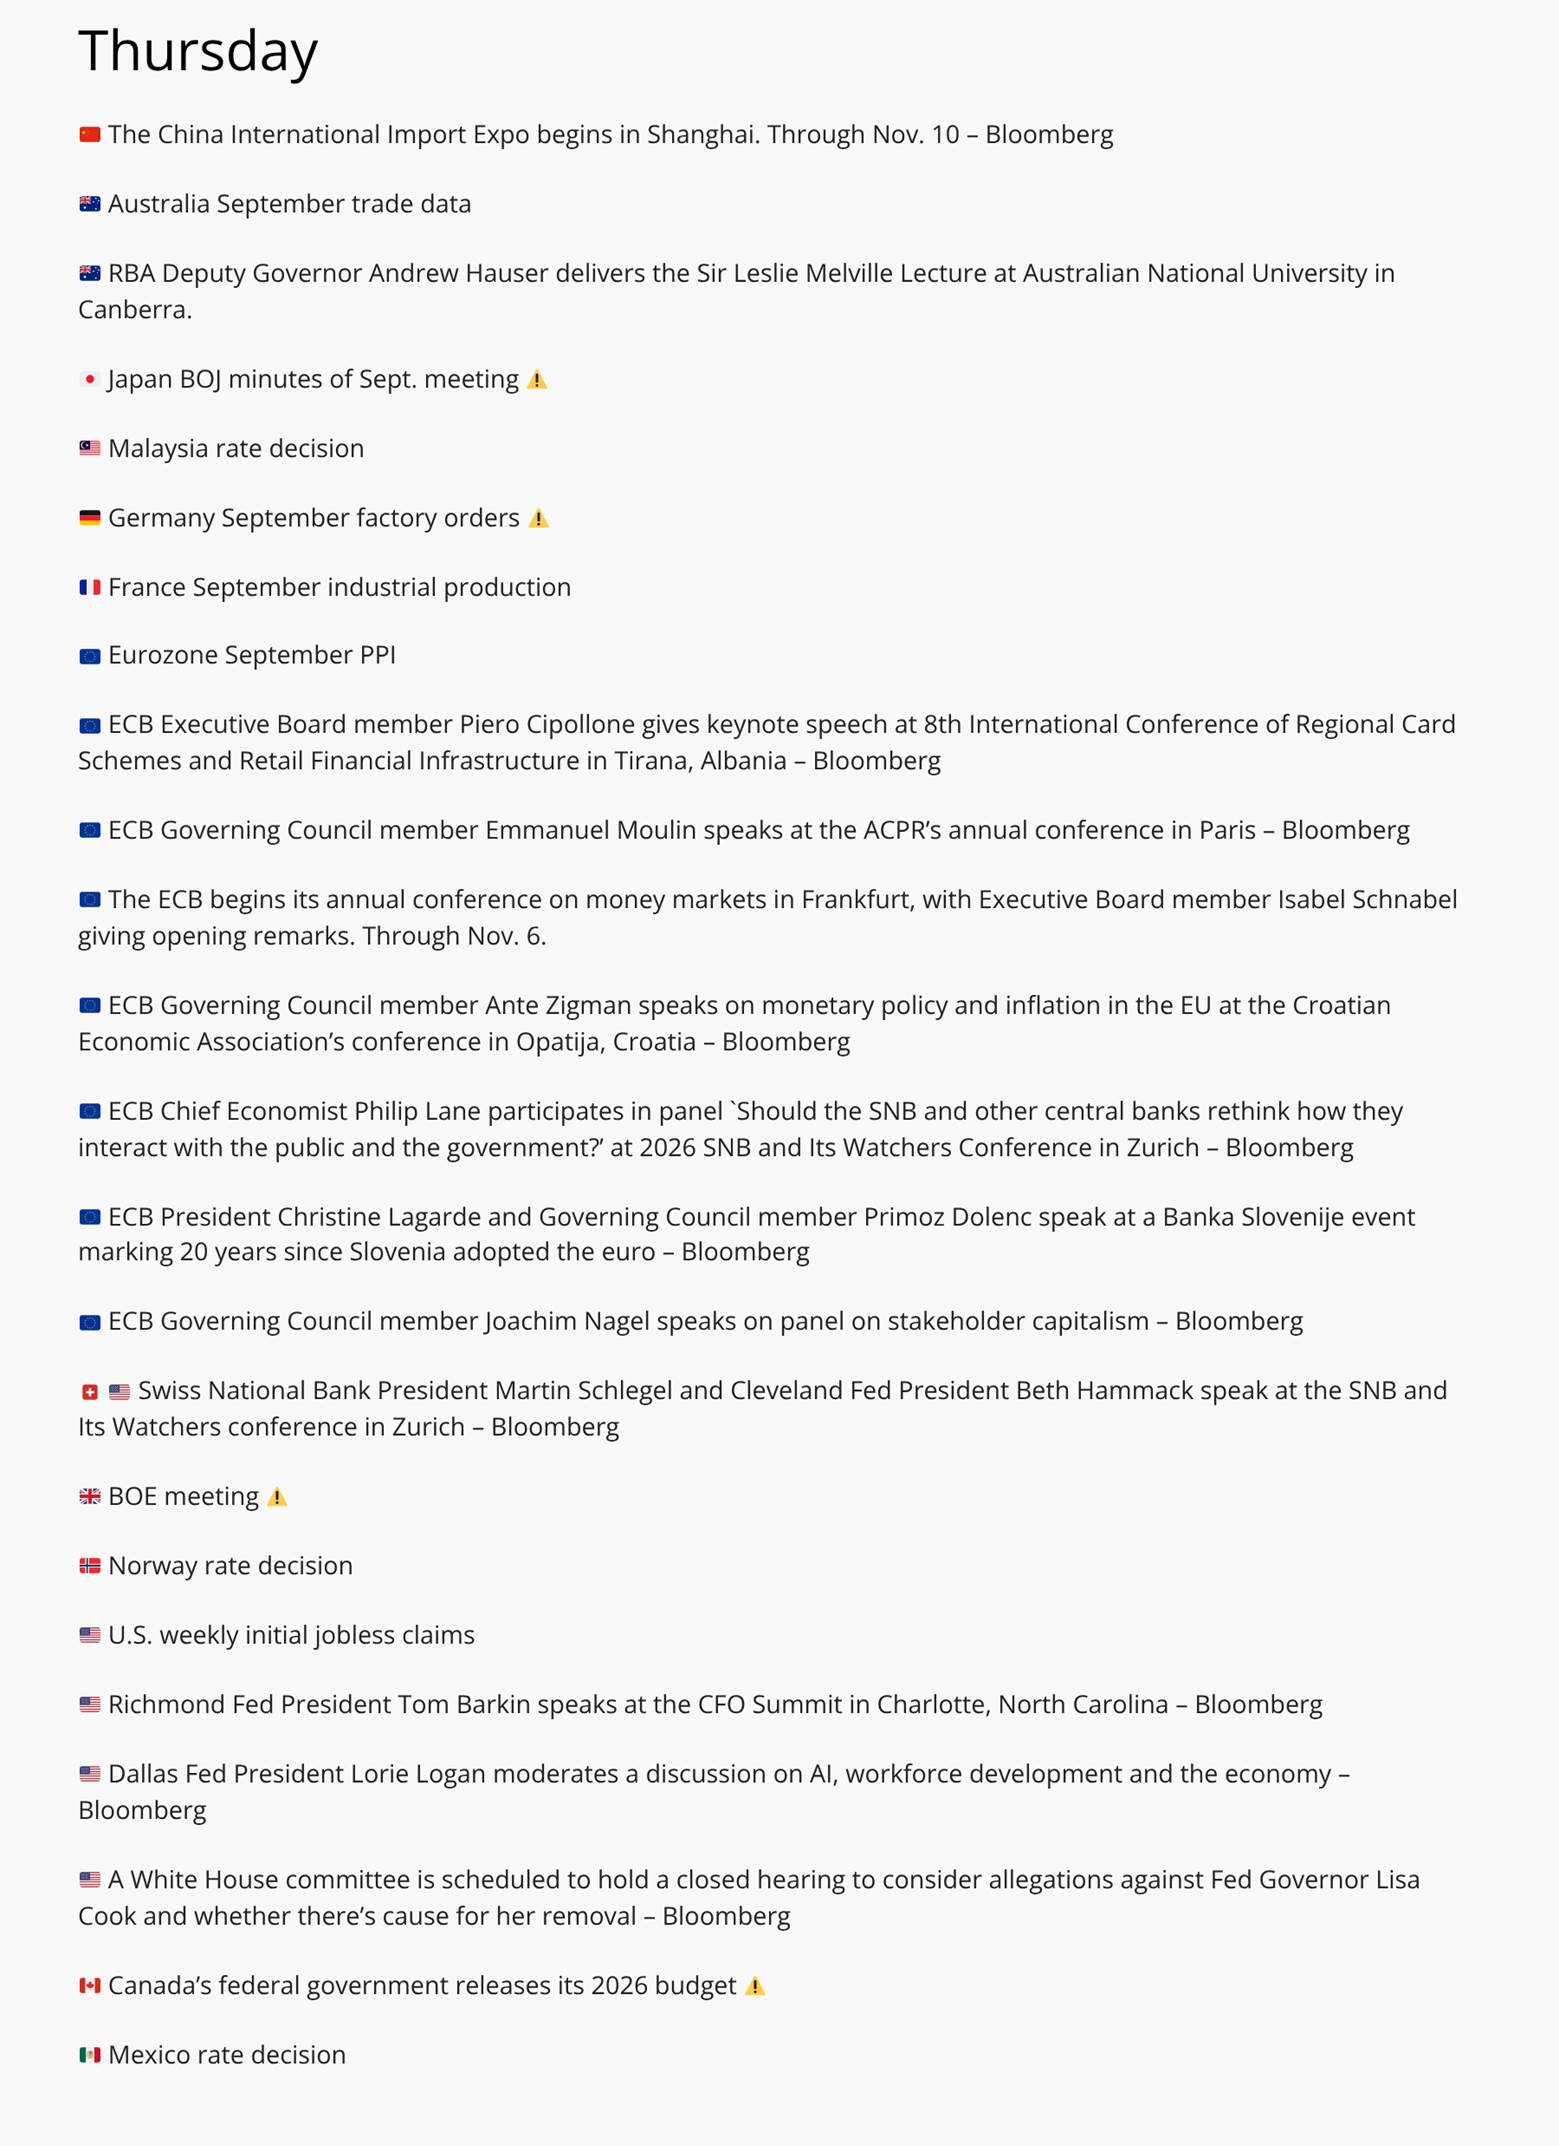
Ex-US highlights include UK October new car registrations and construction PMI, Japan September labor cash earnings, Germany September factory orders and October construction PMI, France September industrial production, Italy September retail sales, Eurozone September PPI and Sweden October CPI. Besides the BoE, Norges Bank, Malaysia and Mexico announce rate decisions, ECB President Lagarde speaks, the ECB opens its annual money markets conference, Canada releases its 2026 federal budget and the China International Import Expo begins in Shanghai.
From Christophe Barraud’s international Week Ahead rundown:
At the time of publication, in terms of securities mentioned, Sethi was long APP, AMZN, ANET, BKNG, DVN, ETN, GOOGL, LMT, MSFT, PLTR, QQQ, SPY, IWM, RSP, CPER and numerous Treasury ETFs, and short AMD and DDOG. APP and DDOG are new in the past 24 hours. NVDA was sold today.