Tech Selloff Deepens as Market Rotation Continues
Another selloff in AI names broadened to encompass most of Tech, sending the Nasdaq-100 to its worst week since April 2025. Five sectors though would finish the week up 2% or more, as 30-year Treasury yields fell the most since April 2025.
You've reached your free article limit
You've read 0 of 1 free Pro articles.

Quick Summary
- Another round of selling in Tech and AI-related names offset six positive sectors, pulling indices lower for the day and the week, the worst for the Nasdaq-100 since April 2025, as worries over the sustainability of the AI ecosystem continued to swirl. A rotation into Energy, Financials, and defensive sectors, along with lower yields left the Dow Jones Industrial Average higher for the week.
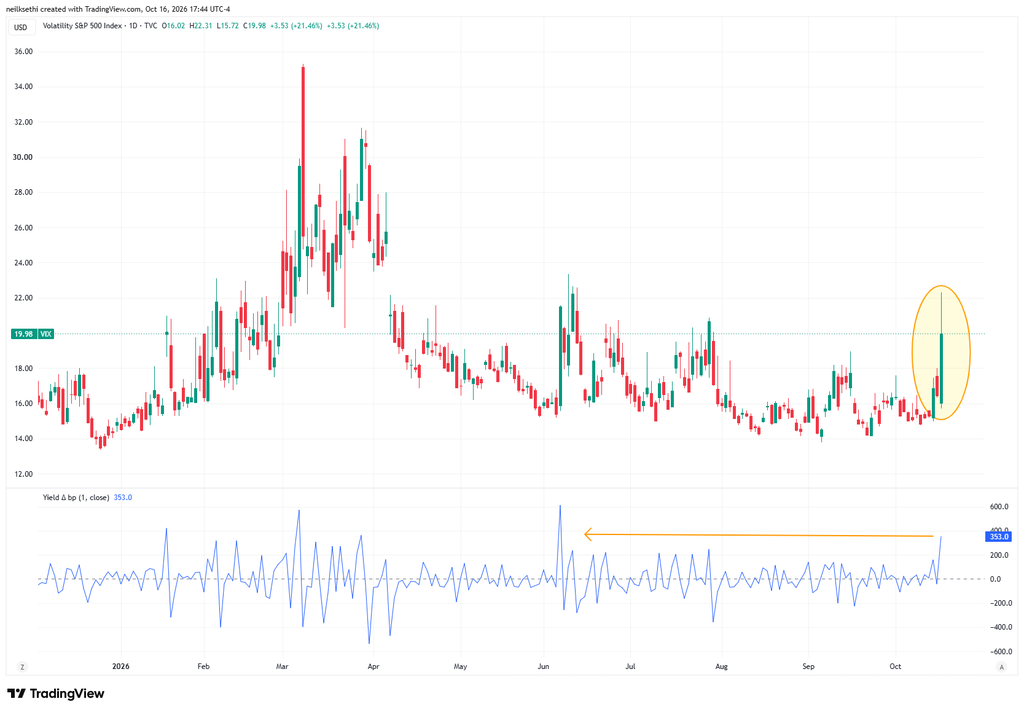
- Tech fell 2.5% Friday, damaging sentiment, and dragging all the major indices lower. The Nasdaq lost 2.1%, the Russell 2000 1.7%, the S&P 500 1.1% and the Dow Jones Industrial Average 0.3%. Both the S&P 500 and Nasdaq closed below their 50-day moving averages, and the VIX jumped above 20 for the first time since July.
- Breadth held up better than the indices would suggest though, with 6 of 11 sectors higher. Energy (+2.5%) went from worst to first, and Utilities and Staples each rose more than 1% capping the best week for the latter since February. But Tech and Communications each fell 2.5%, and Consumer Discretionary lost 1.2%.
- For the week:
- The Nasdaq fell 4.5% (worst since June), the Russell 2000 3.1% (worst since March) and the S&P 500 about 2% (worst since June), but the Dow Jones Industrial Average gained 0.7%.
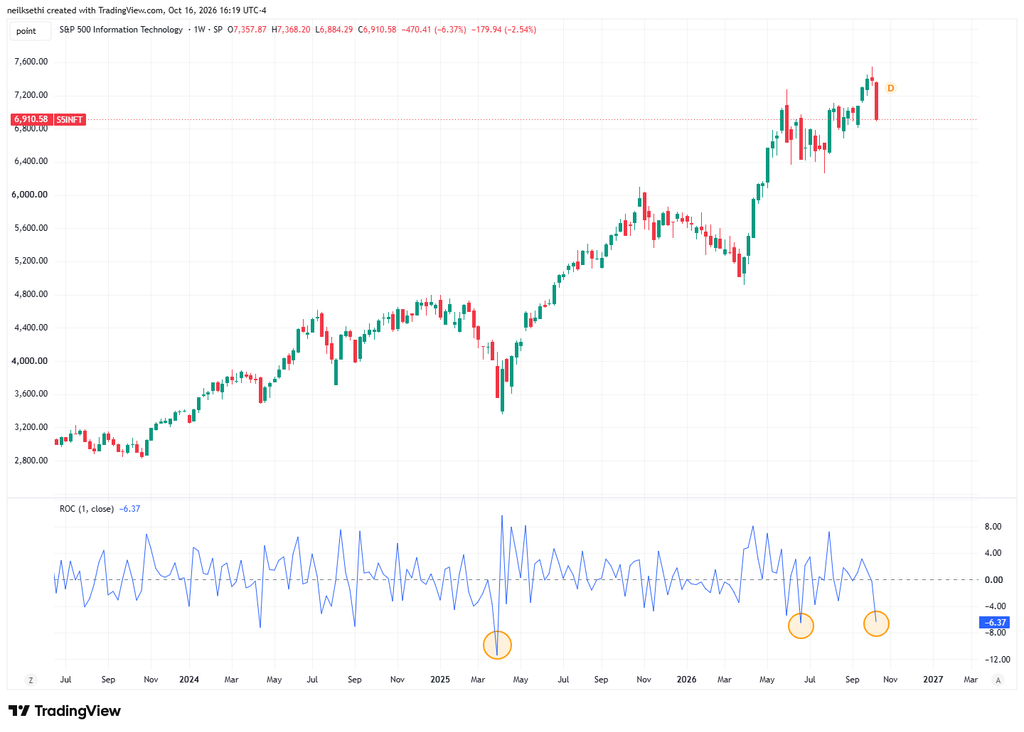
- Tech’s 6.4% drop was the most since May.
- Still seven sectors rose more than 1%, and Energy and Staples each gained 5% or more.
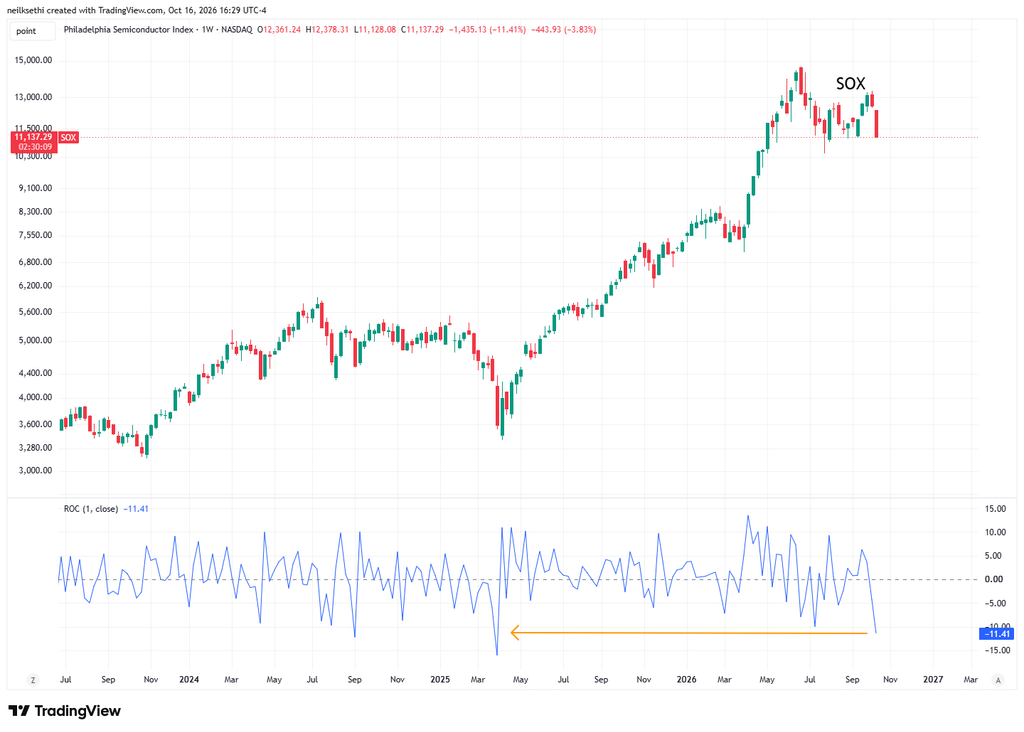
- The PHLX Semiconductor Index (SOX) sank 3.8% Friday, its eighth straight decline (the longest since 2008) and 11.4% for the week, the most since April 2025.
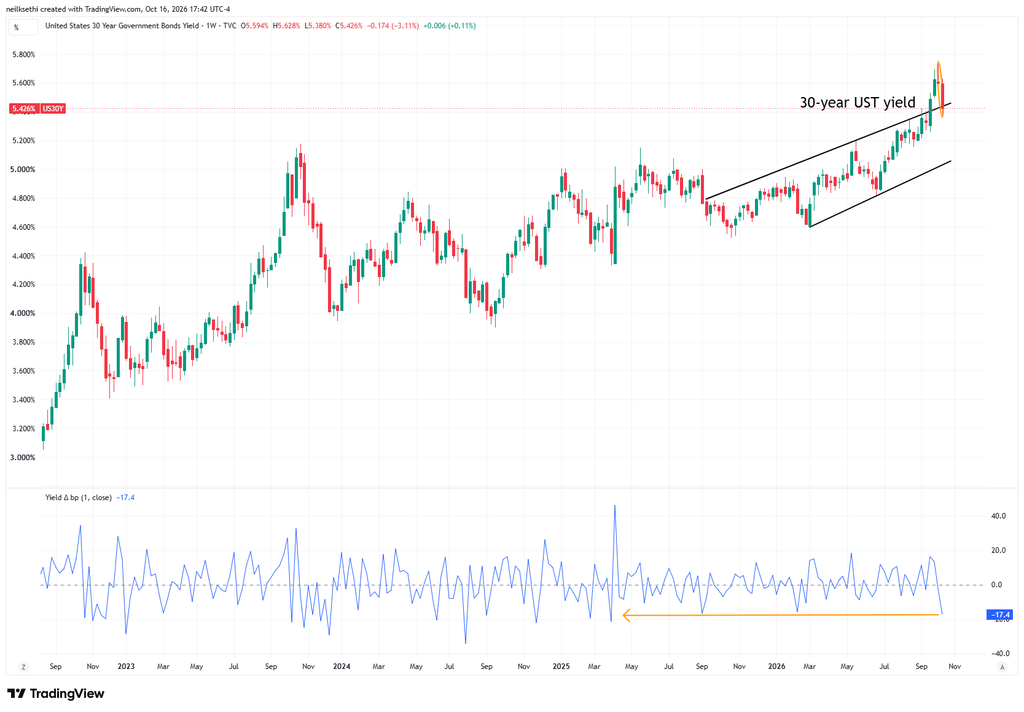
- Helping Energy, the November WTI contract rose 3.5% to settle above $101, its seventh straight gain and more than 10% on the week. 2-year Treasury yields dropped after Fed Chair Warsh avoided guidance overnight seeing October rate hike expectations fall back. Longer maturity Treasury yields were slightly higher Friday, but the 10-year fell 16bp for the week according to TradingView, its biggest weekly drop since July 2025, and the 30-year fell 17bp, its largest weekly decline since April 2025.
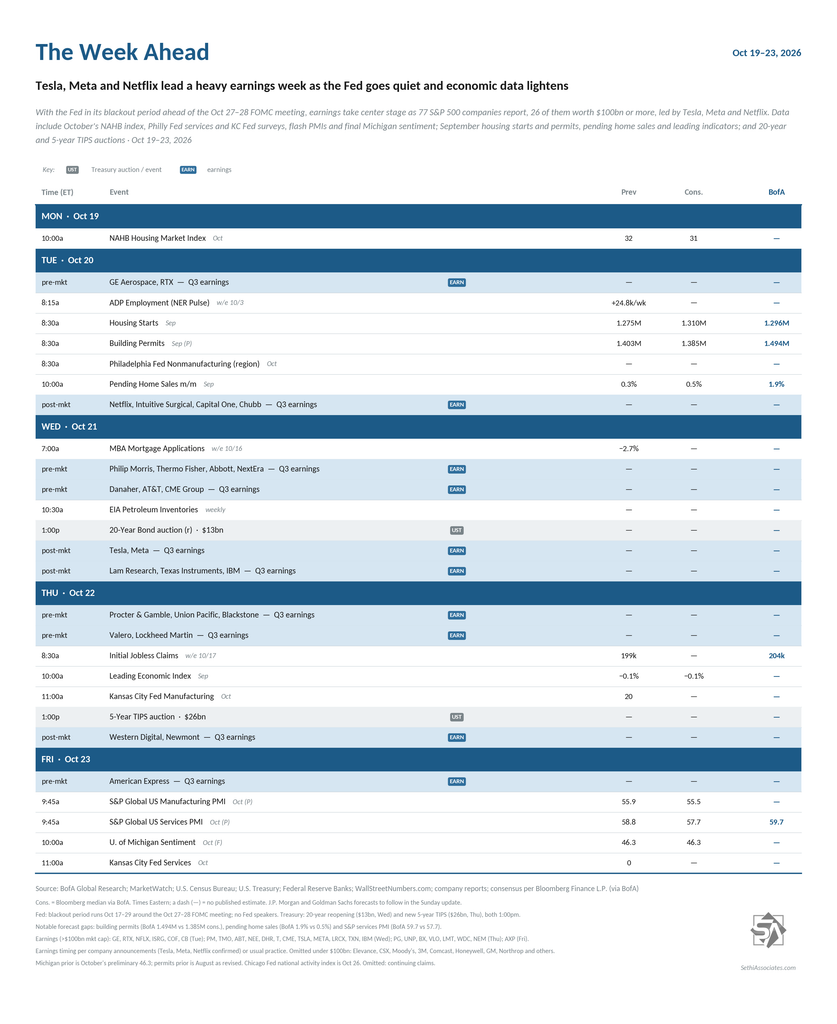
- Next week is lighter for economic data and the Fed will be in its pre-meeting blackout period, but earnings will pick up a notch.
Market Commentary
Equities:
- “As we have highlighted previously, we think the AI thematic is entering a more mature phase, where valuations, funding requirements, competitive threats, regulation, and revenue visibility are coming under much greater scrutiny,” a team at Barclays led by Emmanuel Cau, head of European equity strategy, wrote. “It is certainly conceivable that the best of the AI thematic trade may be behind us, and therefore we think investors should be far more selective.”
- “One of the real challenges we’ve had in AI and technology overall for the last six to 12 months is that so much of what’s happening is happening in private markets,” Jeff Richards, managing partner at Notable Capital, told CNBC’s “Closing Bell” on Thursday. He noted that AI-linked companies like Anthropic and OpenAI, among others, going public could help assuage investor concerns. “Once we get more of the information out there – analyst coverage, detailed information on core metrics – into the market over the course of ’27, I think a lot of those fears will ease,” he said.
- Artificial intelligence has become a “risky trade,” according to a Piper Sandler strategist, who recommends more exposure to quality stocks. “We’ve had a boom in some areas, we’ve had a little bit of a bust some more, and some areas of the market continue to hold on,” Michael Kantrowitz, head of portfolio strategy at the Minneapolis-headquartered investment bank, said of AI stocks in a presentation.
- “The economy remains in expansion, but households and leveraged companies are feeling the pressure,” said Florian Ielpo, head of macro at Lombard Odier Investment Managers. “That supports a constructive view on government bonds, alongside a more selective approach to equities.” “For AI, the crucial question is whether investment can generate attractive returns at today’s financing costs,” Ielpo continued. “Oil remains a key variable, given its effects on both inflation and household purchasing power.”
- “The question is: Is this a systemic issue?” said Michael Rosen, Angeles’ chief investment officer. “Obviously, increased debt issuance is something to observe and continue to watch and be concerned about if it continues to get to levels of excessiveness. But we’re not remotely close to that right now.”
- “This week’s price action suggests the market debate is beginning to shift,” said Fawad Razaqzada at StoneX Trading and Forex.com. “The question is no longer simply how large the AI opportunity can become, but how profitable the enormous investment required to realize it will ultimately be.” “That creates a difficult combination for the AI trade,” he added. “Higher interest rates reduce the present value of future cash flows, while simultaneously increasing the cost of financing the infrastructure needed to support the next phase of AI growth.”
Bonds:
- “Bonds can hedge equity risk again. It is truly wild to see yields fall in a week where the key data surprised to the upside. The AI trade is now so important to the economy and markets that fears of a meaningful downturn can outweigh the inflationary supply shock and restore the haven bid for bonds.” — Skylar Montgomery Koning, Bloomberg macro strategist
- “Financial conditions are tightening, long-term borrowing costs face upward pressure, and investors are increasingly demanding additional compensation to hold longer-maturity bonds,” said Darrell Cronk, president of Wells Fargo Investment Institute and chief investment officer of Wealth & Investment Management. “Currently, we do not believe we have reached the peak in interest rates for this cycle, so caution is warranted.”
Stock and Sector Breakdown:
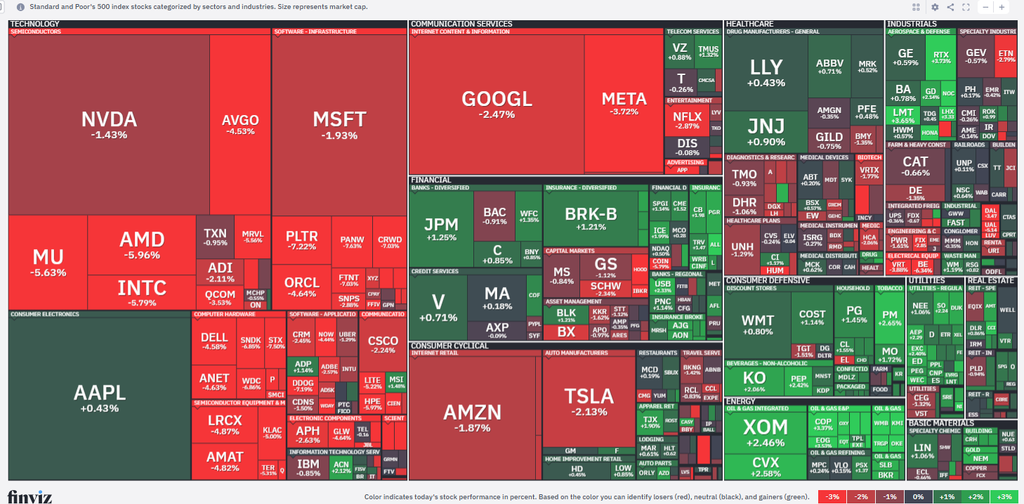
Despite the index decline SPX sector breadth was not bad with 6 of 11 sectors higher led by Energy +2.5% bouncing from worst to first. Utilities and Staples were also up over 1%. As we saw Wednesday though those smaller sectors couldn’t escape the gravitational pull of Tech ending -2.5% along with Communications and a 1.2% loss in Consumer Discretionary.
[chart uses futures prices]
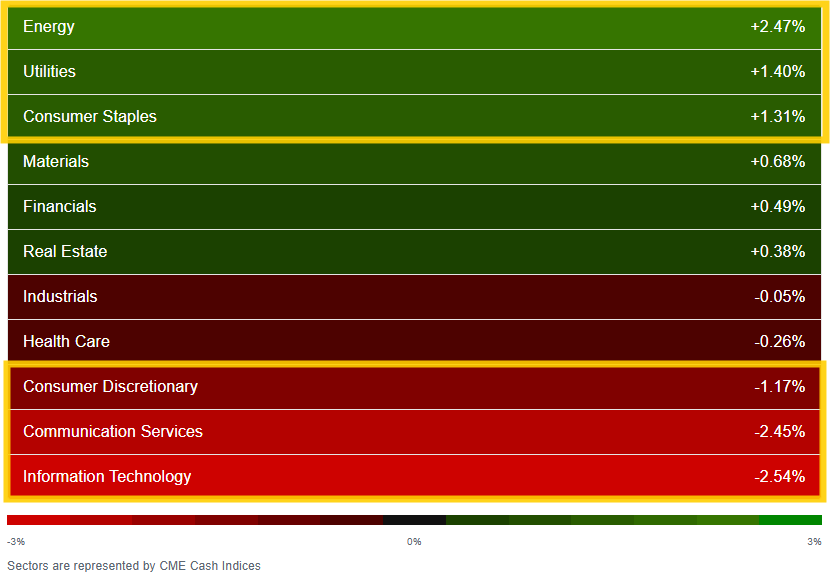
That capped the worst week for Tech -6.4% since May and almost the worst since April 2025. As with Wednesday Consumer Discretionary and Communications (in reverse order) followed but losing over 1%. That more than offset seven sectors closing up over 1%, five 2% or more, three over 3% and two five percent or more (Staples — its best week since February — and Energy).
Tech pressure continued to come from AI beneficiaries with Philadelphia Semiconductor Index (SOX) dropping for an eighth straight session for the first time since October 2008, leaving it down 11.4% for the week, its worst since liberation day.
Micron (MU) -5.6%, Advanced Micro Devices (AMD) -6.0%, and Sandisk (SNDK) -6.9% were just a few of the dozens of casualties.
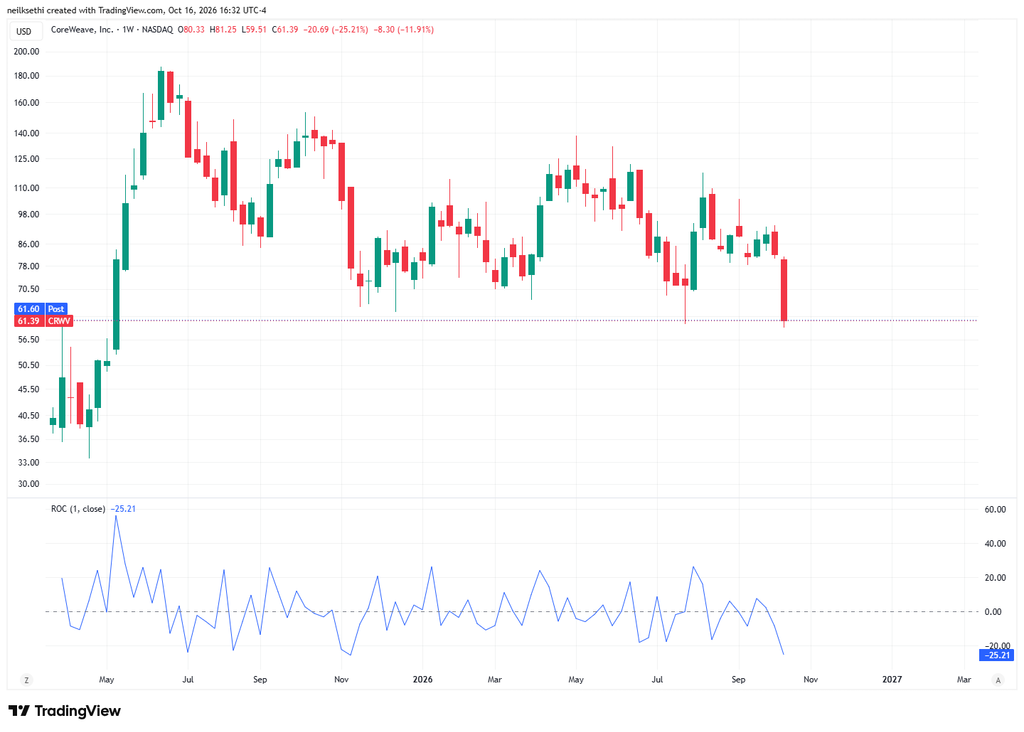
CoreWeave (CRWV) remained in the headlines shedding another 11.9% and taking its weekly loss to 25.2% just shy of its record weekly loss of 25.6% in November. Such dramatic moves are not unusual for the stock. Since its public debut in March 2025 this is the 16th time it’s moved at least 20% in a week.
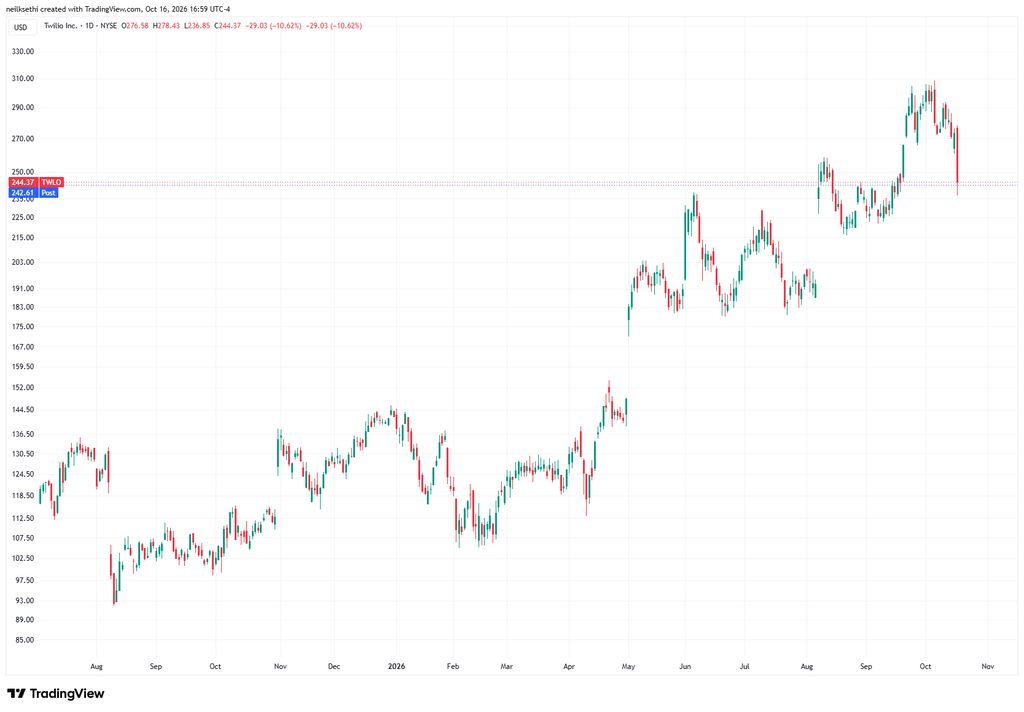
But it was a software company, Twilio (TWLO) -10.6% which would lead all S&P 500 components to the downside Friday, its worst session since August 2025, on no particular news. Twilio though had risen nearly 90% this year as of the close of trading Thursday.
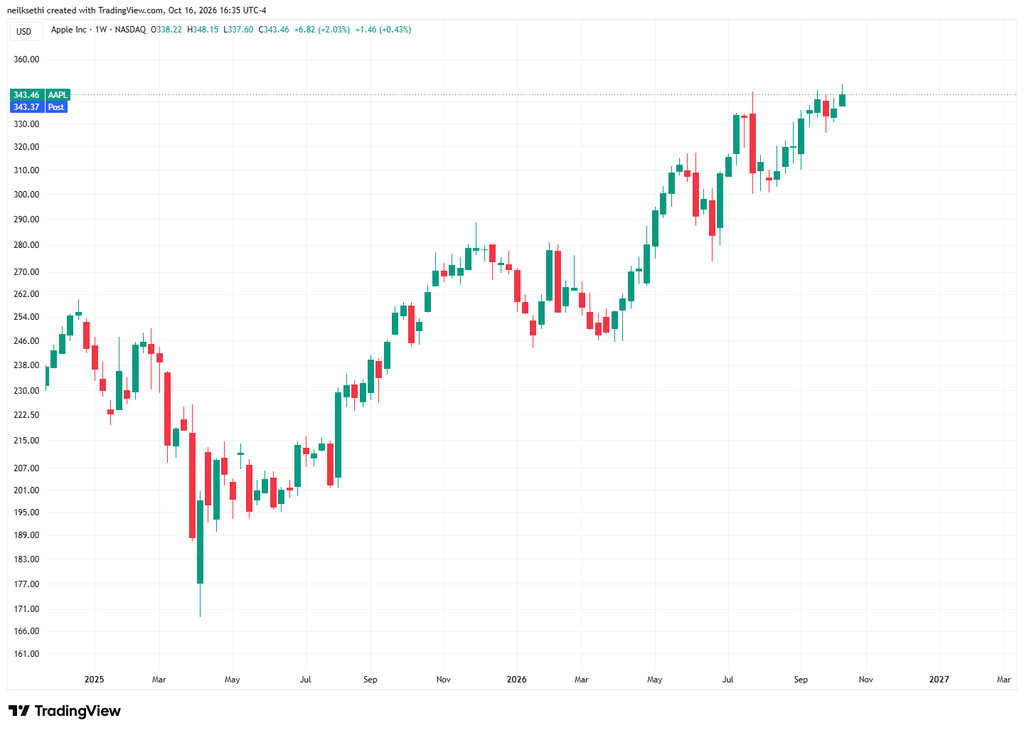
Apple (AAPL) +0.43% though continued to be a bright spot, closing up 2% for the week at a record weekly close after reports that pre-orders for its $1,999 iPhone Duo sold out within minutes. If you missed it from Chris Versace today: We’re Lifting Our Apple Price Target as Duo Immediately Sells Out.
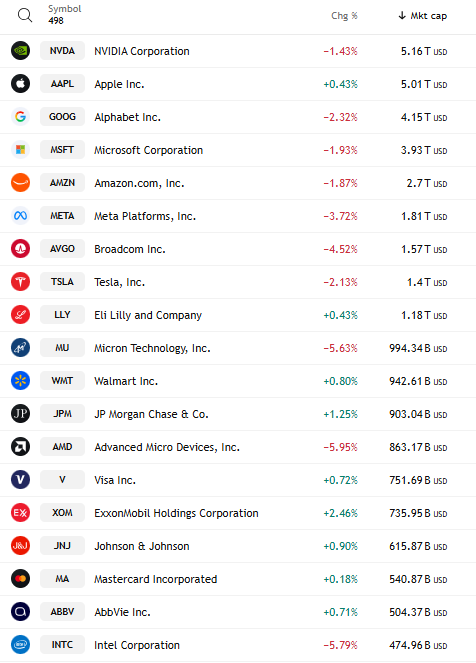
In fact Apple was the only green Tech stock in the top 20 largest SPX components Friday. But every non-Tech stock in the top-10 was higher.
Targa Resources (TRGP) +4.4% was the top performer on the S&P 500 lifted by the jump in the energy sector. It was followed by fellow components Diamondback Energy (FANG) +4.3%, Kinder Morgan (KMI) +4.2%, and APA Corporation (APA) +4.1%.
While breadth was not bad, the number of large SPX winners (up over 3%) fell sharply to just 15 from ~120 Thursday, which was the most we’d seen since the start of August from 20 Wednesday, 13 Tuesday, 10 Monday.
The number of large losers (down over 3%) jumped to ~60 from 18 but still below the ~85 Wednesday.
As mentioned previously, both of these metrics have been very (extremely?) subdued since the start of August, rarely getting above 50 and only once above 100 twice.
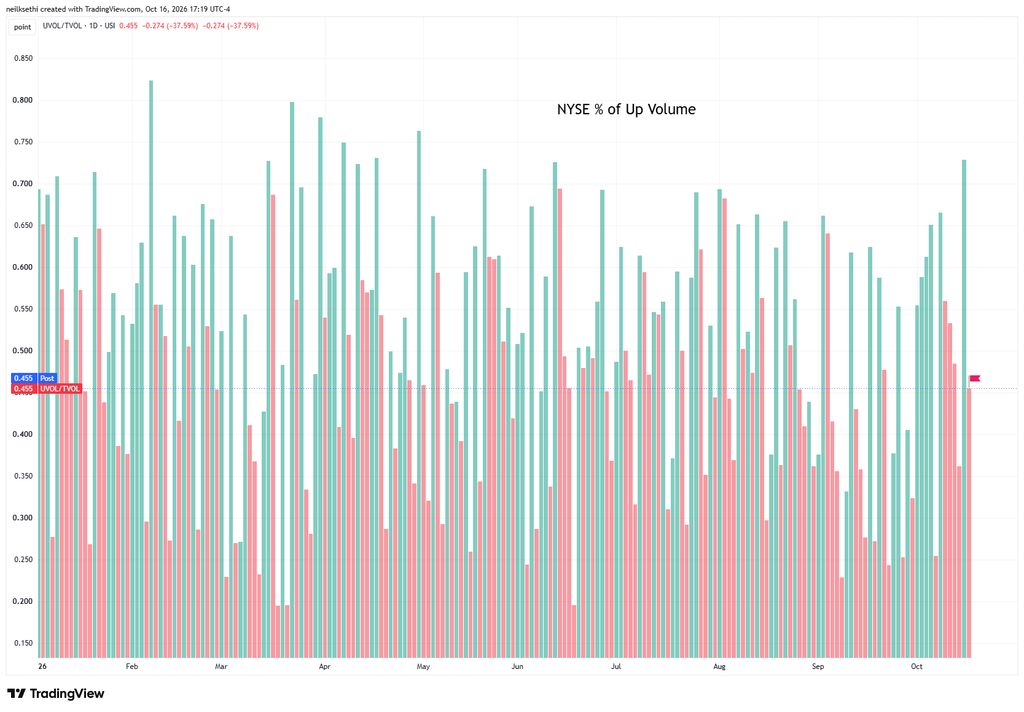
Positive volume (intensity in buying stocks up on the session) though was disappointing on the NYSE at just 45.5%. I was hoping for a strong reading after the great reading we saw Thursday.
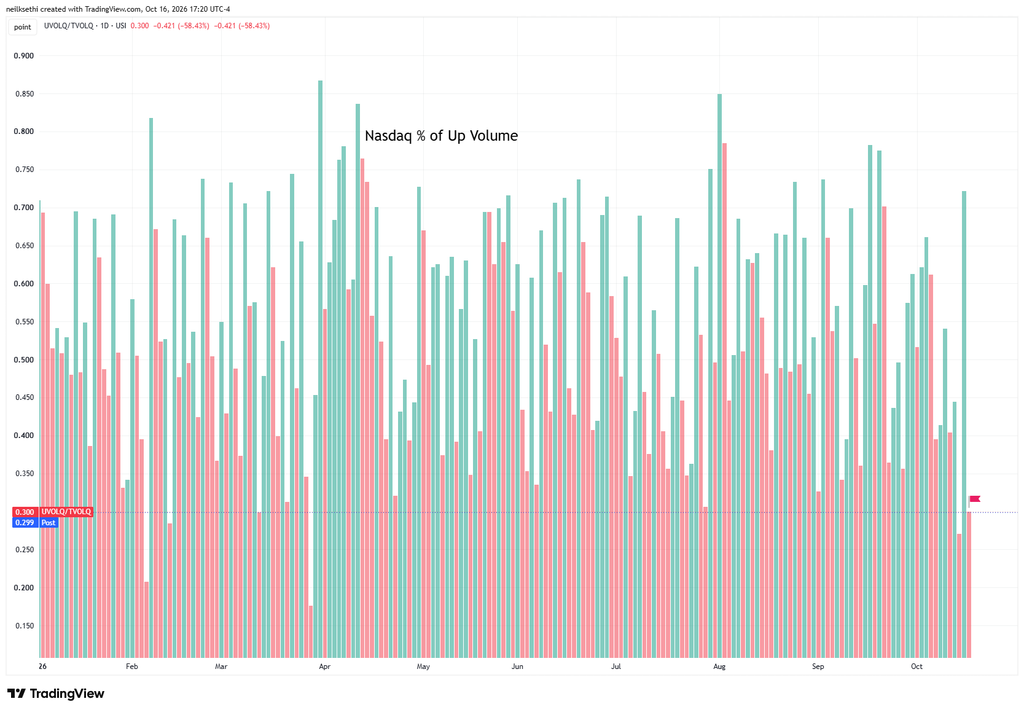
Similar story on the Nasdaq at 30.0%, although I guess it is at least better than the 26.3% Wednesday even though the loss was greater Friday (2.15% vs 1.88%).
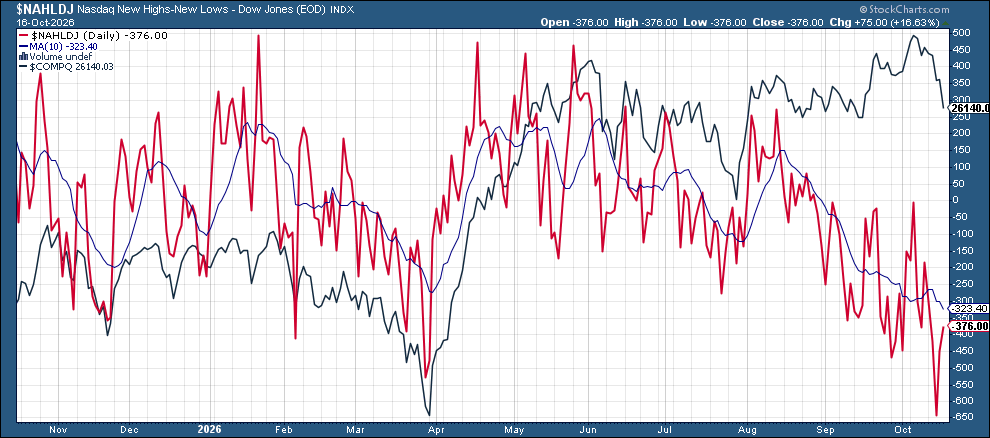
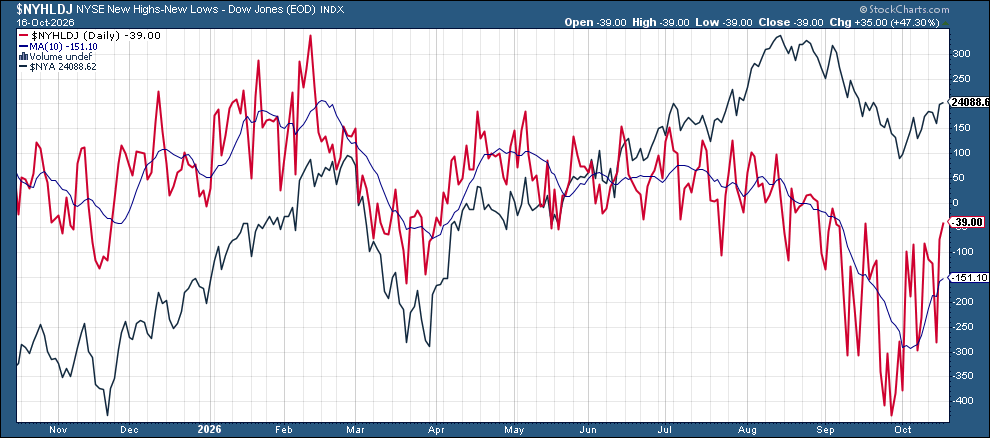
But where we did see a positive divergence was in new 52-week highs minus lows which improved to -378 from -457 on the Nasdaq despite the big selloff. That’s the sort of thing to watch for. And NYSE improved to -39 from -74.
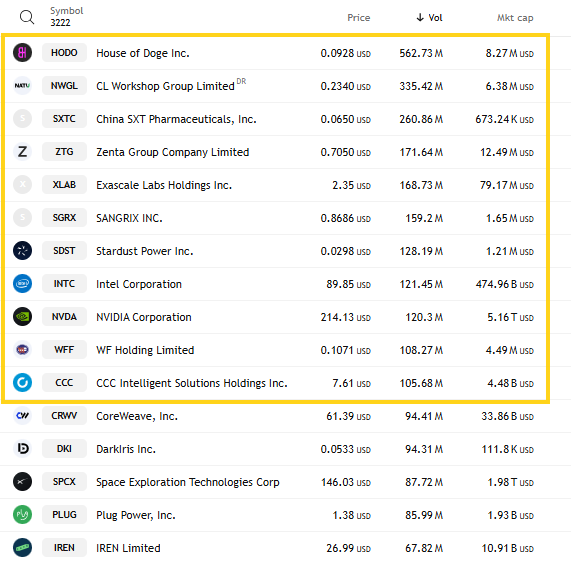
And the selloff didn’t dent speculation in the Nasdaq much. While the top stock had much less volume than Thursday at 562 million shares traded for penny stock House of Doge (HODO) vs 1.6 billion for Stardust Power (SDST) Thursday (which fell to 128 million Friday) there were again 10 other stocks trading over 100 million shares (seven of them sub-$3).
Some other stock-specific commentary from TheStreet Pro:
- Chris Versace – Questionable Management Change Prompts Our Exit From This Position
- Stephen Guilfoyle –
- Ed Ponsi – We Bought the Dow’s Worst Stock. Now It’s Up 21%.
- Bret Jensen – I’m Taking Out Some ‘Insurance’ on My Portfolio With These 2 Stocks
A Look At The Charts
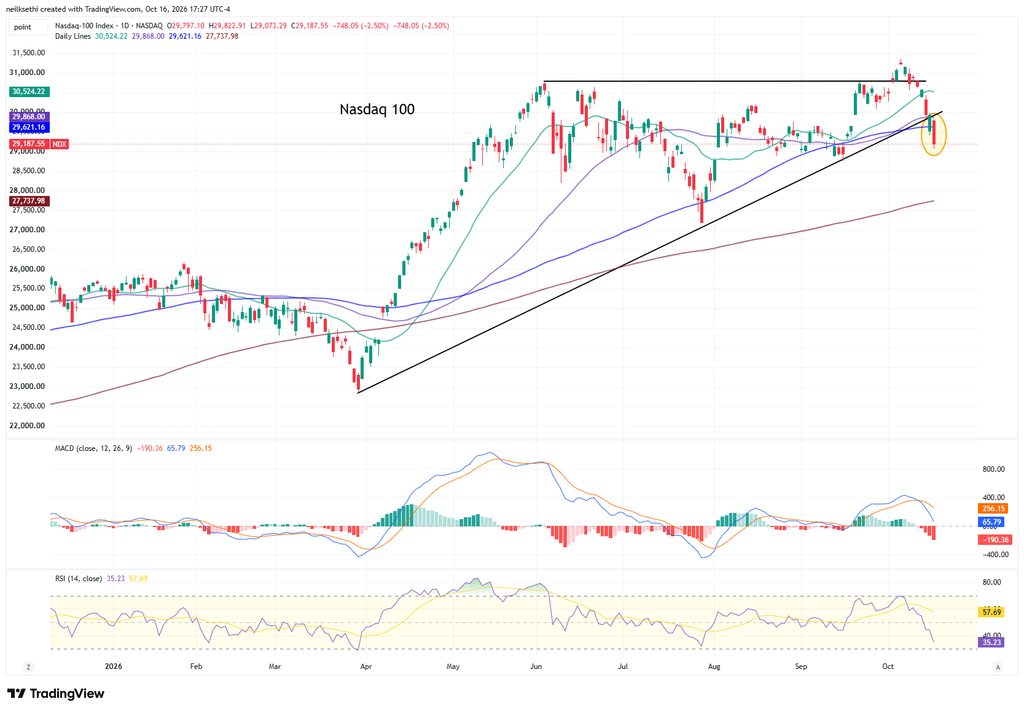
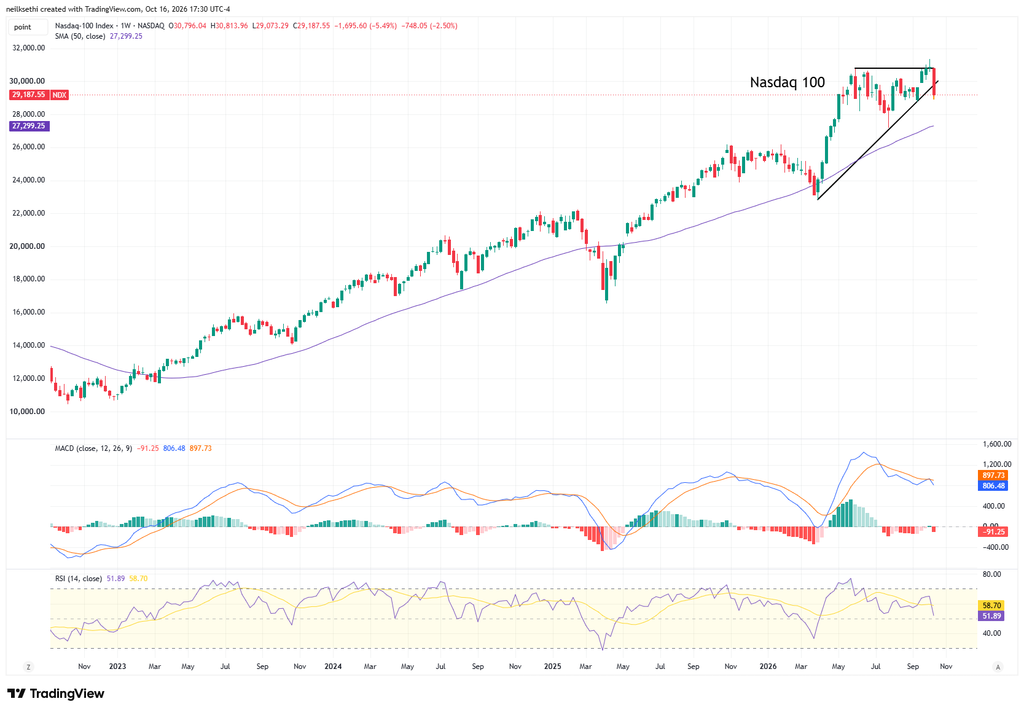
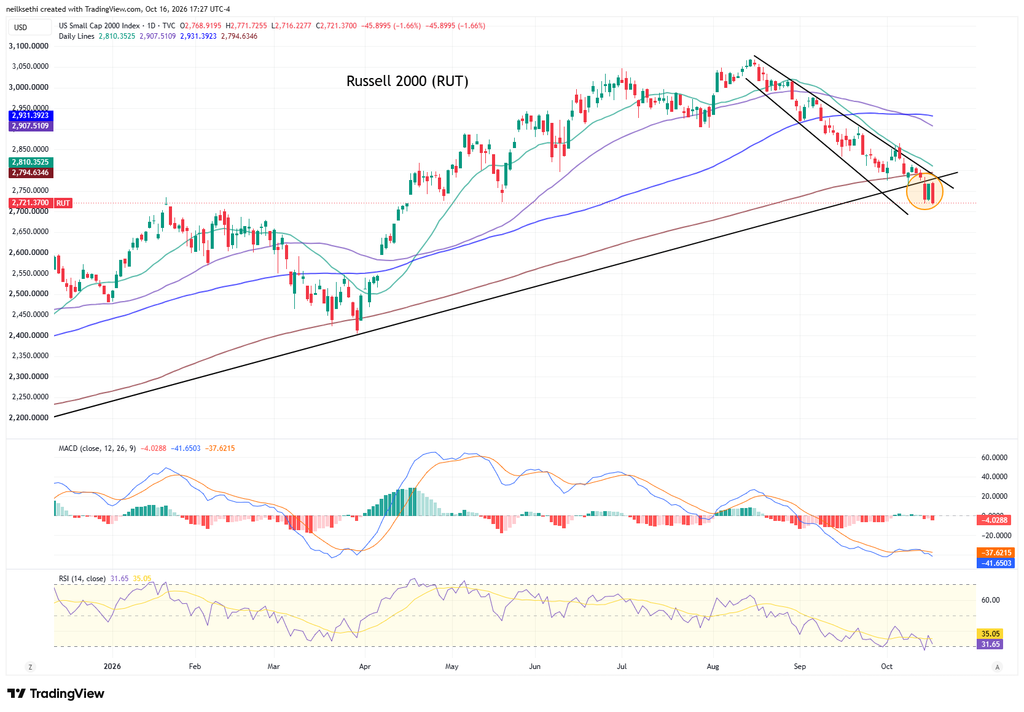
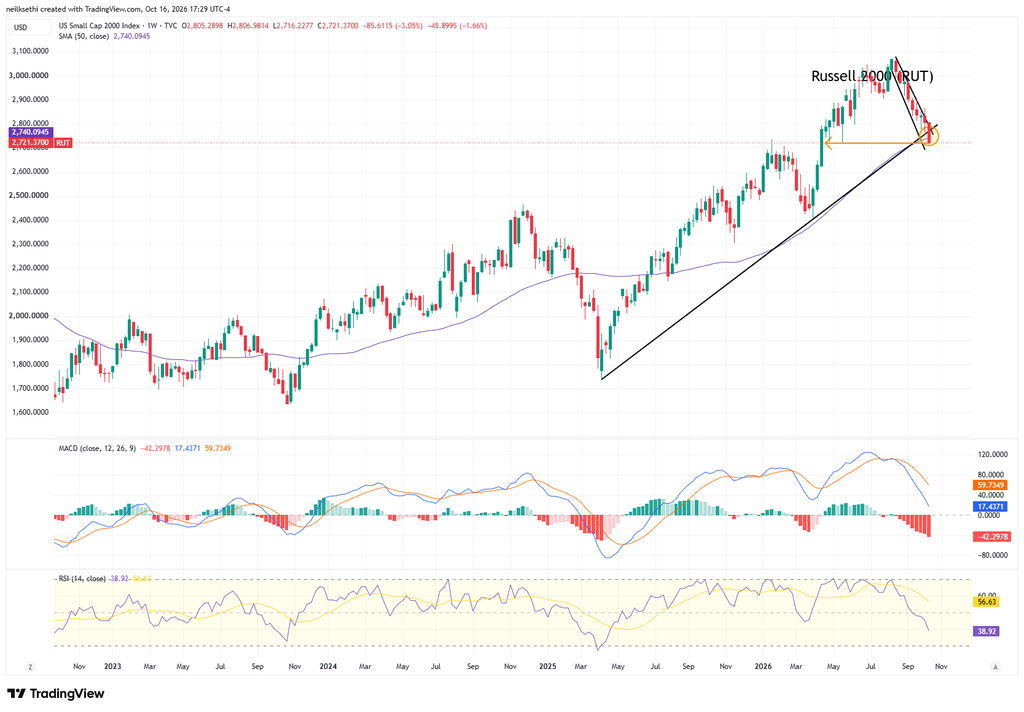
Note on all charts the colored lines are moving averages (the average price over the lookback period — days on the daily charts, weeks on the weekly charts):
20 = green
50 = purple
100 = blue
200 = brownException is monthly charts where blue is 10-month moving average and brown is 20-month moving average.
MACD = Moving average convergence/divergence line, a measure of momentum that compares longer term and shorter term momentum to gauge if a move is strengthening or weakening. This is probably my favorite individual indicator.
RSI = Relative Strength Index (basically what it sounds like) = measures the strength of the move comparing gains to losses over the given lookback window (I use the standard 14 periods).
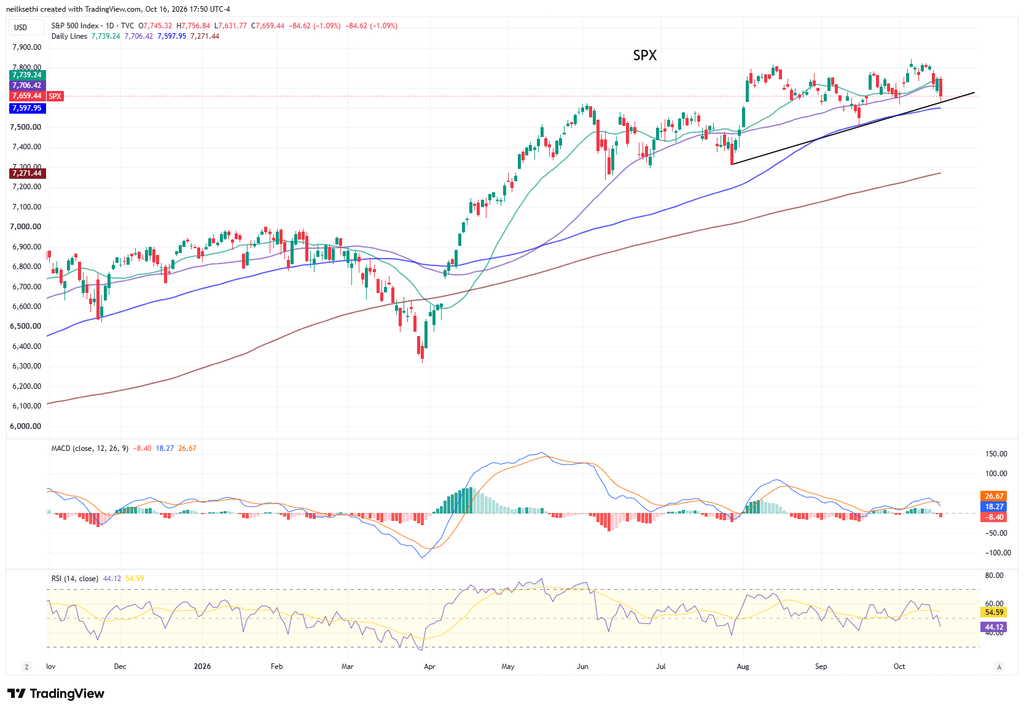
SPX fell back below its 50-DMA to its uptrend line from July almost to its 100-DMA. That held the September decline. The daily MACD and RSI have slipped negative.
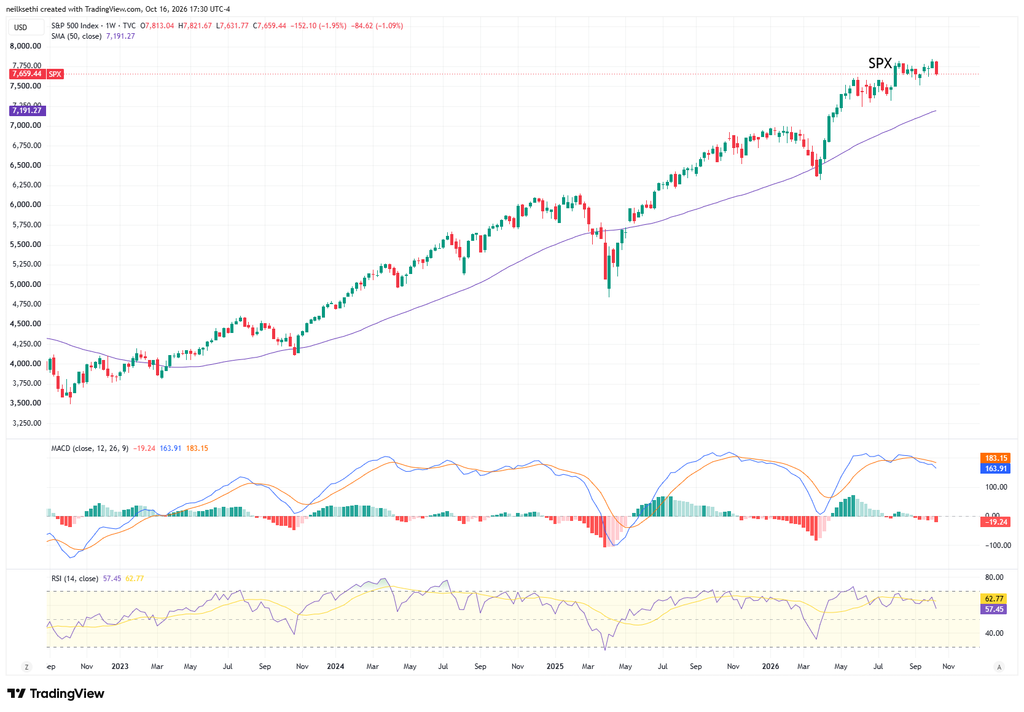
Weekly chart not great.
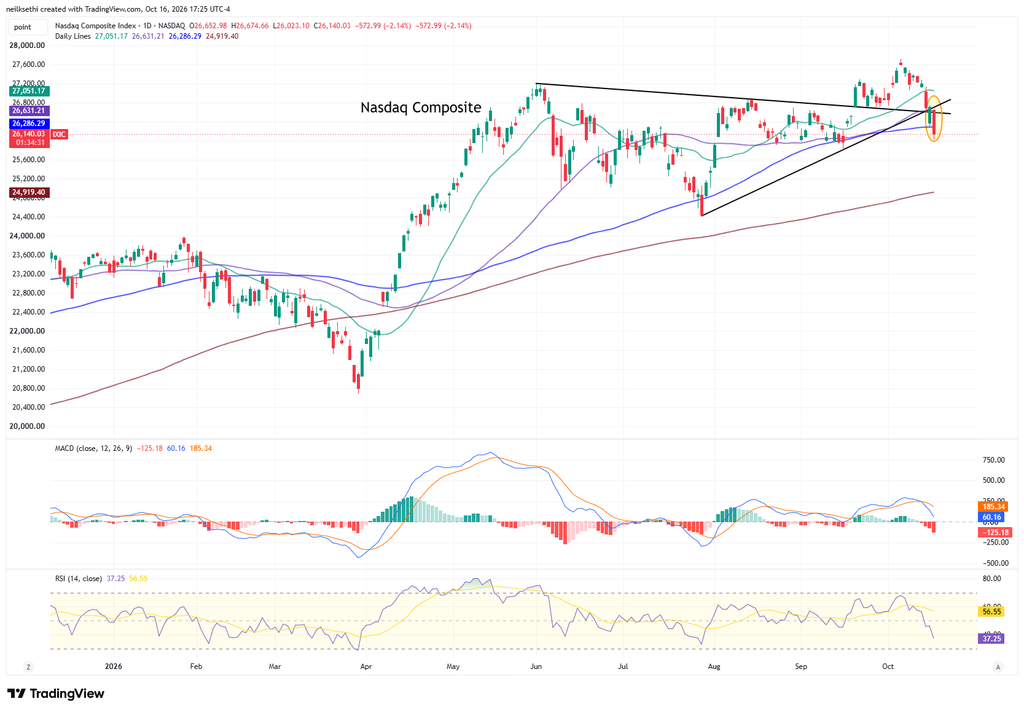
Nasdaq Composite though fell through its 100-DMA. As I noted Tuesday, it has a MACD sell signal and the RSI has fallen under 50 and both are now materially worse. It also broke through the trendline from the August low.
And the Nasdaq-100 (QQQ) similar to the Nasdaq. I sold all of my QQQ position when it rebroke the 100-DMA.
Weekly chart no reason to buy here.
The Russell 2000 (RUT) fell to a 6-month low. The MACD remains “go short” and the RSI has fallen back towards 30.
Weekly chart not any better.
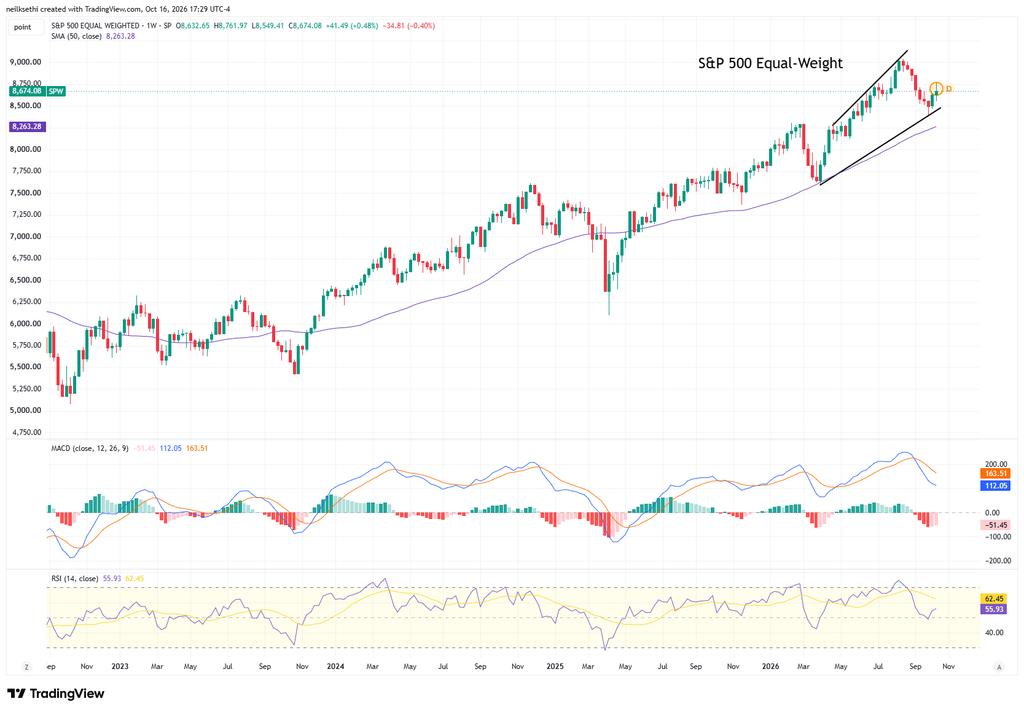
The equal-weighted SPX which I have noted has been “able to hold up better” made it through the 50-DMA but fell back under. Still it is the only one with a positive MACD, and the RSI is over 50.
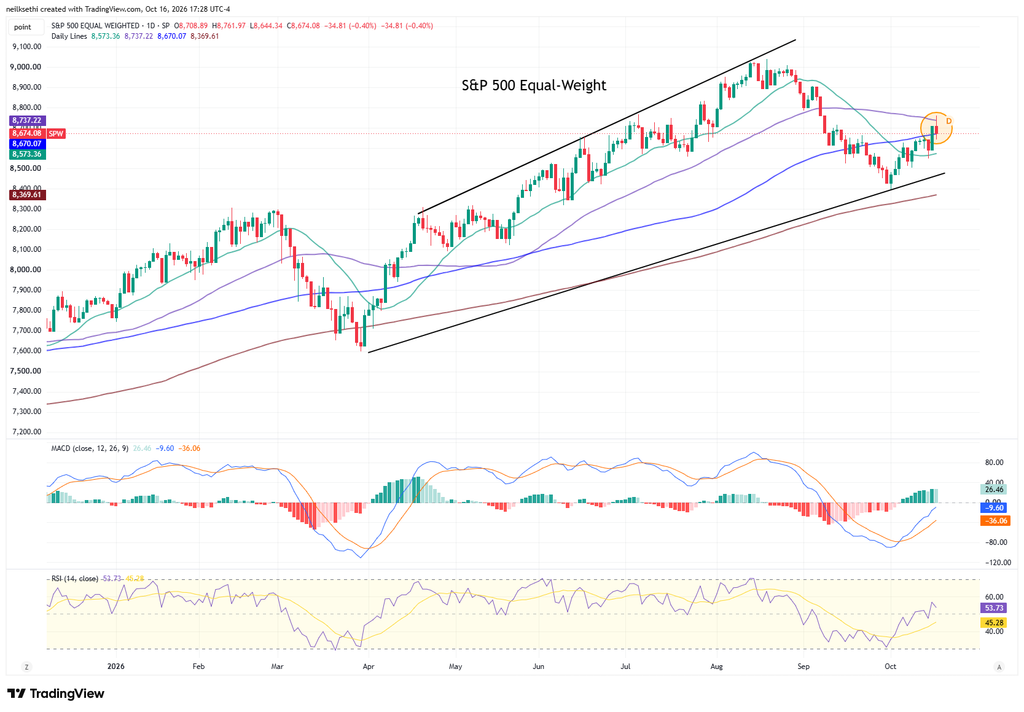
Weekly chart remains less favorable but not terrible.
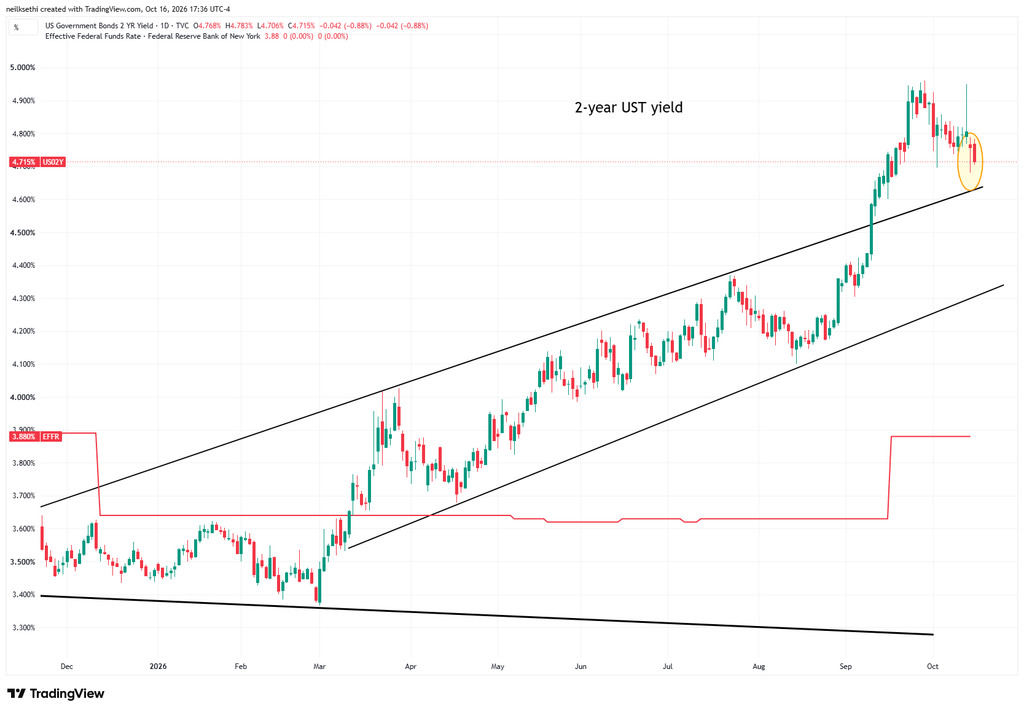
Treasury yields “twisted” with the front end falling after Chair Warsh’s speech in Thailand while longer maturities edged higher.
The 2-year Treasury fell four basis points (including the after-hours) to the lowest close in a month after Fed Chair Warsh declined to give any guidance as to Fed policy, cementing market expectations for an October hold (more below).
It is ~79 basis points above the Effective Fed Funds rate, so still calling for one or two rate hikes, but not much more than that (it historically has traded 25-50 basis points above the Fed Funds midpoint).
Here is more on Warsh and Fed rate hike bets:
Consistent with last night’s update, Chair Warsh provided little direction on monetary policy during his fireside chat with IMF Managing Director Kristalina Georgieva this morning (Bangkok time) which crystalized expectations for a hold at the FOMC meeting at the end of the month.
“We made very clear that we would deliver price stability, and we removed a dose of accommodation about a month ago,” Warsh said. “I don’t prejudge meetings. I don’t believe in saying now what I might do at the meetings that we have in the balance of this year.”
The chance of an October hike fell in half to ~13% [ending Friday at 17%] from ~30% before he spoke with a hike by December though holding at near 90%. 2027 expectations were little changed with another 53 basis points of hikes expected in 2027 assuming one more hike this year.
I don’t believe the Fed has ever hiked when probabilities for a hike were that low (13% [or 17%]).

10-year yields were a touch higher but rounding to zero leaving the rate at 5.08% (including after-hours), after the largest drop since August 2025 Thursday.
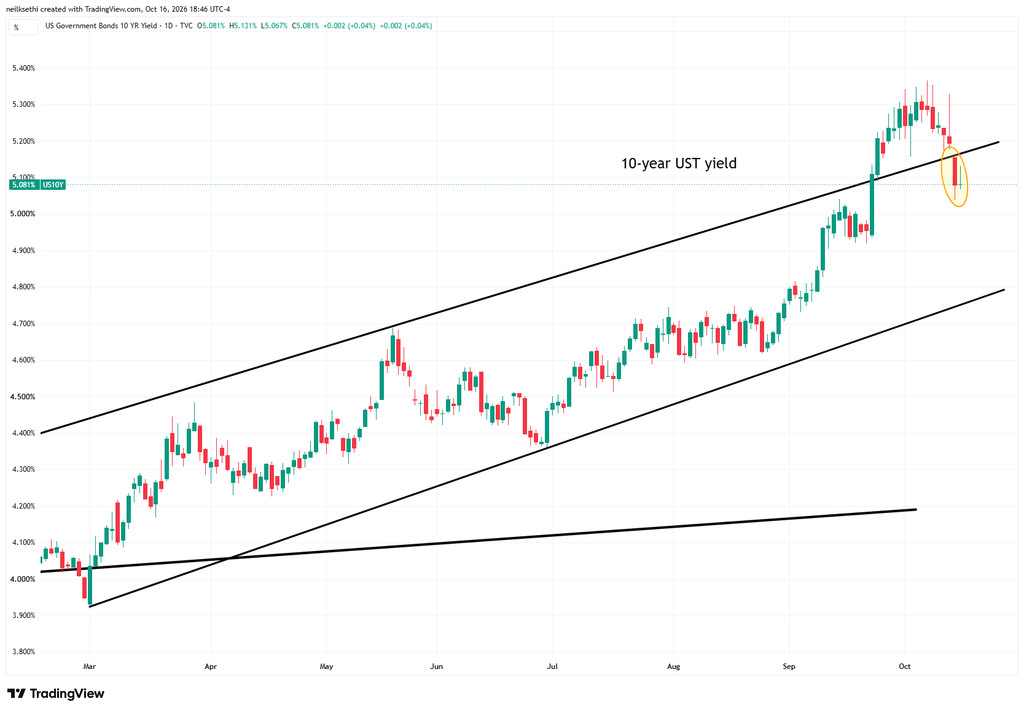
For the week they were down 16 basis points, the most since July 2025.
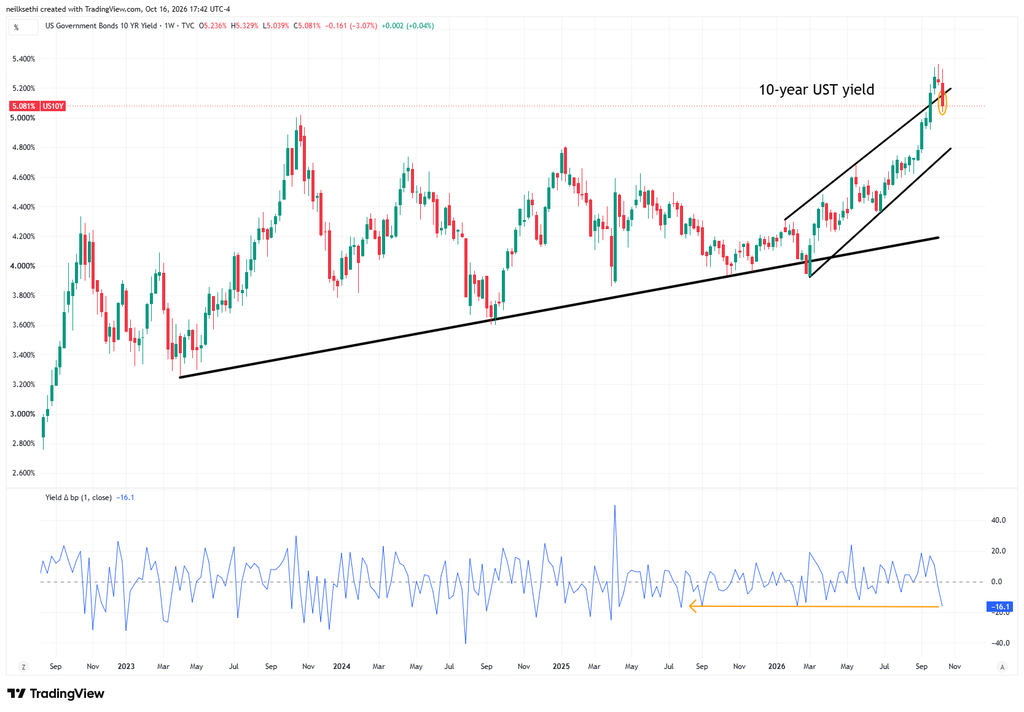
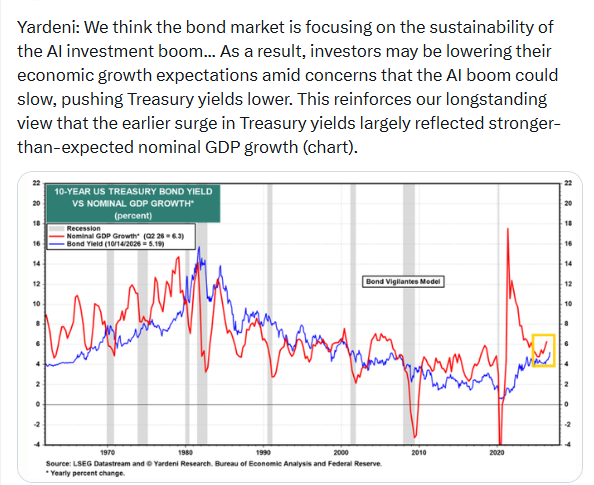
And I had flagged this week the possibility of the questionnaire to dealers from the dealer meeting agenda for the November refunding which was released at noon today to provide a hint at reduced long-end supply, but the result disappointed traders. From Bloomberg:
Market participants had anticipated that Treasury Secretary Scott Bessent might request views on reducing long-term debt supply, or even float ending sales of 20-year bonds. Instead, the department asked more generally about what future changes to auction sizes should be considered, in light of “structural changes in investor demand and expectations for how demand may evolve over the intermediate term.”
“If Treasury was hoping to use this as a signal or wanted it to have an impact on yields, they could have asked it much more directly – hence, I don’t think there is really any signal here,” said Blake Gwinn, head of US rates strategy at RBC Capital Markets. “This is probably a net disappointment given that some are looking for big changes, such as ending 20-year issuance.”
30-year yields edged higher for the first time in a week rounding to 1 basis point taking the yield to 5.43% (including after-hours). That came though after the largest drop since November 2024 Thursday which saw them end 17 basis points lower on the week, the most since liberation day.
VIX jumped over 20 before closing just below it, the biggest move since June and the highest close since July. That level is consistent with ~1.26% average daily moves in the SPX over the next 30 days.
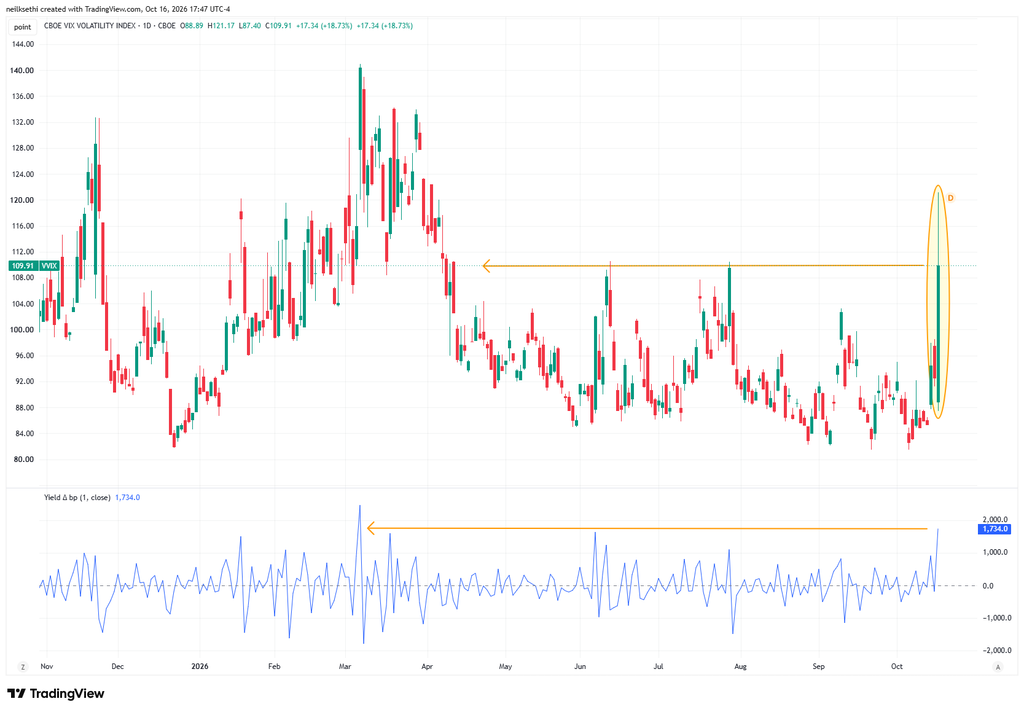
The VVIX (VIX of the VIX) also jumped, but in its case the move to 109.9 was the largest since March and took it to the highest since then as well. The current level is consistent with “elevated” daily moves in the VIX over the next 30 days (historically, normal is 80-100, although we haven’t been below 80 since July 2024). Above 100 is the level flagged by Charlie McElligott as indicating higher stress.
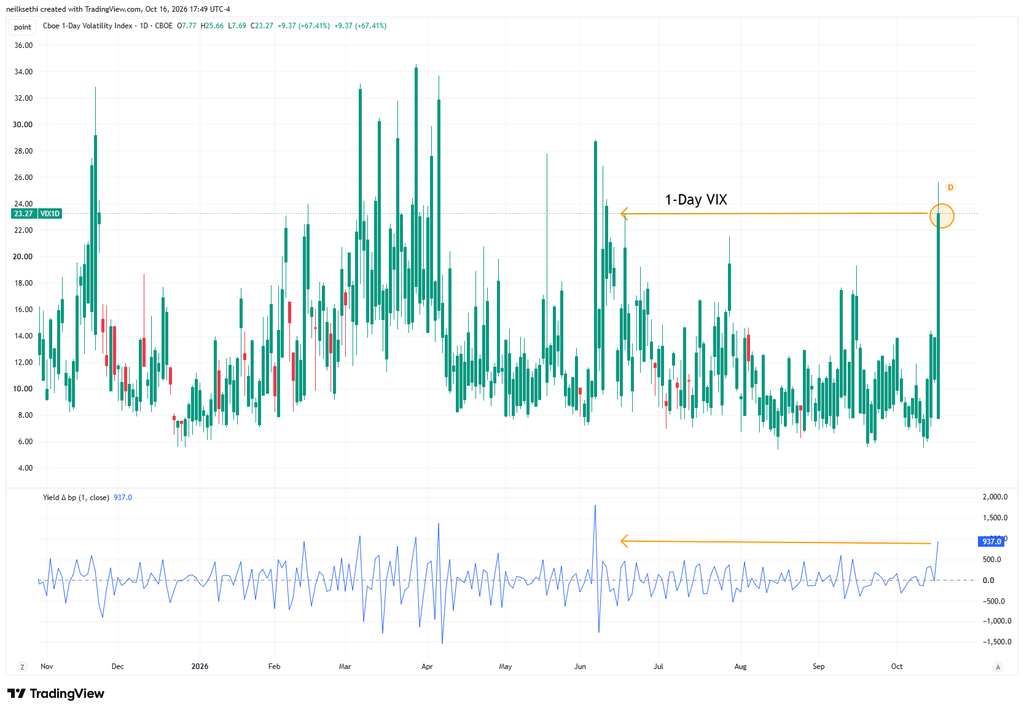
1-day VIX jumped to 23.3, the largest move since June and highest close since then as well. It’s one of the highest closes of the year. The current reading is consistent with a move of nearly 1.5% in the SPX next session.
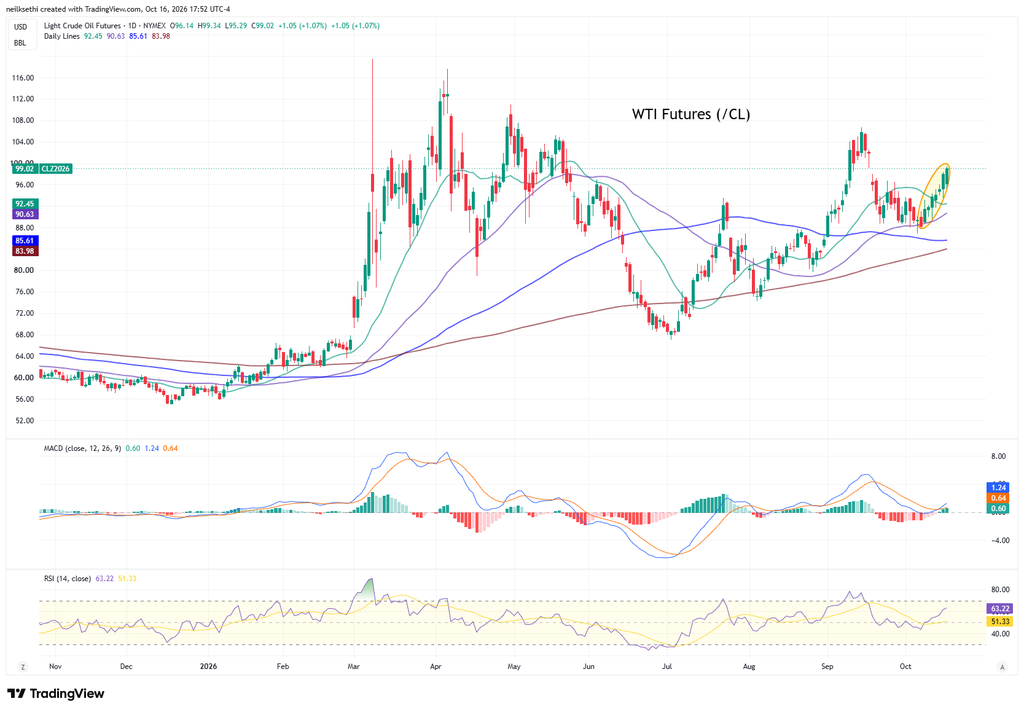
WTI futures (/CL) up for a seventh session to the highest close in a month (including after-hours).
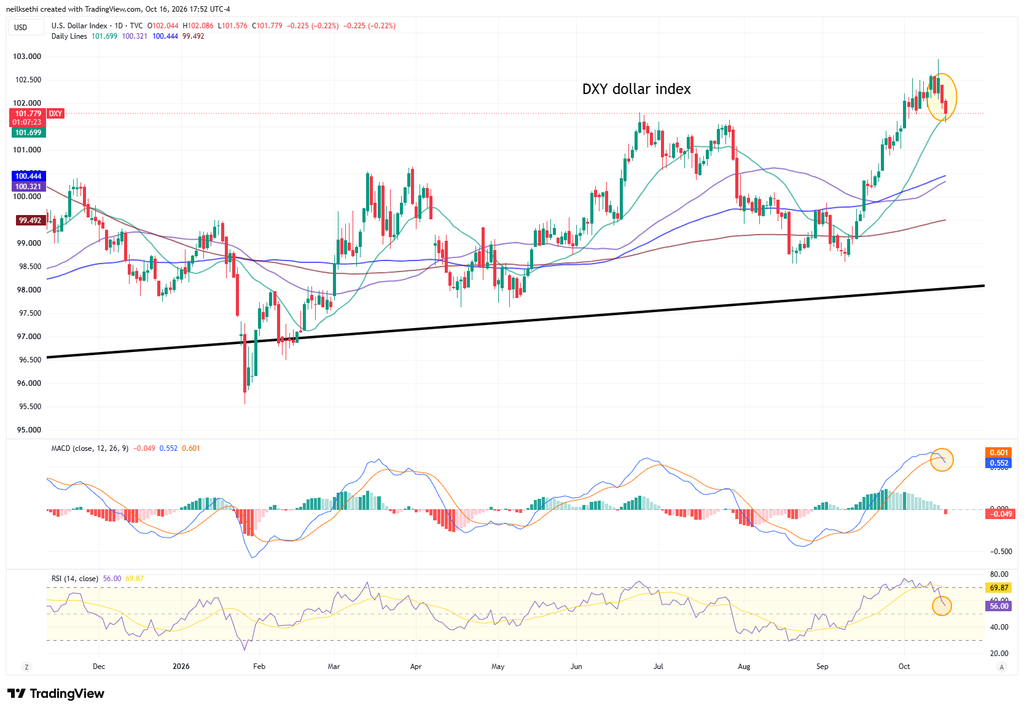
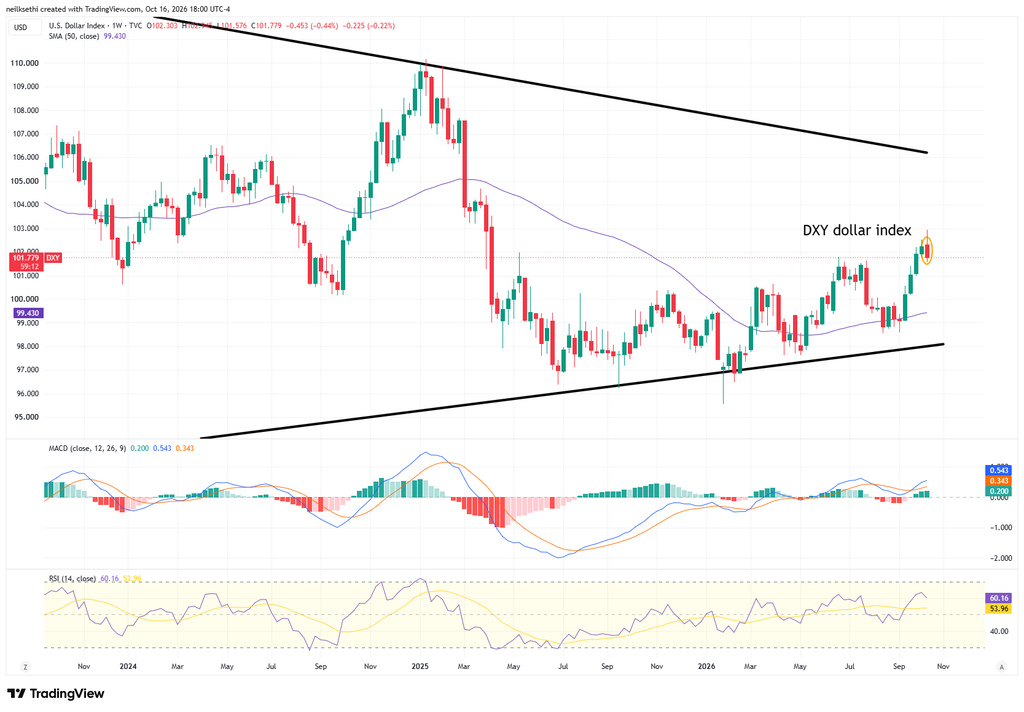
The cutting back in rate hike expectations pressured the DXY dollar index (which is fixed weighted with a heavy 57% weighting vs the euro) which fell further back from the highest levels since April 2025 earlier this week. The daily MACD flipped to a “sell longs” positioning while the RSI has fallen from over 70 to well under, “both of which would argue for a consolidation” as I mentioned Thursday.
Weekly chart continues to point to more upside.
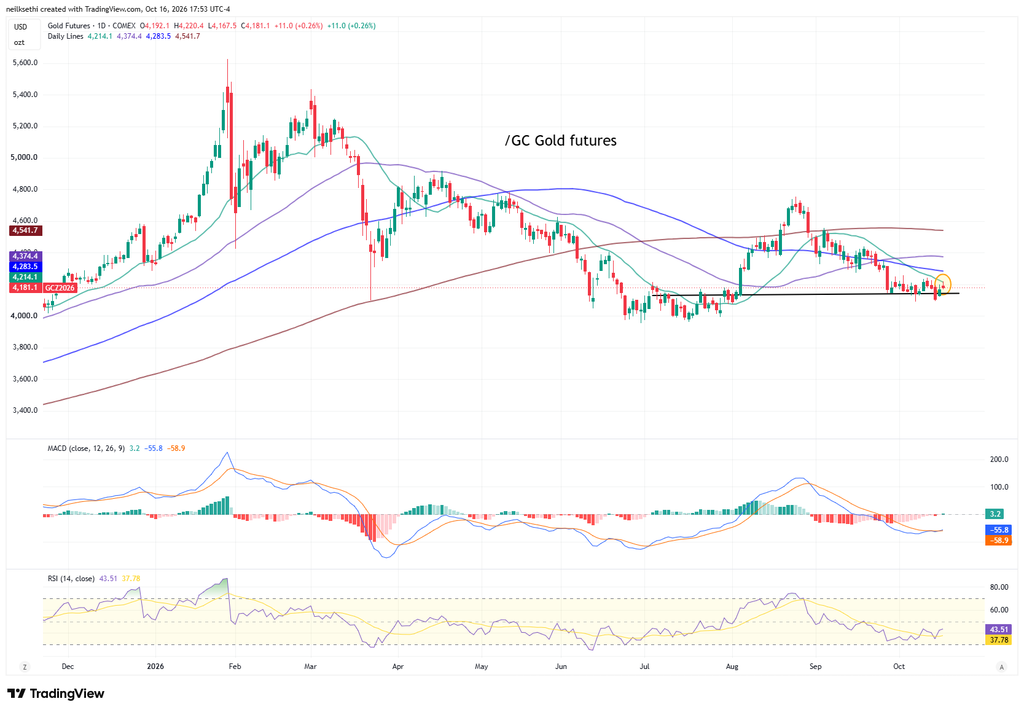
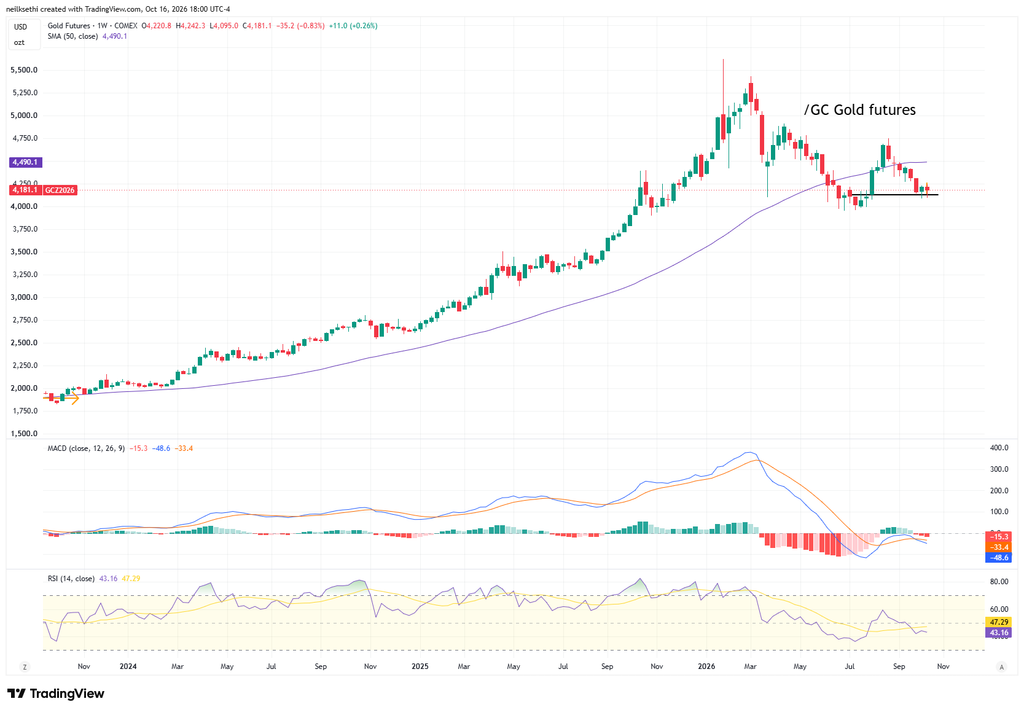
Gold futures (/GC) continue to trade just above support. The daily MACD is slightly positive but the RSI is still under 50. But as I mentioned Thursday “It’s worked itself into a position for a rally if it wants to take advantage.”
Weekly chart less constructive.
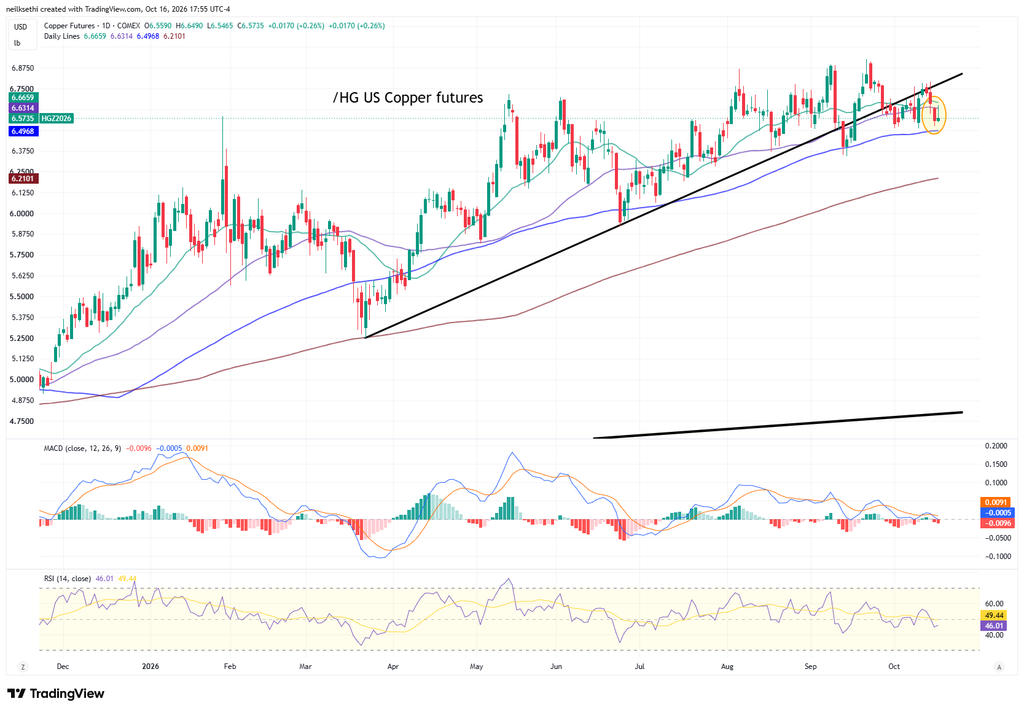
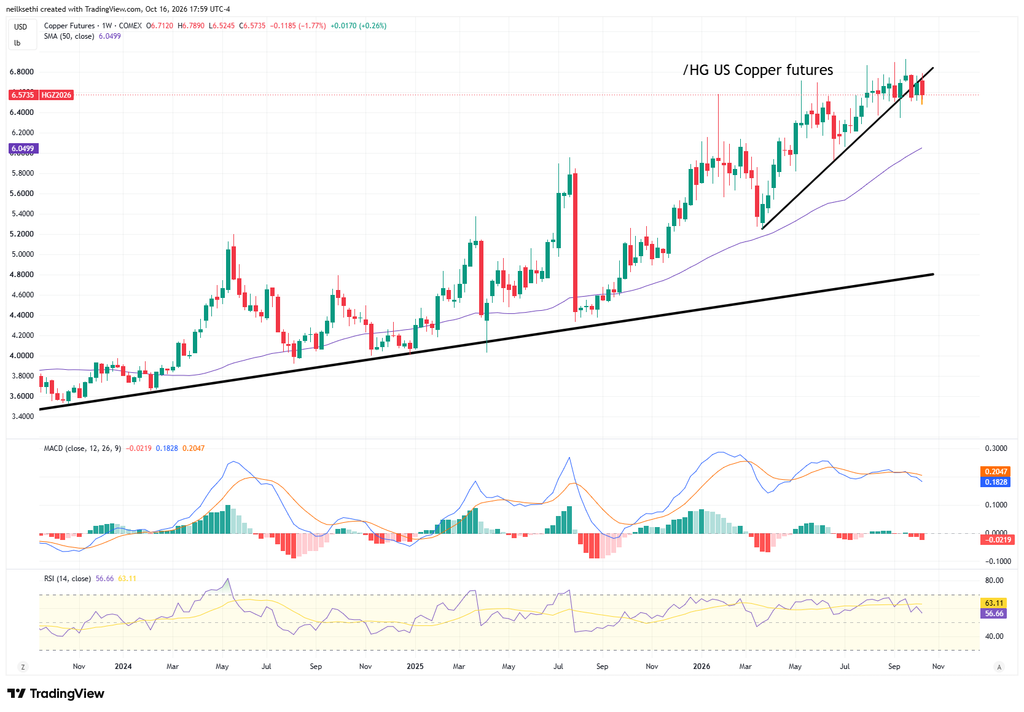
US copper futures (/HG) little changed. Overall still remain range bound. Daily MACD and RSI remain slightly negative.
Weekly chart points to more consolidation.
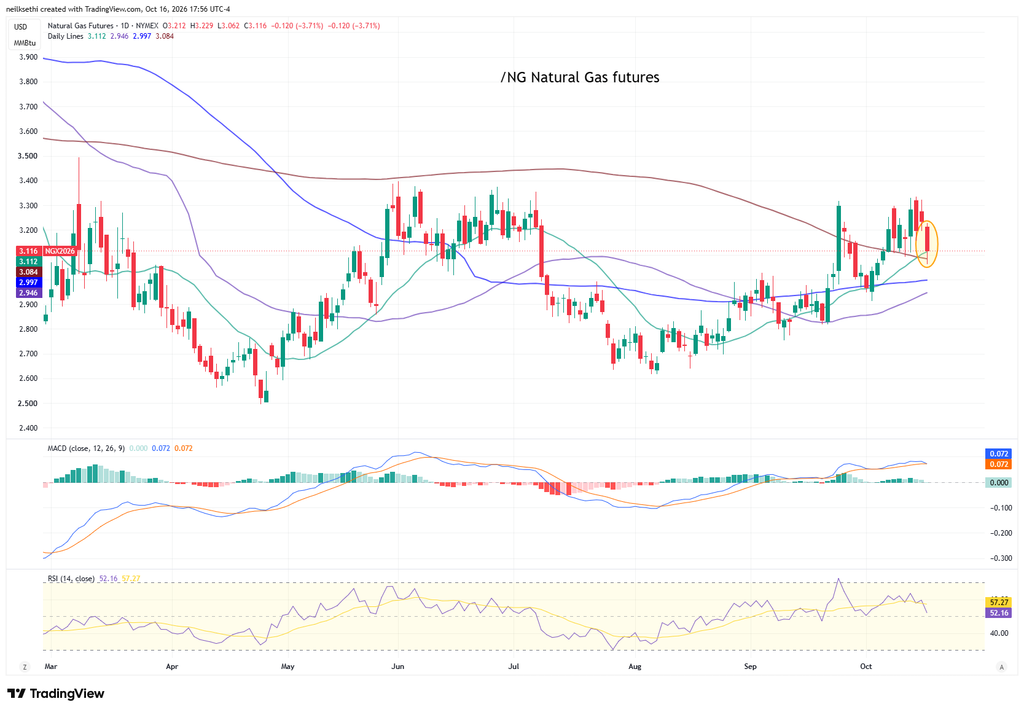
US natural gas futures (/NG) fell back moving back towards the middle of their range since March.
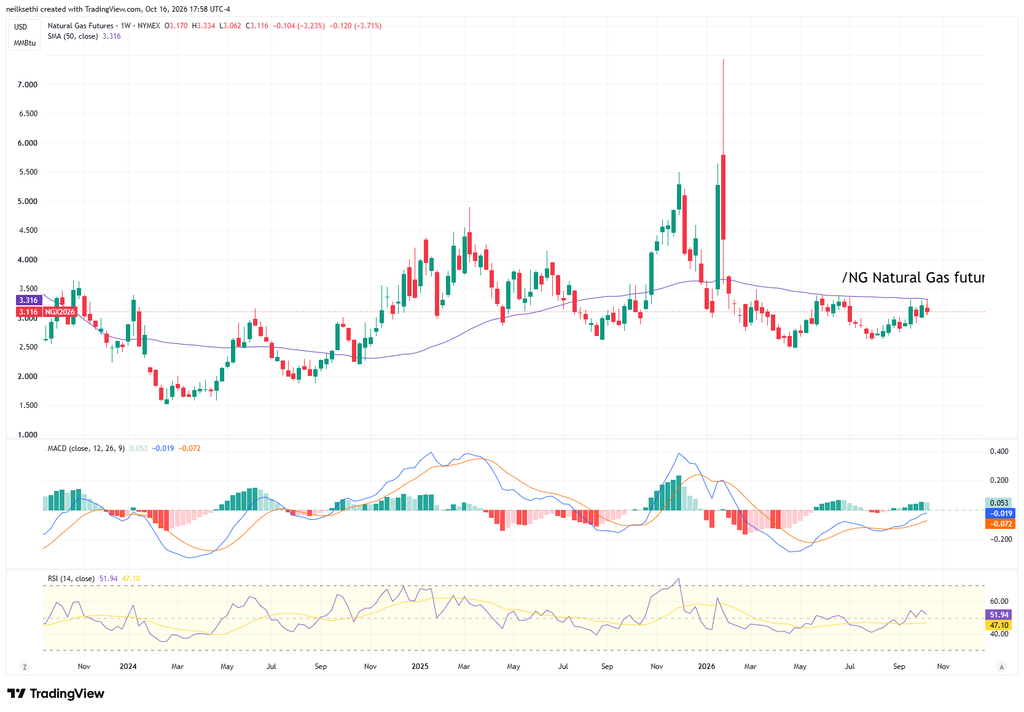
Another week capped by the 50-week moving average. The weekly technicals are positive though, so if it did break above, it could move.
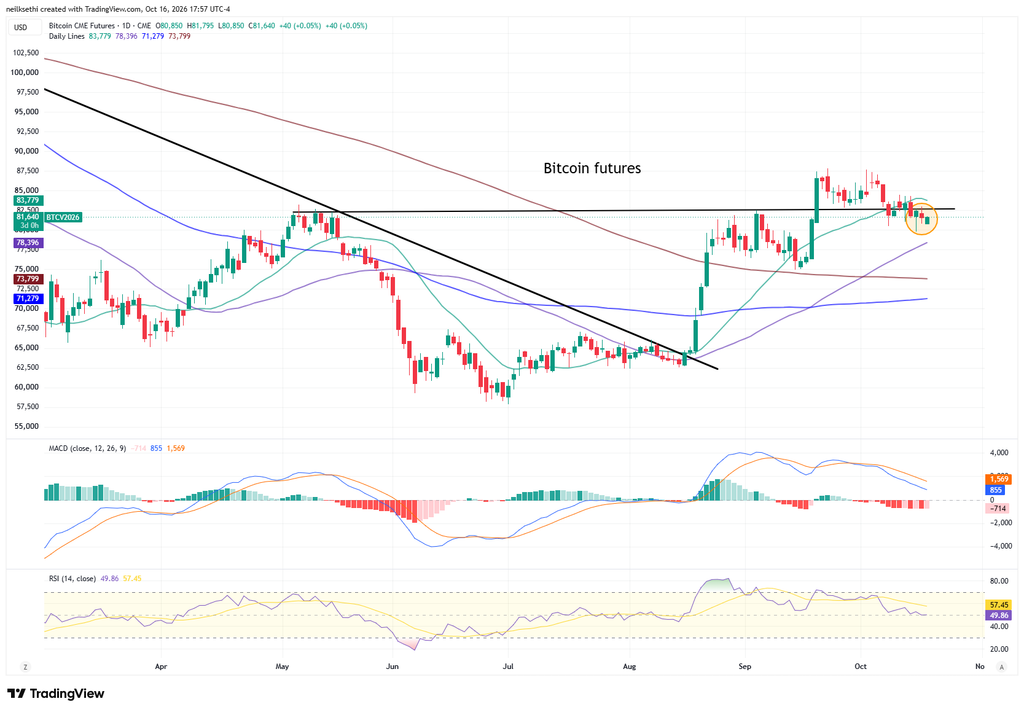
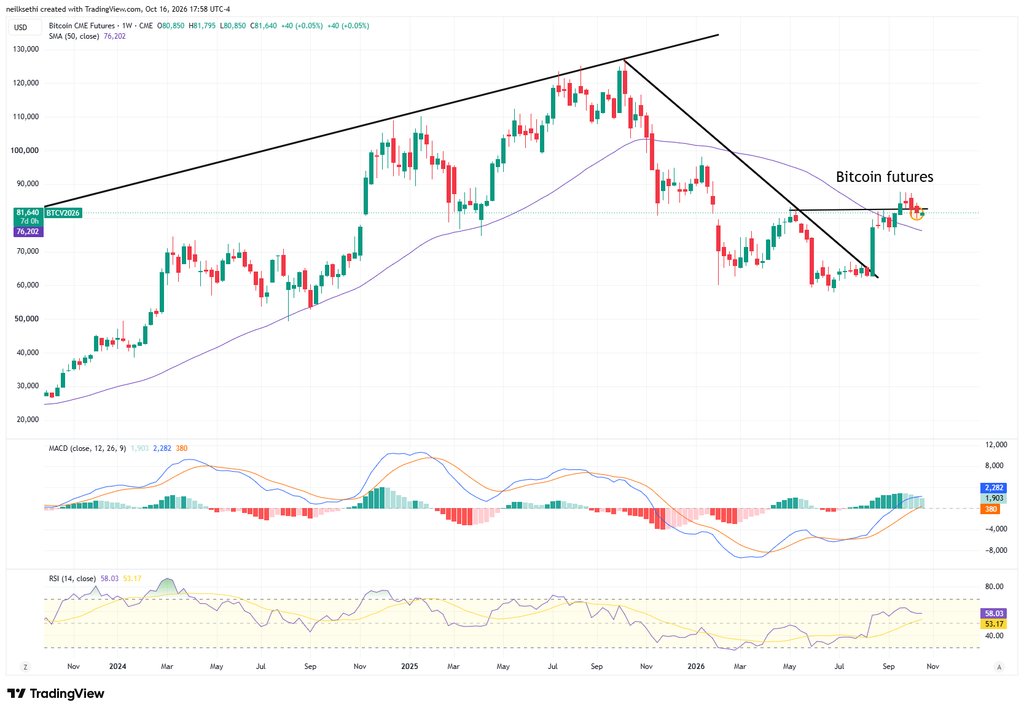
Bitcoin futures, unlike gold, remain under support. Daily MACD still negative, and the RSI has finally fallen under 50.
Weekly chart a little more constructive.
More From TheStreet Pro:
- Chris Versace – Warsh Remains Tight Lipped and the Market Likes That: 8 Key Items Shaping the Stock Market Friday
- James “Rev Shark” DePorre –
- Stephen Guilfoyle – My Worst Case for the AI-Fueled Economy
And From Me If You Missed It:
- Import Prices Jump as AI-Related Costs Rise the Most Since 1987
- Industrial Output Jumps the Most Since April to Highest Since 2018
Miscellaneous:
Wrap-Up – How Long Will the Rotation Continue?
While longer maturity yields didn’t drop today, we saw a healthy move lower on the short end with firming of October hold bets. That, and probably now some momentum, was enough to see many stocks continue to lift, although as mentioned the underlying metrics were not as strong as I would have liked.
But Tech continues along in its consolidation. I continue to expect it’s just that, but as I’ve mentioned all week, according to Deutsche Bank these tend to run several weeks. With that in mind I exited several more positions today that broke support levels.
I want to hold off on any further takeaways until I’ve had a chance to go through all the metrics and read some weekend notes, particularly from DB given, as I also mentioned, they’ve called this year as well as anyone.
The Week Ahead – Economic Data and the Fed Take A Backseat to Earnings
After a busy week, US economic data lightens next week. October reports are highlighted by S&P Global flash PMIs and final University of Michigan consumer sentiment and also include the NAHB housing market index, the Philly Fed services survey, and the Kansas City Fed manufacturing and services surveys. September reports include housing starts and building permits, pending home sales and the Conference Board’s leading and coincident indicators. We’ll also get the usual weekly reports (ADP, mortgage applications, unemployment claims, etc.).
The Fed enters its blackout period Saturday ahead of the October 27–28 FOMC meeting, so there are no Fed speakers next week.
Non-Bill (>1yr in maturity) US Treasury auctions resume with a $13bn 20-year bond reopening Wednesday and a $26bn new 5-year TIPS auction Thursday.
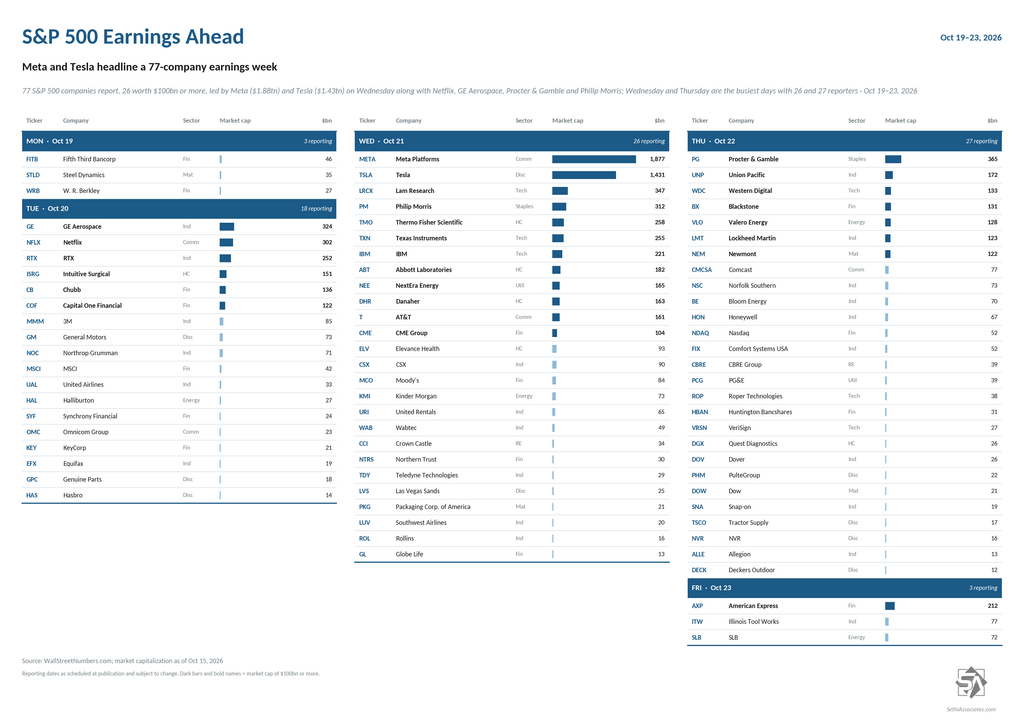
Q3 earnings season kicks up a gear with 77 S&P 500 components reporting, 26 of them with market caps over $100bn:
- Tuesday: GE Aerospace (GE), Netflix (NFLX), RTX (RTX), Intuitive Surgical (ISRG), Chubb (CB) and Capital One (COF)
- Wednesday: Meta Platforms (META), Tesla (TSLA), Lam Research (LRCX), Philip Morris (PM), Thermo Fisher (TMO), Texas Instruments (TXN), IBM (IBM), Abbott (ABT), NextEra Energy (NEE), Danaher (DHR), AT&T (T) and CME Group (CME)
- Thursday: Procter & Gamble (PG), Union Pacific (UNP), Western Digital (WDC), Blackstone (BX), Valero (VLO), Lockheed Martin (LMT) and Newmont (NEM)
- Friday: American Express (AXP)
At the time of publication, in terms of equities mentioned, Sethi was short WDC, long T, SPY, RSP, CPER, and numerous equities in the energy sector.
As a reminder comments are encouraged. If they are directed at me, please put @NeilSethi in front.



