Industrial Output Jumps the Most Since April to Highest Since 2018
Industrial production beats estimates, rising from a year earlier the most since September 2022, as manufacturing rebounds from August’s dip and utility output jumps to a record high led by electricity.
You've reached your free article limit
You've read 0 of 1 free Pro articles.

- U.S. Industrial Production (M/M) Sep: +0.7% (est +0.4%; prev 0.0%; prev R +0.1%)
- Manufacturing Production (M/M): +0.3% (est +0.3%; prev -0.3%; prev R -0.2%)
- Capacity Utilization: 76.9% (est 76.5%; prev 76.3%; prev R 76.4%)
Executive Summary
- September industrial production rose 0.66% month-over-month, the most since April, above the 0.4% expected and a sixth straight monthly gain that lifted output to its highest level since December 2018. August was revised up to +0.06%, and the three-month average is +0.32%.
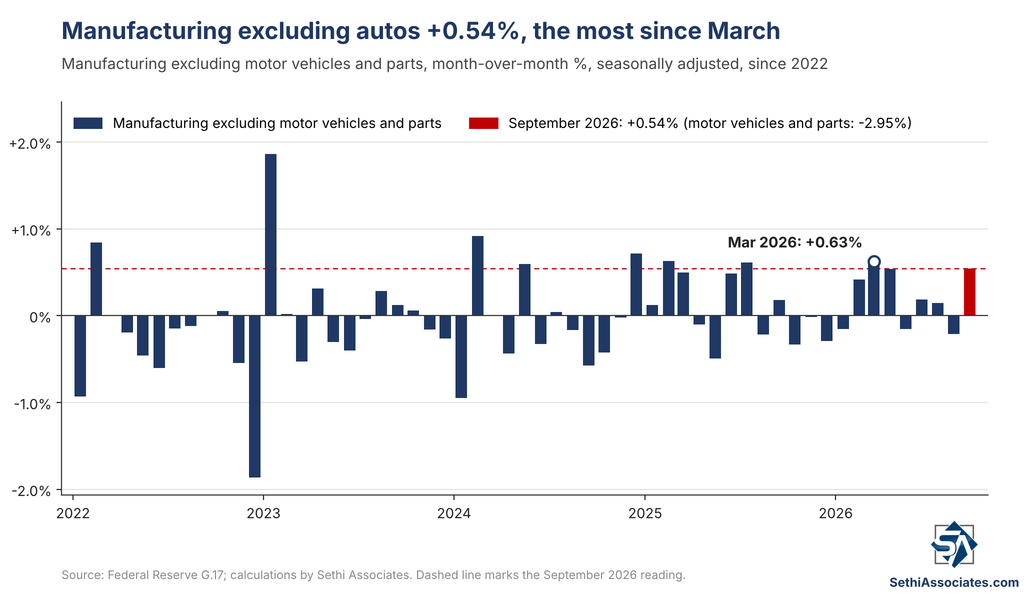
- Manufacturing rebounded 0.27%, also the most since April, roughly in line with the 0.3% expected, after August’s -0.23% dip. Nondurables rose 0.43% while durables edged up just 0.11% as motor vehicles and parts fell 2.95%, the most since October 2025. Excluding autos, manufacturing rose 0.54%, the most since March.
- Utilities jumped 3.50%, the most since December 2025, to an all-time high, with mining and total energy output also at records.
- Year-over-year, total industrial production is +2.25%, the most since September 2022 and the first reading above 2% since then, while manufacturing is +1.13%. Capacity utilization rose to 76.85%, the highest since December 2023, above the 76.5% expected.
- Goldman boosted their Q3 real GDP tracking estimate to +3.3% (+0.2pp) after the release.

Although industrial production accounts for only around 12-15% of total gross domestic product, it is considered an important macroeconomic indicator as it measures output from the manufacturing (~75% of industrial production), mining (~12%) and utility (~12%) industries, and can aid in forecasting structural changes in the economy, business cycle inflection points and inflationary trends. Note industrial production measures real (inflation-adjusted) output, with each industry weighted by its share of value added.
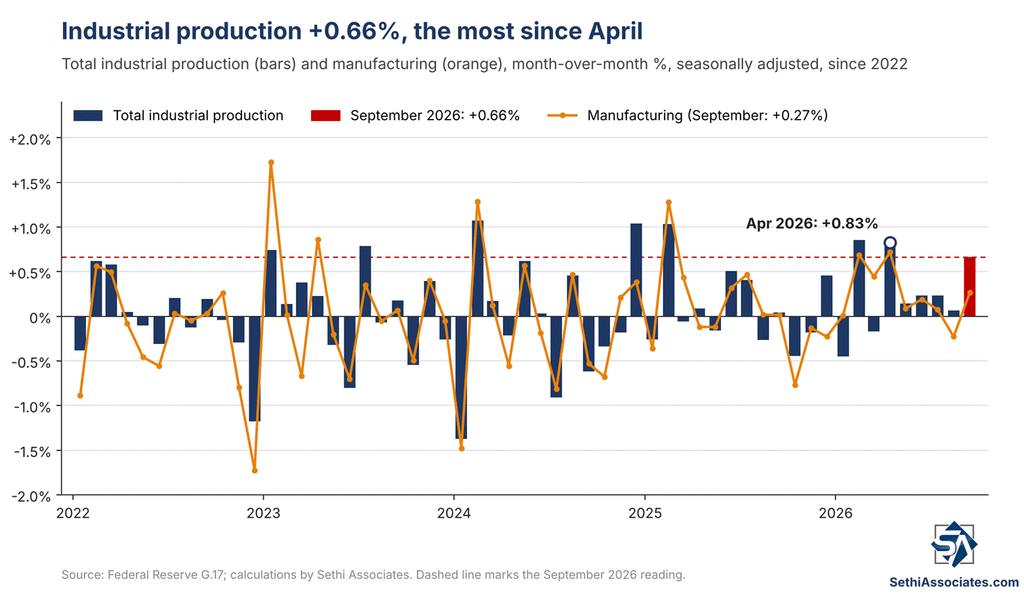
September industrial production (blue) rose 0.66% from August (month-over-month), the most since April, above the 0.4% expected and a sixth straight monthly gain. August was revised up to +0.06% (initially reported at +0.02%) and July to +0.23% (from +0.20%), bringing the three-month average to +0.32%.
Manufacturing (orange, ~75% of industrial production) rose 0.27%, the most since April, roughly in line with the 0.3% expected, rebounding from August’s -0.23% (revised up from -0.28%), still the only decline of the year. July was revised down to +0.08% (from +0.16%).
The gain was led by nondurables, as “the nondurable manufacturing index increased 0.4 percent” (+0.43%), “led by gains in the indexes for printing and support and for chemicals.” “The durable manufacturing index ticked up 0.1 percent in September” (+0.11%) as “output of motor vehicles and parts declined 3.0 percent” (-2.95%), the most since October 2025 and a third straight decline.
Excluding motor vehicles and parts, though, manufacturing rose 0.54%, the most since March.
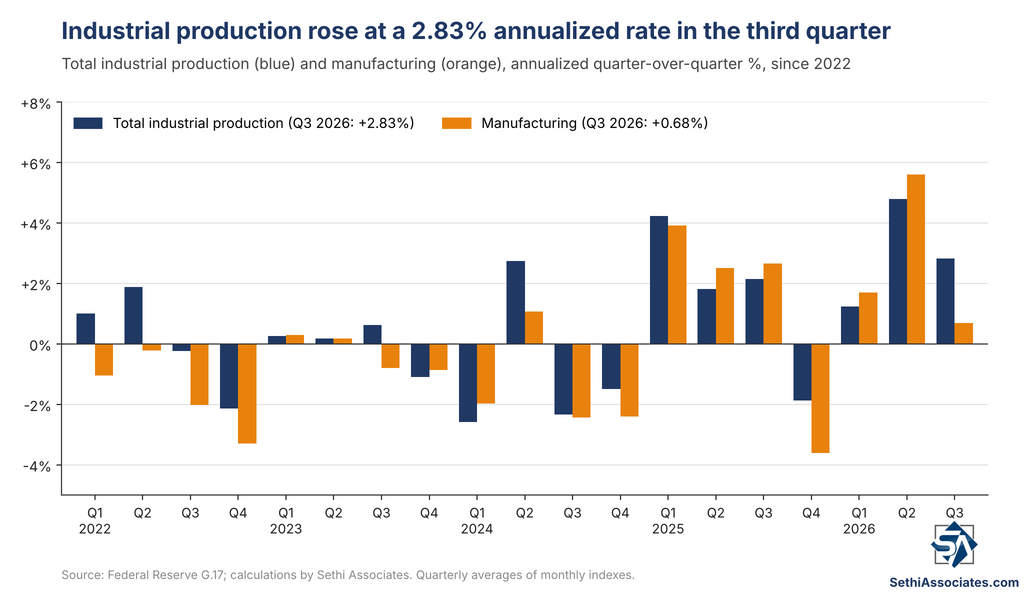
For the third quarter as a whole, production rose at a 2.83% annualized rate and manufacturing +0.68%.
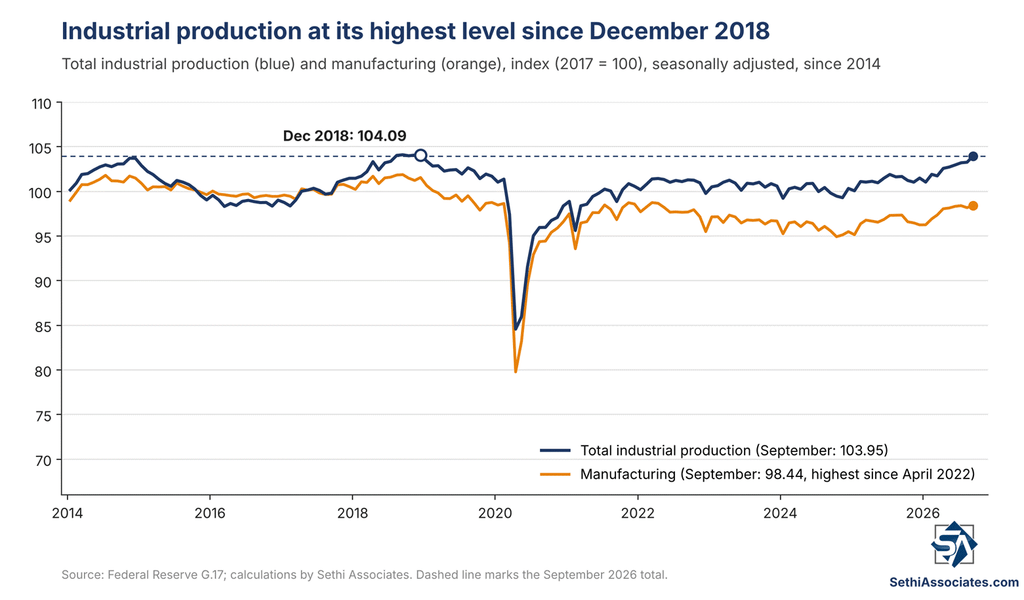
Total industrial production rose to its highest level since December 2018, while manufacturing is at its highest since April 2022.
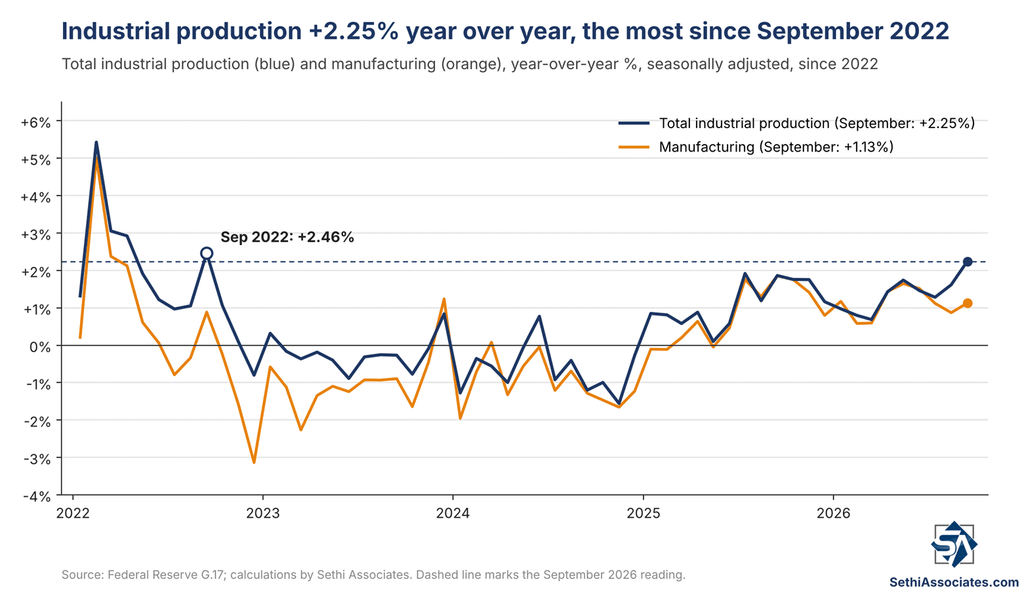
Looking from a year earlier, total industrial production is +2.25%, the most since September 2022 and the first reading above 2% since then, up from August’s upwardly revised +1.62%. Manufacturing is +1.13%, up from +0.87%.
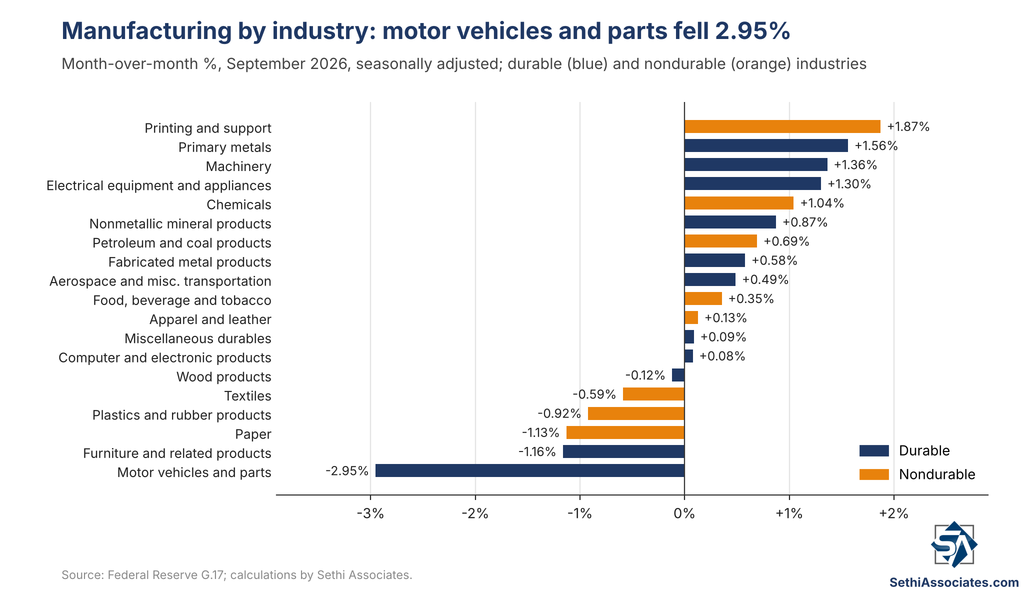
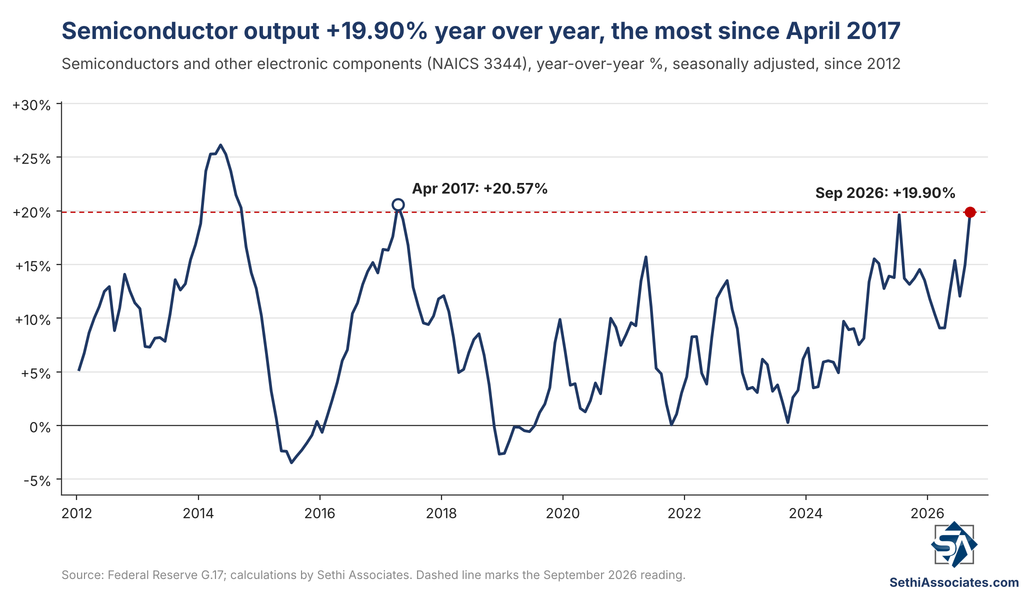
Among industry groups, the biggest gains came in printing and support (+1.87%), primary metals (+1.56%), machinery (+1.36%, the most since January), electrical equipment and appliances (+1.30%) and chemicals (+1.04%). Motor vehicles and parts (-2.95%) led the declines, followed by furniture (-1.16%), paper (-1.13%) and plastics and rubber products (-0.92%). Computer and electronic products edged up just 0.08%, though within them semiconductors and related components rose 2.11% and are up 19.90% year-over-year, the most since April 2017. Machinery is up 6.92% year-over-year, the most since December 2021.
Looking at industrial production from another angle, “market groups” (product-use classifications), “all major market groups posted gains in September except business equipment, which recorded no change.” Consumer goods rose 0.67%, the most since February, as a 1.25% gain in nondurable consumer goods, led by a 3.51% jump in consumer energy products, the most since December 2025, outweighed a 1.45% drop in durable consumer goods, where automotive products fell 2.77%, the most since October 2025. Consumer goods are -0.07% year-over-year, the best since July 2025.
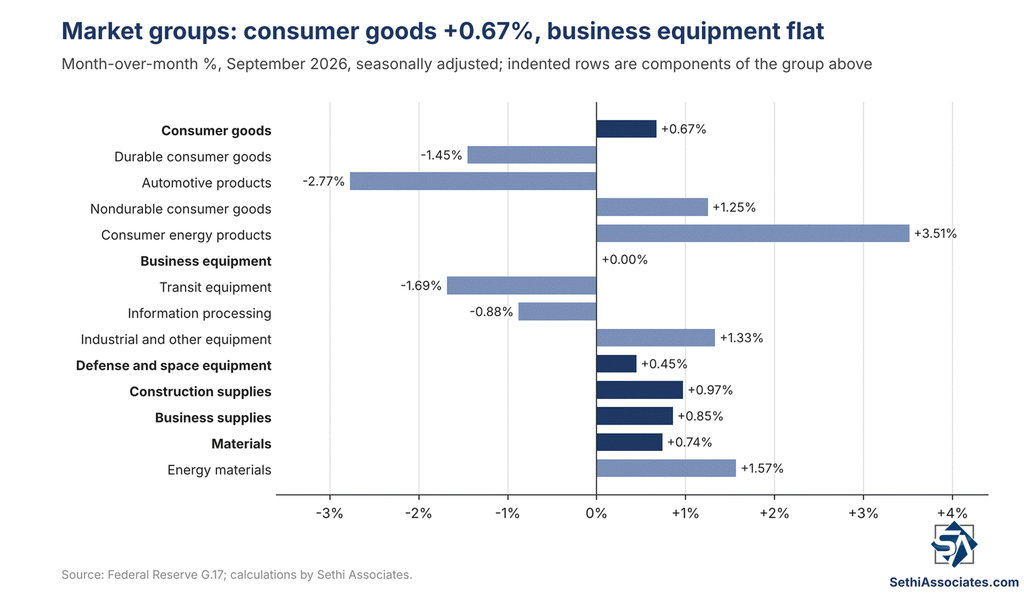
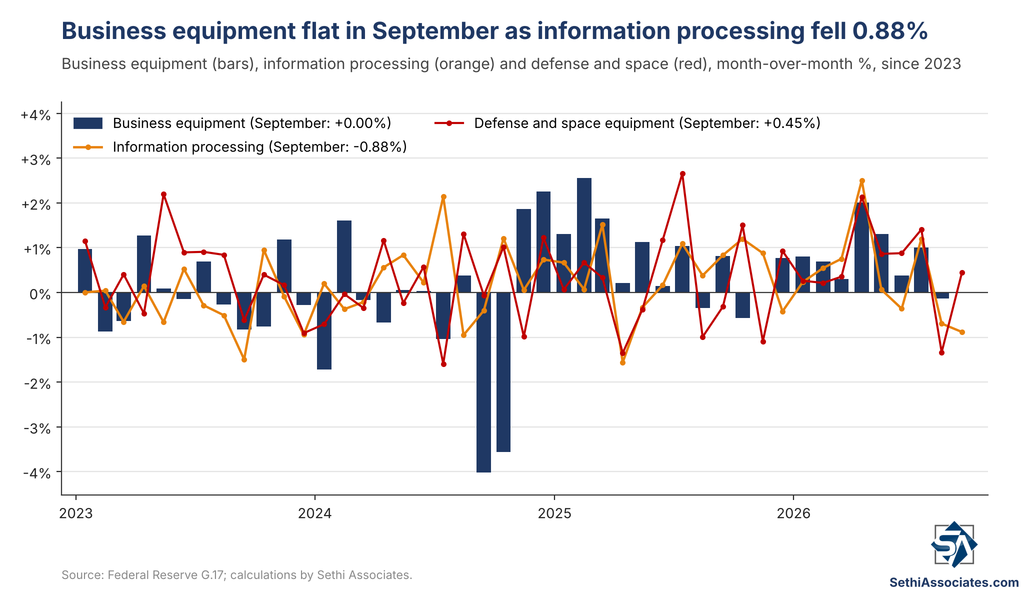
Business equipment was flat (+0.00%) after an upwardly revised -0.13% in August (initially -0.49%). Transit equipment fell 1.69%, the most since October 2025, and information processing fell 0.88%, the largest decline since April 2025 and a second straight drop, offsetting a 1.33% gain in industrial and other equipment, the most since January 2023. Defense and space equipment rose 0.45% after -1.34% in August.
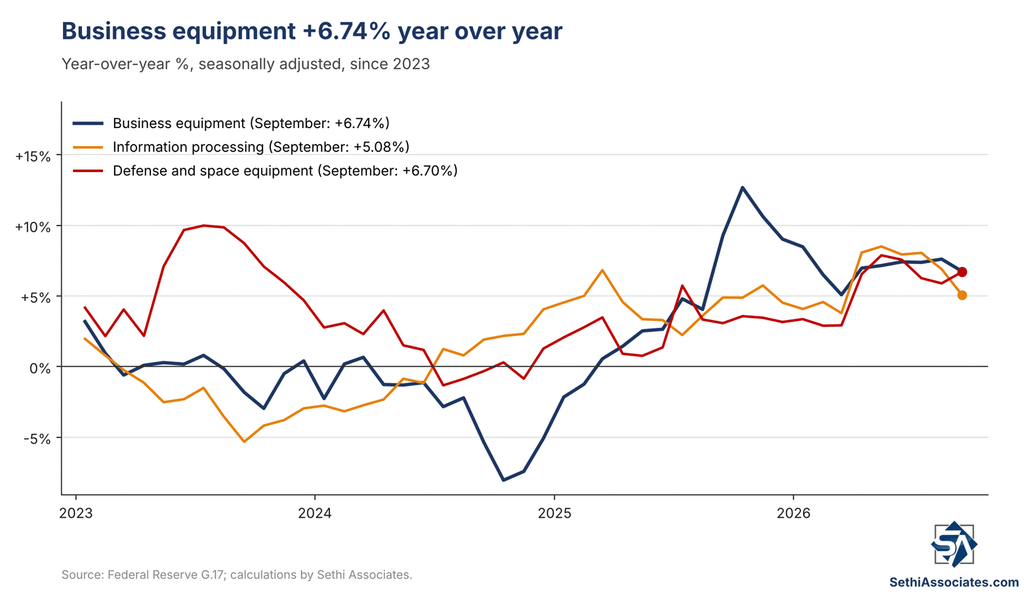
Year-over-year, business equipment is +6.74%, information processing +5.08%, defense and space +6.70% and transit +11.29%.
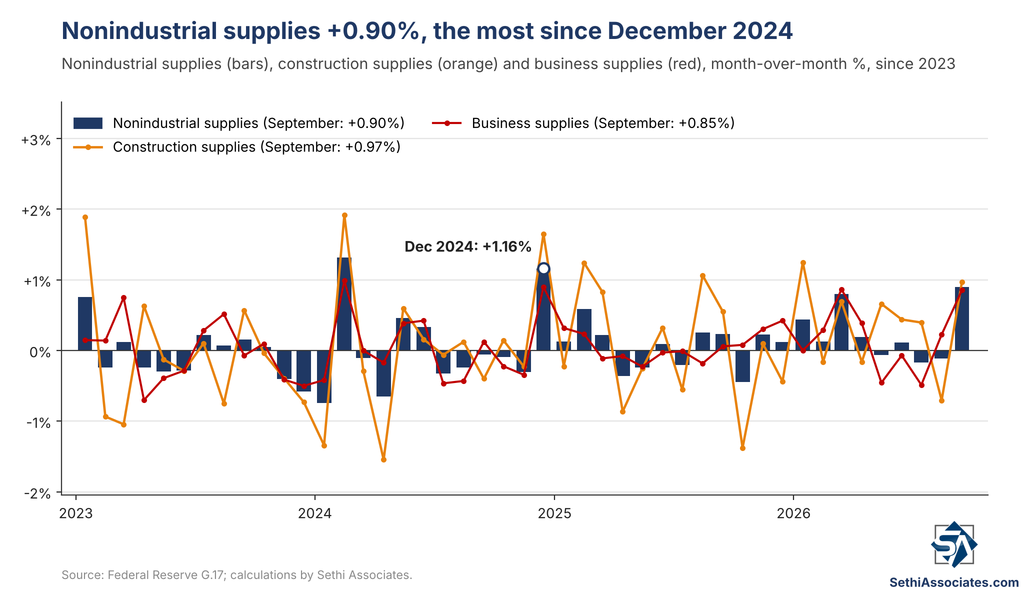
Nonindustrial supplies (intermediate goods that leave the industrial sector and are used as inputs by non-industrial sectors) rose 0.90%, the most since December 2024, with construction supplies up 0.97% (after -0.70% in August) and business supplies up 0.85%, the most since March.
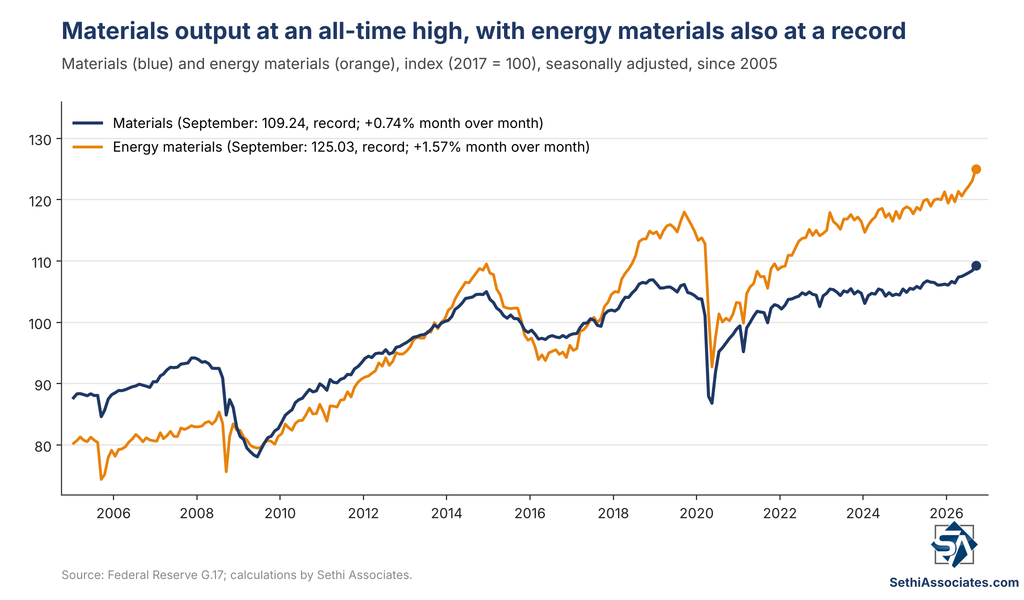
Materials rose 0.74%, a sixth straight gain, to an all-time high, with energy materials up 1.57%, the most since March 2023, also to a record.
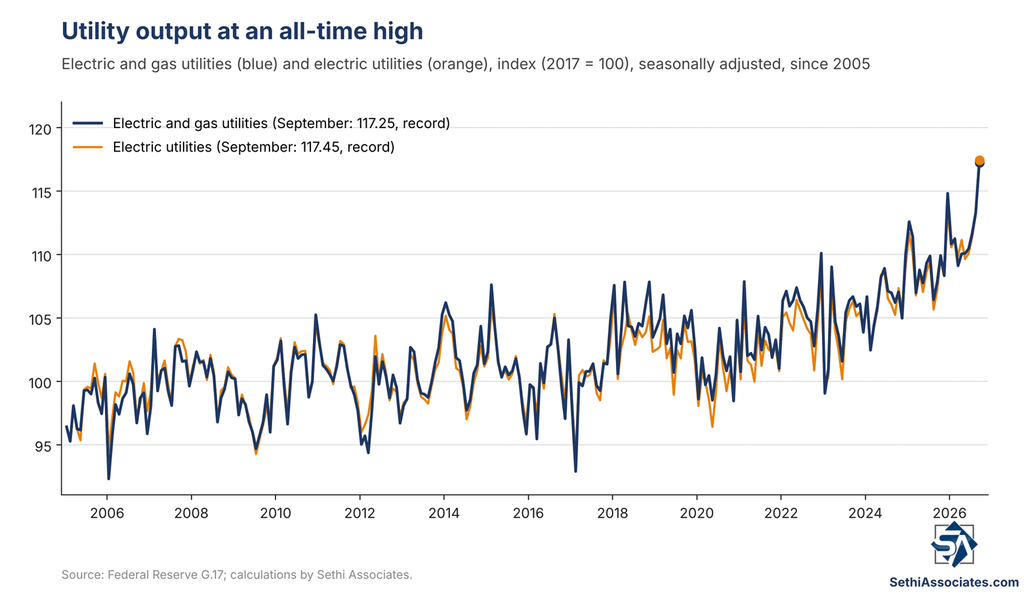
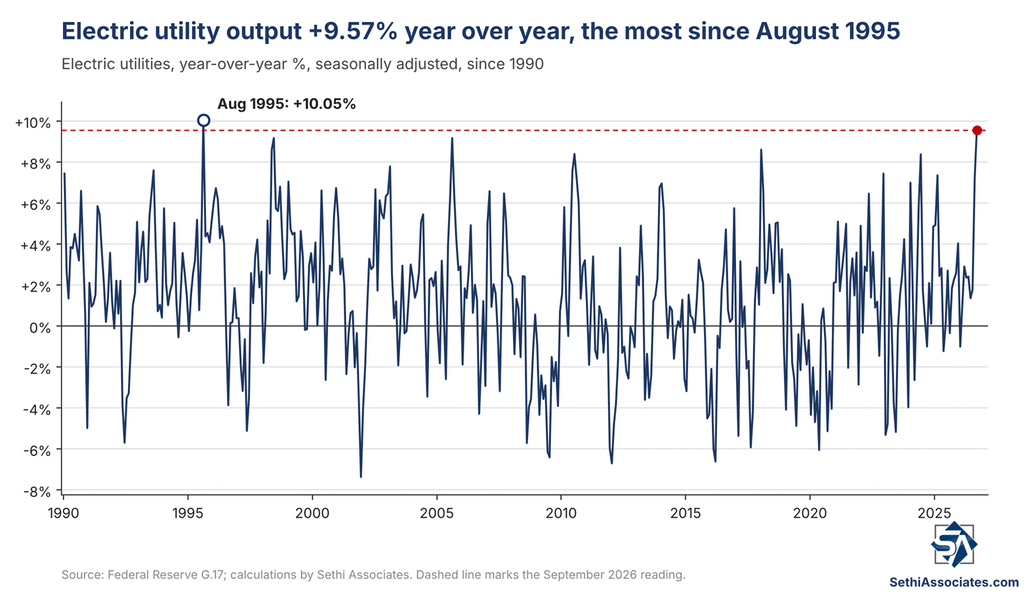
Utility production jumped 3.50%, the most since December 2025, to an all-time high, with electric up 3.69% and natural gas up 2.08%. That’s a sixth straight monthly gain and, as ZeroHedge noted, a 14.8% annualized rate in the third quarter. Utilities are now +8.74% year-over-year, the most since December 2022, and electric +9.57%, the most since August 1995.
Goldman: “The details of today’s industrial production report—specifically the utilities component, which is used as source data for consumption in GDP and increased by 3.5% month-over-month in September—and yesterday’s business inventories report were stronger than our previous GDP tracking assumptions. We boosted our Q3 GDP tracking estimate by 0.2pp to +3.3% (quarter-over-quarter annualized).”
Mining (which includes oil and gas exploration) rose 0.15%, a sixth straight gain, to an all-time high, and is +2.80% year-over-year.
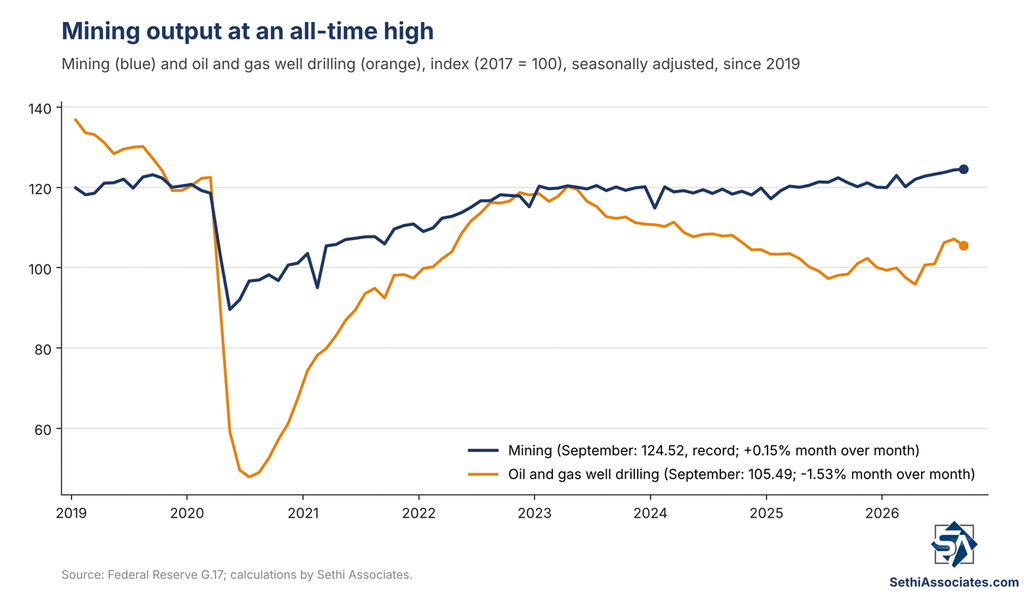
Oil and gas extraction rose 0.85% after -0.73% in August, the most since April, to an all-time high, and is +1.49% year-over-year. Crude oil rose 0.77% and natural gas and natural gas liquids rose 1.19%, both to records. Oil and gas well drilling fell 1.53% after +0.87% in August, the largest decline since April, though it is still +7.22% year-over-year. August’s level was the highest since September 2024.
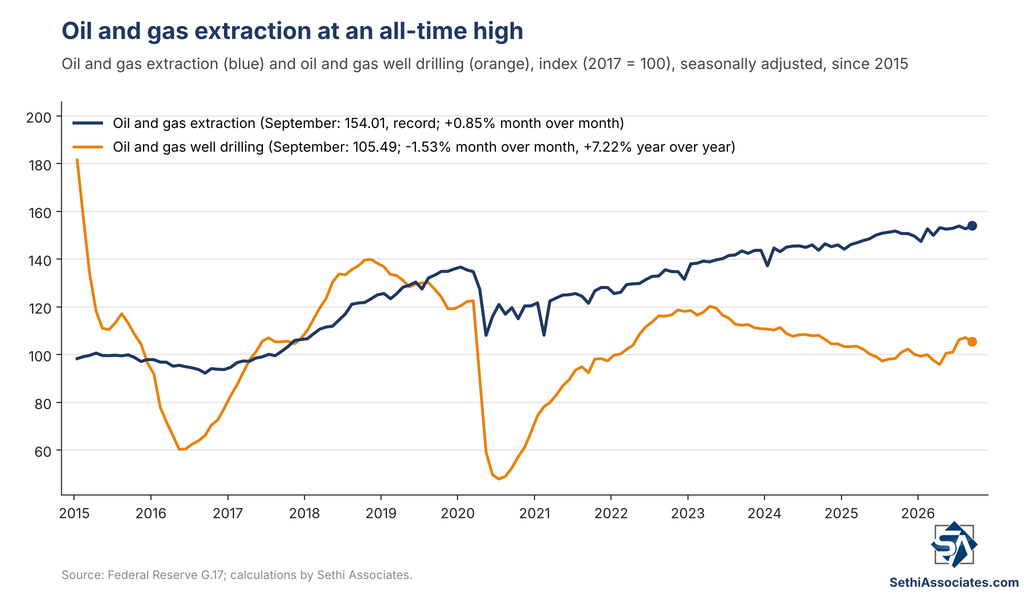
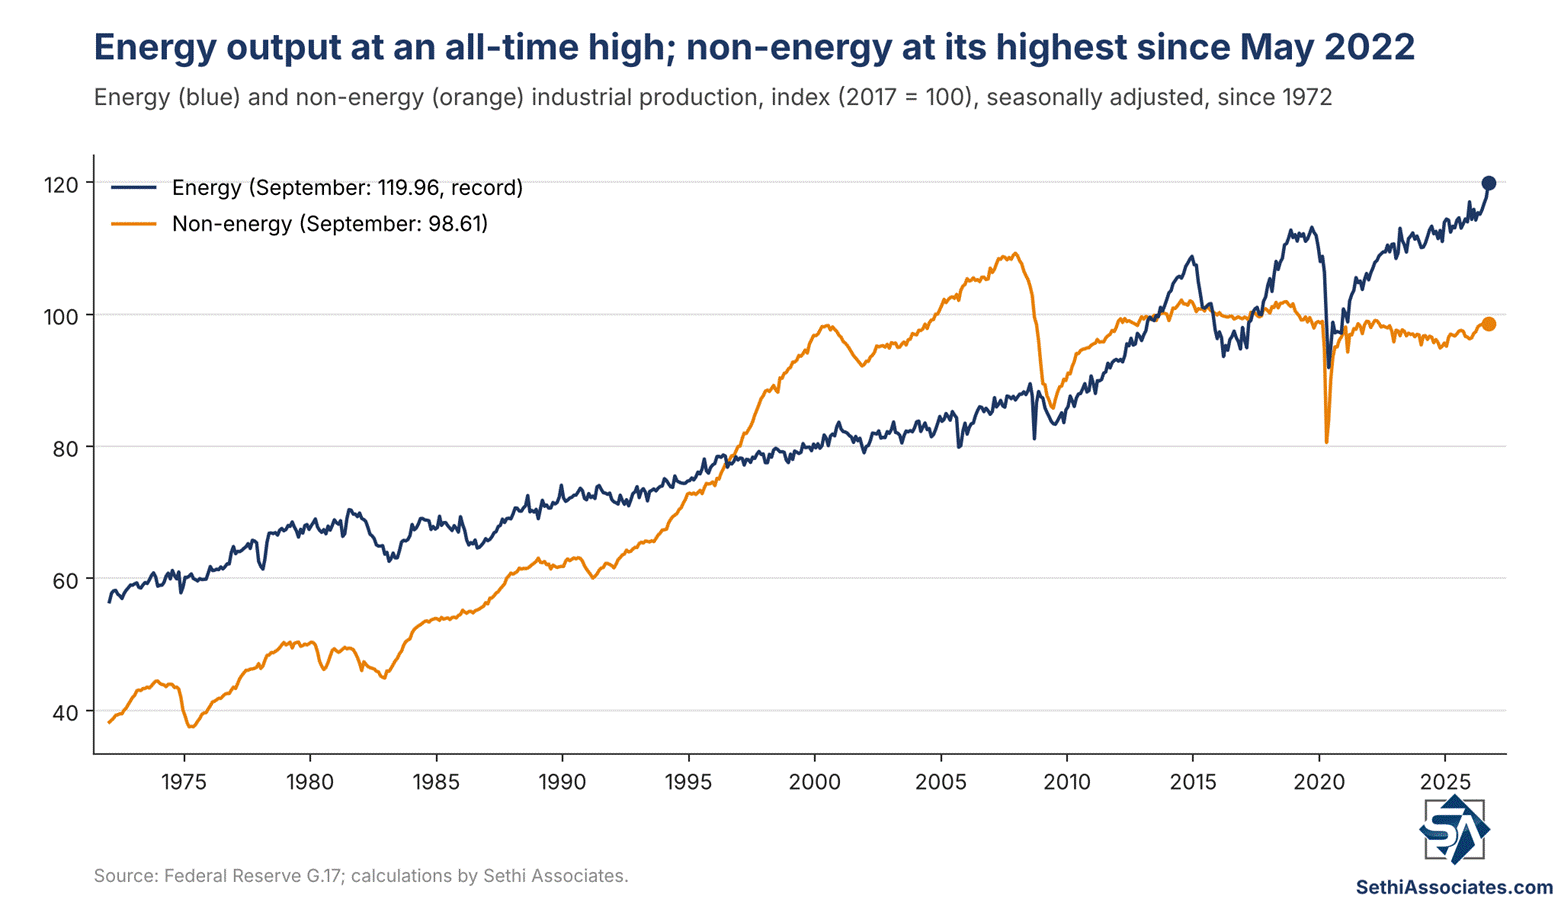
Overall energy output rose 1.92%, the most since December 2025, to an all-time high, and is +5.48% year-over-year, the most since September 2022. Non-energy output rose 0.26% to its highest since May 2022.
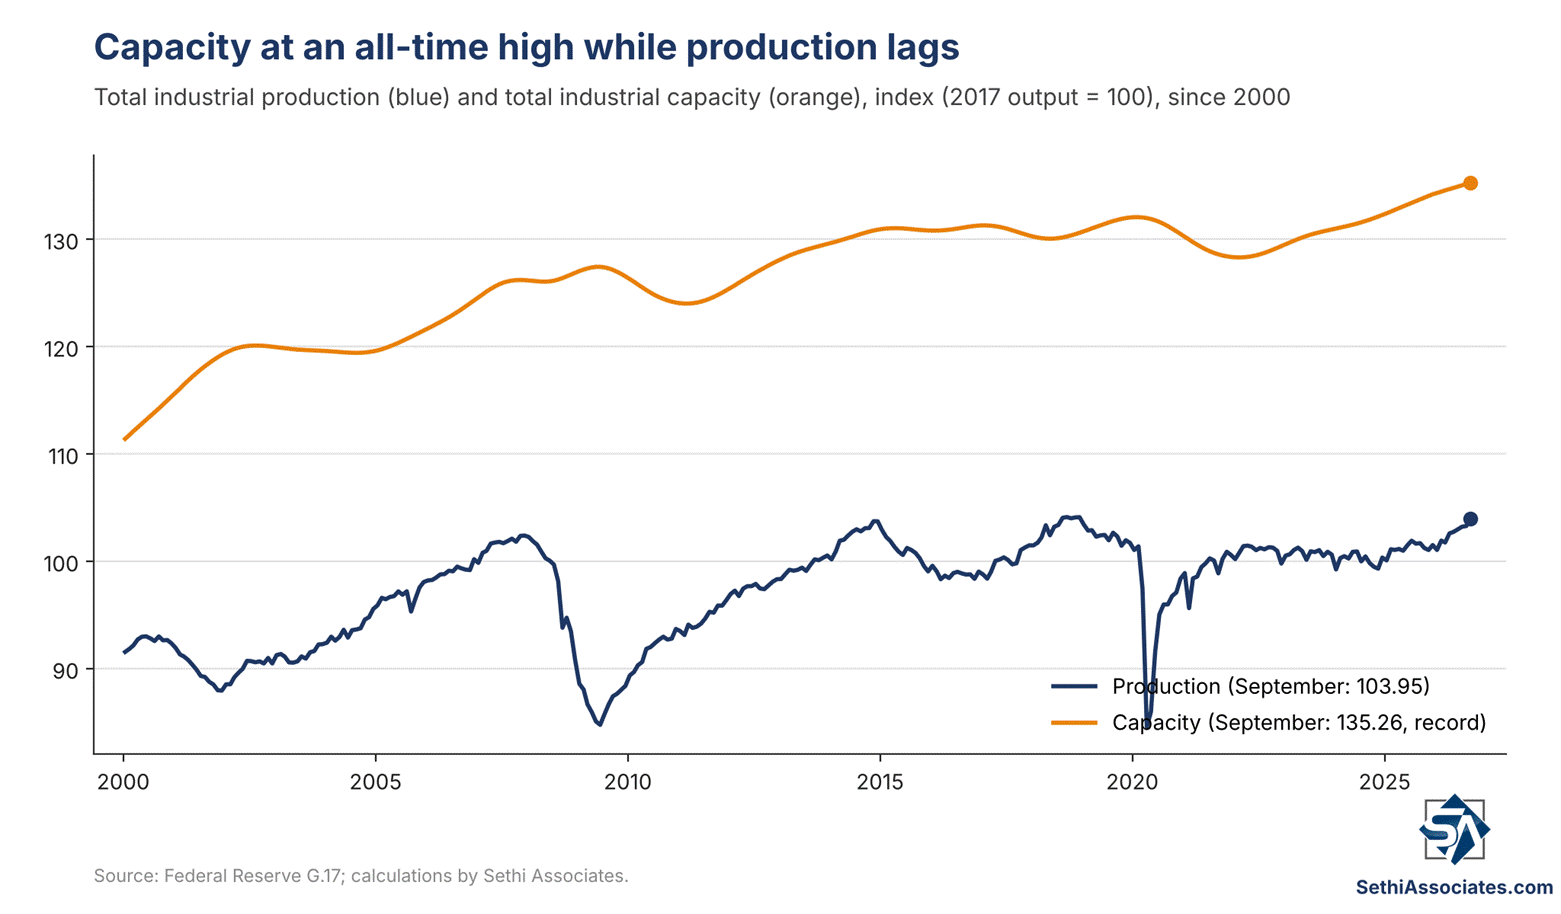
While total industrial production is at its highest since December 2018, total industrial capacity remains at an all-time high (so production has lagged capacity).
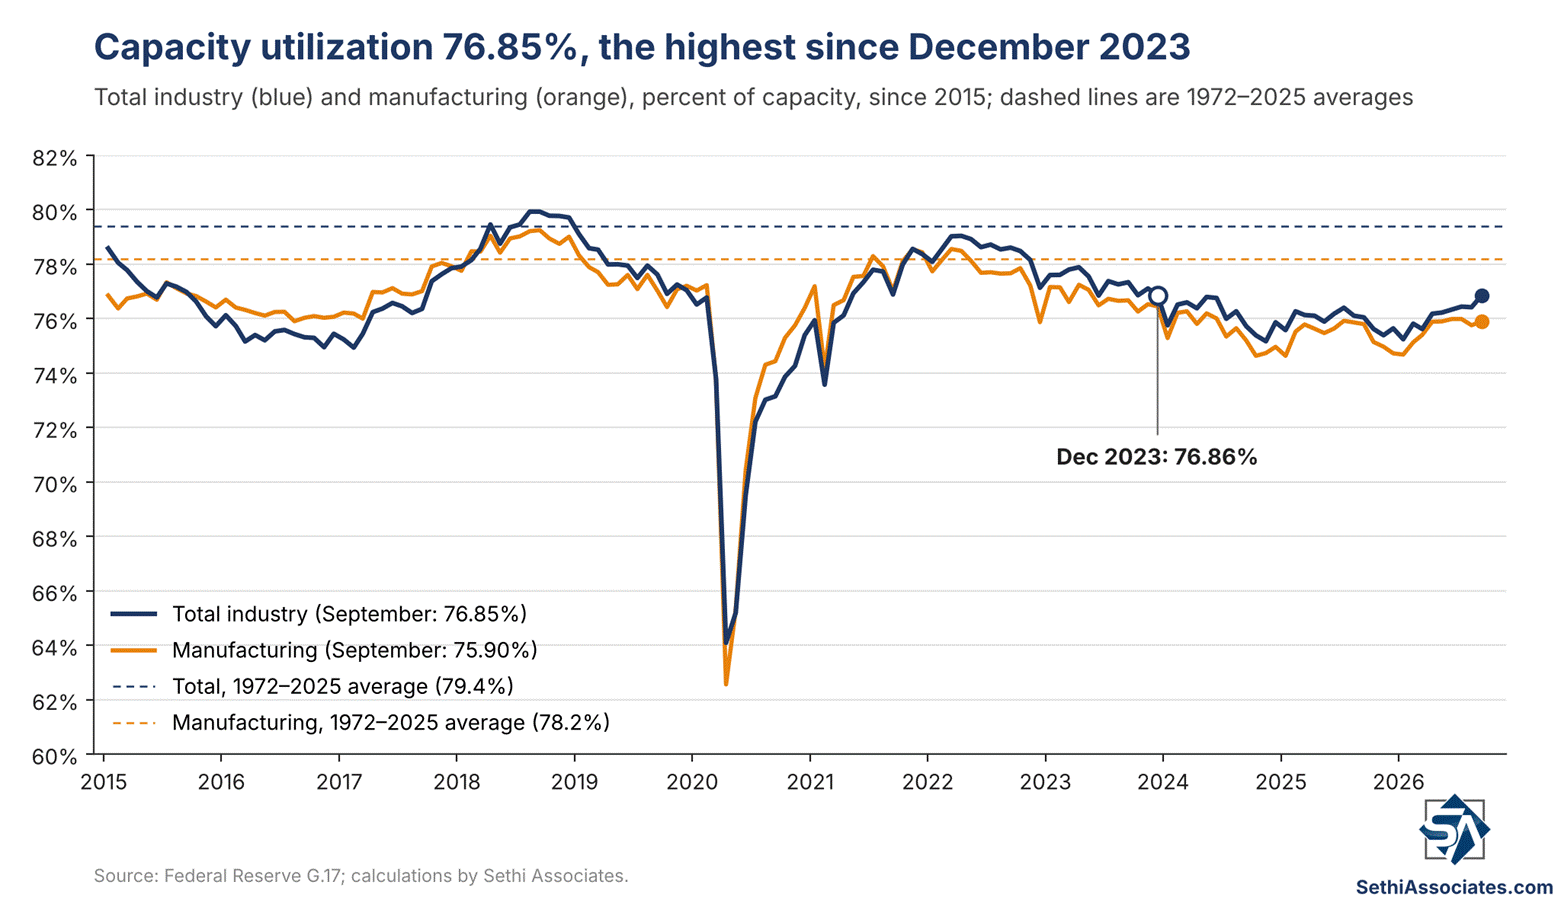
But capacity utilization (blue) rose to 76.85%, the highest since December 2023, above the 76.5% expected and up from 76.42% in August (revised from 76.3%), though as ZeroHedge noted, it is “still 2.5 percentage points below its long-run (1972–2025) average.”
Capacity utilization at factories (orange, manufacturing) rose to 75.90% from 75.76% (revised from 75.7%).
Goldman: “We recently noted that most manufacturing industries are operating well below their maximum potential output, and only a few are nearing their peak rates of capacity utilization reached in recent business cycles—notably, electrical equipment and machinery manufacturers, likely reflecting AI-related demand.”
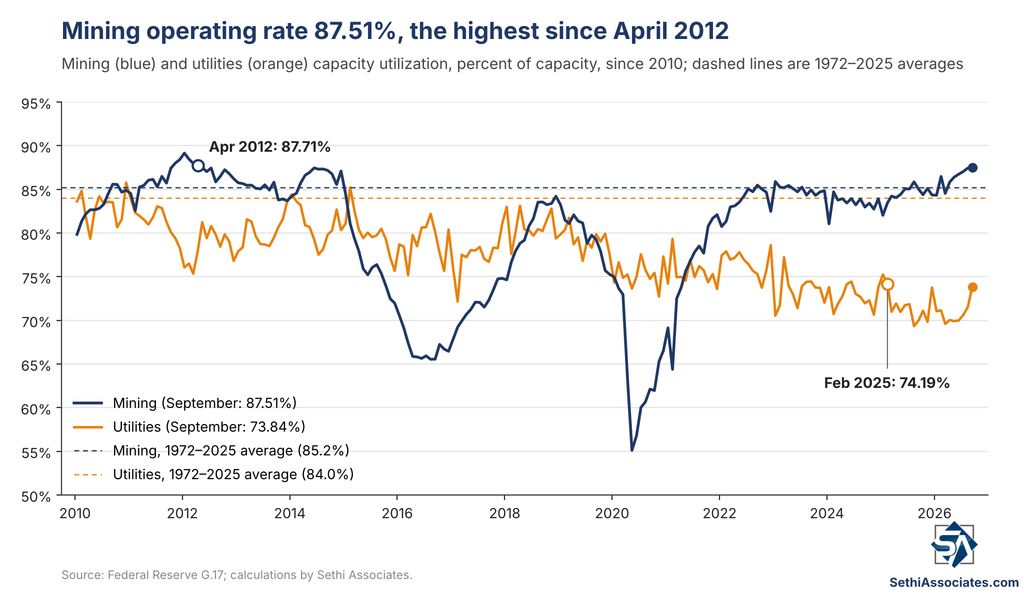
“The operating rate for mining [including oil and gas exploration] ticked up 0.1 percentage point to 87.5 percent in September” (87.51%), the highest since April 2012, and “the operating rate for utilities increased 2.3 percentage points to 73.8 percent” (73.84%), the highest since February 2025, “while the rate for utilities remained substantially below its long-run average.”
Source: Federal Reserve G.17
