Import Prices Jump as AI-Related Costs Rise the Most Since 1987
Fuel prices rebounded and nonfuel import prices hit their highest annual rate since April 2022, with semiconductor prices posting an eighth straight record year-over-year gain.
You've reached your free article limit
You've read 0 of 1 free Pro articles.

U.S. Import Prices, September (month-over-month): 1.1% (estimate 1.0%; prior 0.7%; prior revised 0.5%)
— Excluding Petroleum (month-over-month): 0.8% (estimate 0.6%; prior 0.8%; prior revised 0.5%)
— Import Prices (year-over-year): 8.1% (estimate 8.2%; prior 7.0%; prior revised 6.7%)
— Export Prices (month-over-month): 2.2% (estimate 0.9%; prior 0.6%; prior revised 1.2%)
— Export Prices (year-over-year): 11.6% (estimate 9.6%; prior 8.6%; prior revised 9.3%)
Quick Summary
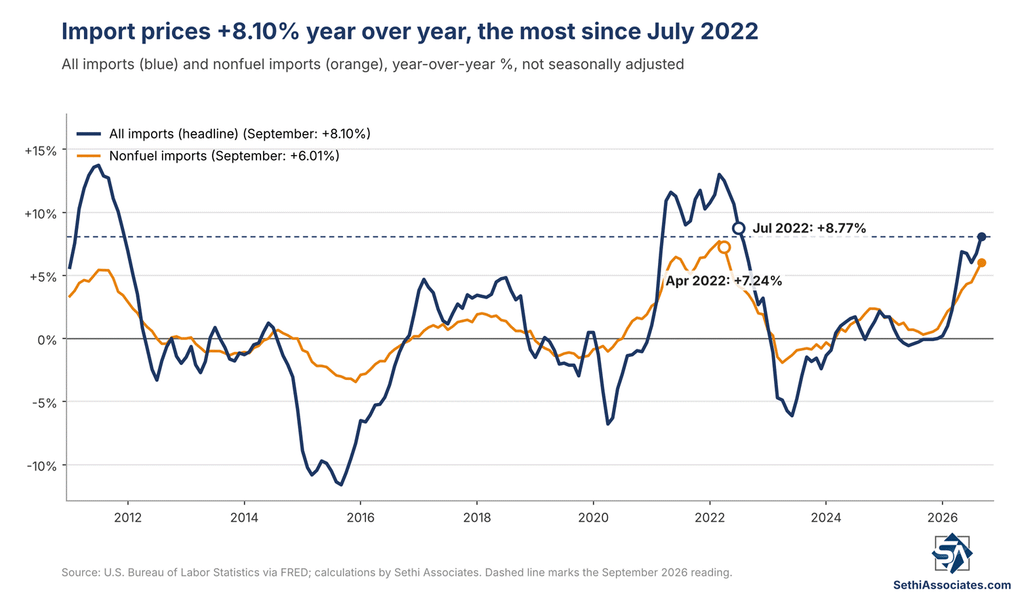
- Import prices rose 1.13% in September, the most since May, a touch above the 1.0% expected, after a downwardly revised 0.53% gain in August (initially reported as 0.7%). Prices were up 8.10% from a year earlier, the most since July 2022, just below the 8.2% expected.
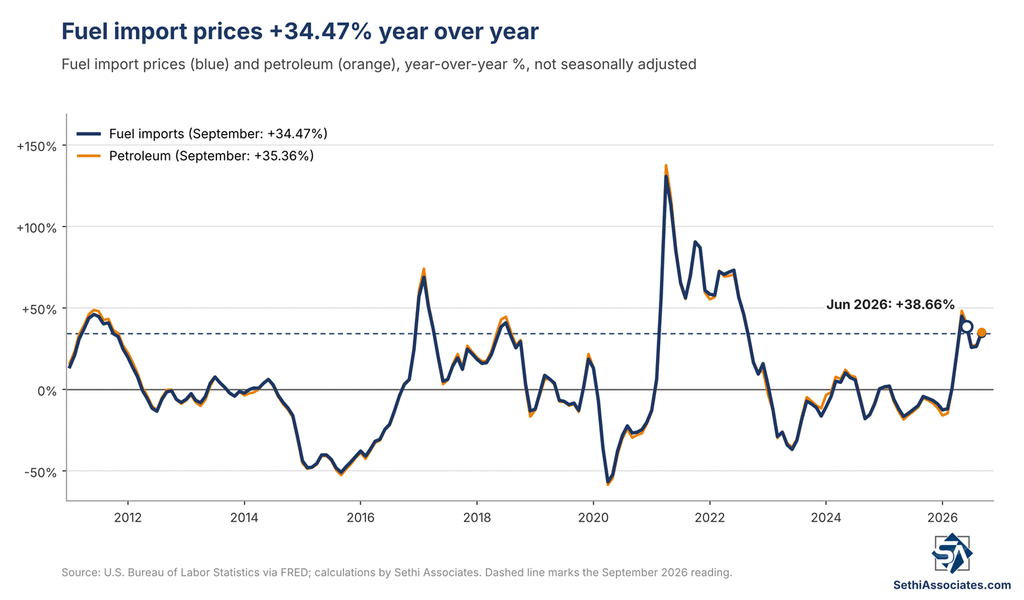
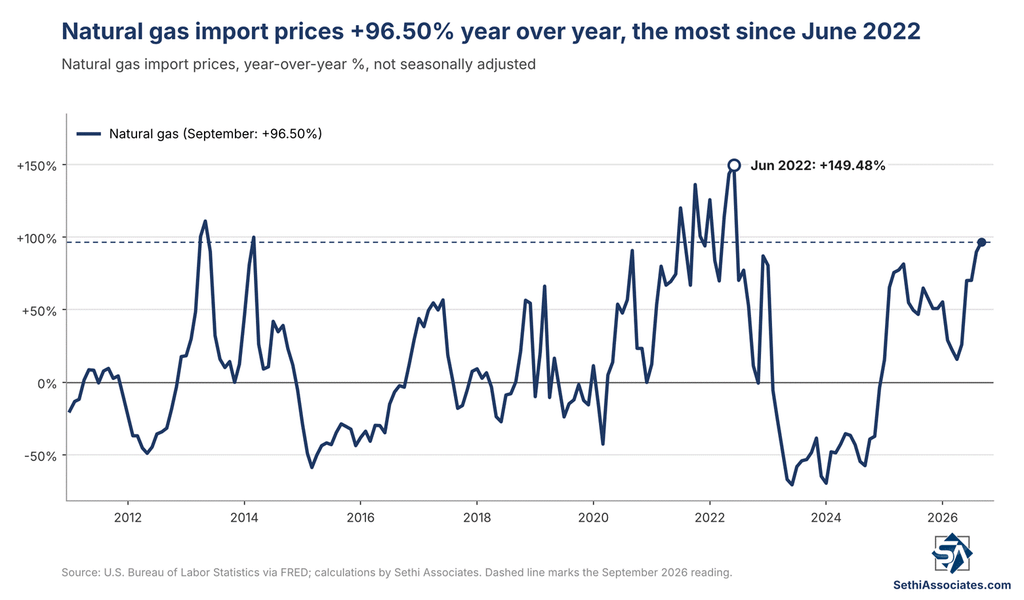
- Fuel rebounded. Fuel import prices rose 4.84% after three straight monthly declines, with petroleum up 4.59% and natural gas up 1.59%. Fuel prices are up 34.47% year over year, and natural gas 96.50%, the most since June 2022.
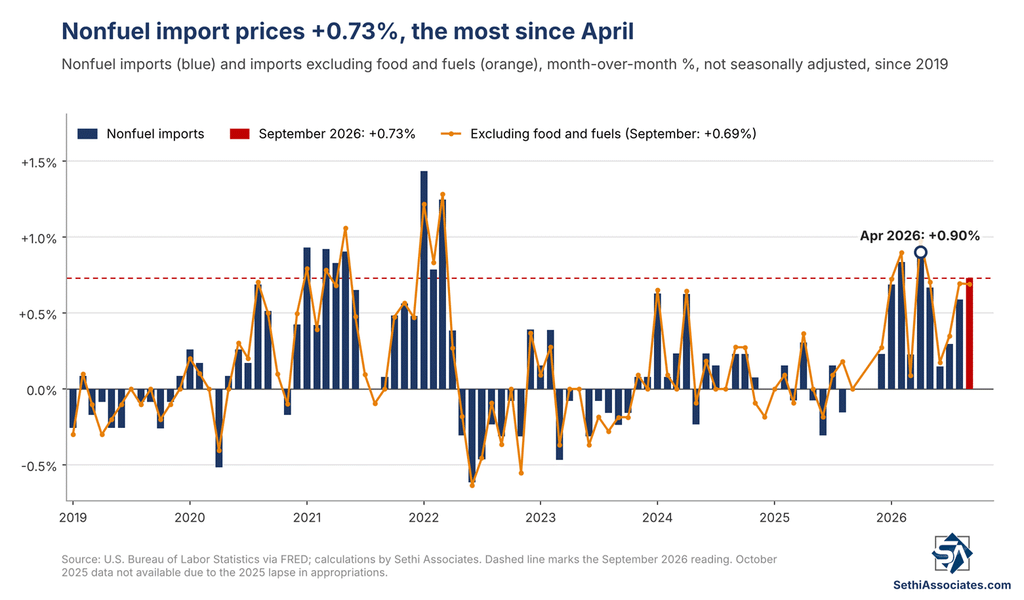
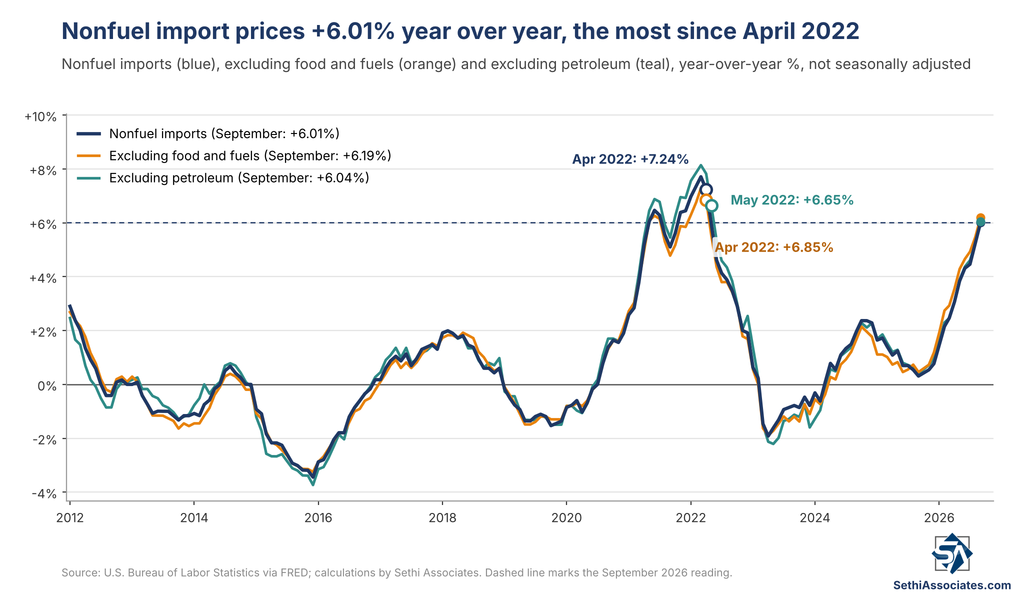
- Nonfuel prices kept climbing. Nonfuel import prices rose 0.73%, the most since April, and “have not declined on a monthly basis since August 2025,” according to the BLS. They are up 6.01% from a year earlier, the most since April 2022.
- The AI trade. Capital goods import prices are up 8.43% from a year ago, the most since December 1987, with nonelectrical machinery (about a quarter of all imports) up 10.41%, the most since March 1987. Semiconductor prices are up 36.10%, an eighth straight record in data back to 2006.
- China. Import prices from China rose 0.7%, the largest monthly advance since December 2021, according to the BLS, and are up 3.09% year over year, the most since June 2022. But export prices to China rose 2.71%, “the largest monthly rise since the index increased 5.0 percent in March 2022,” and are up 7.51% year over year, the most since July 2022.
- Export prices also jumped. Export prices were up 2.15%, well above the 0.9% expected, and are up 11.63% from a year earlier, the most since July 2022.
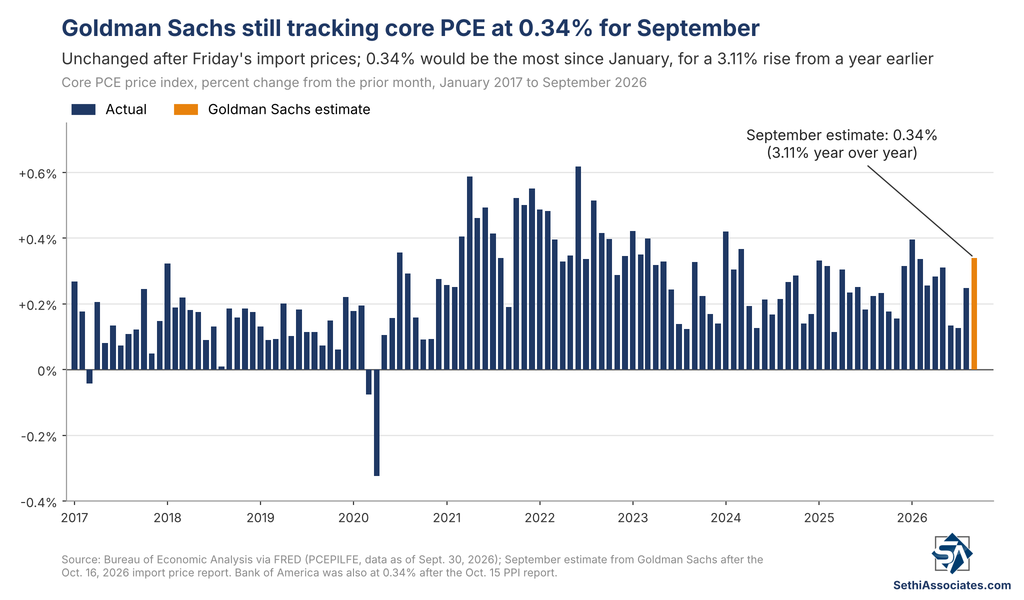
- The Fed angle. Goldman Sachs estimates the core PCE price index rose 0.34% in September, in line with its expectation before the report, for a year-over-year rate of 3.11%, and headline PCE 0.51%, or 3.64% from a year earlier. Goldman’s seasonally adjusted international airfares component, the source data for foreign travel in core PCE, was flat.

September Import Prices
September import prices rose 1.13%, the most since May (+1.76%) and a touch above the 1.0% expected, after a downwardly revised 0.53% gain in August (initially reported as 0.7%) and declines of 0.4% in July and 0.3% in June.
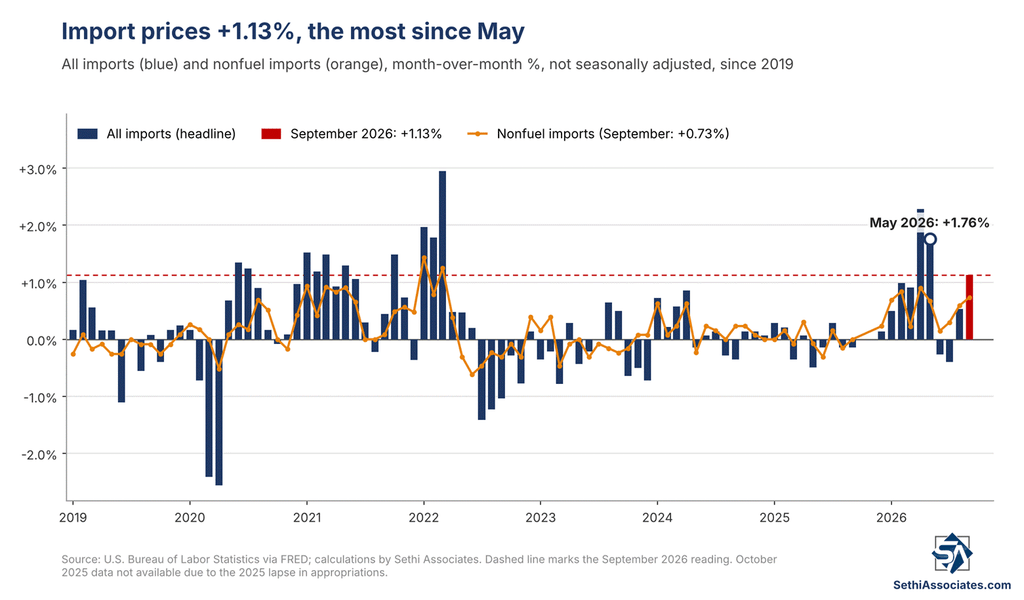
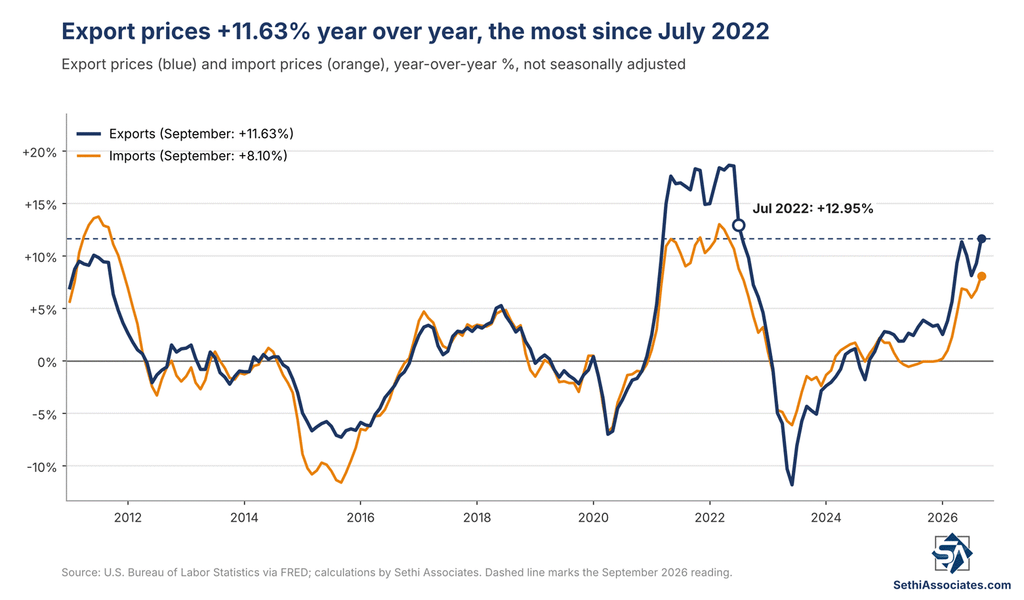
Year over year, import prices rose 8.10%, the most since July 2022 (+8.77%), just below the 8.2% expected, and up from a revised 6.74% in August.
Fuel
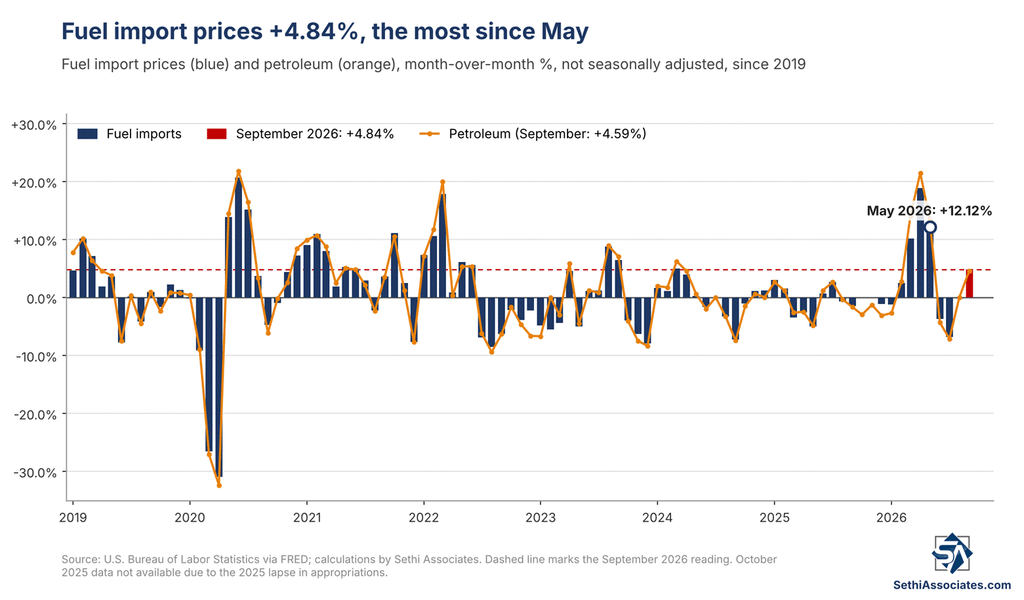
Fuel import prices (which include crude oil and petroleum products in addition to gasoline, diesel, etc.) rose 4.84%, the most since May (+12.12%), after three straight monthly declines of 3.72% in June, 6.84% in July and 0.19% in August. Petroleum and petroleum products rose 4.59%, with crude up 4.01%, and natural gas rose 1.59%.
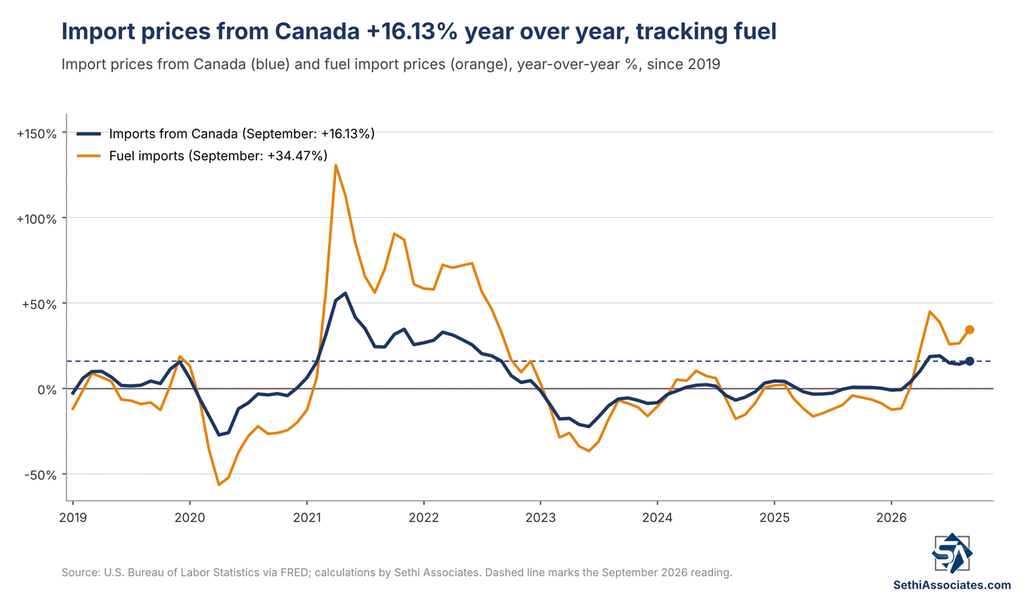
Year over year, fuel import prices are up 34.47%, from 26.40% in August, but still below June’s 38.66% and May’s 44.95%, which was the most since August 2022. Petroleum and petroleum products are up 35.36%.
Even with very low domestic prices, natural gas import prices are up 96.50% year over year, “the largest such movement since the index advanced 149.5 percent for the year ended June 2022,” according to the BLS.
Nonfuel Imports
Nonfuel import prices rose 0.73%, the most since April (+0.90%), after a revised 0.59% in August, and “have not declined on a monthly basis since August 2025.” “Higher prices for capital goods; nonfuel industrial supplies and materials; consumer goods, excluding automotives; as well as automotive vehicles, parts and engines drove the increase in September,” the BLS said. Excluding petroleum, prices rose 0.76%, above the 0.6% expected, and excluding food and fuels, they rose 0.69%.
Year over year, nonfuel import prices are up 6.01%, the most since April 2022 (+7.24%), up from 5.24% in August. Excluding food and fuels they are up 6.19%, also the most since April 2022, and excluding petroleum 6.04%, the most since May 2022.
Capital Goods and the AI Trade
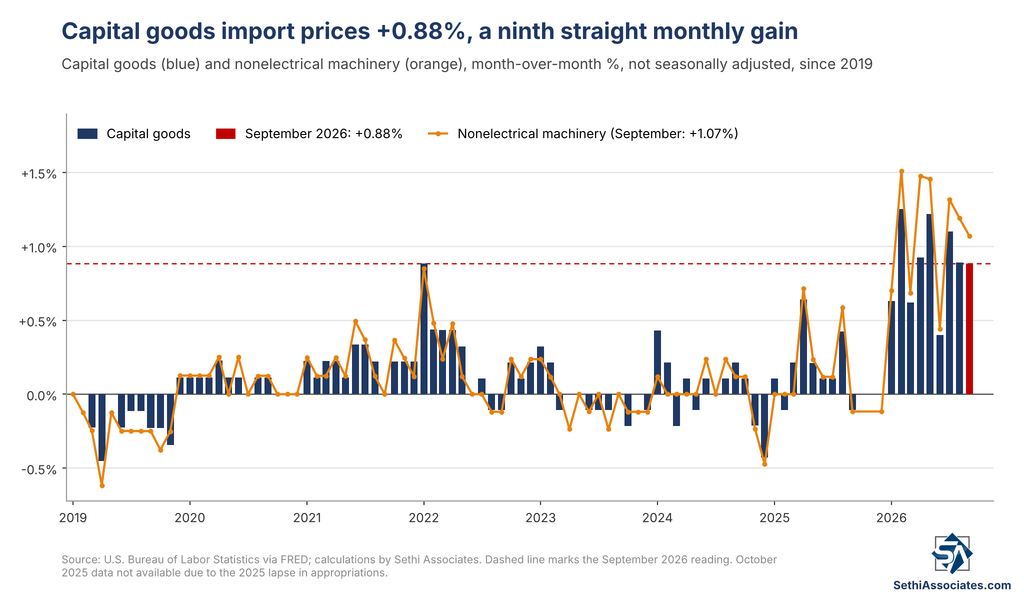
Capital goods import prices, which include many AI-related components, rose 0.88%, a ninth straight monthly gain, after a similar gain in August with “higher prices for computers, peripherals, and semiconductors as well as industrial and service machinery” that “more than offset lower prices for scientific and medical machinery.” Nonelectrical machinery rose 1.07%.
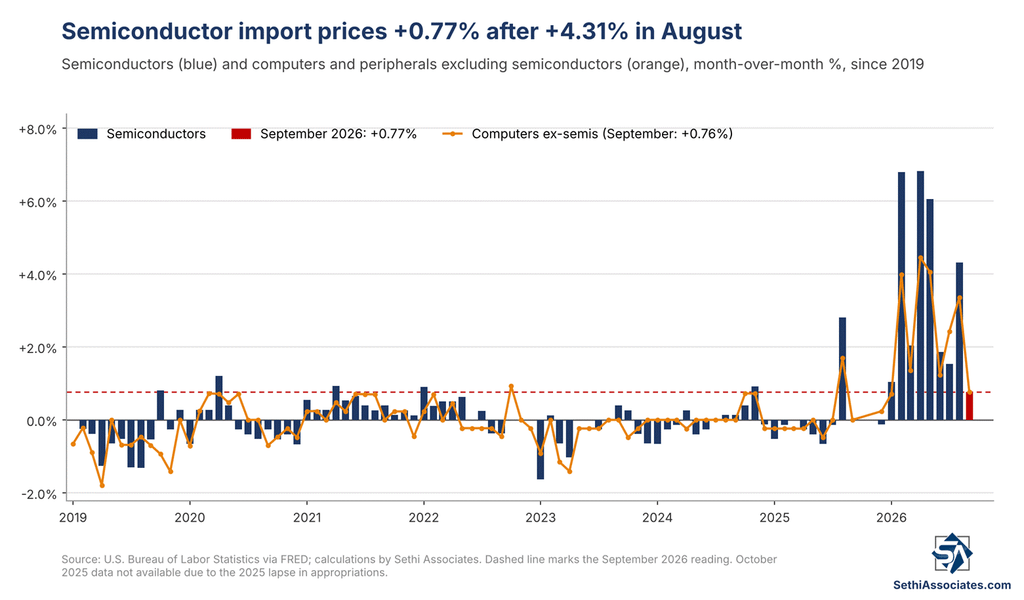
Month over month, semiconductor prices slowed to 0.77%, the least this year, after 4.31% in August, while computers and peripherals excluding semiconductors rose 0.76%, the least since January (+0.71%), after 3.36%.
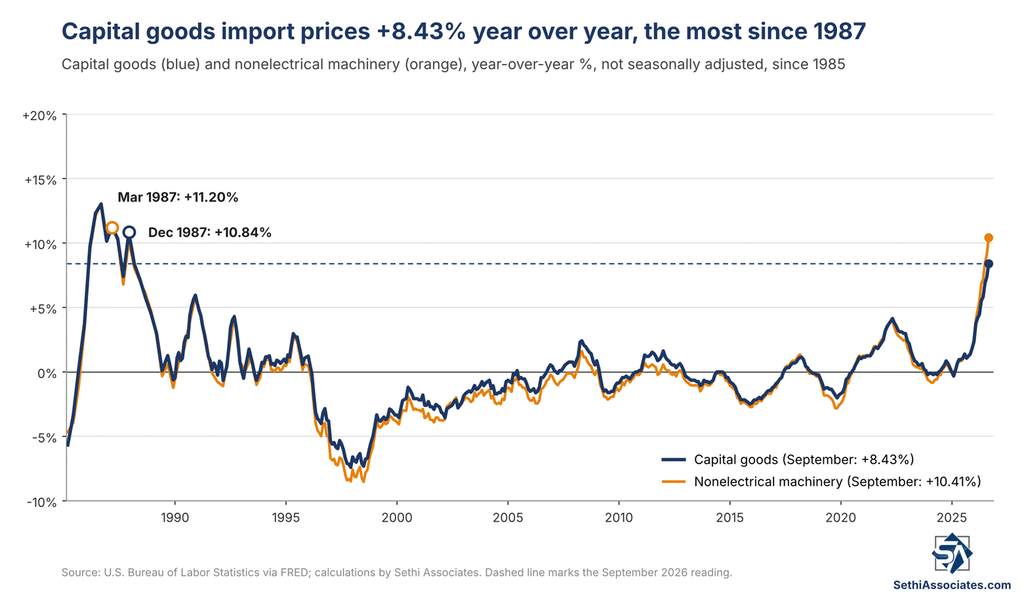
Year over year, capital goods import prices are up 8.43%, the most since December 1987 (+10.84%), from 7.37% in August, with nonelectrical machinery, which accounts for about a quarter of all imports, up 10.41%, the most since March 1987 (+11.20%). Excluding computers, peripherals and semiconductors, capital goods prices are up just 1.82% over the past year.
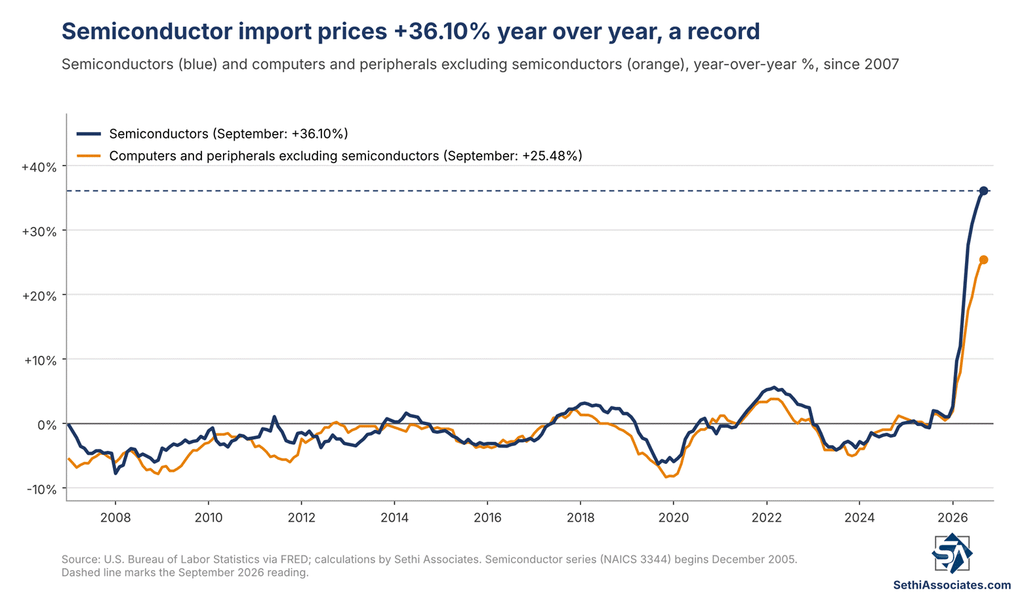
Semiconductor import prices are up 36.10% year over year, an eighth straight record in data back to 2006, while computers and peripherals excluding semiconductors are up 25.48%, a seventh straight record in data back to 1985.
Industrial Supplies
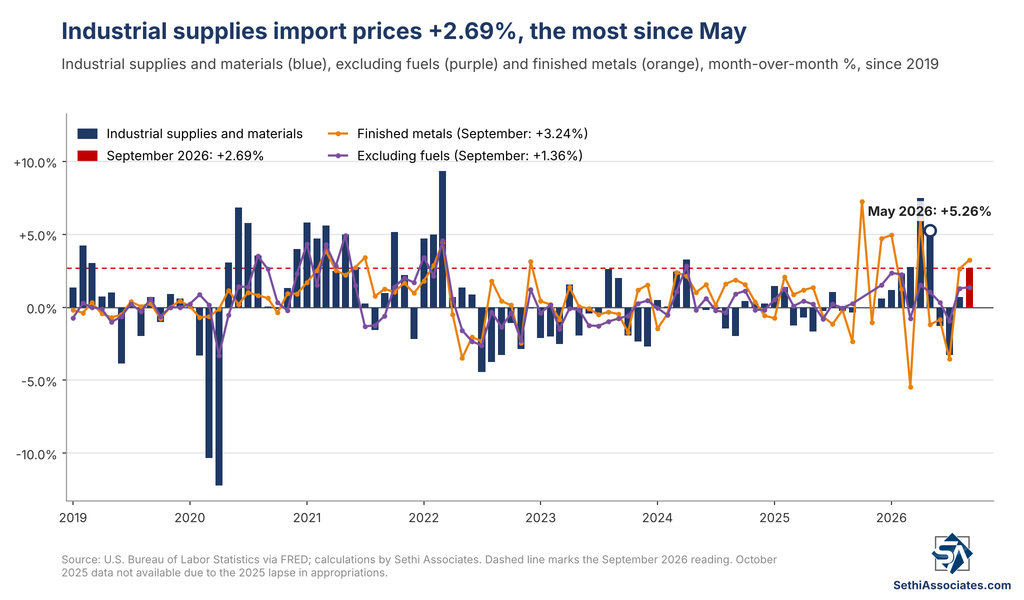
Industrial supplies and materials import prices rose 2.69%, the most since May (+5.26%), boosted by fuel. Excluding fuels, they rose a more modest 1.36%, but still the most since April, after 1.30% in August. “Higher prices for finished metals shapes and advanced manufacturing; finished nonmetals (boxes, belting, glass, etc.); and agricultural products used for industrial supplies and materials drove the increase in September,” the BLS said. Finished metals rose 3.24% and nonmetals 2.42%.
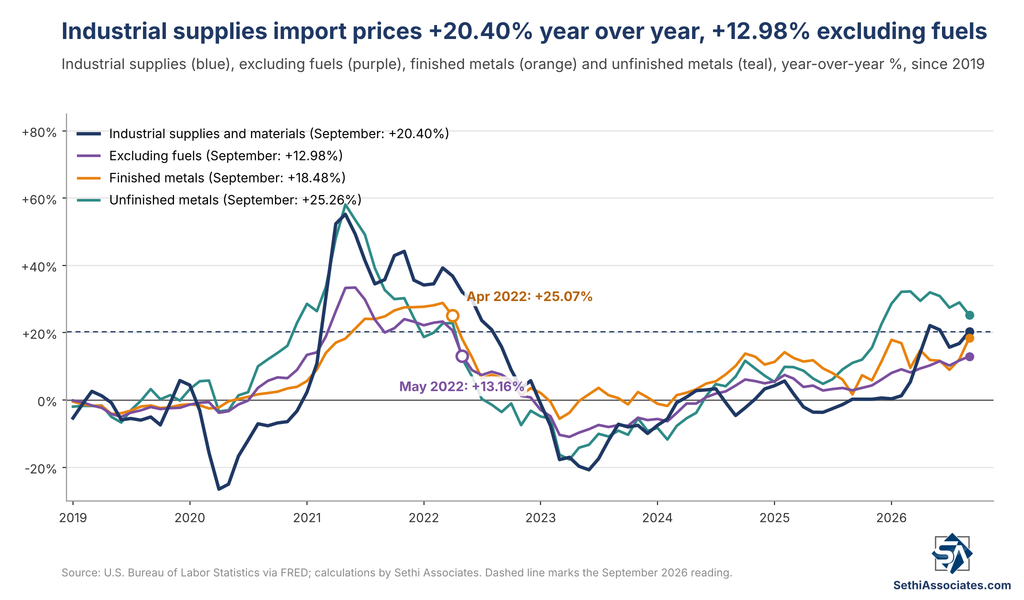
Year over year, industrial supplies and materials import prices are up 20.40%, just below June’s 20.86% and May’s 22.13%, which was the most since July 2022. Again, excluding fuel they are less elevated at +12.98%, but that is the most since May 2022 (+13.16%), up from 11.75% in August. Finished metals are up 18.48%, the most since April 2022 (+25.07%), while unfinished metals eased to 25.26% from 29.01% in August.
Consumer Goods, Autos and Food
Consumer goods import prices excluding autos rose 0.44% and are up 2.72% year over year, the most since April 2022 (+3.08%). Autos, parts and engines rose 0.33% and are up 1.08%, the most since March 2025 (+1.16%). Food, feeds and beverages were unchanged after a 0.61% decline in August, as “higher prices for vegetables, green coffee, and fruit offset lower prices for cane and beet sugar as well as fish and shellfish.” They are up 2.88% year over year.
Imports by Locality
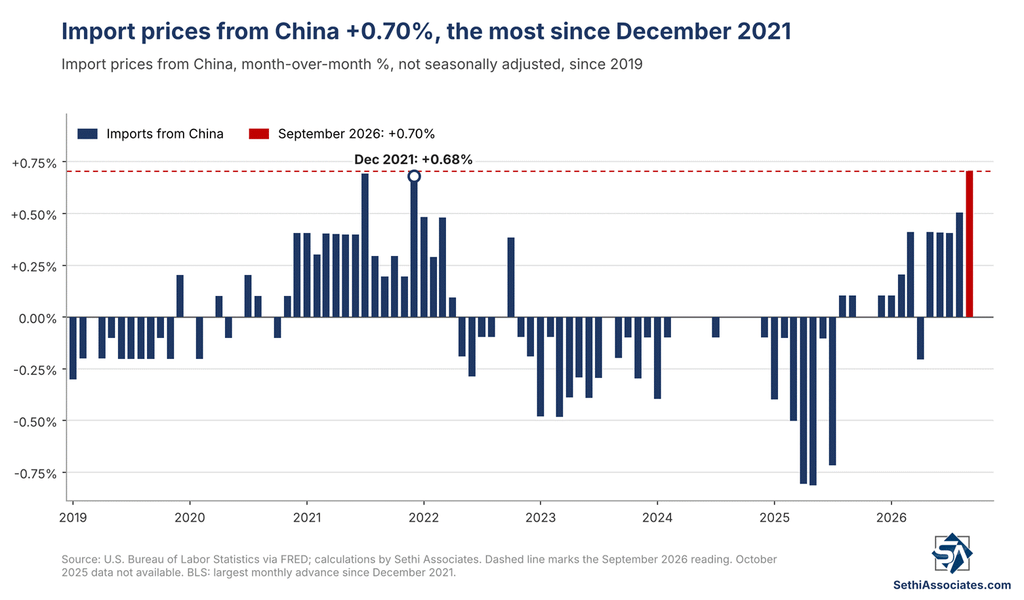
Import prices from China rose 0.7%, “the largest monthly advance since December 2021,” according to the BLS, after 0.5% in August (initially reported as 1.0%, which the BLS had called the largest since the index was first published in January 2004).
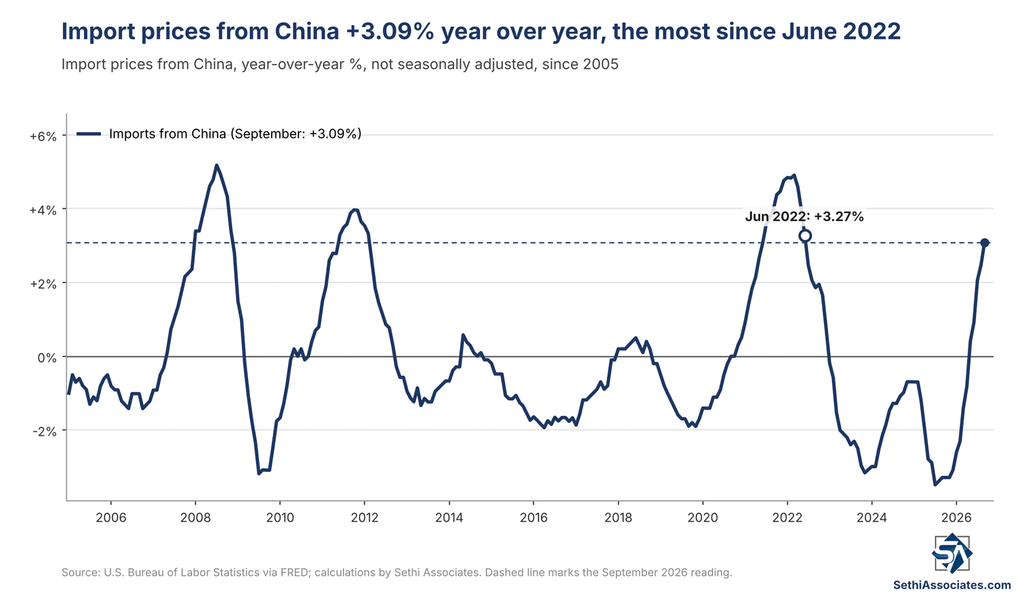
Year over year, import prices from China are up 3.09%, the most since June 2022 (+3.27%), from 2.47% in August.
Import prices from Canada rose 1.35% after declines of 0.72% in August and 2.36% in July, and are up 16.13% year over year, primarily on higher oil prices. That is below June’s 18.99%, which was the most since August 2022.
Import prices from Japan rose 0.6% and are up 1.1% year over year. Prices from the European Union rose 0.3% (+3.7% year over year), and from Mexico 0.6% (+3.3%).
Exports
Export prices jumped 2.15%, the most since April (+3.54%), well above the 0.9% expected, after an upwardly revised 1.21% in August (initially reported as 0.6%). Year over year they are up 11.63%, the most since July 2022 (+12.95%), above the 9.6% expected.
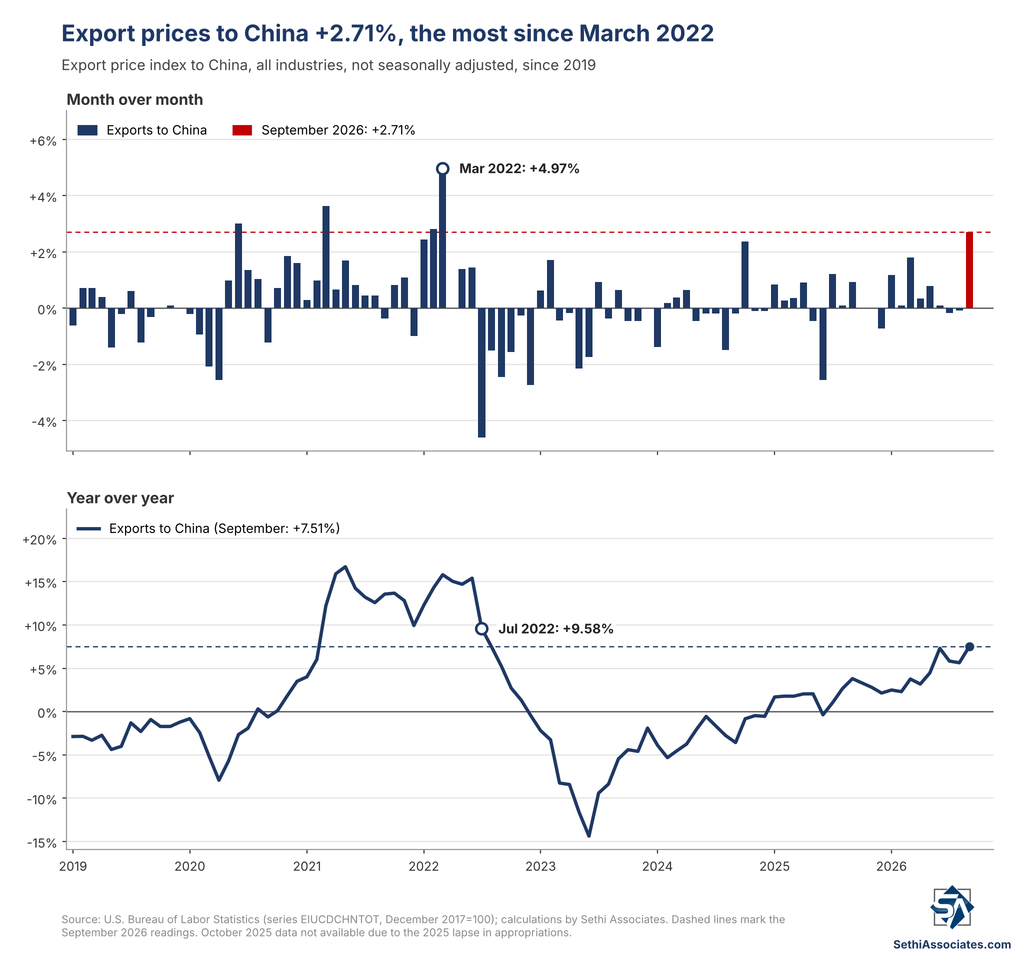
Agricultural export prices rose 2.6%, “the largest monthly rise since the index advanced 2.8 percent in November 2022,” on “higher prices for soybeans, corn, and wheat,” while nonagricultural export prices rose 2.1%. Export prices to China rose 2.71%, “the largest monthly rise since the index increased 5.0 percent in March 2022,” and are up 7.51% year over year, the most since July 2022. Export prices to the European Union rose 3.9%, which lifted the U.S. terms of trade index with the European Union 3.6%, “the largest 1-month advance for this index since percent changes were first published on a monthly basis in January 2018.”
Goldman Sachs
Goldman Sachs said the gain in core import prices (excluding petroleum) “largely reflected growth in industrial supplies and materials (+1.7%) and capital goods (+0.9%) import prices.” They noted import prices for computer peripherals and parts, which Goldman expects “to contribute to the modest upward pressure on core inflation from electronics prices, grew 1.1% month-over-month (SA by GS), its lowest this year.”
In terms of read through to core PCE, Goldman left their estimate unchanged at 0.34% m/m in September, “in line with our expectation prior to today’s import prices report, corresponding to a year-over-year rate of +3.11%. Additionally, we expect that the headline PCE price index increased 0.51% in September or increased 3.64% from a year earlier.”
The international airfares component of import prices, “which is the source data for the foreign travel component of core PCE, was flat (SA by GS),” according to Goldman. On an unadjusted basis, the BLS index for import air passenger fares rose 12.6% after declines of 11.2% in August and 11.0% in July.