The Run-Up to Black Monday in 1987 Looks a Lot Like 2026
While there are some similarities to 1987, there are also some major differences.
You've reached your free article limit
You've read 0 of 1 free Pro articles.
It was another brutal day for the market Friday. Oil blasted higher, with the United States Brent Oil Fund (BNO) up about 3.7% to a new all-time high. The VanEck Semiconductor ETF (SMH) was rocked for a 3.3% loss, the SPDR S&P Biotech ETF (XBI) dropped 3.8% and the Roundhill Magnificent Seven ETF (MAGS) declined 2%.
Breadth was about 30% positive, but what was most interesting was that the number of new 12-month lows declined to around 400 from more than 600 earlier this week. That is an indication that there was some bottom fishing in the hardest-hit stocks. Some brave traders are trying to nail the turning points in broken names.
Another interesting aspect was that bonds finished close to flat, with the iShares 20+ Year Treasury Bond ETF (TLT) barely changed even as oil jumped nearly 4%. That tells us the selling in stocks wasn’t driven by fear of higher rates. The more likely explanation is that money is coming out of stocks and bonds remain a safe place to park it, because they are offering attractive yields.
This week’s CPI report triggered a major market shift, and the transition isn’t over yet. The big gap between the two tiers of the market is starting to narrow. I’m optimistic about how things will develop as we move into earnings next week, but it is interesting to look back at what happened 39 years ago.
A Date Veterans Remember
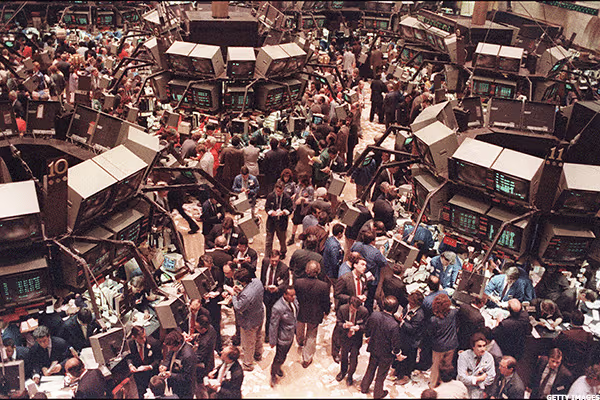
Monday is Oct. 19. That date makes veteran market players a little uneasy, because on Monday, Oct. 19, 1987, the S&P 500 fell 20.47% and the Dow Jones Industrial Average lost 22.6% in a single session. It is still the largest one-day percentage drop on record.
I don’t think the calendar is predictive of anything, and I’m not suggesting that we are about to see a repeat. But there are some interesting historical parallels. History is always the same because markets move in cycles, but it is always different as well.
The Same Calendar
The first coincidence is the calendar itself. 1987 and 2026 share the same calendar. Both are non-leap years that began on a Thursday, so every date falls on the same day of the week. Oct. 19 was a Monday then, and it is a Monday now.
The Week Before
The more interesting parallel is the week leading up to it. On Wednesday, Oct. 14, 1987, the Commerce Department reported a much bigger trade deficit than expected. Interest rates jumped, and the Dow fell 3.8%. This week, it was a hot core CPI report on Wednesday that pushed inflation fears higher and produced the worst action we had seen in months.
On Friday, Oct. 16, 1987, the Dow fell 4.6%, its first 100-point drop ever. That Friday was also monthly options expiration, just like this Friday. And just like this Friday, it was ugly. It wasn’t nearly as bad as 1987, but it was one of the most extreme trend-down days we have seen this year, especially for growth stocks. The Innovator IBD 50 ETF (FFTY) was down 10% this week.
The backdrop rhymes as well. In 1987, interest rates had been climbing all year, and Alan Greenspan, who had taken over the Fed in August, raised the discount rate in early September. This year, the Fed raised rates in September for the first time in three years, and the 10-year Treasury yield has been above 5%. In both cases, rising rates made bonds more attractive relative to stocks after a long run. The S&P 500 had tripled from August 1982 to August 1987.
Where the Parallel Breaks Down
There are important differences, however. The biggest is Thursday. In 1987, the selling built for three straight days. The Dow fell another 2.4% on Thursday, Oct. 15, 1987 and there was no relief before Monday. This week, Thursday was one of the best days we have seen in a while. Bonds rallied, breadth was about 65% positive and money rotated into the stocks that had lagged for so long.
The bond market is also behaving differently. In 1987, the bad trade report sent interest rates soaring, and that pulled money out of stocks. This week, the hot CPI report pushed inflation fears higher, but bonds rallied and yields eased as money looked for safety. Rather than adding to the pressure on stocks, the bond market has been taking some of it off.
The structure of the market has changed as well. In 1987, a strategy called portfolio insurance used computer models that kept selling as prices fell, and there was nothing to slow it down. The New York Stock Exchange adopted trading curbs in 1988, and circuit breakers that halt trading after steep declines are now standard.
Finally, much of the damage in this market has already happened. In 1987, the market fell from its highs all at once. Today, the majority of stocks have already been through a bear market while the indexes hid it. The pain has been spread out over months rather than concentrated in a single day.
The Lesson
Black Monday is a reminder that markets will do their best to surprise us. The more useful lesson, though, is what happened afterward. The next morning, the Fed issued a brief statement that it stood ready “to serve as a source of liquidity.” The Dow recovered more than half of its loss within two sessions, and the S&P 500 still finished 1987 with a small gain. It retested its lows into early December, and it took until July 1989 to get back to its pre-crash high, but the investors who stayed strategic and calm were rewarded.
The folks who were hurt the most were caught with too much exposure and no plan. The ones who managed risk and had cash to put to work when the panic passed did well. That is the approach I’m taking now. I respect the risk, keep some dry powder and stay focused on the opportunities that develop when others are forced to sell.
Have a great weekend. I’ll see you on Monday.
At the time of publication, Rev Shark had no positions in any securities mentioned.