The Week Ahead: CPI and Equity Flows Test a Shaken Market
After its worst week since April 2025, the S&P 500 looks to bounce back. Positioning is cleaner, but are traders ready to get back in?
You've reached your free article limit
You've read 0 of 1 free Pro articles.

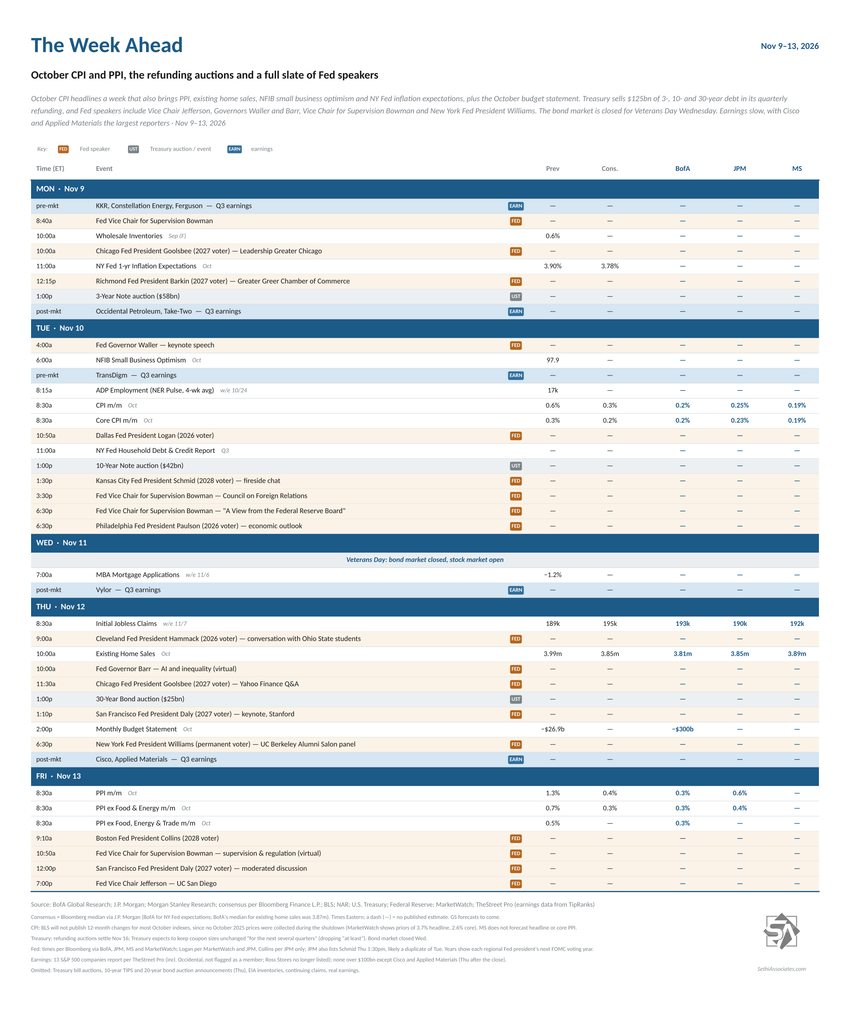
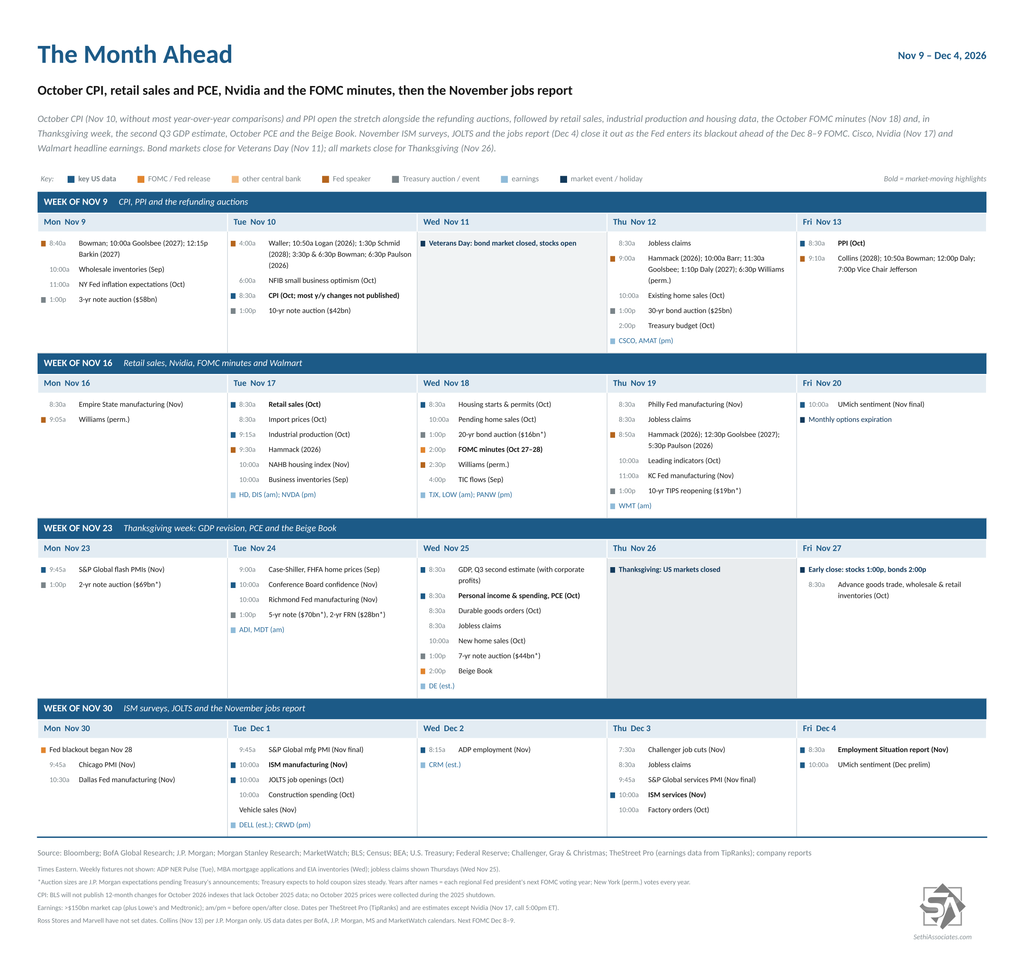
After a packed week, things ease off, but we do get key readings on inflation, a slew of Fed speakers and the return of Treasury auctions. It’s a lighter week for earnings as we await Nvidia later this month (and Broadcom and Micron in December), but we will hear from AI beneficiaries Cisco and Applied Materials as well as AI cloud provider CoreWeave, one of the hardest hit names in the selloff.
US economic reports are headlined by Tuesday’s October CPI. Bloomberg consensus is for headline and core CPI to rise 0.3% and 0.2% m/m, respectively, after 0.6% and 0.3% in September. It’s also the last CPI report before the December FOMC meeting, as JPM notes. Note that BLS won’t publish 12-month changes for most October CPI indexes, since no October 2025 prices were collected during the shutdown.
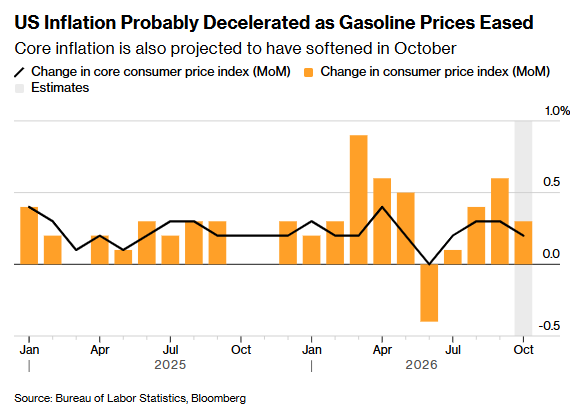
Other October reports are PPI Friday, NFIB small business optimism, NY Fed 1-year inflation expectations, existing home sales and the Monthly Budget Statement. We’ll also get final September wholesale inventories, the NY Fed’s Q3 Household Debt and Credit Report and the usual weekly reports (ADP, mortgage applications, unemployment claims, etc.).
Plenty of Fed speakers this week. Fed Vice Chair for Supervision Bowman speaks Monday, Tuesday and Friday, Chicago Fed President Goolsbee (2027 voter) Monday and Thursday, and Richmond Fed President Barkin (2027 voter) Monday. Governor Waller, Dallas Fed President Logan (2026 voter), Kansas City Fed President Schmid (2028 voter) and Philadelphia Fed President Paulson (2026 voter) speak Tuesday. Cleveland Fed President Hammack (2026 voter), Governor Barr, San Francisco Fed President Daly (2027 voter), Schmid again and New York Fed President (and FOMC Vice-Chair) Williams (permanent voter) speak Thursday. Boston Fed President Collins (2028 voter), Bowman, Daly and Vice Chair Jefferson speak Friday.
Non-Bill (>1yr in maturity) US Treasury auctions bring the quarterly refunding: a $58bn 3-year note Monday, a $42bn 10-year note Tuesday and a $25bn 30-year bond Thursday, all at 1:00pm ET. Sizes were unchanged at the refunding announcement, with no cut to 20- and 30-year bonds, which disappointed bond bulls (Treasury Refunding Disappoints Bond Bulls). Note: The bond market is closed Wednesday for Veterans Day; the stock market is open.
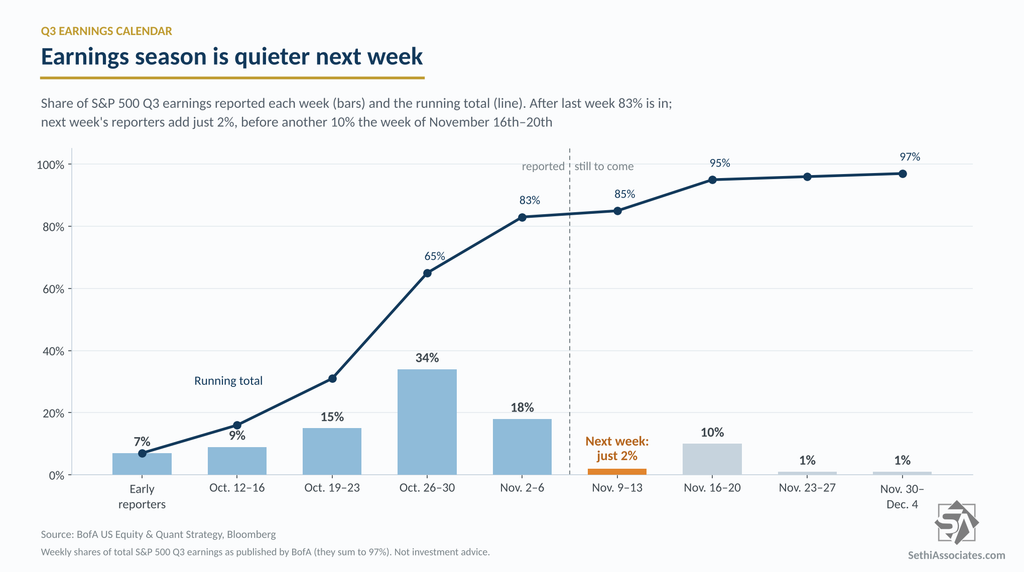
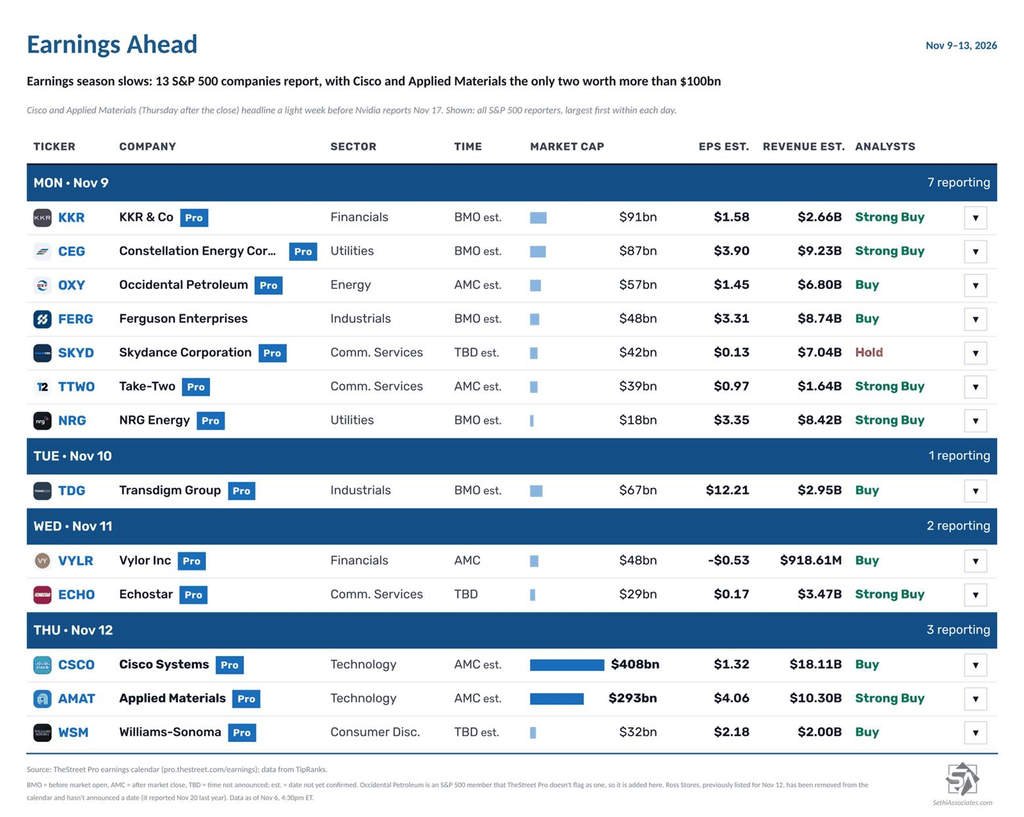
Meanwhile, Q3 earnings season slows, with 13 S&P 500 components reporting (2% of index earnings, according to BofA), two of them with market caps over $100bn:
• Thursday: Cisco (CSCO) and Applied Materials (AMAT).
Other S&P 500 reporters include KKR (KKR), Constellation Energy (CEG), Occidental Petroleum (OXY), Ferguson (FERG), Skydance (SKYD), Take-Two (TTWO) and NRG Energy (NRG) Monday; TransDigm (TDG) Tuesday; Vylor (VYLR) and EchoStar (ECHO) Wednesday; and Williams-Sonoma (WSM) Thursday.
Outside the S&P 500, we’ll hear from CoreWeave (CRWV), Petrobras (PBR), Sea (SE), Honda (HMC), Nu Holdings (NU), Nebius (NBIS) and Japanese megabanks Mitsubishi UFJ (MUFG), Sumitomo Mitsui (SMFG) and Mizuho (MFG).
Ex-US highlights from Deutsche Bank:
“Elsewhere, highlights include Chinese inflation and trade data as well as Q3 GDP in the UK [Thursday]… Our UK economists expect September’s monthly GDP to shrink marginally by -0.1% MoM but Q3 as a whole to jump by +0.7% QoQ… There will also be October CPI prints due in Denmark and Norway on Tuesday.
“Over in Asia, China’s October CPI and PPI on Monday and trade balance on Tuesday will be the principal releases. Our economists expect PPI inflation to edge up further to 5.2% YoY in October (5.0% in September) and CPI inflation is also expected to improve to 1.0% YoY from 0.9%. On trade, they see export growth moderating to 31% YoY from 36%… In Japan, notable economic releases feature the October Economy Watchers survey and September household spending on Tuesday, followed by October PPI on Thursday. The BoJ’s summary of opinions from its October monetary policy meeting is due Tuesday…
“Elsewhere in the region, New Zealand holds a general election [Saturday]. Briefly turning to geopolitics, next week’s events include a G7 foreign ministers meeting in France on Monday and Tuesday, while US-mediated talks between Russia and Ukraine are expected for Tuesday and Wednesday. The European Political Community Summit takes place on Thursday, followed by an informal meeting of EU heads of state or government on Friday.”
And here is a link to TipRanks’ Economic Calendar.
And a link to Bloomberg’s Week Ahead (gift link).
And a link to Christophe Barraud’s international Week Ahead rundown.
This post will go through in order (in case you want to skip around): the economy, the Fed and interest rates, earnings, valuations, breadth, positioning, sentiment, seasonality, and then my wrap-up.
Blowout Jobs Report Sends Citi Surprise Index to Highest Since August 2023
Looking first at the economy, my intro has remained the same since the start of the Iran conflict (and longer term, more or less all of the past five years – I’ve not had a recession probability above 40% since the pandemic): “we continue to see it weathering the various storms remarkably well due in large part to resilient consumption (boosted by huge increases in wealth over the past few years despite slowing incomes) and AI-spending… with data of late showing a stable (and perhaps accelerating) economy, but one that is also boosting inflation.”
Last week was heavy on data, and for the most part it remained consistent with the foregoing, perhaps tilting towards the “perhaps accelerating” side:
• October nonfarm payrolls rose 165,000, more than double the 62,000 expected and above all 79 forecasts in Bloomberg’s survey, with August and September revised up a combined 84,000. The unemployment rate fell back to 4.1% and average hourly earnings rose 0.4% (October Payrolls Top Every Forecast as Unemployment Falls Back to 4.1%).
• The ISM manufacturing index rose a point to 55.5, the highest since July, with production at its highest since November 2021, while prices paid eased to 75.2 but have risen for 25 straight months (ISM Manufacturing Accelerates, Production Hits Highest Since 2021).
• S&P Global’s final manufacturing PMI eased to 54.9 from a 52-month high, but still “above the critical 50.0 no-change mark for a fifteenth successive month” although with prices rising the most since 2022 (S&P Manufacturing PMI Eases From 52-Month High but Prices Rise the Most Since 2022).
• September factory orders rose 1.8%, above the 1.2% expected and the most since April, with orders excluding transportation up 1.3% and final durable goods orders revised up to a 1.9% gain from 1.8%.
• The ISM services index eased to 54.5, but all 10 of its indexes were in expansion for only the second time since March 2021, and prices paid (73.0) have been above 70 in seven of the past eight months (ISM Services Cools, but 12-Month Average Rises for 10th Straight Month). S&P Global’s final services PMI was revised down to 56.1 from the 57.9 flash (S&P Services PMI Decelerates as Sentiment Slides).
• S&P Global’s final services PMI was revised down to 56.1 from the 57.9 flash, but still “comfortably above trend” (S&P Services PMI Decelerates as Sentiment Slides).
• September JOLTS job openings rose 333,000 to 7.52 million, topping every estimate in Bloomberg’s survey of economists, quits jumped 321,000, the most since May 2023, hires rose the highest since March, while layoffs fell (JOLTS Report Strong Across the Board).
• ADP’s October private payrolls rose 86,000, above the 75,000 expected, lifting the three-month average for the first time since June, while job-changers’ pay growth hit 7.6%, the fastest since March 2024 (ADP Hiring Beats as Job-Switchers’ Pay Growth Hits Fastest Pace Since 2024).
• Initial jobless claims fell to 189,000, matching July’s low as the joint-lowest since 1969, with the four-week average the lowest since September 1969 (Initial Jobless Claims Drop Back to Joint-Lowest Since 1969).
• Challenger job cuts were the fewest for an October since 2023, while economic conditions passed AI as the top reason cited this year (October Job Cuts at 3-Year Low as Focus Turns to Economic Conditions).
• Q3 productivity rose 3.6% annualized, the most in a year, and unit labor costs fell 0.7%, though labor’s share of output hit another record low (Q3 Productivity Hands Fed Doves Some Ammo, but Workers’ Share Hits a Record Low).
• Preliminary November University of Michigan consumer sentiment rose to 51.0, the highest since August, and year-ahead inflation expectations fell to 4.3%, though interviews ended before Thursday’s selloff (Consumer Sentiment Rebounds to a Three-Month High as Inflation Expectations Ease).
• September construction spending fell 1.85%, the most since April 2020, but on a record drop in the often revised implied remodeling metric, while data center spending was up 90% from a year ago (Construction Spending Drops the Most Since April 2020 on Record Remodeling Decline).
• The Fed’s Senior Loan Officer Survey showed business loan demand weakening for firms of all sizes for the first time since Q2 2025, and banks tightened standards on loans to nonbank lenders, including private credit (Bank Business Loan Demand Falls Despite Surging Equipment Spending).
• October auto sales slipped to a 15.5 million annual rate, short of the 15.8 million expected, even as incentives rose (October Auto Sales Slip Even as Incentives Rise).
Turning to the jobs report, JPM’s Feroli said he sees “a few hints” that a better labor market is ending the wage disinflation of the past few years. Average hourly earnings growth re-touched its 3.1% y/y cycle low, but earnings rose 0.4% m/m (4.5% annualized) in October, lifting the three-month rate to 3.9% annualized from 2.4% in May, and with solid job growth, aggregate earnings (the payroll proxy) are “rising 6.2% saar over three months, equaling the fastest rise of the last few years.” The September JOLTS quit rate also edged up 0.2 points to 2.1%, the first time at that level since the middle of last year.
But Feroli isn’t ready to say the labor market has turned:
“Even as nonfarm payroll growth has accelerated over recent months, there is still a question mark on whether the labor market has materially picked up from a few months ago. Certainly GDP growth was good in 3Q and business surveys look decent in October, which would be supportive of faster job gains. But the unemployment rate has hardly budged over the last few months and remains right in line with where it was from mid-2024 to mid-2025… The good part of the business surveys is that they’ve paired high price measures with high activity measures. That theme held up in most respects in October, though there has been a material step down in the ISM services measures of business activity and new orders.“
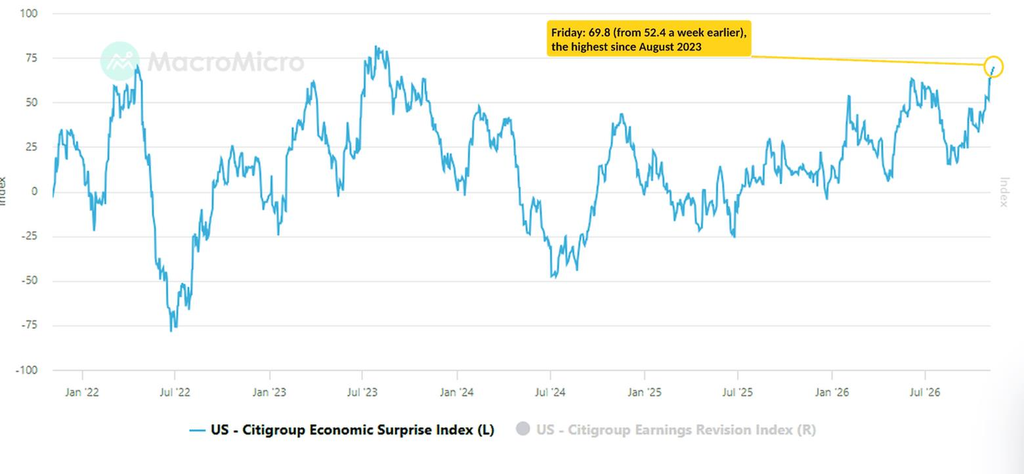
With the data continuing to come in better than expected, the Citi US Economic Surprise Index jumped to 69.8 on Friday, its highest since August 2023, up from 52.4 a week earlier.
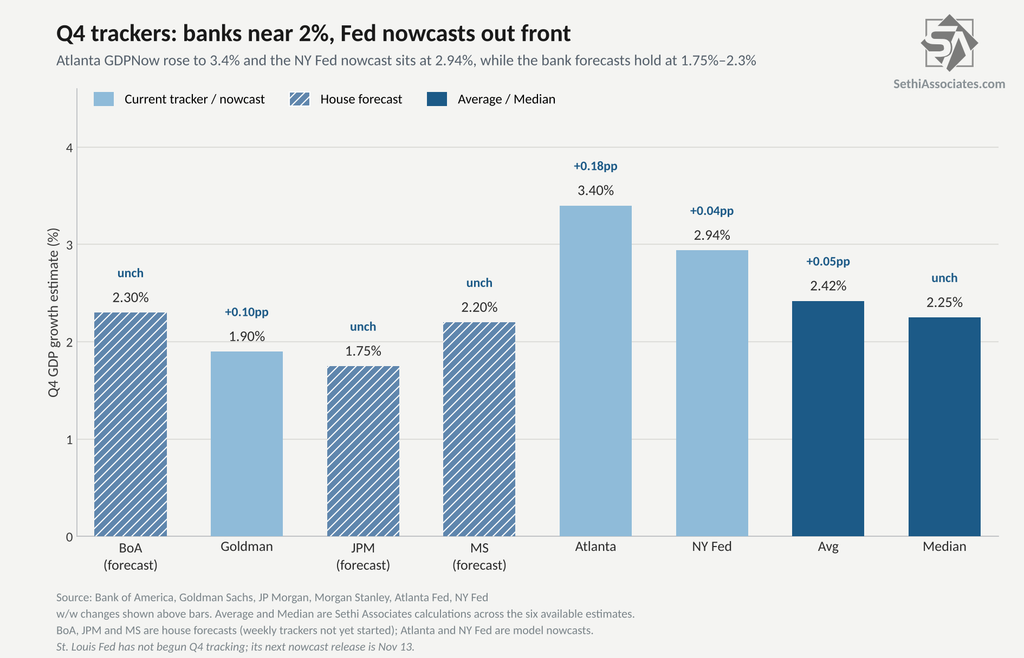
Looking at the Q4 GDP trackers, the early readings remain spread out, which is not unusual at the start of a quarter. Goldman raised its tracker 0.1 point to 1.9% (from its 1.8% start) after the September trade report, while the Atlanta Fed’s GDPNow rose slightly from the prior week to 3.44% as of November 4th (its next update is Monday). The NY Fed’s Nowcast edged up to 2.94% from 2.90%. BofA, JPM and Morgan Stanley’s forecasts are unchanged at 2.3%, 1.75% and 2.2%, and those are all house forecasts with BofA not initiating yet their GDP tracker. The St. Louis Fed also hasn’t begun (its first nowcast is November 13th). That leaves Goldman just below the Blue Chip consensus of roughly 2.1% and GDPNow well above it. Across the six, the average is 2.42% and the median 2.25%.
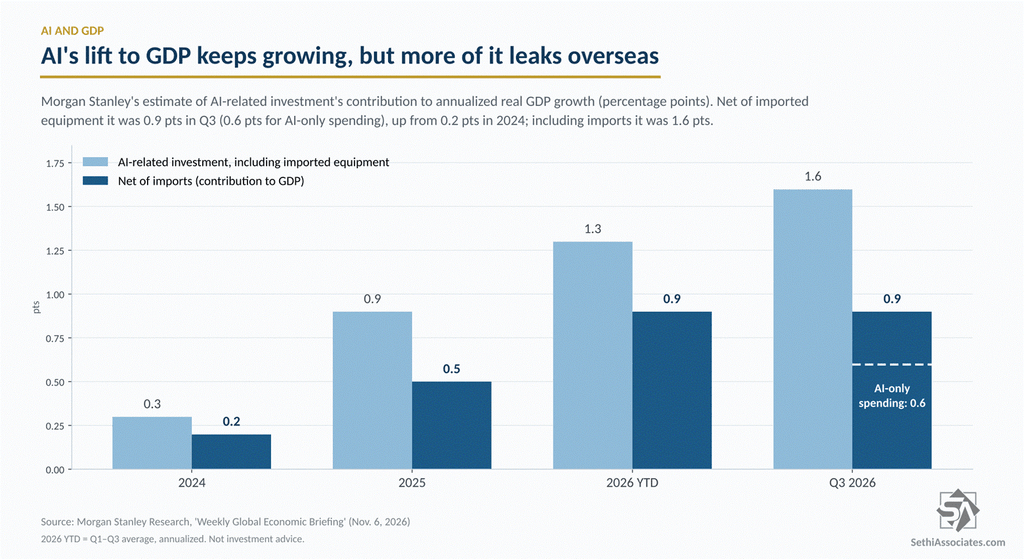
With AI in focus this week, both JPM and Morgan Stanley dove into how much of growth has been coming from AI. MS estimates broader AI-related spending contributed 0.9 points to annualized real GDP growth in Q3 (0.6 points for AI-only spending), matching its 2026 year-to-date pace and up from 0.5 points in 2025 and 0.2 points in 2024, with more than three-quarters of it going to infrastructure rather than adoption. Including imported equipment, AI-related investment contributed 1.6 points in Q3, versus 1.3 points so far this year, 0.9 points in 2025 and 0.3 points in 2024, so a growing share of the spending “supports growth elsewhere, primarily in Asia.”
JPM though comes to a different conclusion saying once you net out imports, data centers’ “pure accounting contribution to the national accounts is small or sometimes negative, because the surge in investment has been matched by a rising tech trade deficit.”
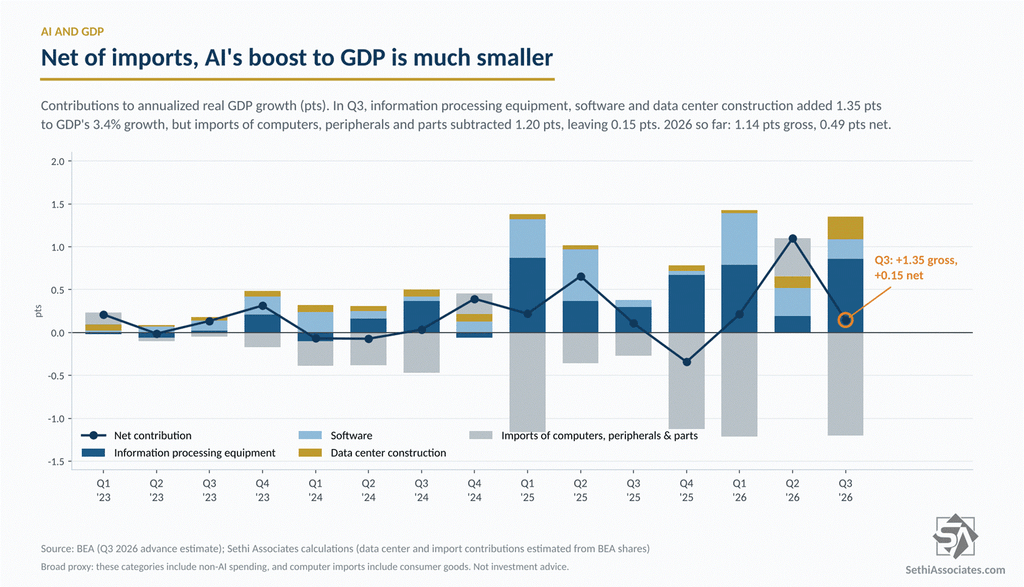
A look at BEA’s data supports that contention. Information processing equipment, software and data center construction added 1.35 points to Q3’s 3.37% growth, but imports of computers, peripherals and parts subtracted 1.20 points, leaving just 0.15 points. So far this year those categories have added 1.14 points gross but 0.49 points net, and over the past four quarters 1.05 points gross vs 0.28 points net.
It’s a broad proxy (the categories include non-AI spending, and computer imports include consumer goods), but it shows why JPM says a moderate slowdown in data center investment “has much less of an effect on growth than implied by looking only at investment spending without accounting for net trade.” Data center construction itself hit a record $83bn annual rate in Q3 (in BEA data back to 2020), up 69% from a year ago and more than six times its Q3 2022 level.
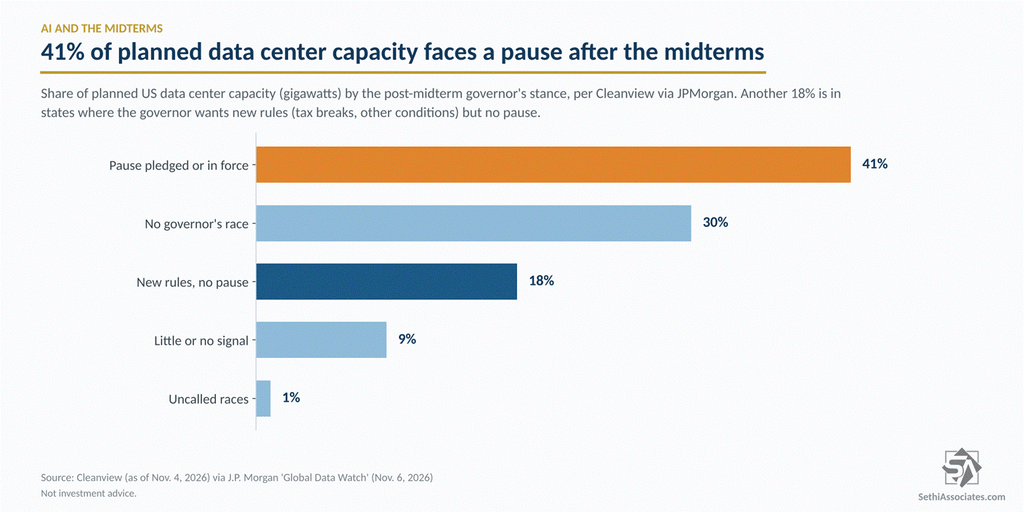
JPM notes Democrats won governor’s races in three of the four largest states for the data center buildout (two of them on campaigns promising to slow or halt new construction), and over 40 local ballot initiatives voted to restrain new data center developments. Per Cleanview, 41% of planned data center capacity is in states where the post-midterms governor has pledged a pause or one is already in effect, and another 18% is in states where the governor wants to adjust rules like tax breaks.
Looking broader than just the accounts highlighted above, JPM estimates consensus expectations for 40% hyperscaler capex growth next year, measured by the flow of capital services from the new equipment, would add about 0.6 points to GDP growth, so cutting that growth in half would mean a drag of a few tenths from that channel alone. MS sees the state-level measures as “more likely to affect the timing and location of AI investment than to end the boom,” and says its base case for roughly $1.6 trillion of hyperscaler capex in 2027 “remains intact.” JPM (Feroli) also notes “much of the capex expected for next year is for projects that are already underway.”
BofA (Juneau) agrees the midterms make more regulation likely, but says regulation “may slow the investment boom, but only marginally,” and doesn’t expect it to affect “the nearly 70GW (more than double current capacity) of data center power that is currently under construction,” so it still expects AI investment to contribute 30–50bp to growth next year.
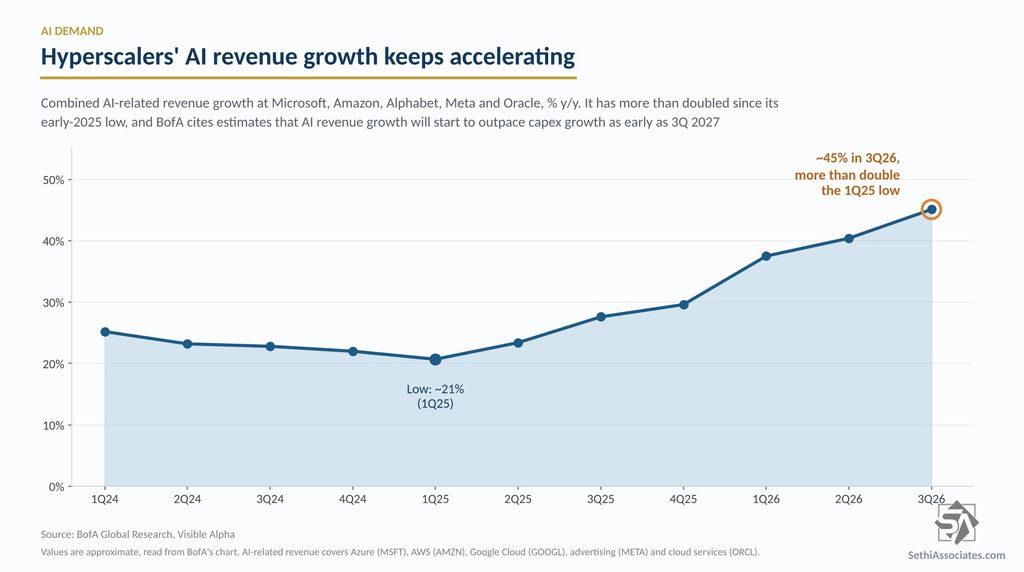
The bigger issue, BofA says, is demand, as “capex booms go bust when demand growth is no longer outpacing supply growth.” For now, demand “largely seems to justify the planned investment,” with hyperscalers’ AI-related revenue growth still accelerating (to about 45% y/y in Q3), and estimates suggest AI-related revenue growth will start to exceed capex growth “as early as 3Q 2027.” So more regulation “is likely to act as a speed bump.”
Like MS, for Q4, JPM looks for growth to slow, in their case to 1.75% (with consumption slowing to 1.5%), and says changes in data center permitting after the midterms “could induce a slight slowdown in growth, assuming that we don’t get a more dramatic equity market rout.”
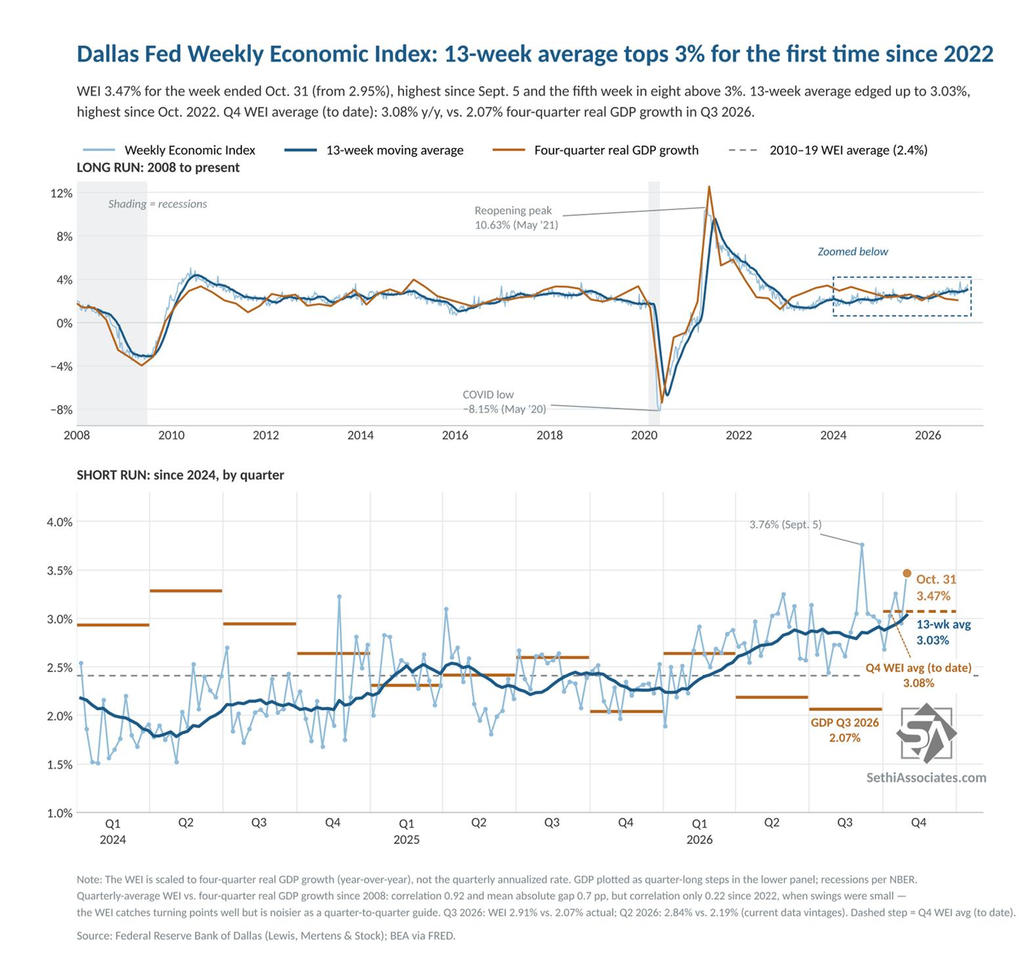
Meanwhile, the Dallas Fed Weekly Economic Index (WEI)* jumped to 3.47% in the week through October 31st (so it doesn’t include last week’s data) from +2.95% the prior week (as revised), the fifth week in eight over 3% and the highest reading since the week of September 5th (3.76%).
The 13-week average also edged up to 3.03%, topping 3% for the first time since October 2022, continuing to evidence economic momentum that is above trend (the 2010–19 average was 2.4%). For Q4 to date it’s averaging +3.08% y/y, which would be the strongest y/y GDP growth since Q2 2024, although with only five weeks in, that would imply an aggressive ~4.2% Q/Q SAAR, so treat it with caution.
*The WEI is scaled as a y/y rise for real GDP (so different from most GDP trackers, which are Q/Q SAAR), uses 10 daily and weekly economic series and runs a week behind other GDP trackers.
It has over time tracked actual GDP closely (a 0.92 correlation since 2008, see chart), although it has come in high the last two quarters, predicting +2.91% y/y GDP growth in Q3 vs the actual first estimate of +2.07%, and +2.80% vs +2.10% for Q2. More importantly, though, it has consistently indicated no recession and relatively healthy growth since the pandemic (which is what we’ve experienced), never dipping below +1% since 2021.
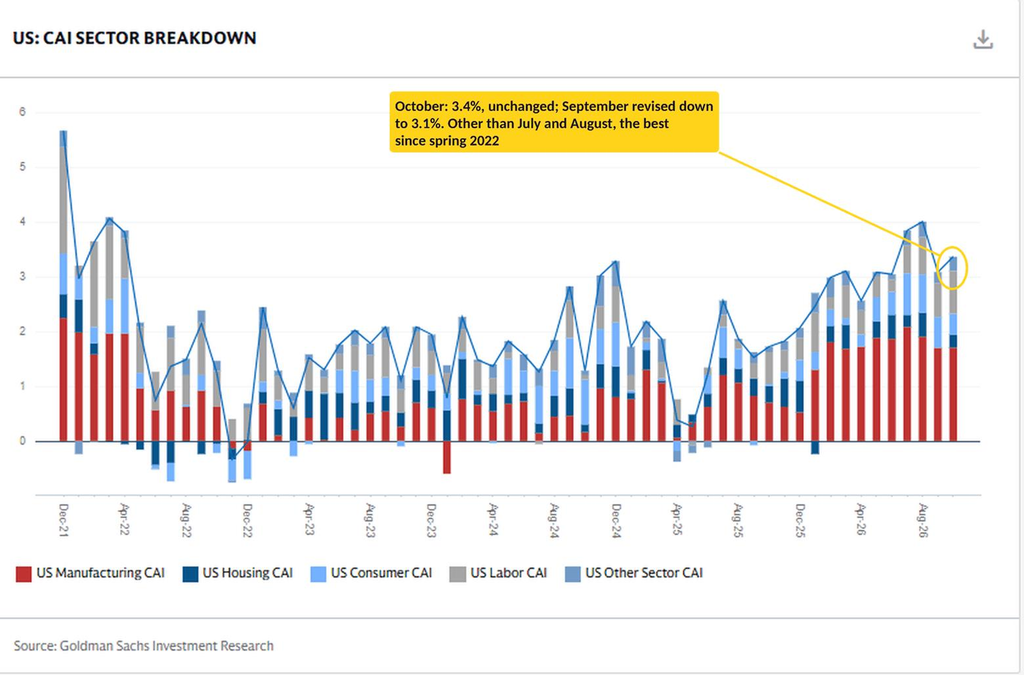
Goldman’s Current Activity Indicator* held at 3.4% in October, though September was revised down another tenth to 3.1%. Still, other than July (3.8%) and August (4.0%), it’s the best since spring 2022.
*The CAI is their “real-time measure of inflation-adjusted economic momentum using 37 inputs.”
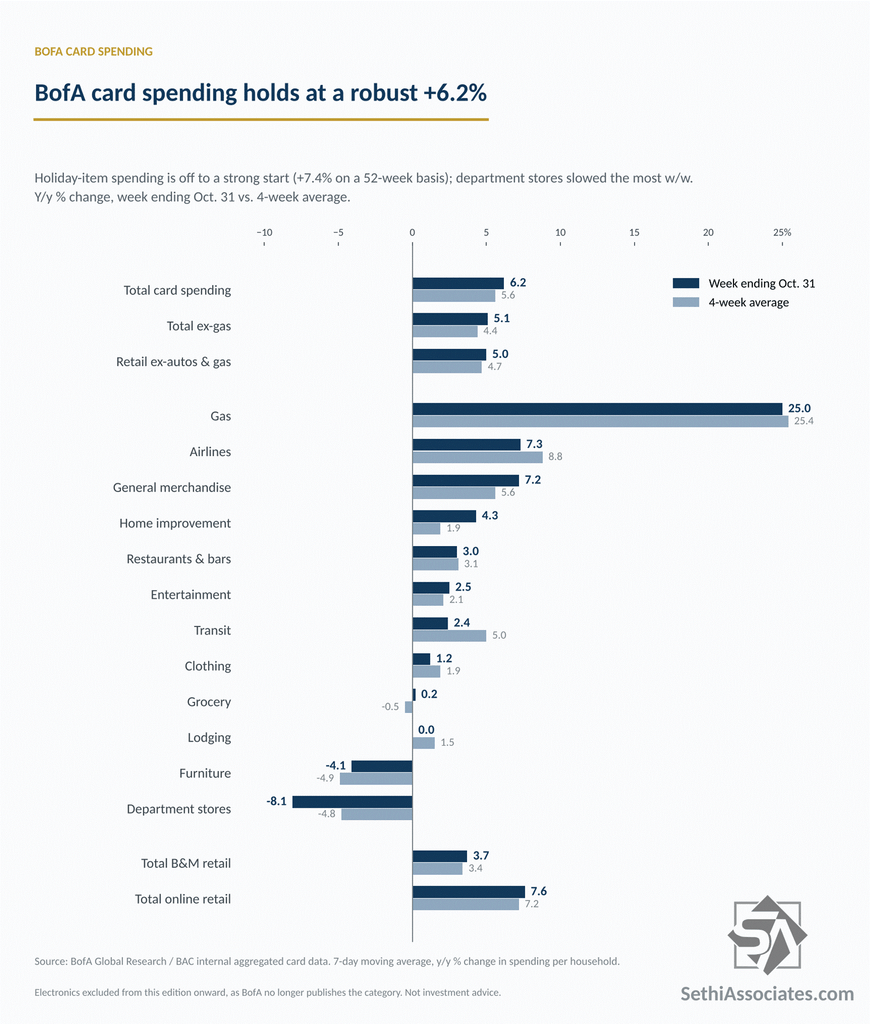
BofA card spending (credit+debit) rose a robust +6.2% versus the year-ago period (y/y) in the week ending October 31st, edging up from +6.0% the prior week to the strongest reading since mid-September. Ex-gasoline and autos spending growth eased slightly to +5.0% y/y from +5.3%. Across October’s four full weeks, total spending averaged +5.6% y/y and ex-gasoline and autos +4.7% (per Claude).
• Total +6.2% y/y (+5.6% four-week moving average).
• Ex-gasoline +5.1% y/y (+4.4% four-week moving average).
• Ex-autos and gasoline +5.0% y/y (+4.7% four-week moving average).
Heading into the holidays, BofA said spending on holiday items is off to a strong start, up 7.4% on a 52-week basis in the week ending October 31st, and that both total card and retail ex-auto spending are tracking well ahead of last year’s levels. On the income split, BofA again noted that lower-income spending growth has consistently outpaced higher-income over the past several weeks.
Gasoline eased to +25.0% y/y (from +25.5%), still elevated versus a year earlier.
Among categories, home improvement saw the largest week-over-week increase, rising to +4.3% from +1.7%, and general merchandise firmed to +7.2% from +5.4%. Airlines (+7.3%, from +8.3%) remained among the strongest outside gas, and grocery edged back into positive territory at +0.2%. Entertainment cooled to +2.5% from +6.9%, clothing to +1.2% from +3.4%, and lodging slipped to flat (0.0%) from +1.7%.
Two categories were negative y/y, down from three the prior week: department stores (−8.1%, from −2.2%, the largest slowdown of any category) and furniture (−4.1%, improved from −5.3%).
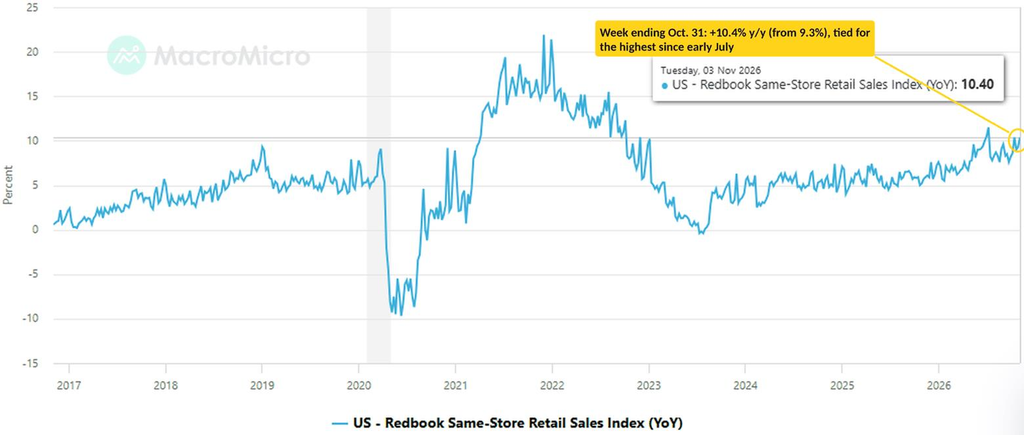
Redbook sales* rose 10.4% y/y in the week ending October 31st, the joint highest since early July (matching the week ending October 10th), up from 9.3% the prior week. That’s up from 5.2% growth a year ago.
*Redbook sales are same-store sales across a panel of large general-merchandise retailers, such as department stores, discount chains, apparel retailers, drugstores, and warehouse clubs.
Payrolls Put a December Hike Back on Track
From the Nasdaq-100’s October 6th peak through Thursday’s close, a 14.7% decline, CME FedWatch odds of a December hike fell from 86% to 67%. They bounced back to about 78% after Friday’s jobs beat, but there has been a clear correlation between equity declines and Fed rate hike pricing. Since October 6, daily Nasdaq 100 moves and changes in December hike pricing have a 0.61 correlation, or about 0.7 bp of hikes per 1% move.
As I’ve noted in past weeks, that’s not only because of the assumed economic impact on growth and inflation from a slower AI buildout (which is also pulling down equity prices), but also because of the reduced wealth effect, as equity declines will, to some extent, reduce spending, which has consistently outrun income growth this year.
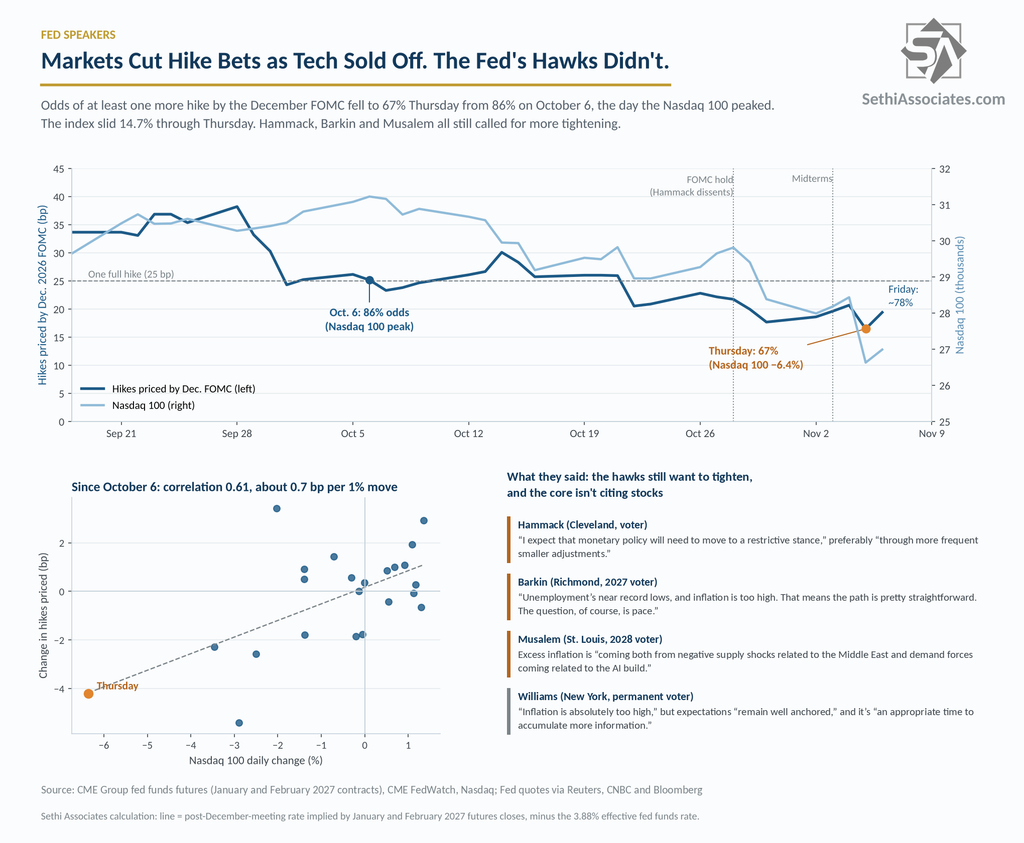
Notably, though, the Fed speakers we heard from during or after Thursday’s selloff, all regional bank presidents, seemed unmoved despite the ferocity of the equity declines.
- Cleveland’s Hammack, who dissented for a hike at the October meeting, said Thursday in Zurich that “inflation has moved in the wrong direction” since March, with headline PCE at 3.6% and core at 3.1%. She called the pressures “relatively broad based, reflecting both supply and demand.” Her conclusion: “I expect that monetary policy will need to move to a restrictive stance,” preferably “through more frequent smaller adjustments.”
- Richmond’s Barkin (a 2027 voter) said in an interview Thursday: “Unemployment’s near record lows, and inflation is too high. That means the path is pretty straightforward. The question, of course, is pace.” He sees policy as “a little bit accommodative” and inflation as “the most important risk right now.” His only market worry was who’s carrying the risk on the more than $500 billion of hyperscaler debt.
- St. Louis’s Musalem called inflation “a regressive tax, a distortionary tax” on Friday, per Reuters, and told Bloomberg that today’s excess inflation is “coming both from negative supply shocks related to the Middle East and demand forces coming related to the AI build.” He added: “We need to make monetary policy for the economy of the day.” Musalem’s AI point is a touch ironic. The market has been pricing AI weakness as a reason for fewer hikes, while the hawks see AI spending as part of the inflation problem.
- San Francisco Fed President Daly (2027 voter) said in an interview Friday “my expectation is, we’re going to have to tighten policy further…. More is likely to be needed, and certainly … I’m prepared to do that if that’s what the economy calls for.”
The caveat, of course, is that the hawks (although it’s hard to call Daly or Barkin hawks) aren’t the committee, and the core seems to be in no hurry. New York’s Williams, a permanent voter, and part of the “troika” at the top of the Fed as discussed in previous weeks, spoke Friday in Frankfurt. While he agreed that “Inflation is absolutely too high. It’s been too high for too long,” he said inflation expectations “remain well anchored” and “We’re seeing wage growth be consistent with our 2% goal.” He also backed the prior week’s statement that this is “an appropriate time to accumulate more information.” Notably though Williams didn’t cite stocks according to the reports.
And part of the reason the core seems to be comfortable waiting is market conditions are doing part of the tightening for them as Chair Warsh alluded to at the October FOMC.
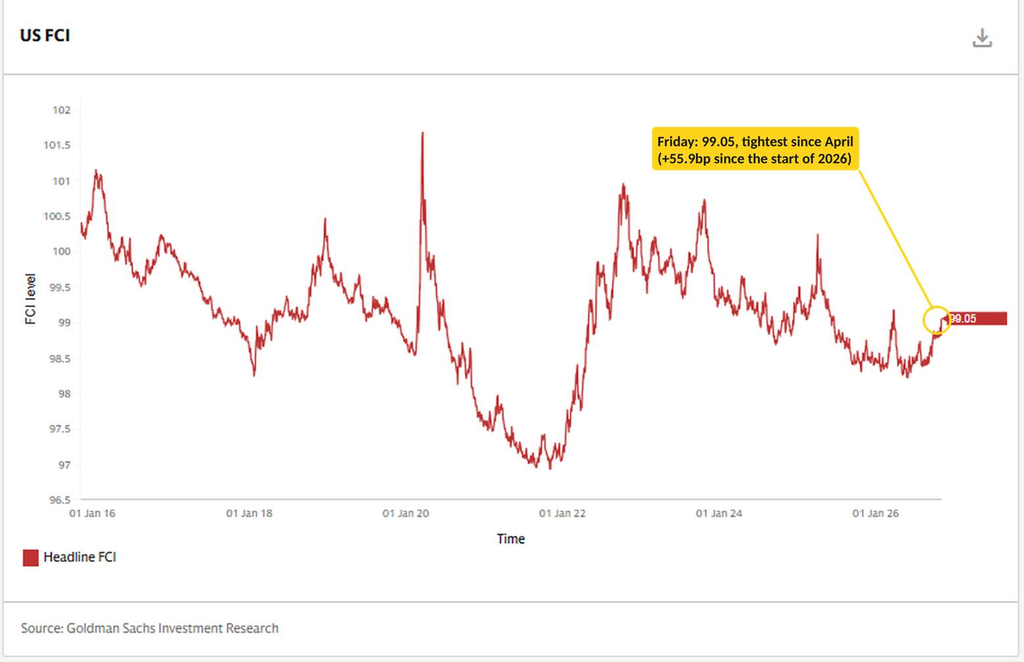
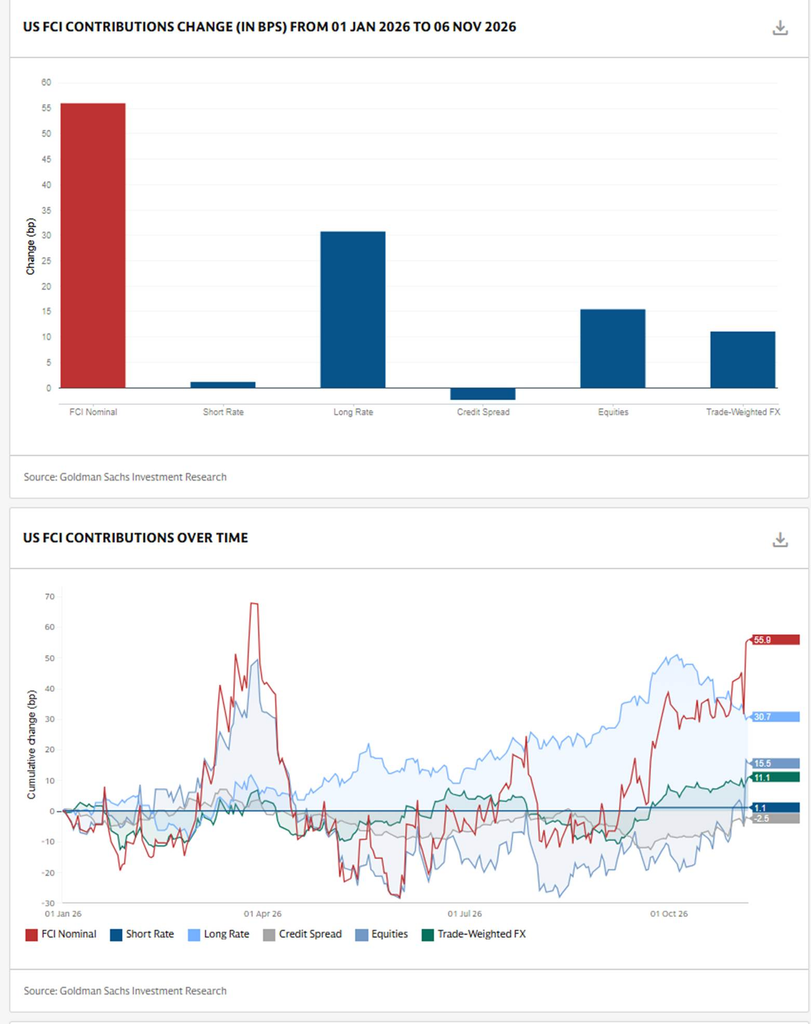
Goldman’s Financial Conditions Index rose to 99.05 this week, its tightest since April and up 55.9bp since the start of the year. That’s even as the long-rate contribution has eased to 30.7bp from about 50bp in mid-October as yields fell, while equities, which had been loosening conditions, now add 15.5bp of tightening after Thursday’s selloff, with the stronger dollar adding another 11.1bp. Given equities represent the majority of the loosening impulse the past few years, that’s the equity-driven tightening sensitivity I noted last week the Fed has to be attuned to, as if equities give way, things get much tighter very quickly.
MS says its financial conditions index shows conditions 30bp tighter than before the September FOMC as of November 5th’s close (equivalent to about a 30bp hike in the fed funds rate, “driven primarily by U.S. dollar appreciation”), but only 3bp tighter than before the October meeting, and that “financial conditions remain moderately restrictive.”
BofA, who as a reminder was the lone bank looking for an October hike right into the meeting, said Friday that “the strong Oct jobs report should keep the Fed focused on inflation and on track to hike again in Dec. Dovish arguments based on lingering softness in the labor market look less compelling after the Oct data.” And on the “policy put” for stocks, a hot topic after Thursday’s selloff, “in our view, the policy put should be struck considerably lower after today’s data.” BofA still expects hikes in December and March, with its 4.25%–4.50% terminal rate held through the end of 2027, and it sees October core CPI rising 0.2% m/m, which “should keep a hike in Dec firmly on the table.” It does see two-sided risks, though, including a scenario where favorable base effects bring core PCE inflation down early next year and “the Fed stops after just one more hike in Dec ’26.”
JPM and Morgan Stanley also still expect a December hike, with MS also looking for one in March (to 4.25%–4.5%). JPM (Feroli) on last week’s selloff:
“AI-related doubts caused the equity markets to stumble this week, bringing down with it the market pricing for Fed hike expectations for the December meeting… However, we think the Committee will remain focused on the strength in the economic data and continue to look towards a hike next month. Next week’s October CPI report will be the last CPI before the early December FOMC meeting. Perhaps a very soft number could raise questions about a hike next month, but that is not our expectation.”
JPM says the selloff “will enter the Fed debate,” but “stress would need to broaden significantly beyond equity prices to keep the FOMC from hiking next month,” and “an upside surprise of a third consecutive 0.3% m/m gain would challenge current market pricing for only one additional hike next year.”
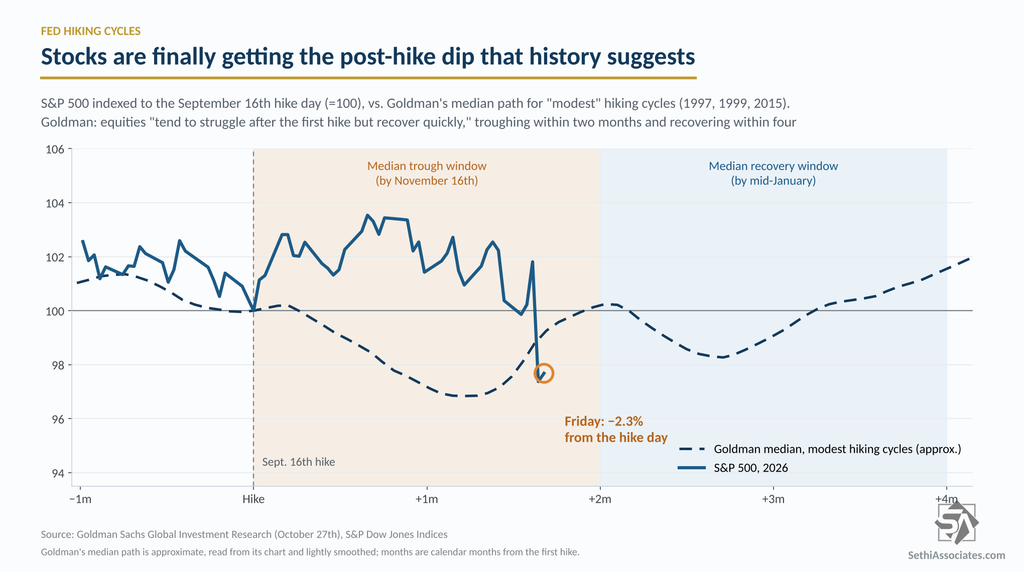
As a reminder, Goldman said that after a first rate hike in a “modest” hiking cycle (it counts 1997, 1999 and 2015), equities “tend to struggle after the first hike but recover quickly.” In the median of both modest and larger cycles, equities troughed within two months of the first hike and recovered within four, and six-month returns were flat to positive in every cycle except 1994 and 2022. Yields also tend to peak locally shortly after the first hike in modest cycles, which so far fits, with the 10-year peaking on October 5th.
Two months from the September 16th hike is November 16th, and Thursday’s close was the S&P 500’s lowest since the hike, leaving it 2.3% below that day’s close as of Friday (from 0.4% above a week earlier). If the pattern holds, that would put the trough around now and a recovery by mid-January. The risk, per Goldman, is a 1999-style cycle, with the Fed hiking into an investment boom with strong growth and high valuations (a Shiller P/E of 41 now vs. 42 then), when yields kept rising, the S&P 500 stayed rangebound and the tech bubble eventually burst.
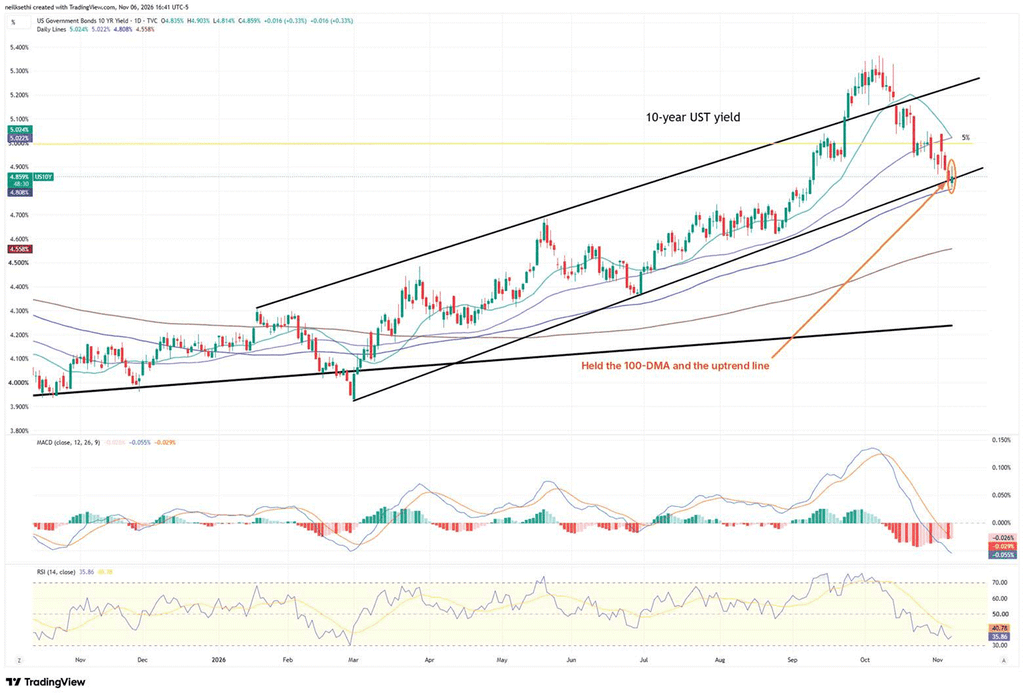
Turning to rates, Treasuries were again the anti-AI trade, with the 10-year yield falling for a fifth straight week, its first five-week losing streak since February 2025. The 2-year closed the week at 4.51% (−5bp w/w), the 10-year at 4.86% (−7bp) and the 30-year at 5.26% (−5bp), so all three remain inside the ranges I set in early August (tops of 4.75%, 5% and 5.75%). Thursday’s 4.84% close on the 10-year was its lowest since September 9th, about 45bp below its October 5th high, although Thursday’s 4.4% S&P drop took the 10-year down just 6bp.
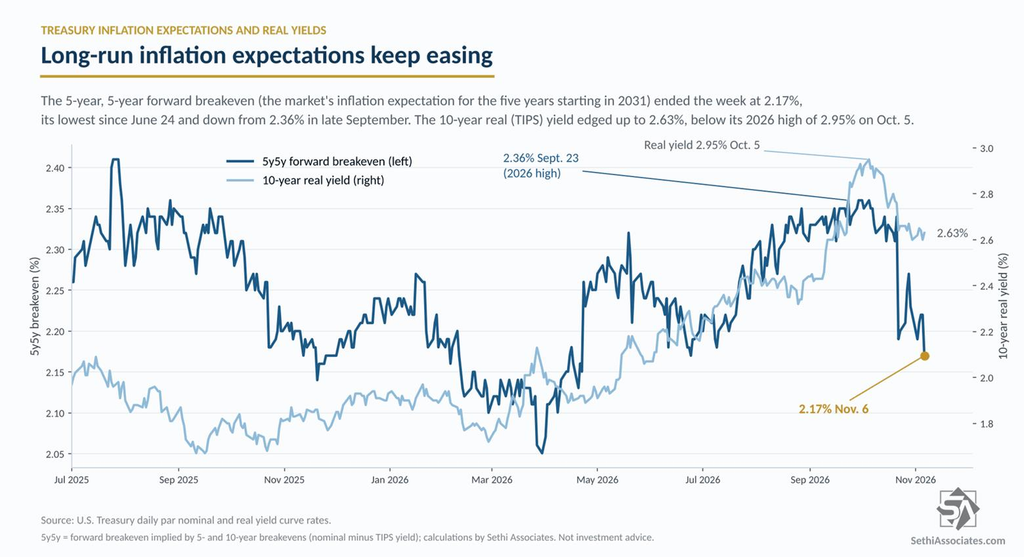
Underneath the drop in yields, long-run inflation expectations eased further. The 5-year, 5-year forward breakeven (the market’s expectation for average inflation over the five years starting in 2031, a measure the Fed watches closely) ended the week at 2.17%, down from 2.22% a week earlier and its lowest since June 24th. Its 2026 high was 2.36% on September 23rd.
The 10-year real (TIPS) yield though edged up to 2.63% from 2.60% a week earlier, still down from its 2026 high of 2.95% on October 5th. So this week’s drop in yields came entirely from lower inflation expectations.
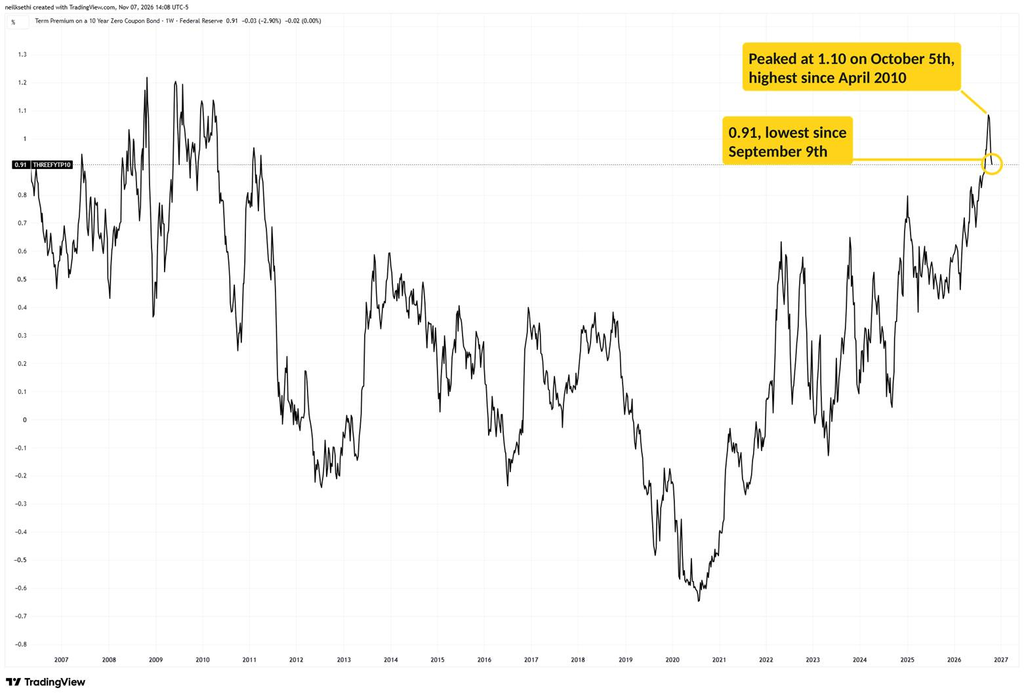
The term premium (the extra yield investors demand to hold longer-term bonds) is also still coming off its highs. The Fed’s 10-year term premium (the Kim-Wright model) peaked at 1.10 on October 5th, the highest since April 2010, and was 0.91 in the latest reading (October 30th), its lowest since September 9th but still above any reading from mid-April 2011 through 2025. The NY Fed’s ACM measure ticked up to 0.72 on November 5th from 0.68 a week earlier, still well below its 0.99 peak on October 7th, its highest since June 2014.
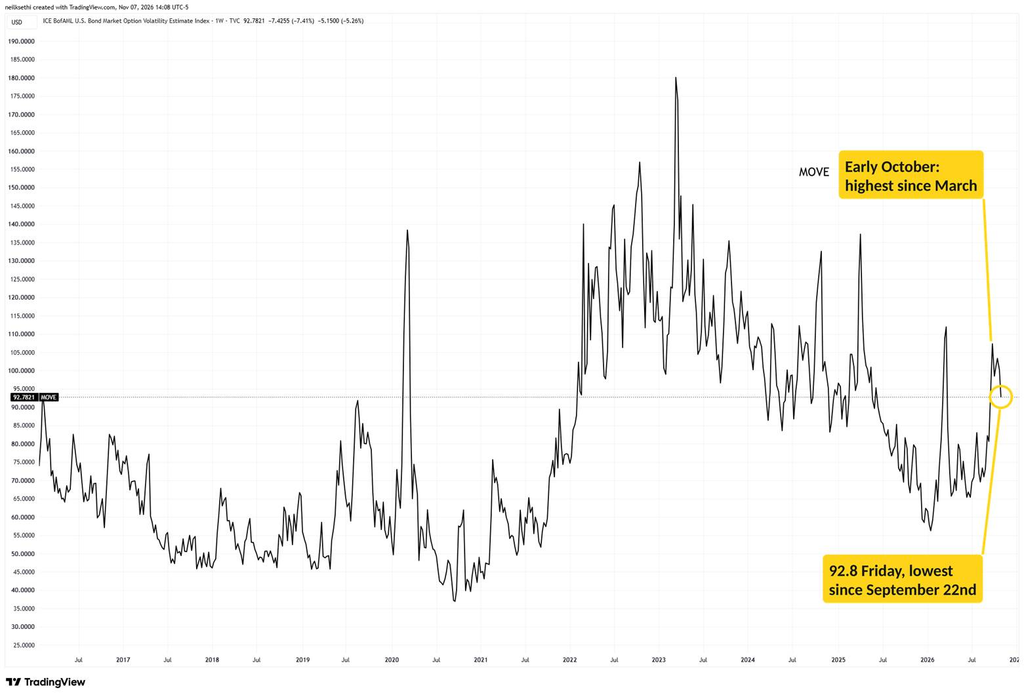
And bond volatility has calmed further. The MOVE index ended the week at 92.8, its lowest since September 22nd, down from 100.2 a week earlier and from 113.6 on October 5th, its highest since March. That’s despite the jump in equity vol, with the MOVE rising just 4% Thursday as the VIX jumped 70%.
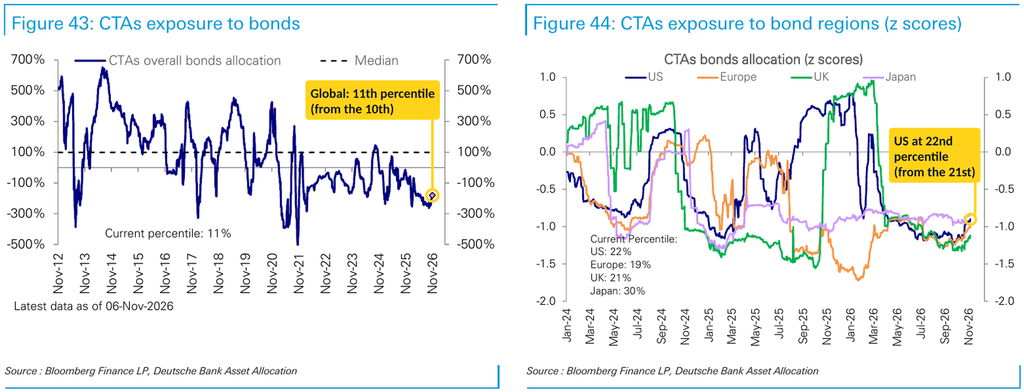
CTAs could help that along. DB continues to see only modest CTA covering in bonds, with US positioning at the 22nd percentile (from the 21st) and global at the 11th (from the 10th).
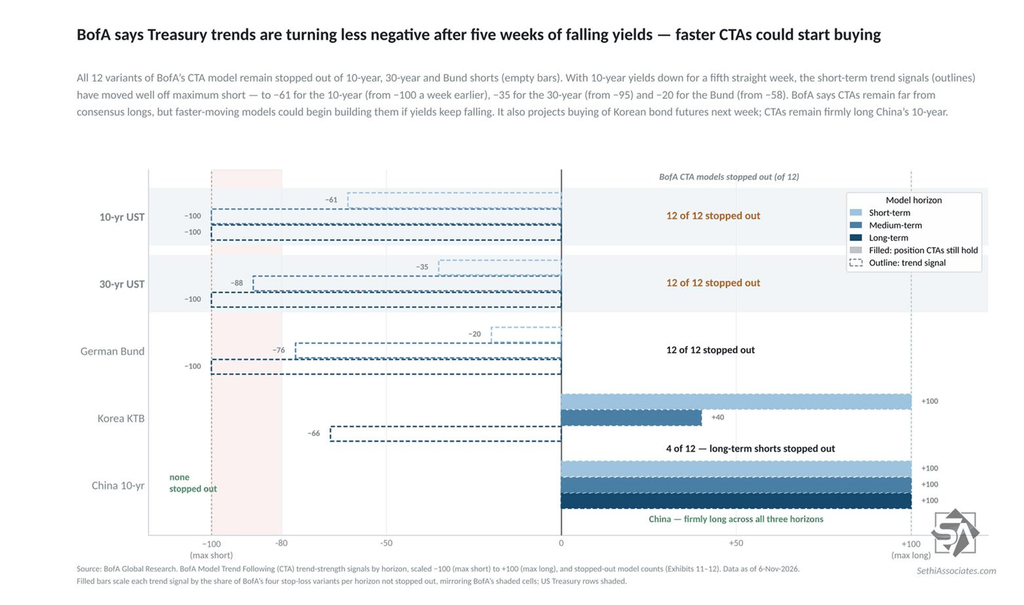
BofA meanwhile says CTAs remain stopped out of their 10-year, 30-year and Bund shorts, but even after five straight weekly declines in 10-year yields, trend signals remain negative although less so: the short-term signal is now −61 for the 10-year (from −100), −35 for the 30-year and −20 for the Bund. Given that, BofA says CTAs remain far from consensus longs, but faster-moving models could begin building longs if yields keep falling.
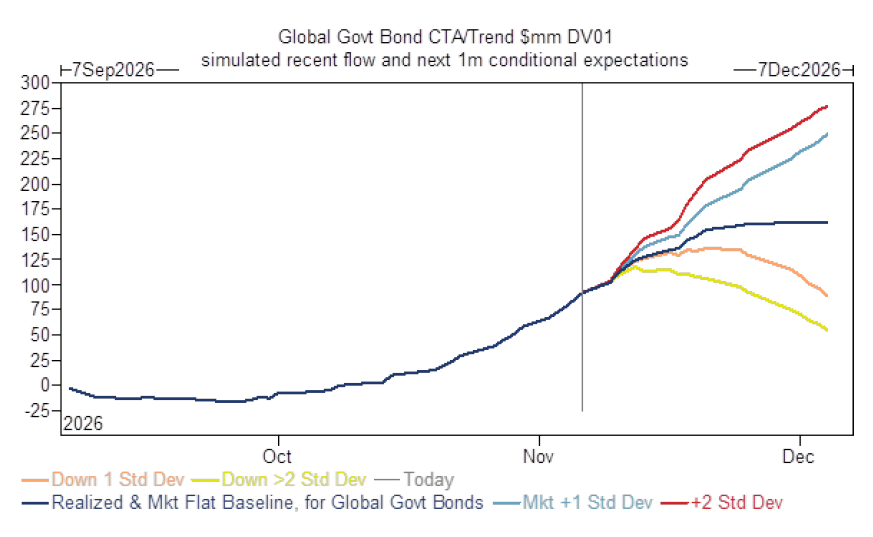
Goldman though expects CTA buying to continue. “We expect CTA/trend followers have bought $33mm of global DV01 in the last one week, and will buy another $28mm in the next 1 week and $78mm in the next 1 month cumulatively in the baseline scenario.”
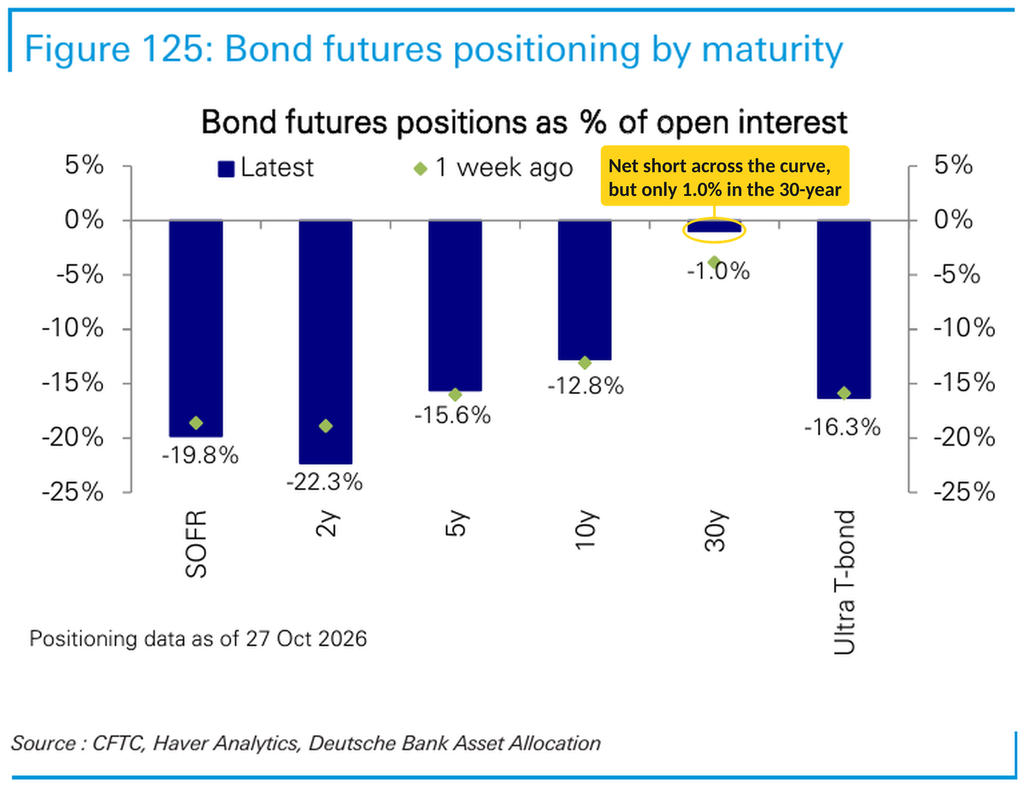
Looking at broader positioning, DB’s read of the CFTC data (as of October 27th) shows speculators still net short across the curve: net shorts are 22.3% of open interest in 2-year futures, 15.6% in 5-year, 12.8% in 10-year and 16.3% in the Ultra bond, although only 1.0% in the 30-year.
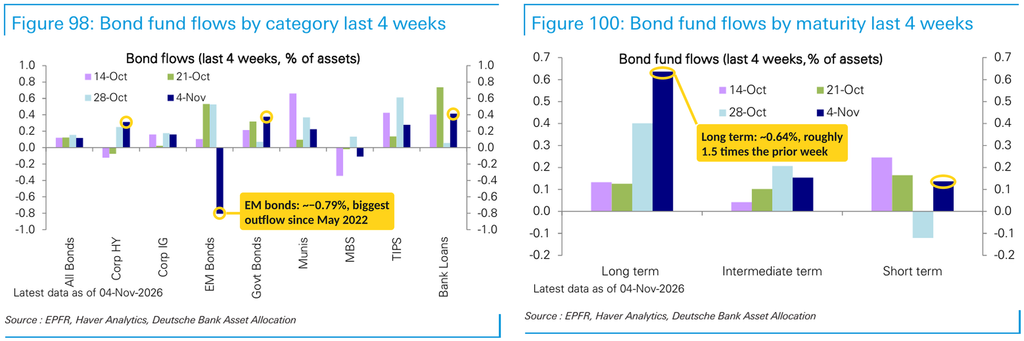
And bond fund flows continue to show investors buying the bond dip for a seventh week and last week extending duration. Per DB, long-term bond funds took in ~0.64% of assets in the week through November 4th, roughly 1.5 times the prior week’s ~0.4%, while short-term funds returned to inflows (~0.14%) after the prior week’s outflow. Bank loans (~0.42%), government bonds (~0.38%, a four-week high) and high yield (~0.32%) led, while EM bond funds saw outflows (~−0.79%), their biggest since May 2022.
Companies Continue to Beat, but the Market Isn’t Rewarding Them
Looking at Q3 earnings, we’re now nearly done, with 88% of the S&P 500 reporting through Thursday according to FactSet, and beats remain high with 84% beating, above the 1-year average of 82%, the 5-year average of 78% and the 10-year average of 77%.
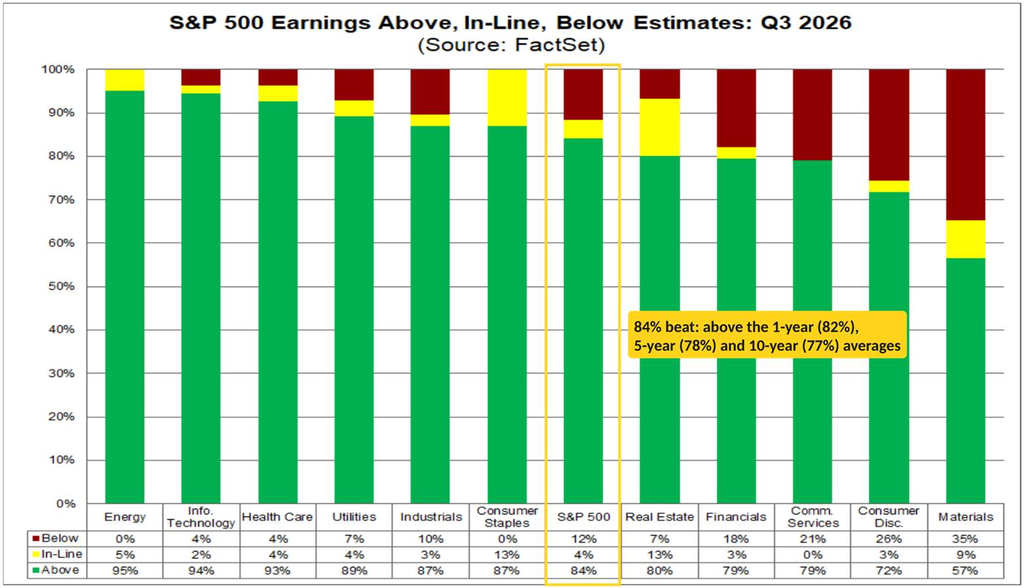
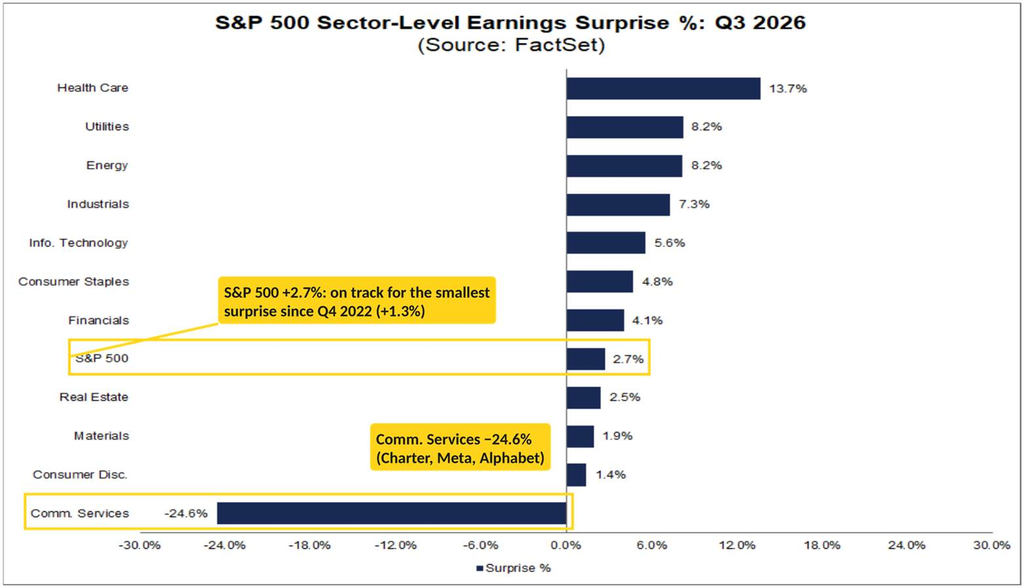
The magnitude of the beats though remains historically weak at +2.7% (from +1.9% the prior week), well below the 1-year average of 13.8%, the 5-year average of 7.5% and the 10-year average of 8.0%. If that holds, it would be the smallest surprise since Q4 2022 (+1.3%). The Communication Services sector remains the big drag at −24.6% (from −21.5%), now with the big miss at Charter Communications (CHTR) added to the GAAP charges at Alphabet (GOOGL) and Meta (META), while Health Care leads at +13.7%.
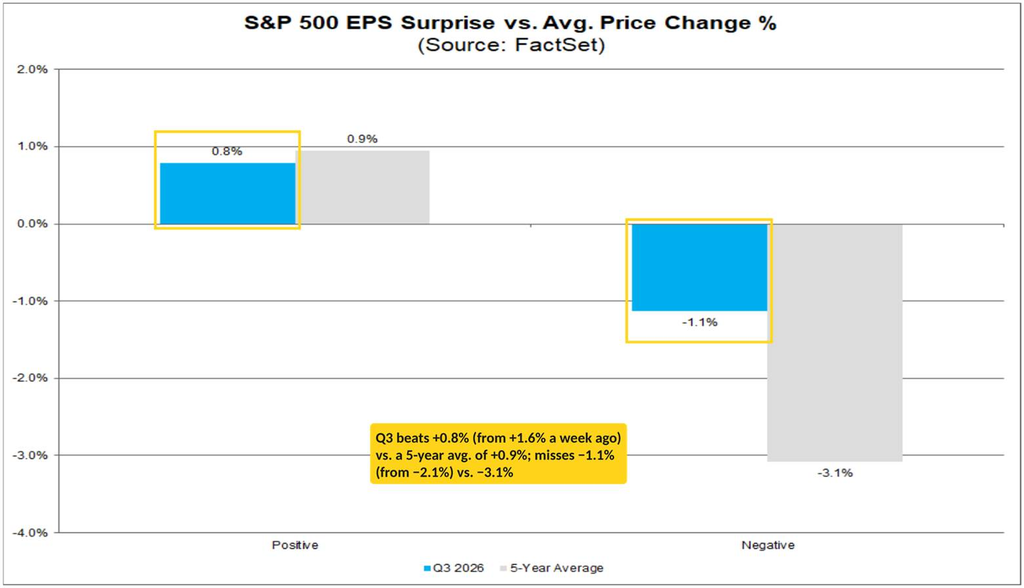
Market reactions have narrowed in both directions. FactSet says companies beating estimates have now averaged a +0.8% move from two days before their report to two days after (from +1.6% the prior week), just under the 5-year average of +0.9%, while those missing have averaged −1.1% (from −2.1%), far better than the 5-year average of −3.1%.
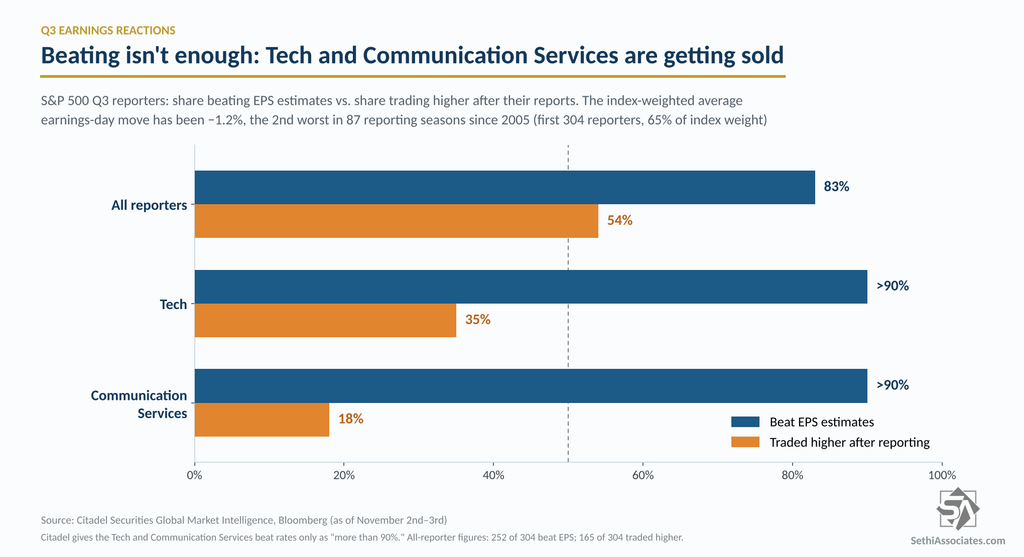
Citadel’s Rubner measures it differently but finds the same thing: the index-weighted average earnings-day move has been −1.2% (through the first 304 reporters), the 2nd worst in 87 reporting seasons since 2005. In Tech and Communication Services, more than 90% of companies have beaten EPS estimates, yet only 35% and 18%, respectively, have traded higher after their reports.
But despite all that overall Q3 expected earnings growth climbed another 1.3 points to +31.4% (from a revised 30.1%), which would be a third straight quarter above 25%. Energy extended to +149.4% y/y (up from +79.3% on June 30th), followed by Tech +69.2% (from +57.0%) and Materials +29.7%, while Comm Services fell to +14.1% from +20.3% the prior week (and +53.1% on June 30th) on Charter.
Health Care climbed to +9.3% from +5.2% on beats from Pfizer (PFE), Moderna (MRNA), CVS Health (CVS) and Amgen (AMGN), now above the +8.7% on June 30th.
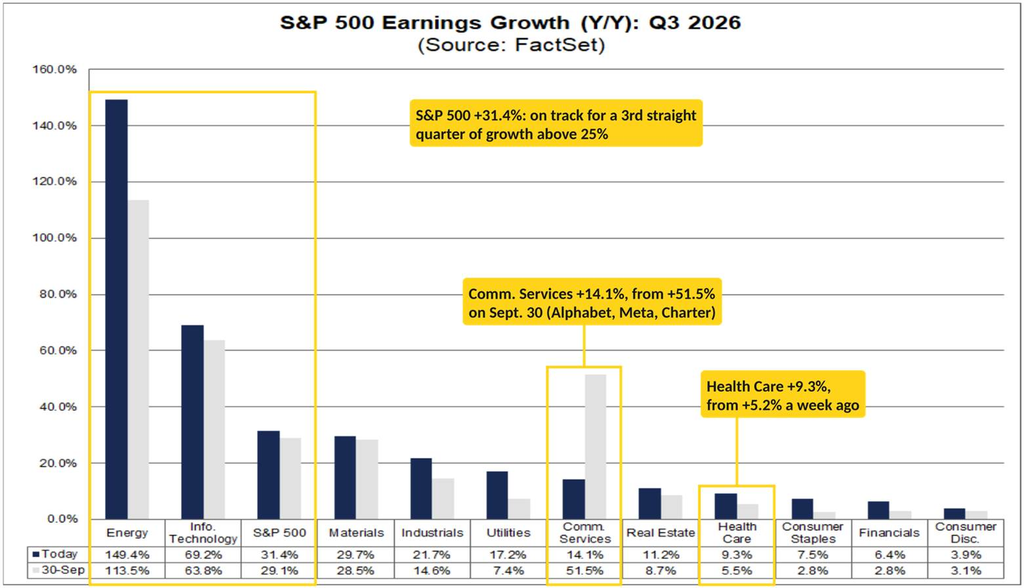
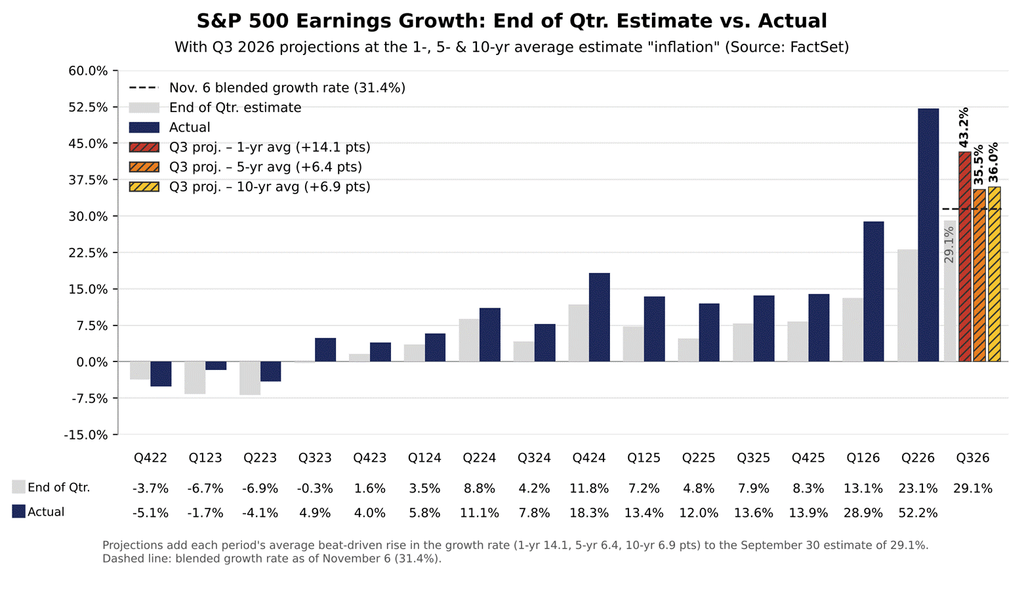
Which is directionally consistent with the typical “earnings inflation” we see each earnings season as I mentioned at the start of the reporting period (numbers are from the end of the quarter, which is where the “inflation” metrics are measured from).
With the blended growth rate at 31.4%, the 5- and 10-year averages (35.5% and 36.0% from the 29.1% September 30th estimate) imply roughly another four to five points from here, though with 88% of companies reported there’s less room left for it.
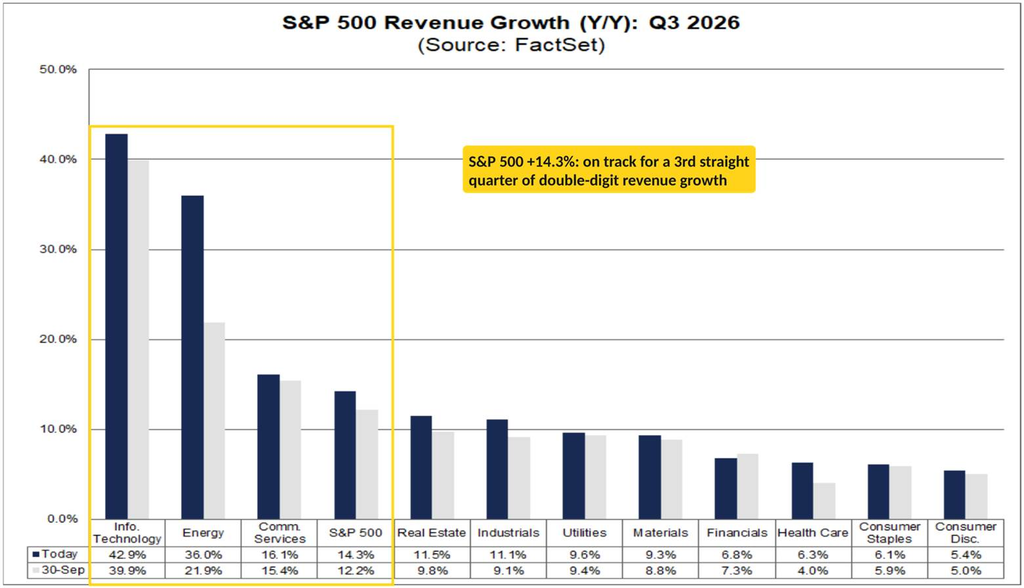
Q3 revenue growth expectations also rose to +14.3% (from a revised 13.6%), on track for a third straight quarter of double-digit growth. Expectations are led by Tech (+42.9%), Energy (+36.0%) and Communications (+16.1%).
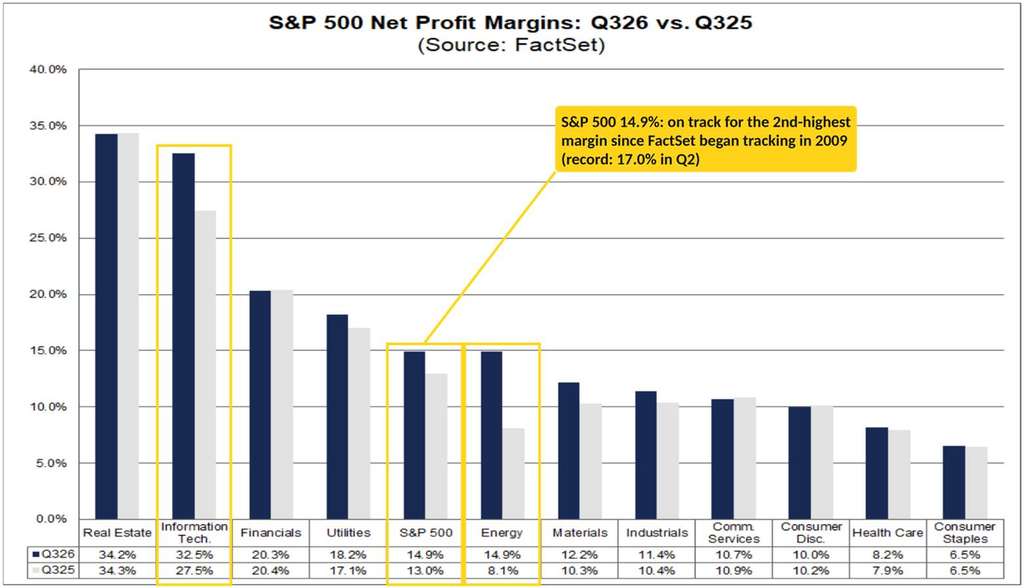
Net profit margins held at an elevated 14.9%, the second highest on record (since 2009) after 17.0% in Q2 and up from 13.0% a year ago, led by Tech’s 32.5% (vs 27.5% a year ago and a 25.9% five-year average) and Energy’s 14.9% (vs 8.1%).
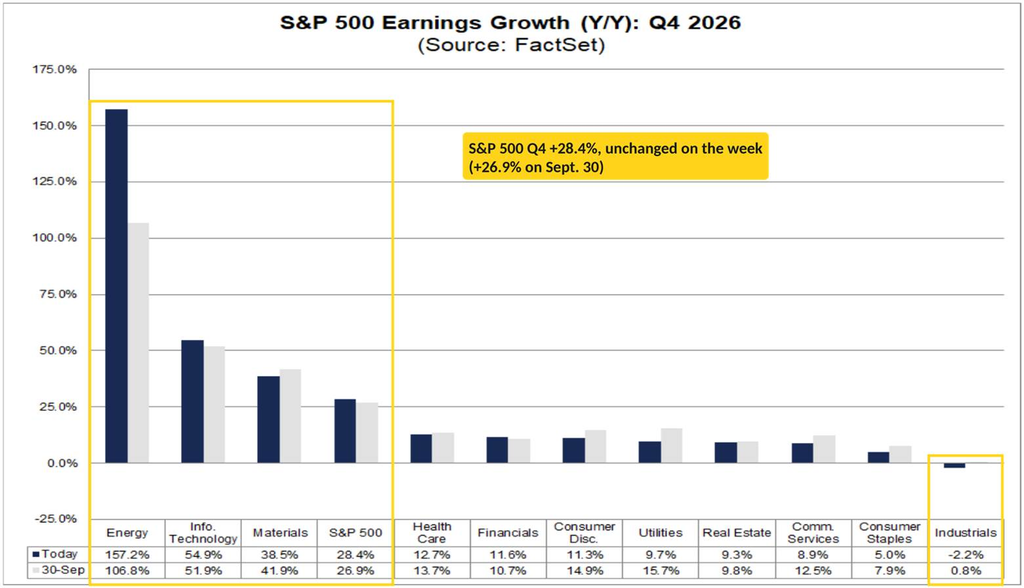
Expected Q4 growth held at 28.4% after slipping the prior week (it’s still up from 26.9% on September 30th), and guidance remains better than usual: 43% of the 75 companies that have guided Q4 have been negative, versus a 5-year average of 60%. Under the hood the trims continued, with Comm Services (8.9% from 10.2%), Materials (38.5% from 40.7%), Utilities (9.7% from 11.5%), Consumer Discretionary (11.3% from 12.1%) and Industrials (−2.2% from −1.9%) lower again, offset by Tech (54.9% from 54.4%) and Energy (157.2%).
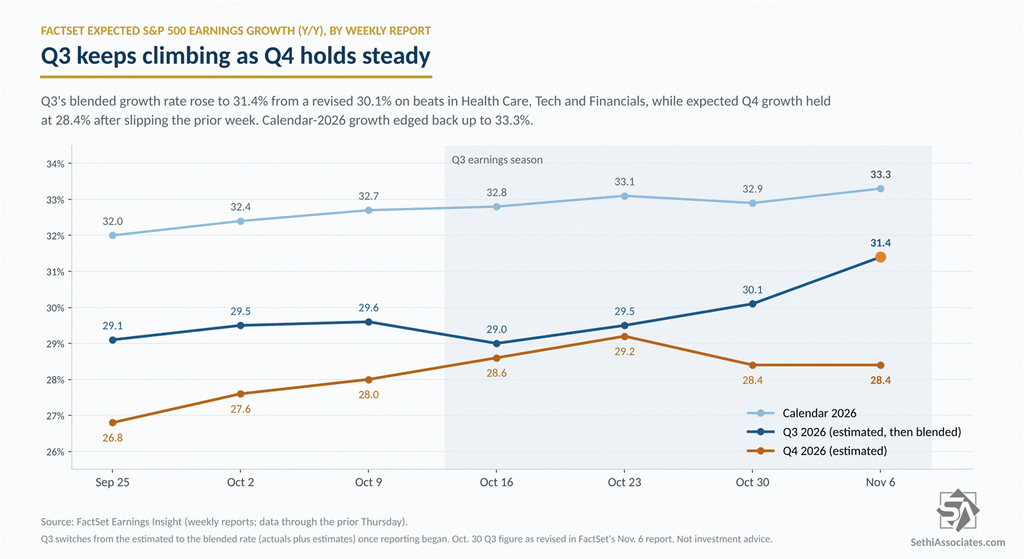
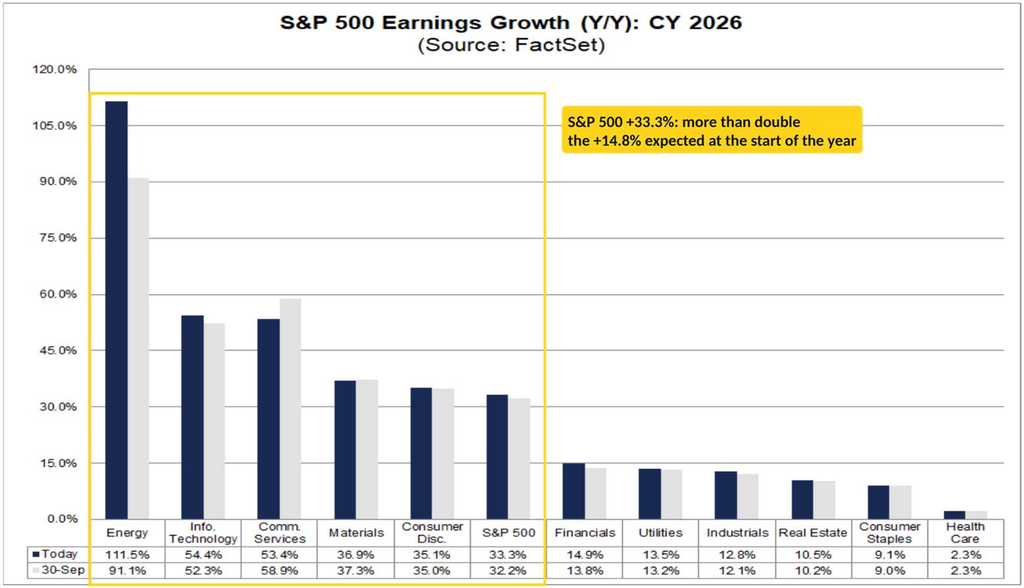
With Q3 rising and Q4 steady, 2026 SPX earnings growth expectations edged up to +33.3% (from +32.9%), up from +24.0% on June 30th, +17.1% on March 31st, and over double the +14.8% at the start of the year. Energy leads at +111.5% (up from +6.4% at the start of the year), followed by Tech at +54.4% (up from +28.6%) and Communications (+53.4%). Those sectors along with Materials (+36.9%) and Consumer Discretionary (+35.1%) remain the five expected to come in above the SPX average.
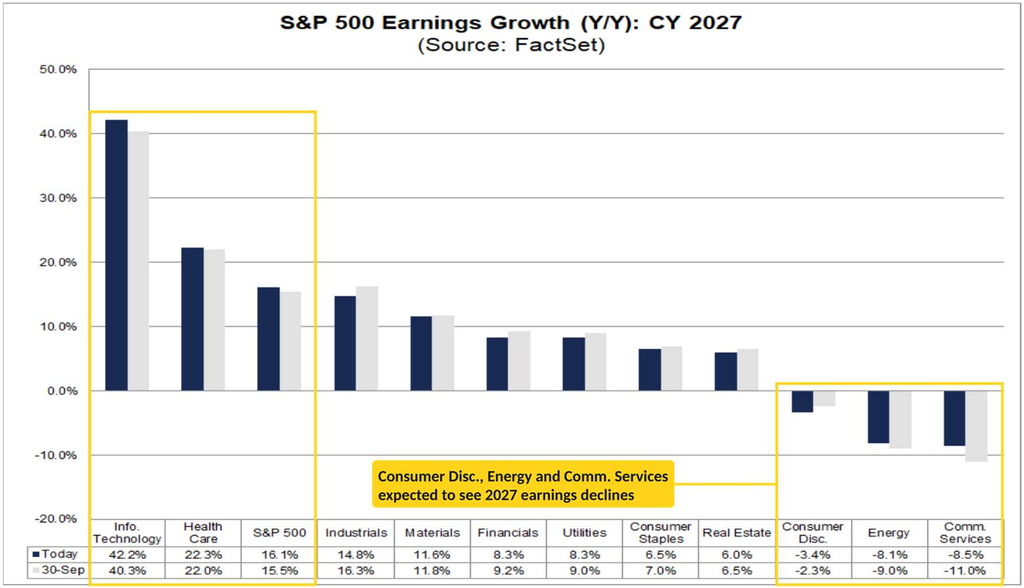
And 2027 earnings are expected to be up another +16.1% (from +16.3%), still below the +17.5% as of June 30th. Tech again leads (+42.2%), followed by Health Care (+22.3%), with no other sector above the SPX average (Industrials just under at +14.8%). Communications (−8.5%), Energy (−8.1%) and Consumer Discretionary (−3.4%) are expected to see declines.
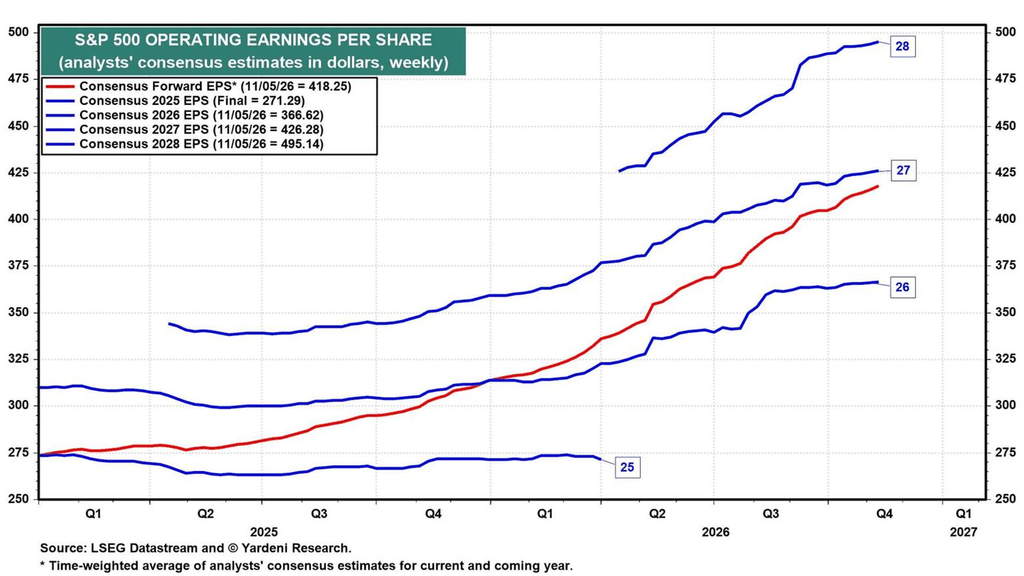
Yardeni, whose data comes from LSEG rather than FactSet, has 2027 at a similar +16.3% ($426.28) and 2028 up another 16.2% ($495.14), which he notes is “closing in on $500—which is our target for 2030!” Forward earnings (a time-weighted average of analysts’ estimates for this year and next) rose to a record $418.25 and are converging on the 2027 estimate, but he remains skeptical:
“We are bullish, but not as bullish as the analysts. The drop in the forward P/E this year suggests that investors also believe analysts are too bullish on earnings.”
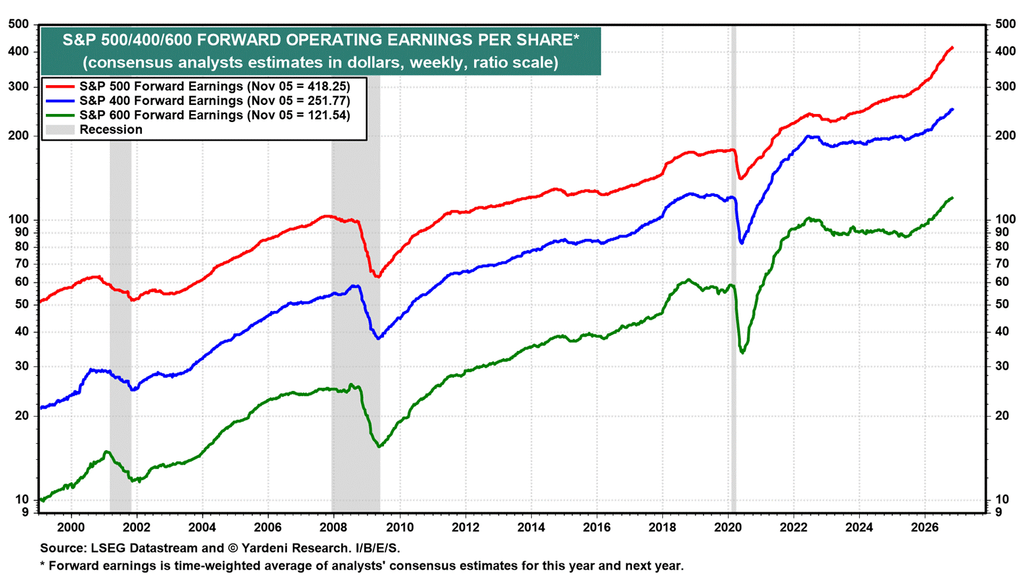
Still, he notes again that “forward earnings for the S&P 500, S&P 400, and S&P 600 all rose to record highs again last week” (“earnings strength remains broad”), and that forward revenues per share are up 15.9% y/y while forward earnings per share are up 39.0%.
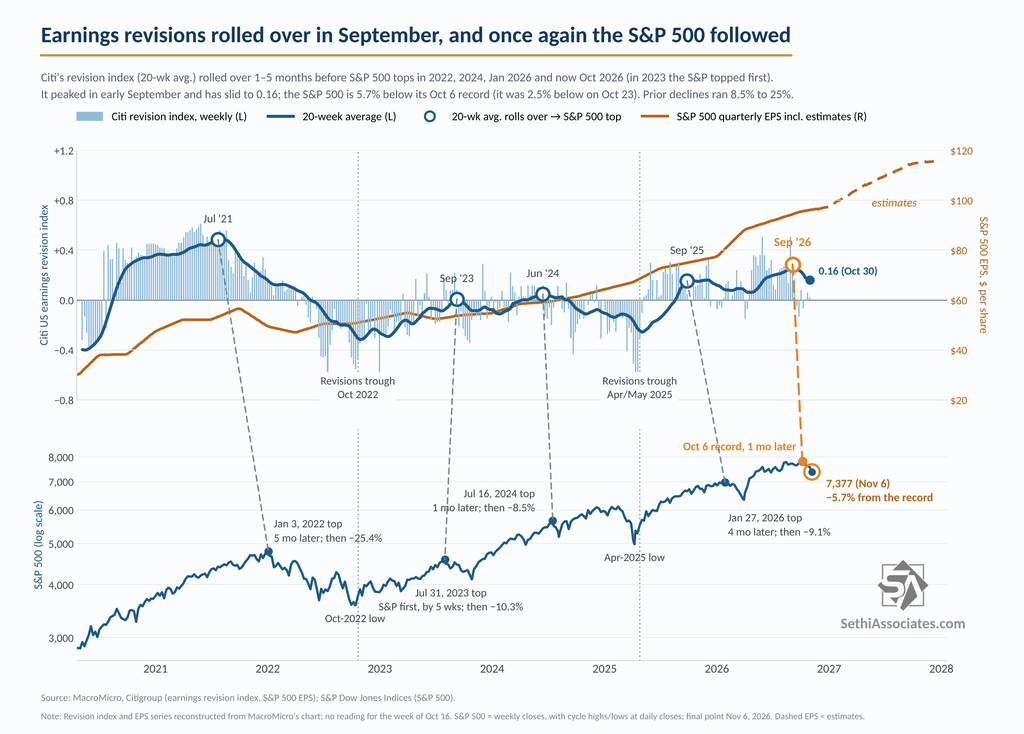
Turning to earnings revisions, Citi’s earnings revision index was +0.02 in the week of October 30th, down from +0.06 the prior week (there was no reading the week before that), as its 20-week average continued to roll over, to about 0.16 from 0.18 two weeks earlier and 0.28 in mid-September.
As I noted on October 25th, three of the four prior rollovers of about 0.8, 0.16 and 0.1 points in the 20-week average since 2021 (Jul ’21, Jun ’24, Sep ’25) were followed by declines of 25%, 8.5% and 9.1% (in 2023 the SPX declined first). At the time the index was down 2.5% from its October 6th record, and I said it was still too early to tell how much further (if any) the softening had to go. Now the S&P 500 is down 5.7% from that record.
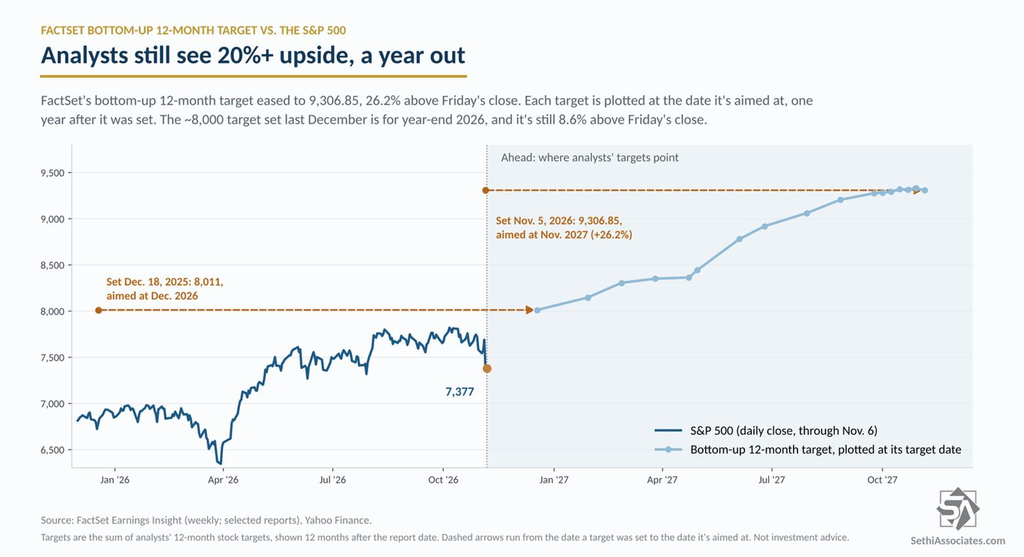
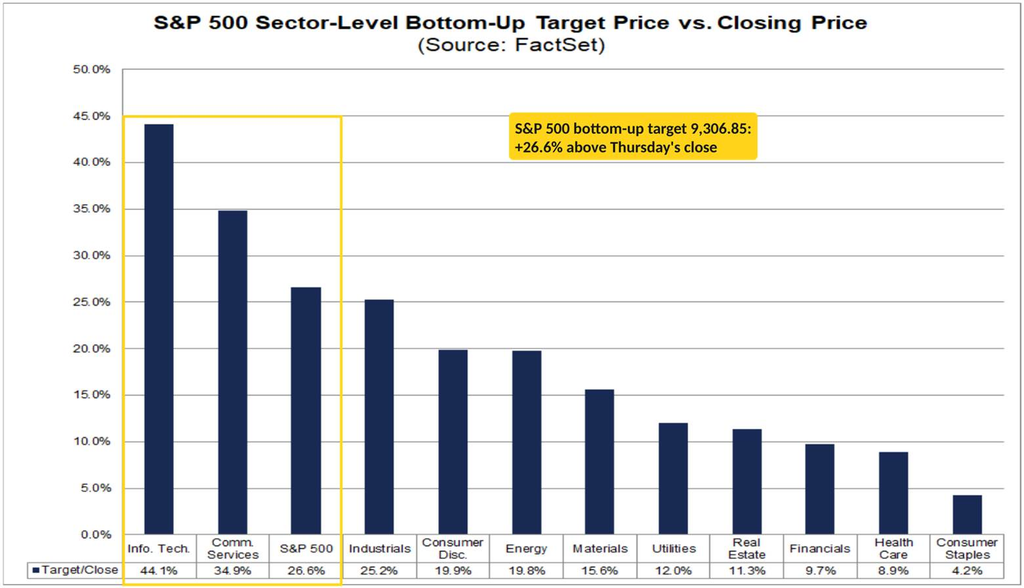
Analysts meanwhile continue to see plenty of upside, although FactSet’s compilation of analyst bottom-up SPX 12-month price targets eased to 9,306.85 (−21pts w/w, ~+980 pts since March 31st, ~+1,380 pts since Thanksgiving, and ~+2,615 pts since July 1, 2025). That’s the largest drop since the week of liberation day. Still that represent a gain of 26.6% from Thursday’s close (7,353.73), up from +20.8% the prior week as the index fell about 4.7% through Thursday (and +26.2% from Friday’s close).
As a reminder, we started the year with a 12-month bottom-up price target of about 8,000 (8,010.64). Friday’s close leaves the S&P 500 about 8% below that.
Tech (+44.1%, from +27.9%) is back on top for expected upside after last week’s selloff, followed by Communications (+34.9%, from +38.5%) and Industrials (+25.2%). Energy’s expected upside jumped to +19.8% from +6.0% as that sector also saw a sharp decline last week. Consumer Staples (+4.2%), Health Care (+8.9%) and Financials (+9.7%) are now the only sectors with single-digit expected upside.
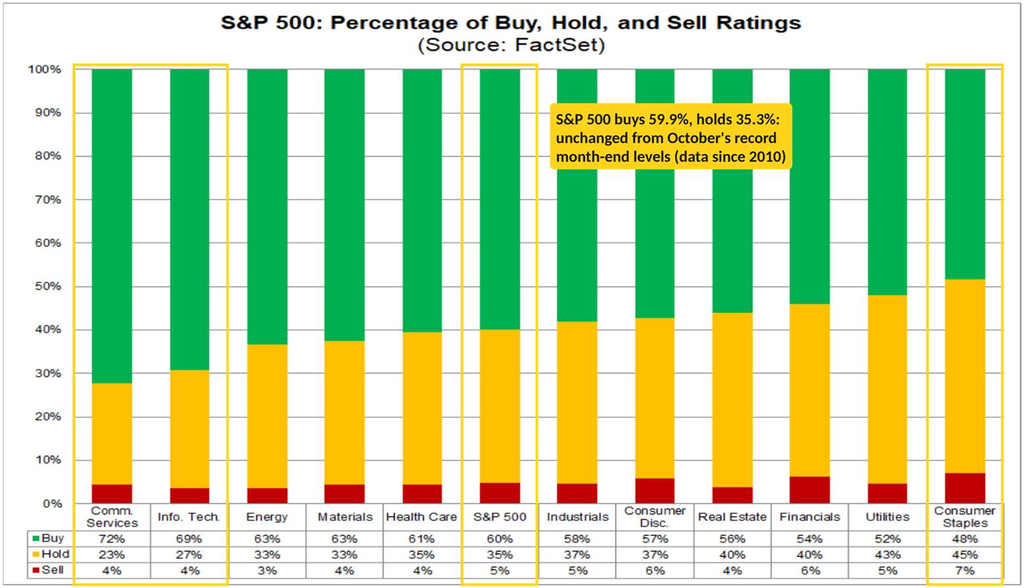
In terms of analyst ratings, buy ratings held at 59.9%, matching the record month-end high (to 2010) they set at the end of October, while hold ratings held at a record-low 35.3% and sells at 4.8%. The 5-year month-end averages are 55.8%, 38.7% and 5.6%. Communications (72%) and Tech (69%) have the highest share of buys, while Consumer Staples has the lowest (48%) and the most sells (7%).
Valuations Fall to the Lowest Since 2023
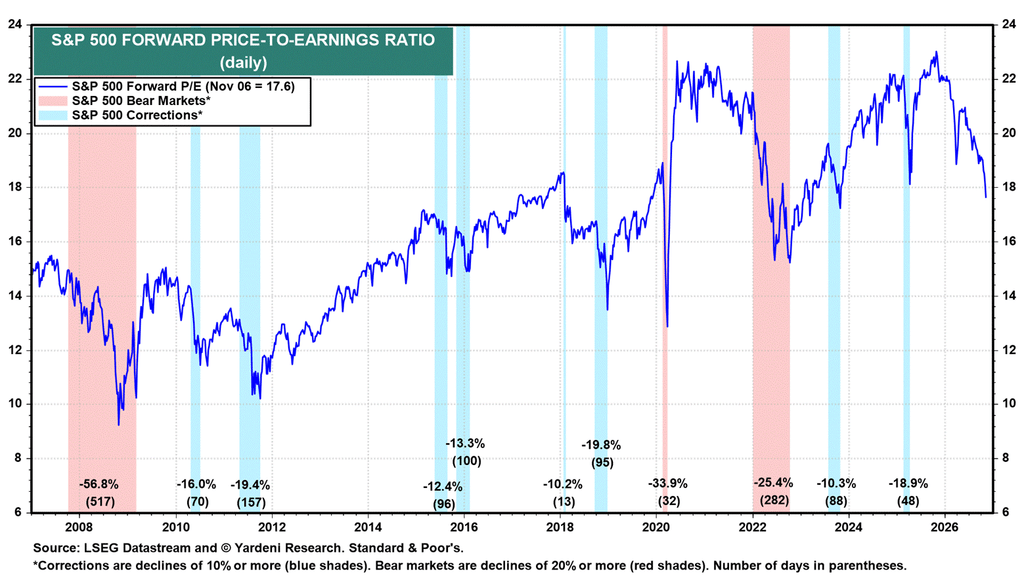
With the index falling and earnings estimates rising, the S&P 500’s forward P/E fell to 17.6 on Yardeni’s numbers, “below the 2025 liberation day low.” As he notes, “P/E plunges typically accompany corrections and recessions. The economy shows no sign of a recession anytime soon. Investors instead fear irrational exuberance in earnings forecasts.”
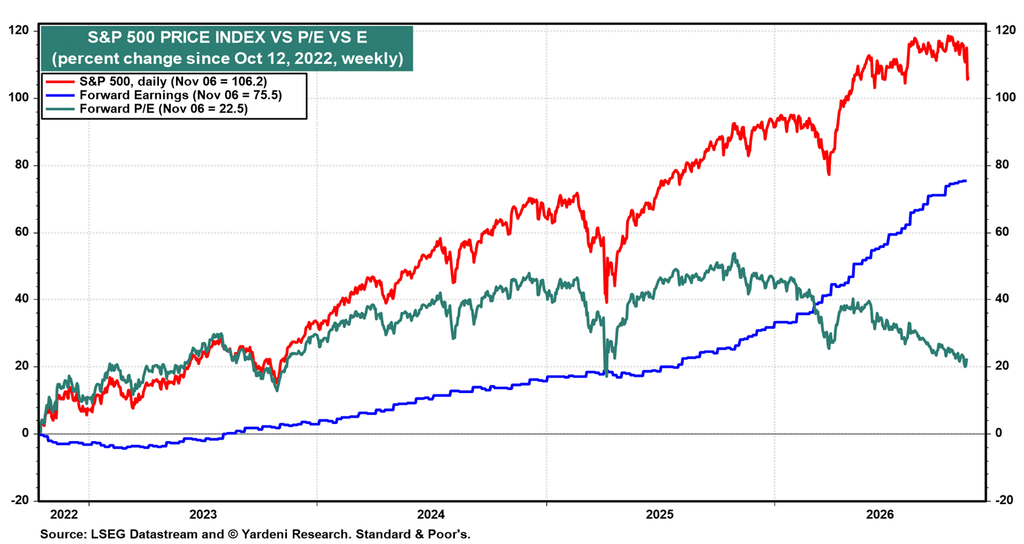
Since the bull market began on October 12, 2022, he says the S&P 500 has risen 106.2%, with forward earnings up 75.5% and the forward P/E up 22.5%. “The P/E and E both drove the rally until the forward P/E peaked in October last year. Since then, E has done all the work. Investors are finding it harder to predict the return on all the AI capital spending. They won’t pay an excessive multiple given that uncertainty.”
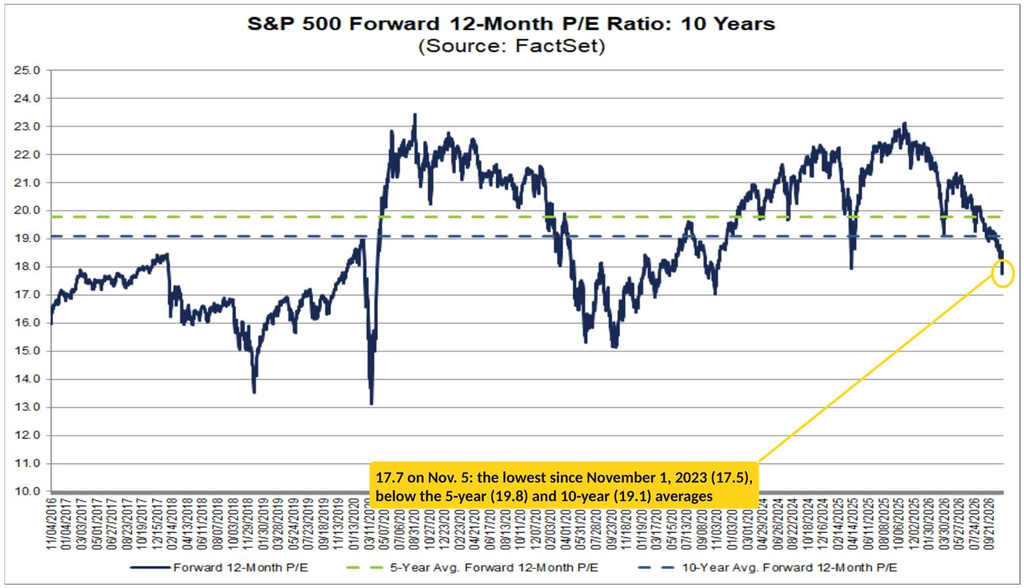
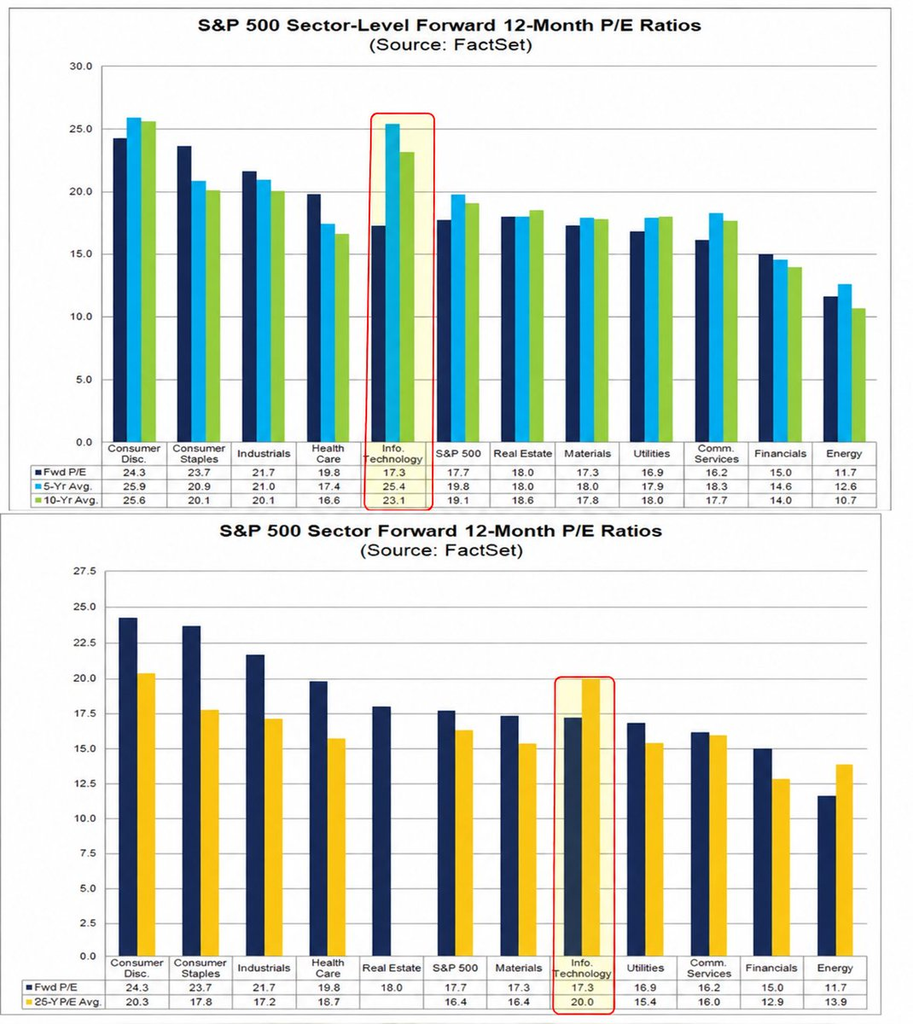
FactSet’s forward P/E* for the S&P 500 fell to a similar 17.7 (as of Thursday), the lowest since November 1, 2023 (17.5), below the 5-year (19.8) and 10-year (19.1) averages, though still above the 15-year (17.6), 20-year (16.5) and 25-year (16.4) averages. That’s down from 19.0 on September 30th, as the index fell 3.9% since then while forward EPS rose 3.1%. And Tech’s forward P/E (17.3) is now the lowest since March 23, 2020 and below its 25-year average (20.0). The trailing P/E is 24.7.
*Note P/Es can differ based on the particular metrics used for forward earnings.
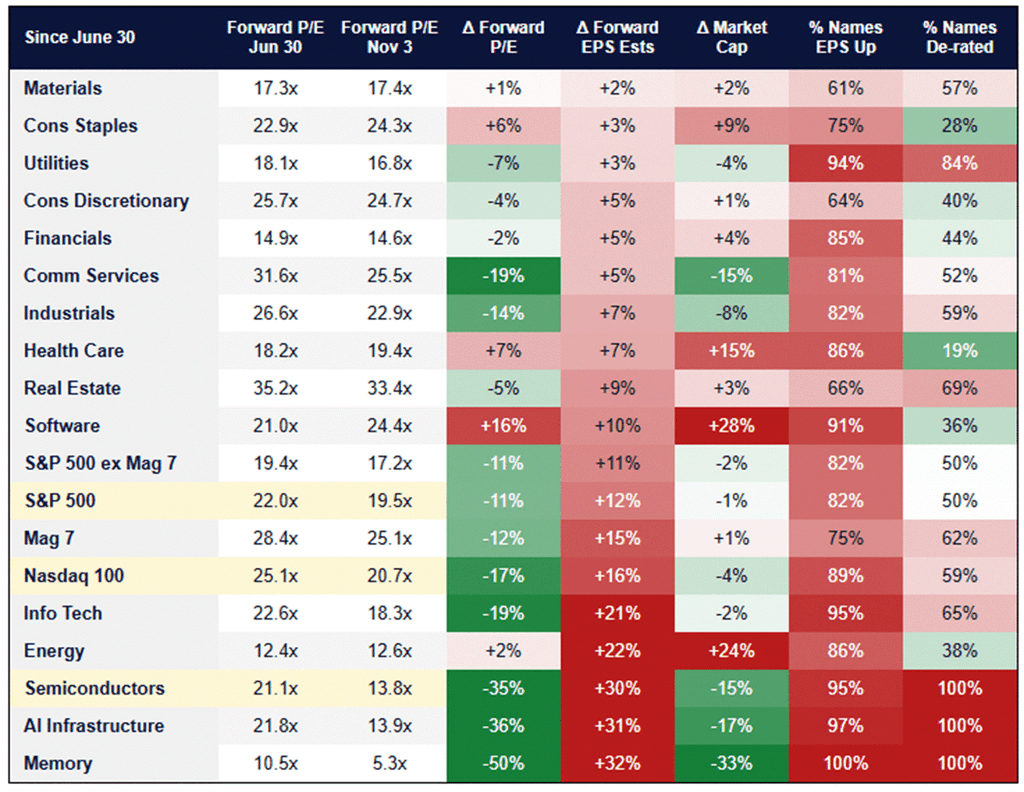
Citadel adds that the repricing has been most aggressive where estimates have risen the most. From June 30th through November 3rd (so even before the Thursday selloff), forward EPS estimates have risen 32% for Memory, 31% for AI Infrastructure and 30% for Semiconductors, while their forward multiples have contracted 50%, 36% and 35%, respectively, and all 20 S&P 500 semiconductor stocks have seen their multiples compress.
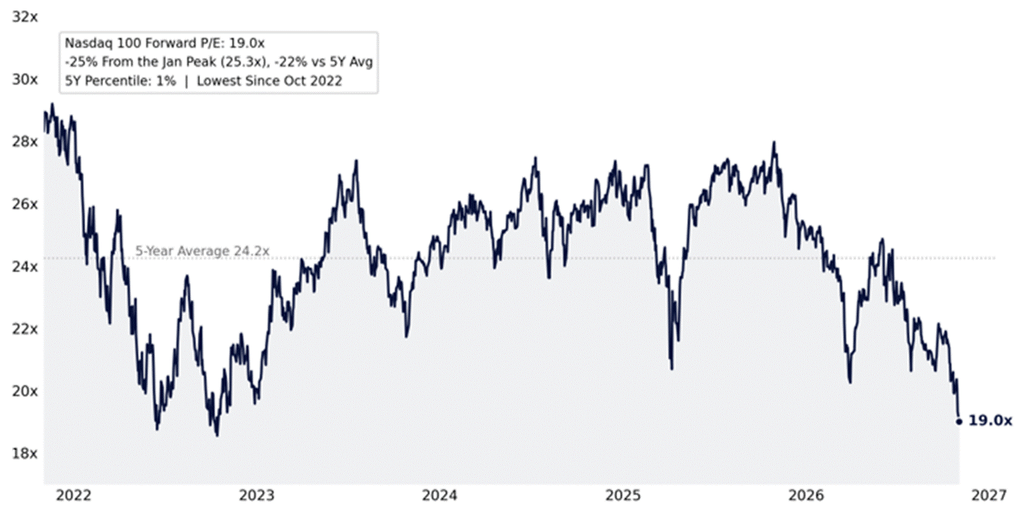
As of November 3rd (so before Thursday’s drop), the Nasdaq-100 traded at 19.1x forward earnings, its lowest since October 2022 and 24% below its January peak, just a 5% premium to the S&P 500, the smallest since January 2017 (vs. a ~20% ten-year average). Info Tech was at 18.2x, its lowest since March 2020.
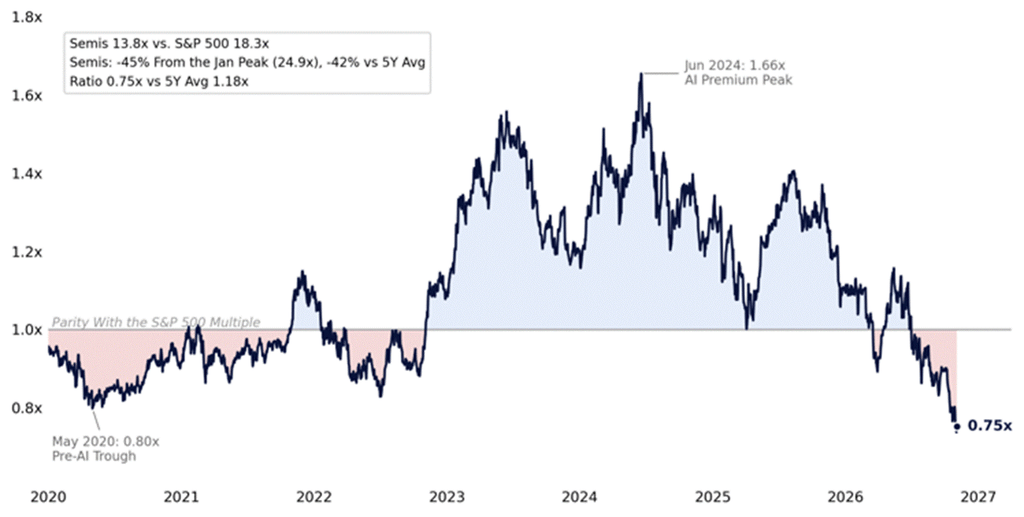
S&P 500 semis were at 13.8x, 45% below the January peak and the lowest since July 2022 (Yardeni has them at 13.1 after Thursday, “cheaper than they were during the 2022 bear market”). That’s a 25% discount to the S&P 500, the widest since December 2018, versus a 66% premium at the height of the AI trade in June 2024, even as the group is expected to account for nearly half of the S&P 500’s Q3 EPS growth. As Rubner puts it, “even a modest recovery in sentiment toward Technology (and Semiconductors in particular) could have a meaningful impact on the broader index.”
Meanwhile FactSet notes “At the sector level, six sectors had forward 12-month P/E ratios on November 5, 2026, that were below their 5-year averages and six sectors also had forward 12-month P/E ratios that were below their 10-year averages.
“However, only two sectors had forward 12-month P/E ratios on that date that were below their 25-year averages: Information Technology (17.3 vs. 20.0) and Energy (11.7 vs. 13.9). For the Information Technology sector, this marked the lowest forward 12 month P/E ratio recorded by the sector since March 23, 2020 (16.1).”
Breadth Holds Up Better Than the Index
Breadth was mixed but held up far better than the index last week, with the longer-term measures barely budging despite Thursday’s rout and the McClellan Summation Index turning positive.
The McClellan Summation Index (red line, broadly whether the typical stock is doing relatively better or worse than the index) continued its turn higher, to +35 from −321 a week earlier, back above zero for the first time since September.
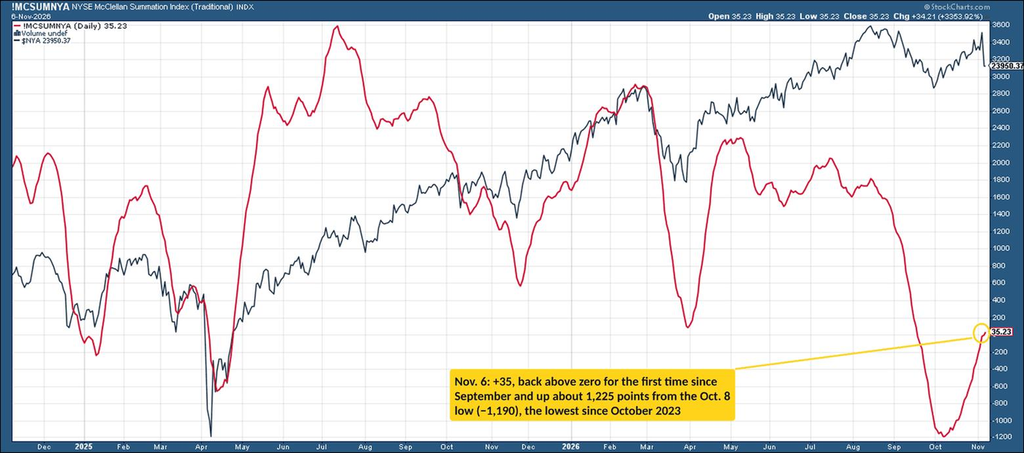
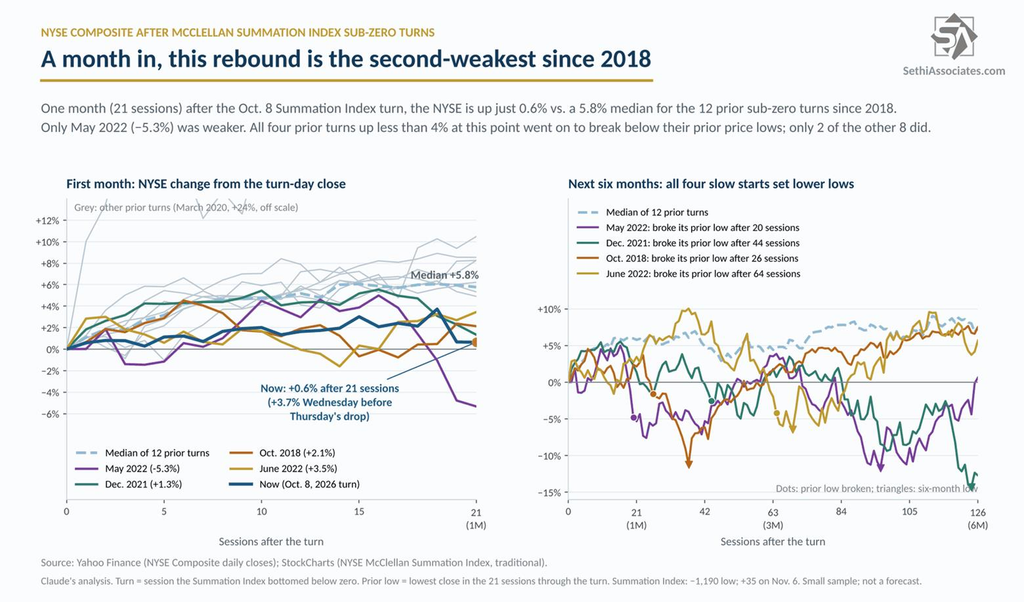
Here’s Claude’s update on the rebound from the October 8th sub-zero turn:
At the one-month mark (21 sessions), the rebound is now the second-weakest of the 13 turns since 2018. The NYSE was up 3.7% through Wednesday, but Thursday’s drop left it up just 0.6% since the October 8th turn, against a median of 5.8% for the 12 prior turns (11 of 12 were higher). Only May 2022 (−5.3%) was weaker.
Why that matters: the four prior turns that were up less than 4% a month in (May 2022, December 2021, October 2018 and June 2022) all went on to break below their prior price lows, while only two of the other eight did. The NYSE is about 2% above its September 30th low, the low ahead of the turn. The Summation Index has climbed about 1,225 points from its −1,190 low, the lowest since October 2023.
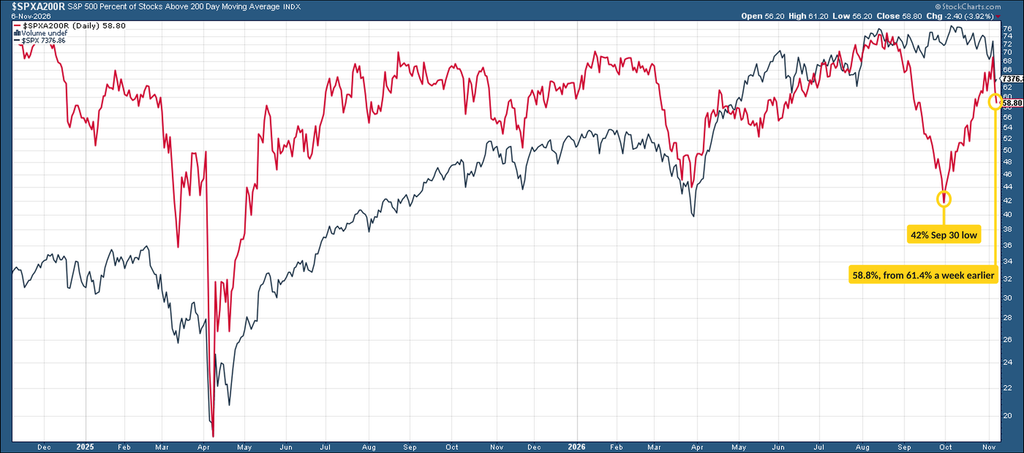
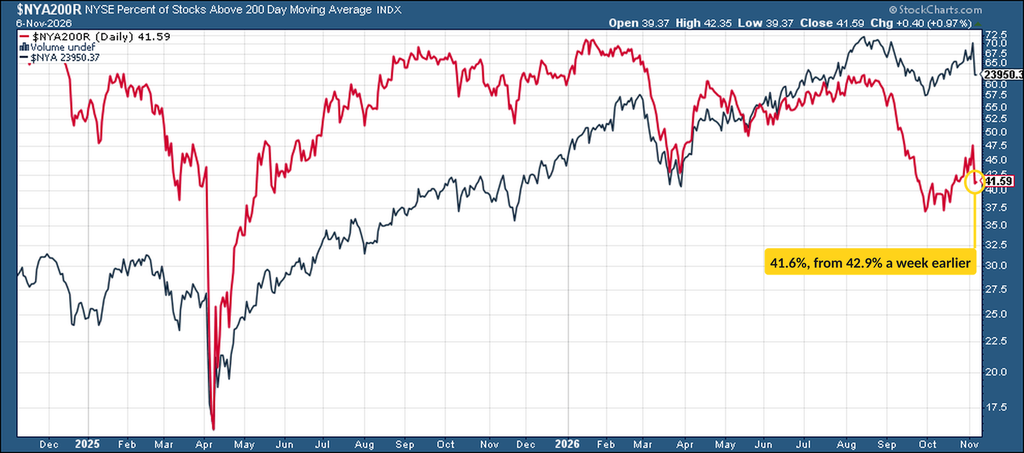
The percentage of stocks over their 200-DMAs (red lines) slipped for the S&P 500, to 58.8% from 61.4% a week earlier, but that’s still well up from 42% at the September 30th low, the lowest since May 2025.
The NYSE edged down to 41.6% from 42.9%, with the NYSE Composite (black line) now 3.5% below its August 14th record.
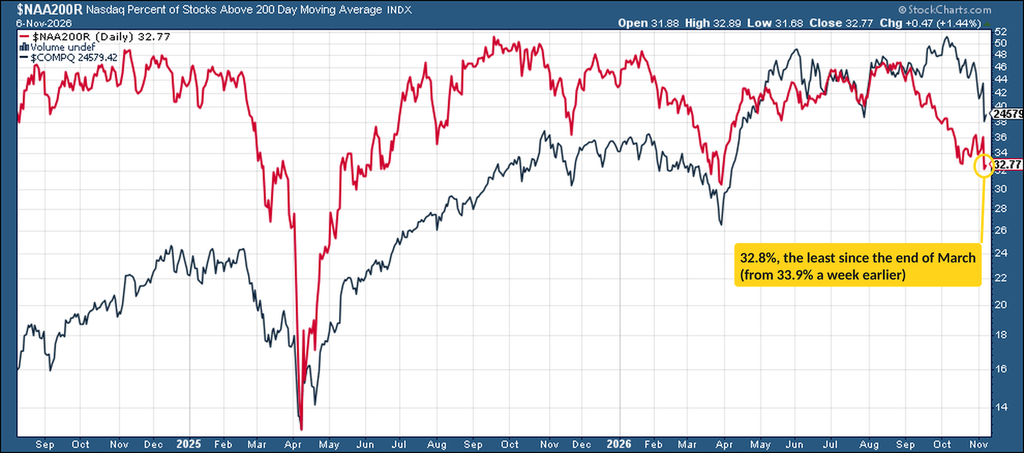
While the Nasdaq slipped to 32.8%, the least since the end of March, from 33.9%. On March 30th, the Nasdaq Composite’s 2026 low, about 30% of its stocks were above their 200-DMAs. The Composite is 18% higher now, but the share above their 200-DMAs is only about 3 points higher.
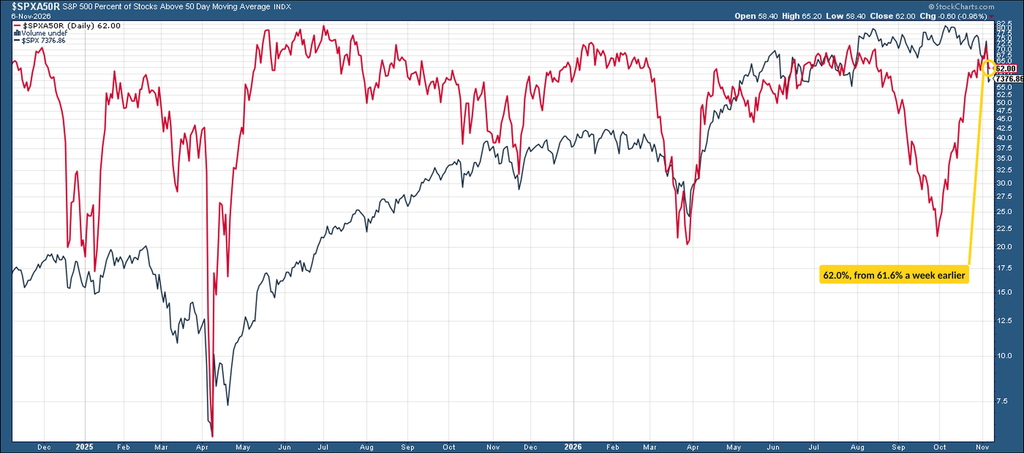
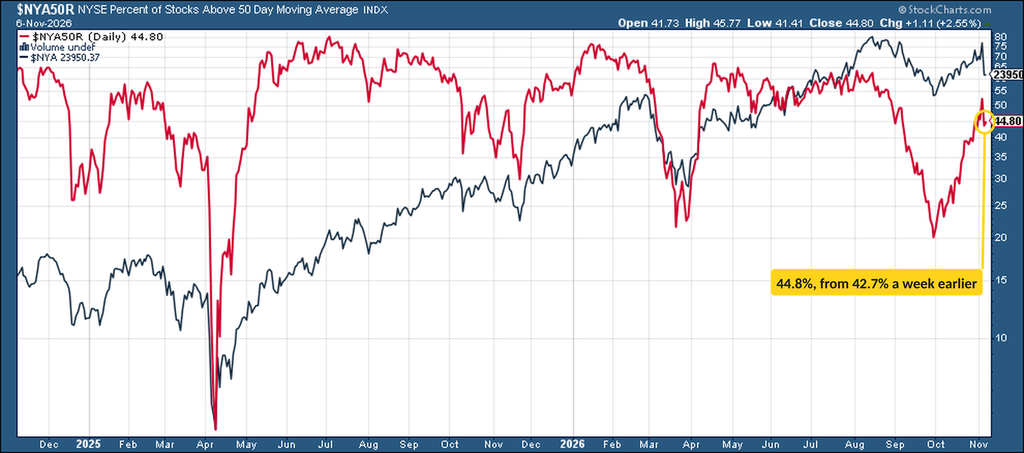
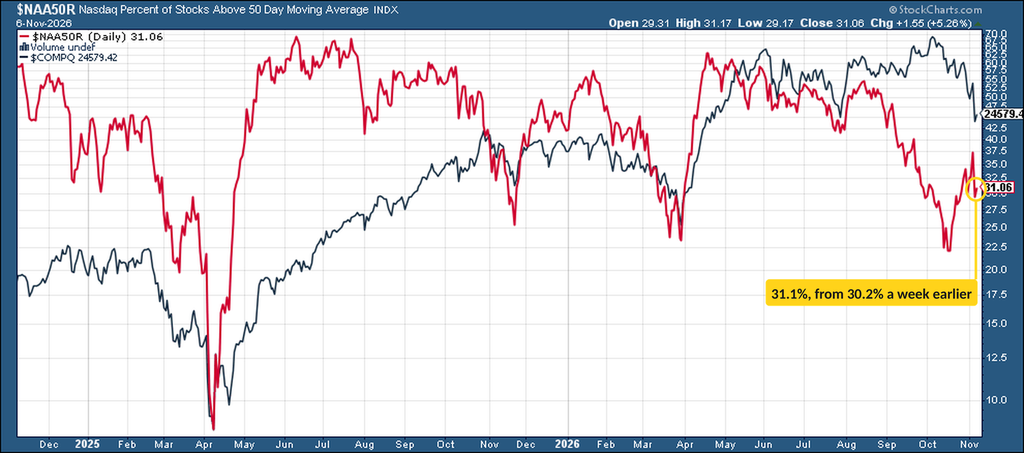
The shorter-term measures split. The 50-DMAs actually improved on all three exchanges week-over-week despite Thursday’s drop: S&P 500 62.0% (from 61.6%), NYSE 44.8% (from 42.7%), Nasdaq 31.1% (from 30.2%).
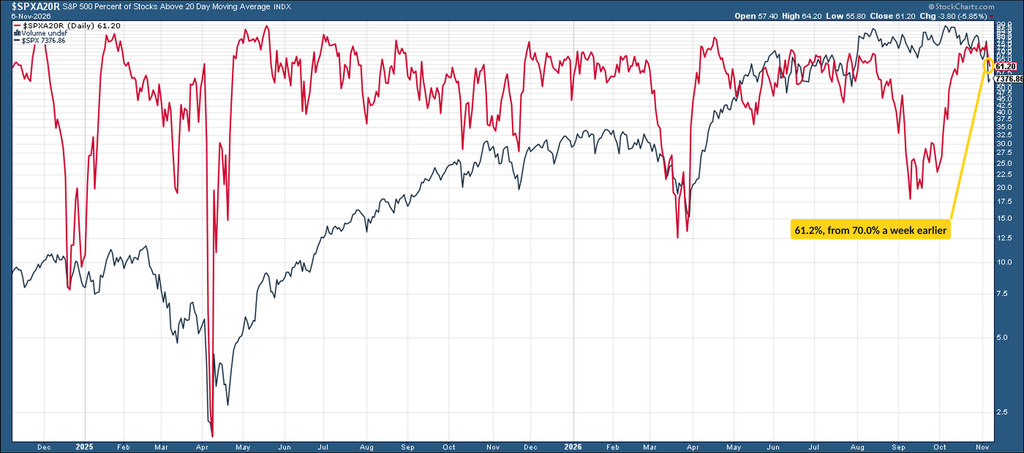
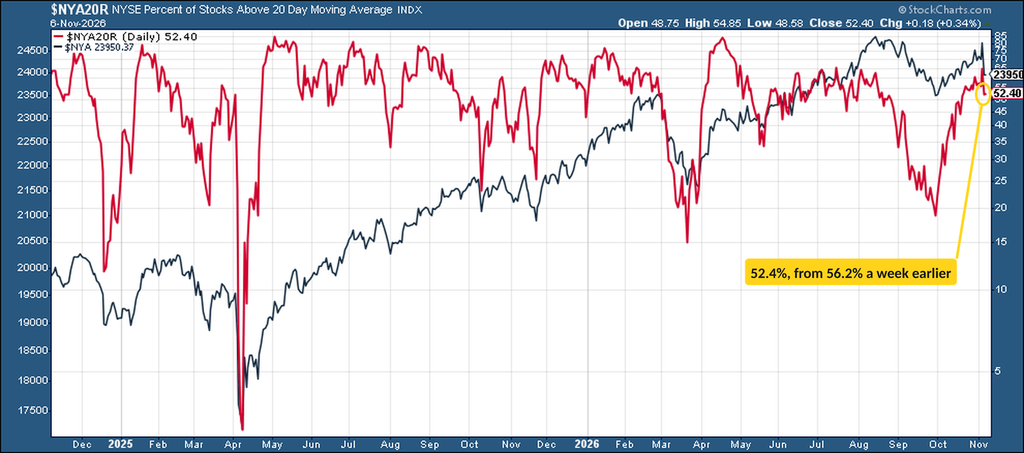
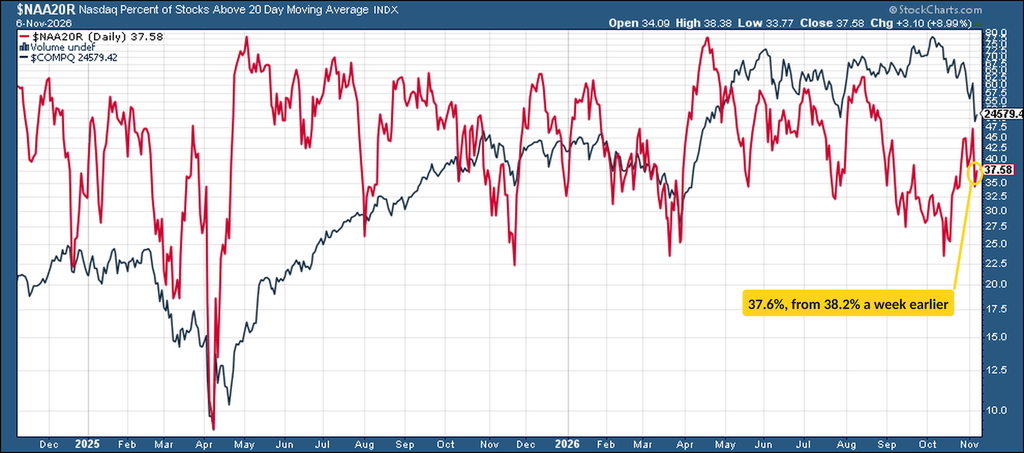
But the 20-DMAs, which react fastest, fell on all three: S&P 500 61.2% (from 70.0%), NYSE 52.4% (from 56.2%), Nasdaq 37.6% (from 38.2%).
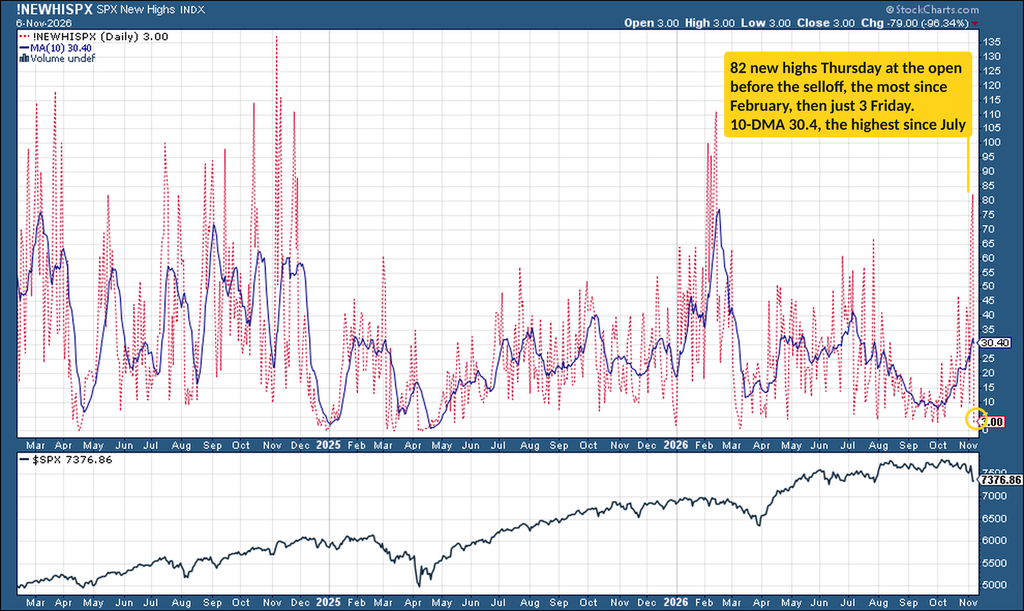
As mentioned in the Thursday evening note (AI Rout Sends the Tech Sector to Its Worst Day Since the Covid Crash), S&P 500 new 52-week highs hit 82 Thursday at the open before the selloff started, the most since February, then dropped to just 3 Friday. The 10-DMA (blue line) rose to 30.4 from 23.6 a week earlier, the highest since July.
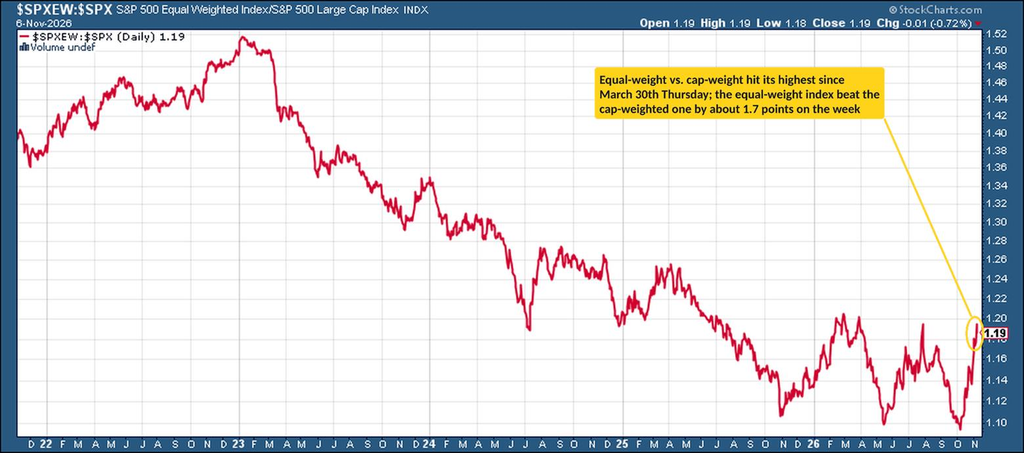
The ratio of the equal-weight S&P 500 to the cap-weighted index extended its bounce from the lowest since 2003 in early October, up to 1.19 from 1.167, hitting its highest since March 30th on Thursday as the equal-weight index fell 2.9% that day versus 4.4% for the cap-weighted one. For the week, RSP fell 1.0% versus 2.7% for SPY.
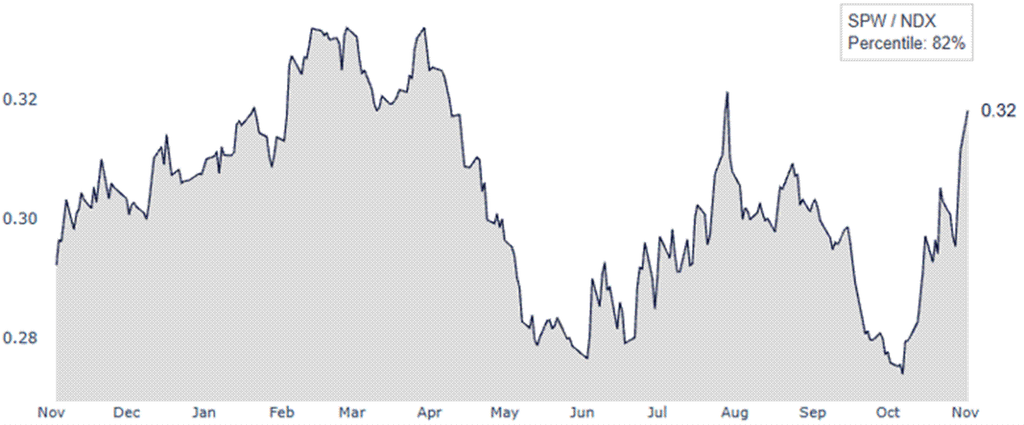
Citadel notes the equal-weight S&P 500’s 14-point outperformance of the Nasdaq-100 over the 20 sessions through November 2nd ranks in the 99th percentile of all 20-session windows since 1990, with only dot-com-era rotations wider. A median 53% of S&P 500 stocks rose on the index’s down days over that stretch, versus 31% historically, and on October 29th 406 of 503 stocks advanced even as SPY fell 38bp, the broadest positive breadth on a down day in Citadel’s history.
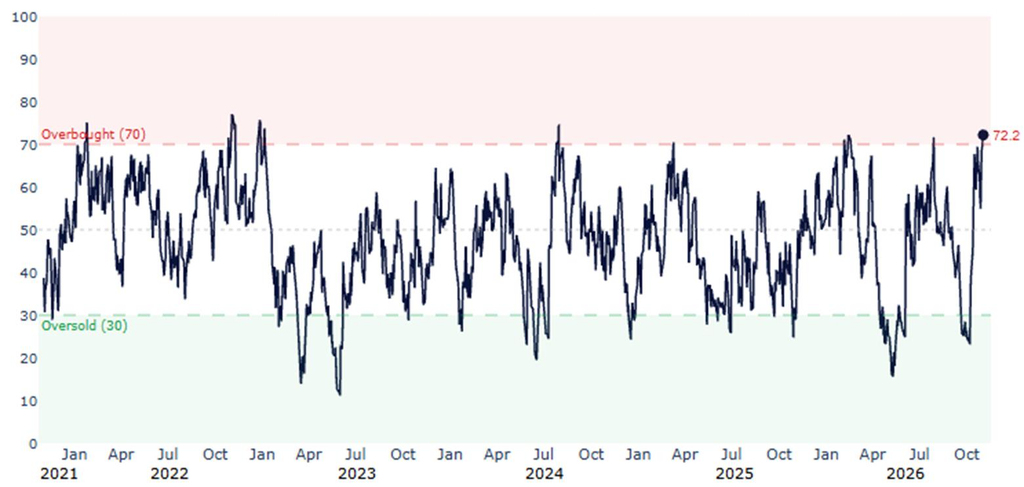
But they also flag that the RSI of the equal-weight S&P 500 vs. the Nasdaq-100 is the most overbought in more than two years, a level reached only 20 times in two decades.
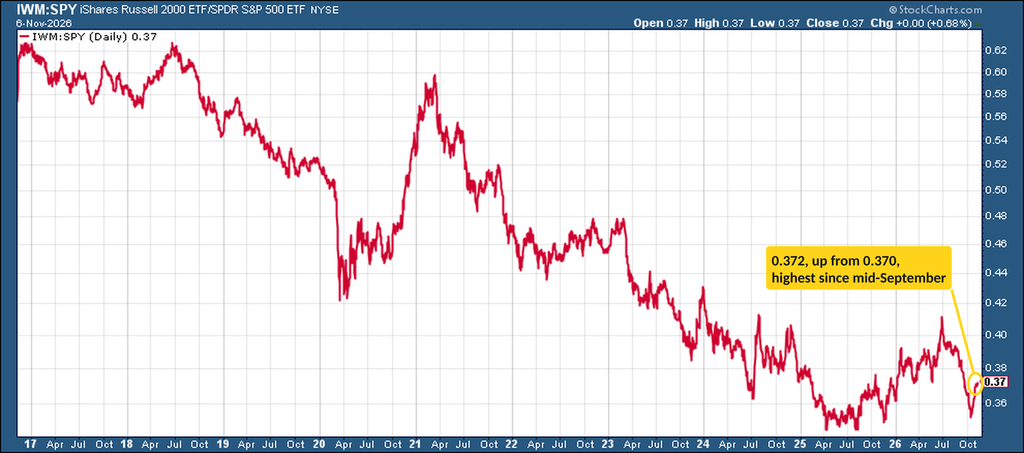
The ratio of small caps to large caps (IWM:SPY) edged up to 0.372 from 0.370, the highest since mid-September.
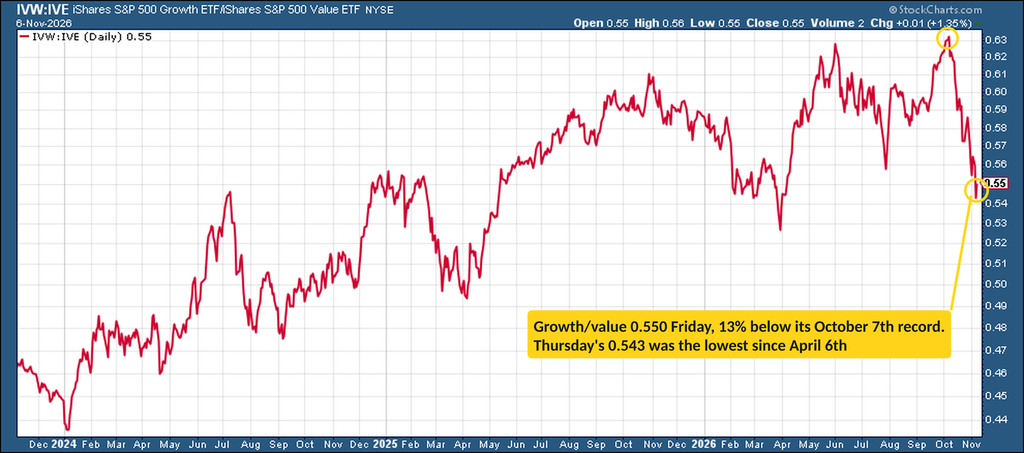
While S&P 500 growth/value (IVW:IVE) fell further, to 0.550 from 0.561, after hitting its lowest since April 6th on Thursday (0.543), and is now 13% below its early-October record.
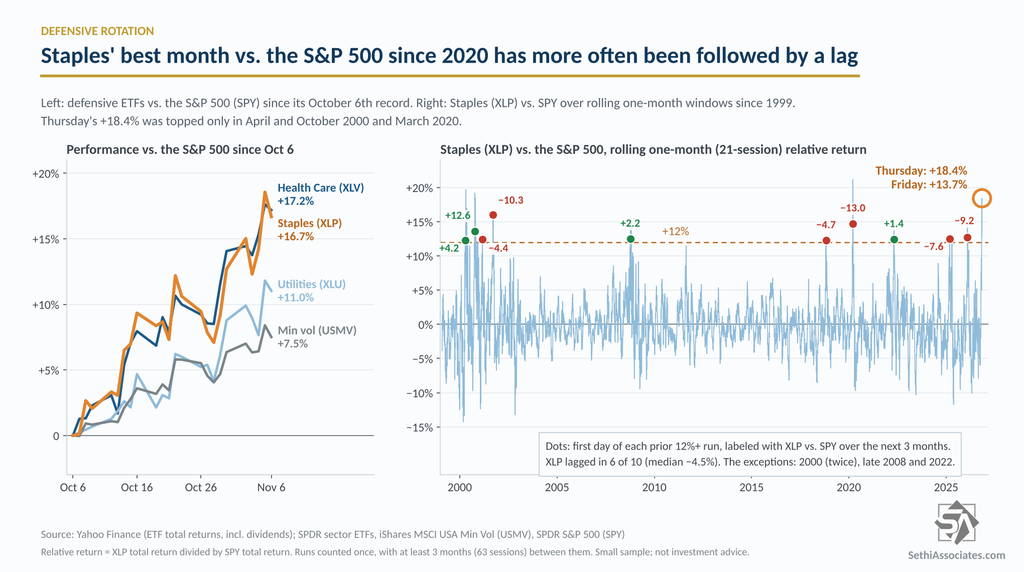
Goldman’s ETF desk notes the rotation into defensives “remains evident,” with Utilities (XLU) on track to outperform the S&P 500 for a sixth straight week (the longest streak since 2022), min vol (USMV) tracking the same, over $1.5bn into Health Care (XLV) in two weeks (the largest 9-day haul since 2022) and Staples (XLP) just shy of all-time highs.
Goldman’s thematic desk though likes shorting its Staples basket, which has outperformed the S&P 500 by nearly 20% in the last month. S&P Staples’ valuation premium to the index is the highest in 10+ years, and the basket’s 2.84% dividend yield is 2.05pp below the 10-year Treasury yield, the 1st percentile of the last 10 years. Historically, Staples have lagged over the next three months after similar runs, except in late 2021/early 2022.
Positioning Gets Cleaned Out in a Hurry
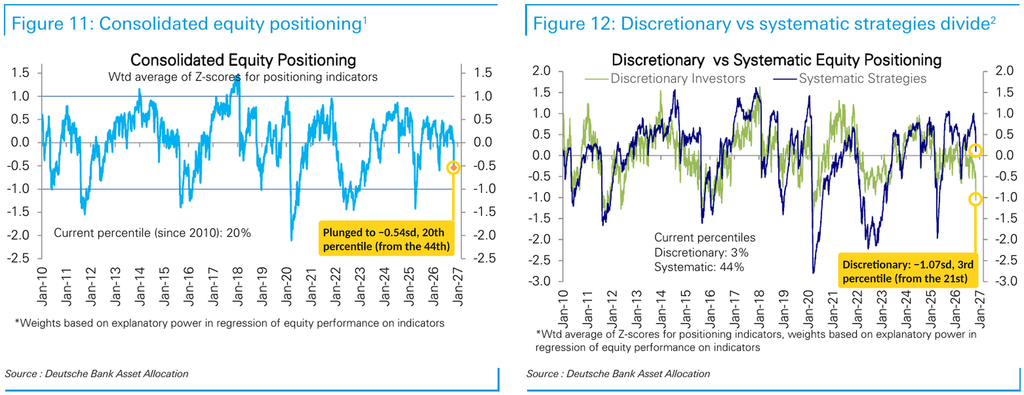
Starting with Deutsche Bank, who says “overall equity positioning has plunged to a sizeable underweight in one of the sharpest weekly drops on record,” now at the 20th percentile (from the 44th).
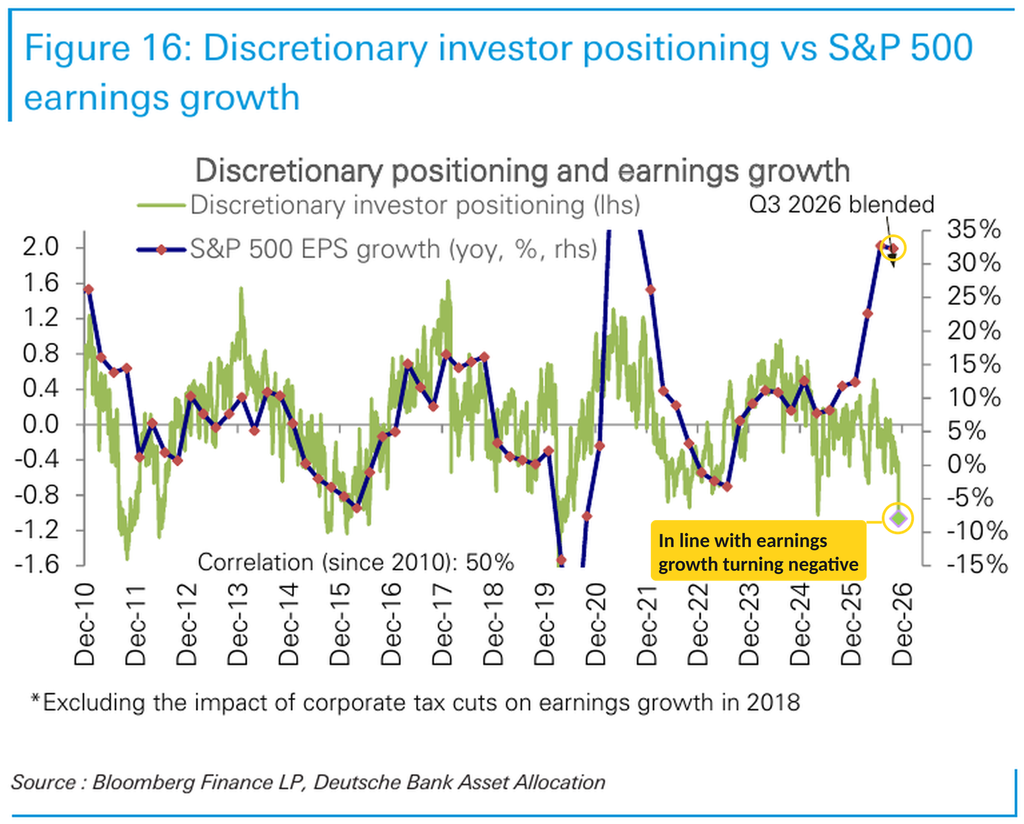
“Discretionary investor positioning is now more than 1sd below neutral and at the bottom of its historical band (-1.1sd, 3rd percentile) while systematic strategies have slashed exposure to neutral (0.1sd, 44th percentile).”
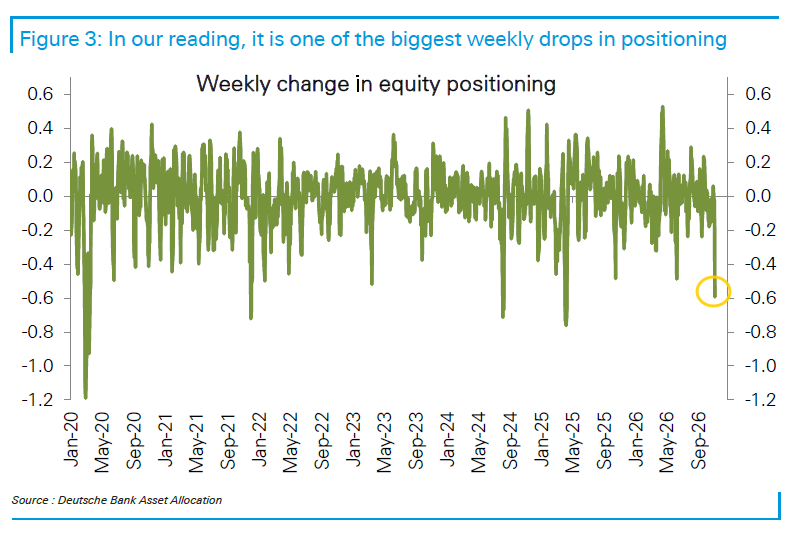
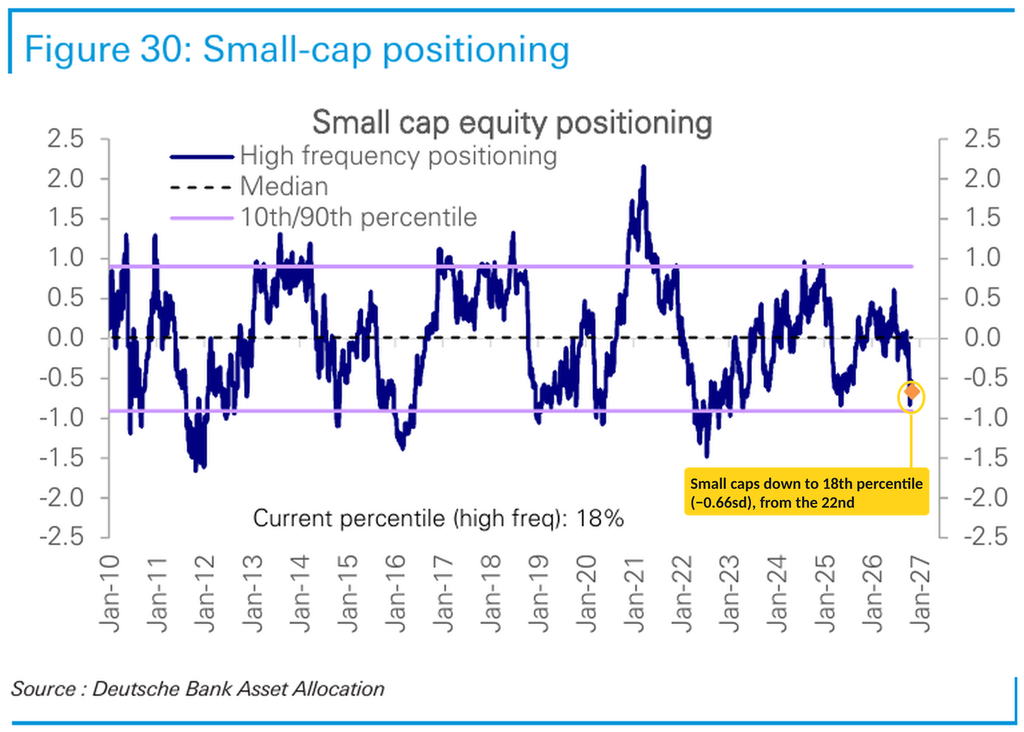
Large-cap positioning fell to underweight (24th percentile, from the 66th) for the first time in seven months, “now in line with zero earnings growth for the S&P 500, and small caps to the 18th (from the 22nd). Within large caps, discretionary investors are deeply underweight (9th percentile in their chart), a level DB says is in line with earnings growth turning negative, against Q3 growth of 34%.
“Investors clearly view the current earnings growth boom as narrow and unsustainable. But where should the line be drawn? For context, note that the median company in the S&P 500 index also sported a growth rate of nearly 15% in Q3.”
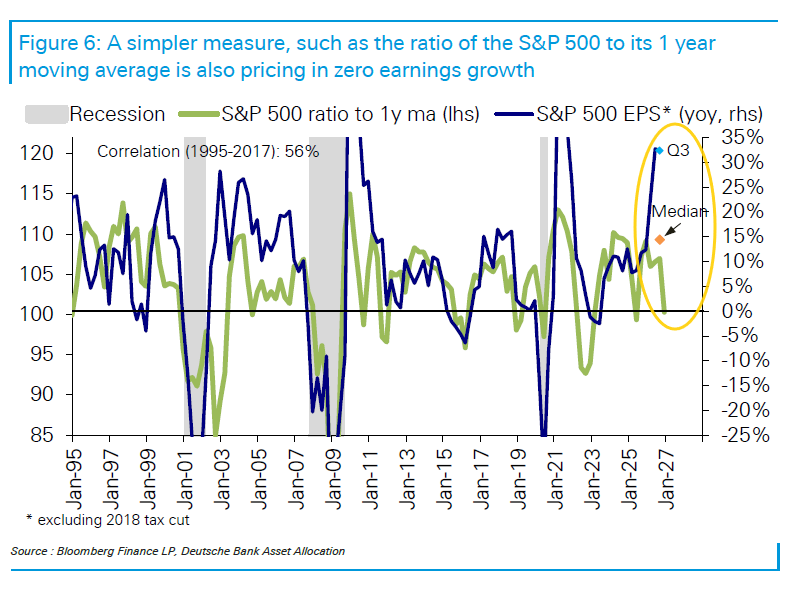
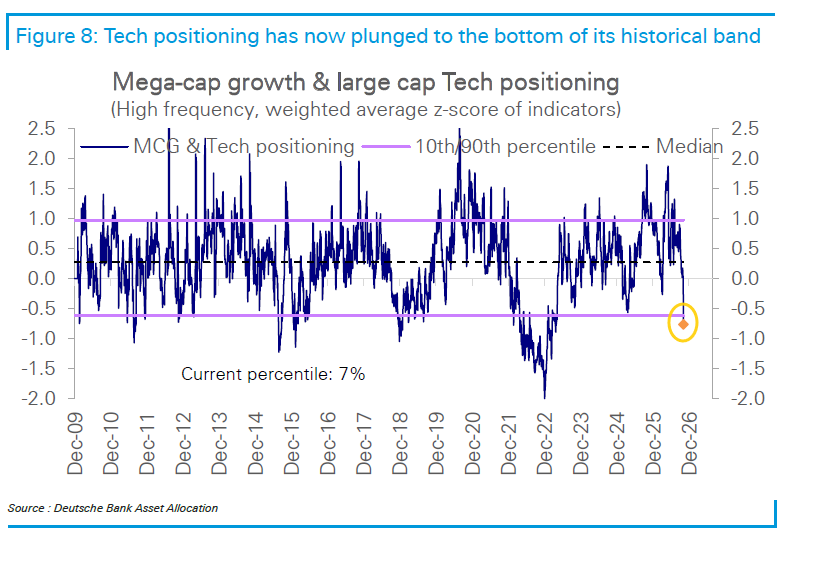
Tech positioning plunged to the 7th percentile (from the 40th). DB says that’s in line with earnings growth turning negative, versus 53% in Q3 (and 35% for the median Tech company).
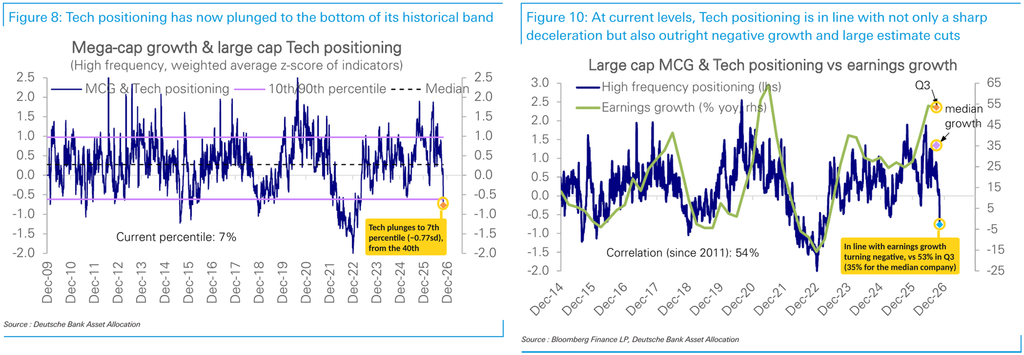
The note “Tech…positioning has fallen to the bottom of its historical band and broken below positioning for the rest of the S&P 500. Tech positioning is now below Liberation-day lows.”
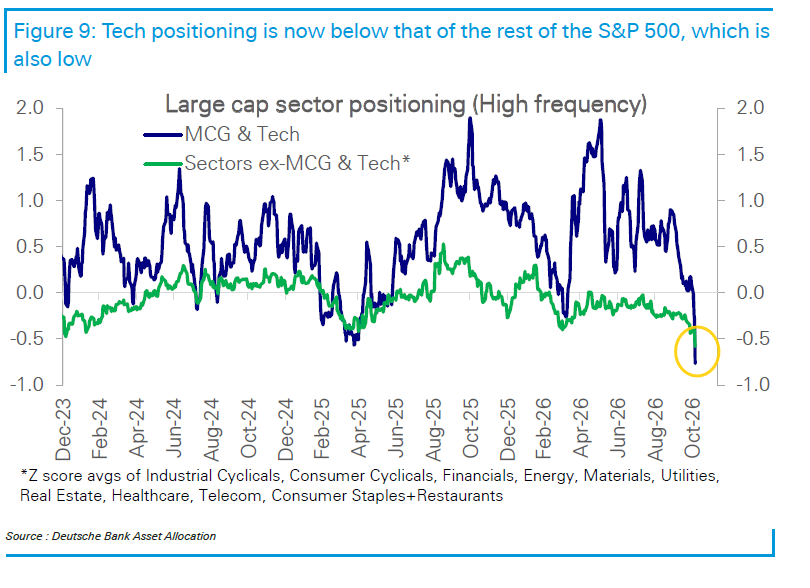
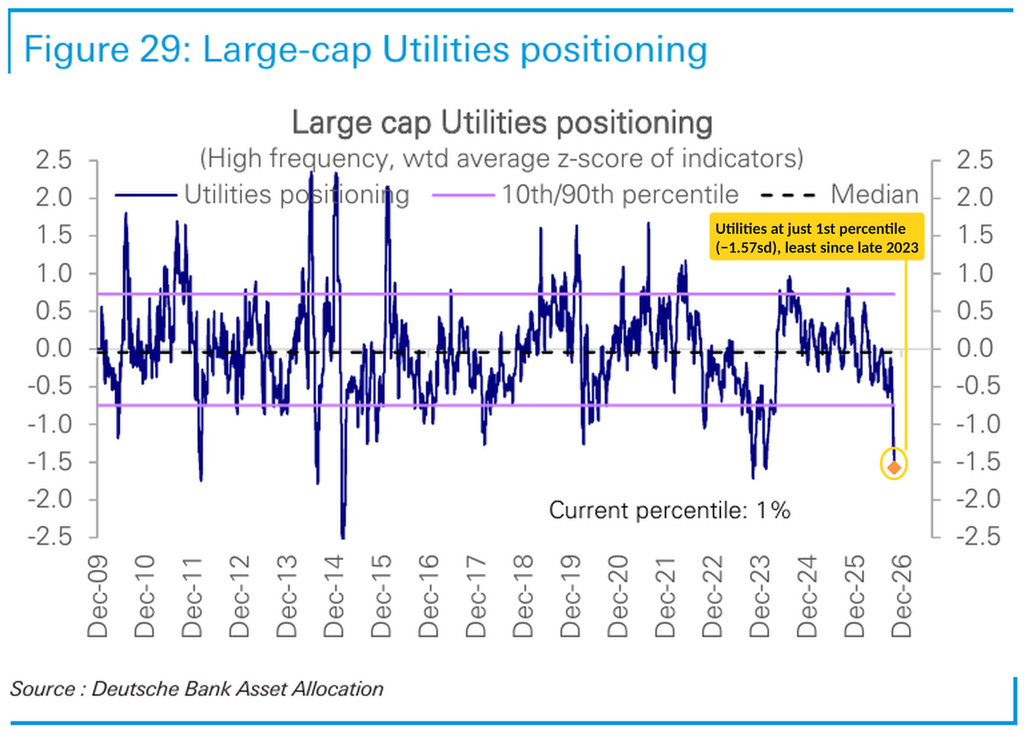
Outside of Tech, sector positioning is also low, with Utilities (1st), Consumer Staples (4th), Consumer Cyclicals (4th) and Real Estate (9th) the lowest and Energy (72nd) and Healthcare (60th) the only sectors overweight.
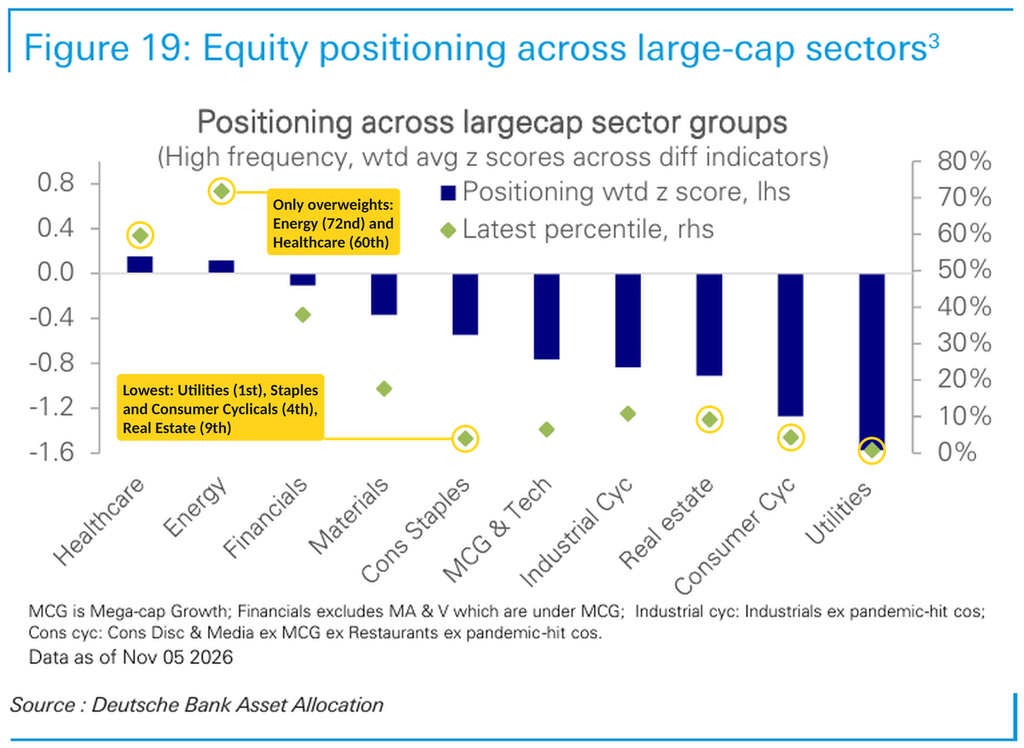
Despite rallying almost 10% since the start of October, Utilities positioning is in just the 1st percentile, the least since late 2023.
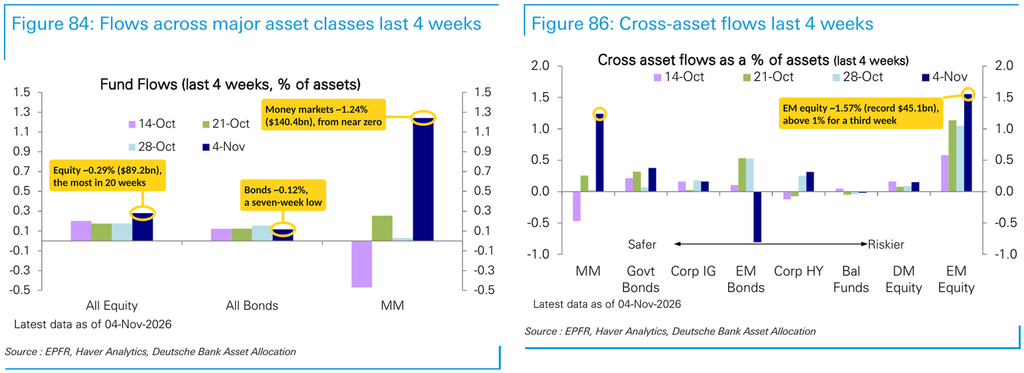
Fund flows were heavy into the selloff. Per DB’s read of EPFR data (week through Wednesday, November 4th), equity funds took in ~0.29% of assets ($89.2B), the most in 20 weeks, bond fund inflows eased to ~0.12% (a seven-week low), and money market inflows surged to ~1.24% ($140.4B, from near zero the prior week).
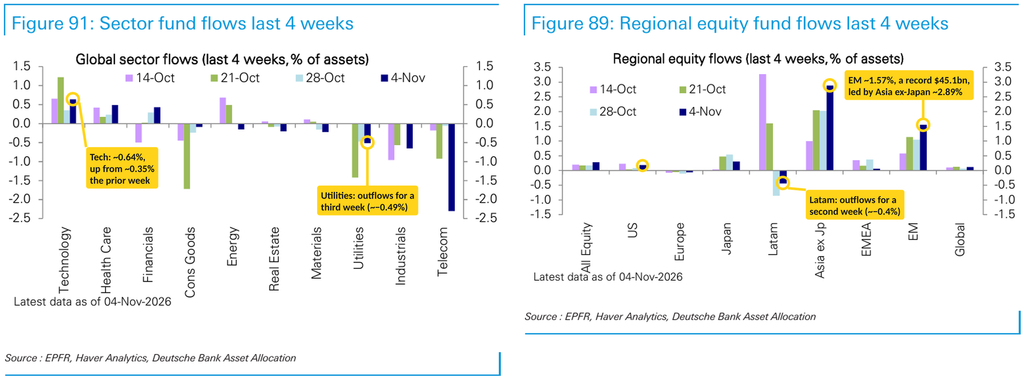
Risk appetite for foreign equities led again this week. EM equity funds took in more than 1% of assets for a third week (~1.57%, a record $45.1B per DB), led by Asia ex-Japan (~2.89%), while Latin America saw outflows for a second week (~−0.4%) after big inflows in mid-October, and US equity funds took in ~0.19%. By sector, Tech funds saw larger inflows (~0.64%), up from the prior week’s ~0.35%, while Utilities saw outflows for a third week (~−0.49%).
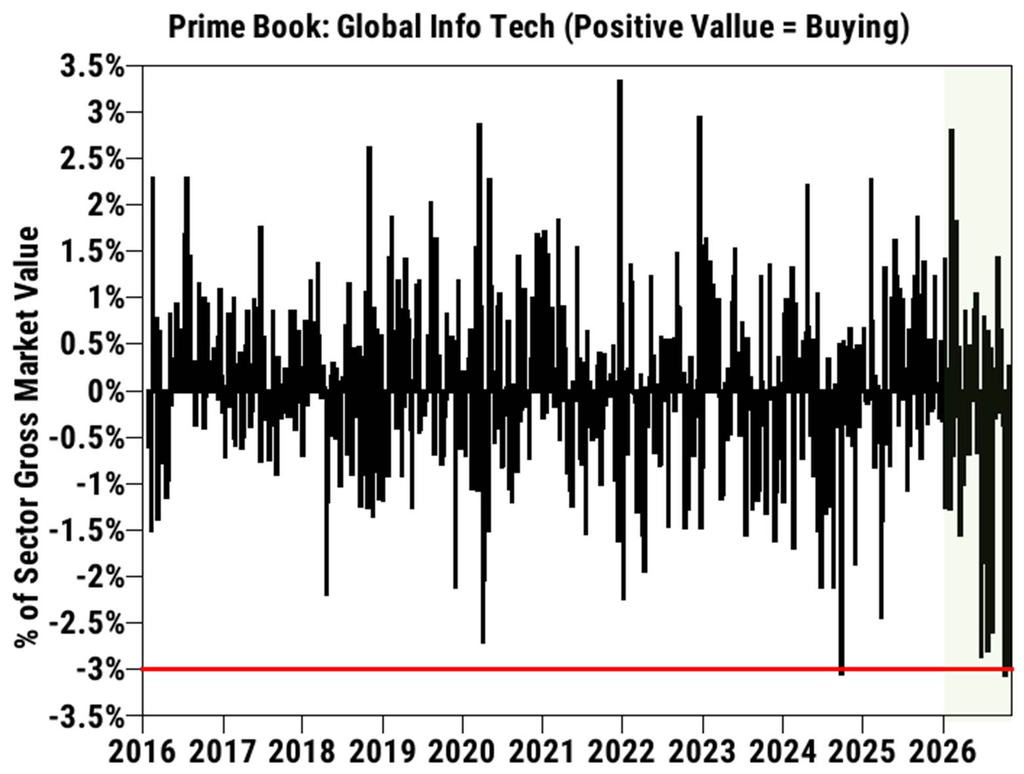
Goldman’s look at hedge funds through Thursday finds they were modest net sellers, with the selling concentrated in single stocks. Goldman’s Prime Book saw hedge funds net sell US equities (October 30–November 5, −0.4 SDs vs. the past year), driven by the largest single-stock net selling in more than four months (−2.1 SDs), partially offset by a second straight week of buying in index and ETF products (+1.5 SDs, with long buys outpacing short covers ~3 to 1). But US-listed ETF shorts jumped 7% on Thursday alone, the largest one-day increase since March (third largest in five years), and rose 3.3% on the week.
Info Tech was by far the most net sold sector, both in the US and globally, and in percentage terms the selling in global Tech was about on par with mid-October and September 2024, the largest net selling weeks on Goldman’s record (since 2016). Four of the top five net selling weeks in global Tech have now come in the past five months. Semis & Semi Equipment led the selling, while Software was the most net bought. US Info Tech is now just 14.4% of hedge funds’ US net exposure, approaching multi-year lows (1st percentile on both a 1- and 3-year lookback). Hedge funds also sold Industrials at the fastest pace (in percentage terms) since April 2020, the second largest on Goldman’s record, taking the sector’s long/short ratio to 1.61, the lowest since January 2024. Utilities, Real Estate and Financials were the most net bought.
In line with Goldman’s comment, Sonu Varghese of Carson Research noted (via Daily Chartbook‘s nightly email), the six-month return gap between Goldman’s Broad AI index and its S&P 500 ex-AI index plunged to around -35 percentage points this week. That’s the worst reading of the four-year bull market by a wide margin. It’s nearly three times as bad as the roughly -10-point trough after the DeepSeek shock and the tariff selloff in early 2025, and the roughly -12-point low during the summer 2024 rotation and yen carry-trade unwind. It’s also a swing of roughly 100 points from the +67 peak in September 2025.

With the selling last week, Goldman’s latest update says that through Thursday US Fundamental Long/Short (L/S) Gross leverage fell 8.7 pts – the largest weekly decline since Covid (March ’20) – to the 26th percentile one-year, while US Fundamental L/S Net leverage fell 3.7 pts – the largest weekly decline since the week of liberation day (Apr ’25) – back down to the 0th percentile five-year.
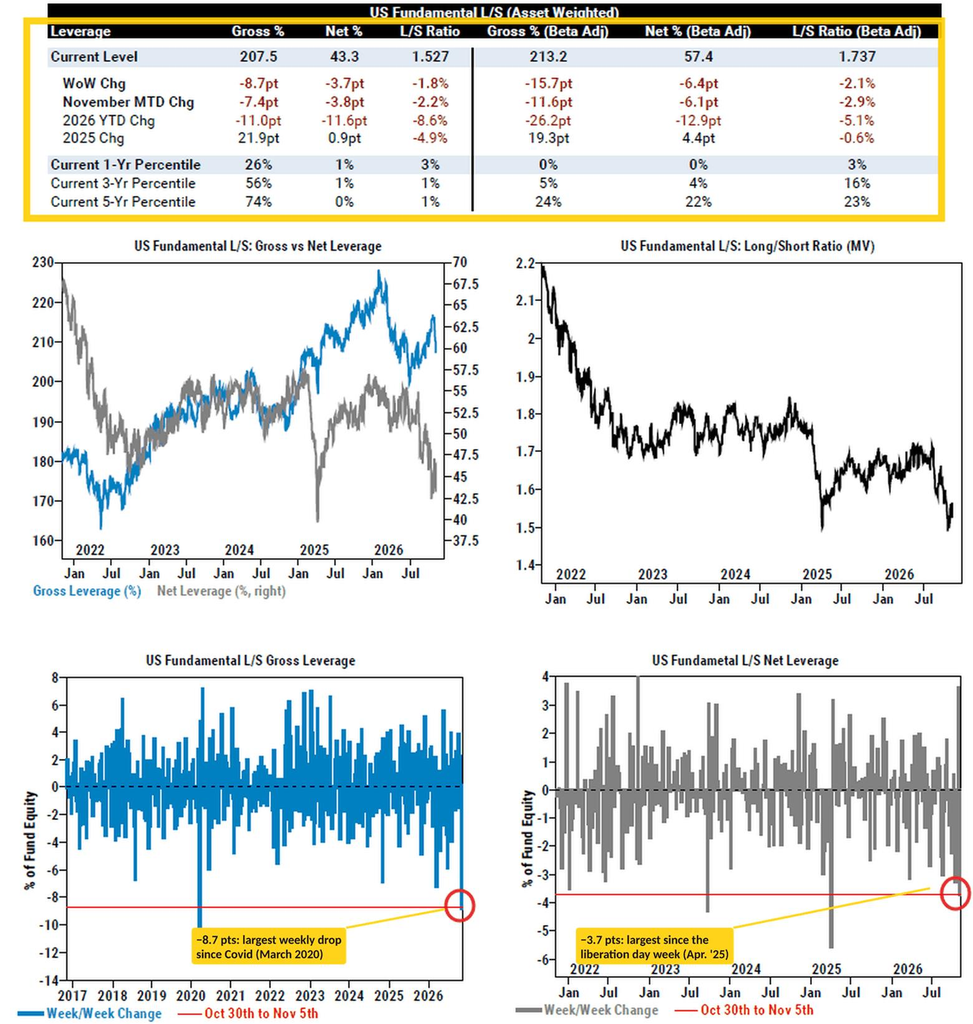
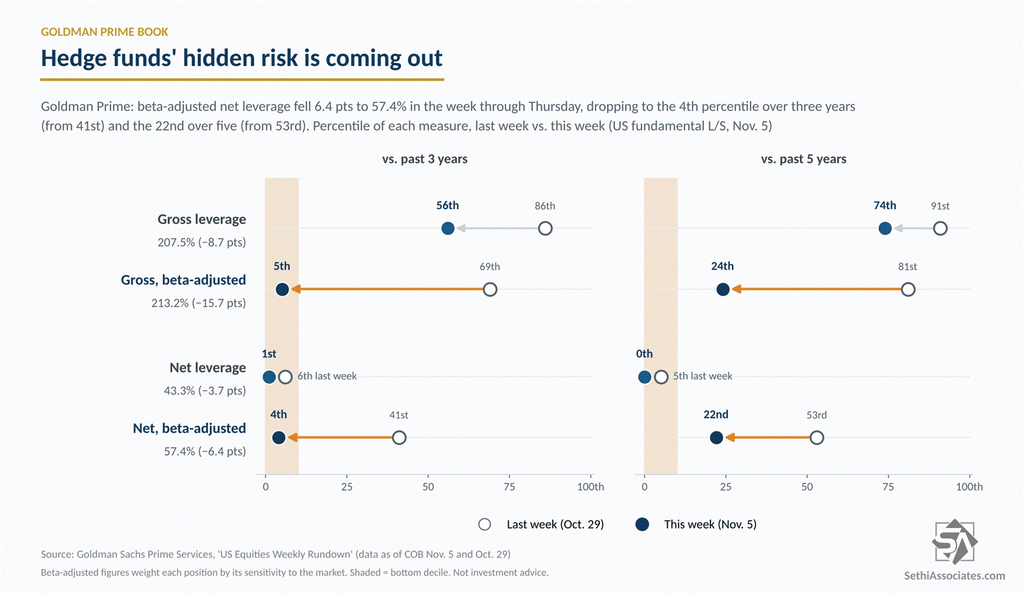
And while last week I had mentioned that the beta-adjusted figures were much higher (beta-adjusted net leverage was 63.9%, only at the 41st percentile over three years and the 53rd over five, vs. the 5th for raw net), meaning there was more risk in hedge fund books than it appeared, those dropped sharply to 57.4% (−6.4 pts), the 0th percentile one-year, the 4th over three years and the 22nd over five. Beta-adjusted gross fell even more, down 15.7 pts to 213.2%, the 0th percentile one-year and the 5th over three years (from the 69th). That would imply their longs’ average beta slipped to about 1.08 from 1.11, meaning they mostly sold their highest-beta longs (AI/semis).
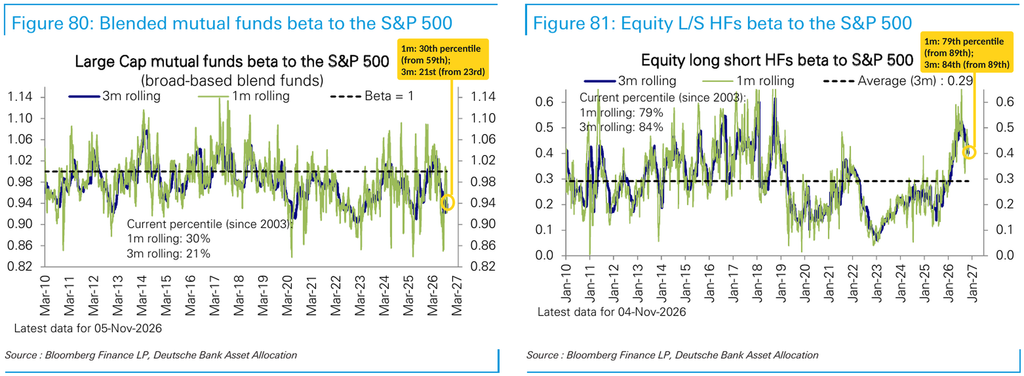
DB’s beta measures point the same way: equity long/short hedge funds’ rolling beta to the S&P 500 is at the 79th percentile (since 2003) on a 1-month basis (from the 89th) and the 84th on a 3-month basis (from the 89th), while large-cap mutual funds are at the 30th percentile on a 1-month basis (from the 59th) and the 21st on a 3-month basis (from the 23rd).
Goldman’s Shares desk says Friday’s bounce, with semis up ~3.5%, “felt ‘healthy’ and not just a beta squeeze.” Long-only tickets were balanced within TMT, “with tails of Semis supply paired with a few green shoots of demand vs a much clearer sell skew of ‘All Things AI'” on Thursday. Hedge funds finished net buyers Friday on “a broad cover bid across sectors / macro expressions,” with ETFs eclipsing 37% of the tape (vs a 28% year-to-date average). For the week, asset managers finished moderate net sellers (“steady drumbeat of semis supply”), while hedge funds finished net buyers on Friday’s covering.
Goldman’s derivatives desk says the main story was Thursday’s “extreme vol repricing.” Clients had “aggressively taken off protection” into Wednesday’s post-midterm relief rally, leaving the market underhedged heading into Thursday’s reversal, and “as equities unwound and forced liquidations emerged across the HF community, we saw a scramble to buy back protection that was just sold.”
Goldman’s vol panic index jumped to 9.57 out of 10, back in the panic zone (9.5+). That was its third-largest daily jump ever, coming right after Wednesday’s fourth-largest drop, making the two-day swing the largest on record. Vol of vol (VVIX) had its second-largest one-day increase ever, behind only “Volmageddon” in February 2018, Nasdaq’s VIX (VXN) hit its highest since liberation day, the VIX curve flipped into “sharp backwardation,” and over 11 million puts traded Thursday, the largest put volume day on record (topping April 2025).
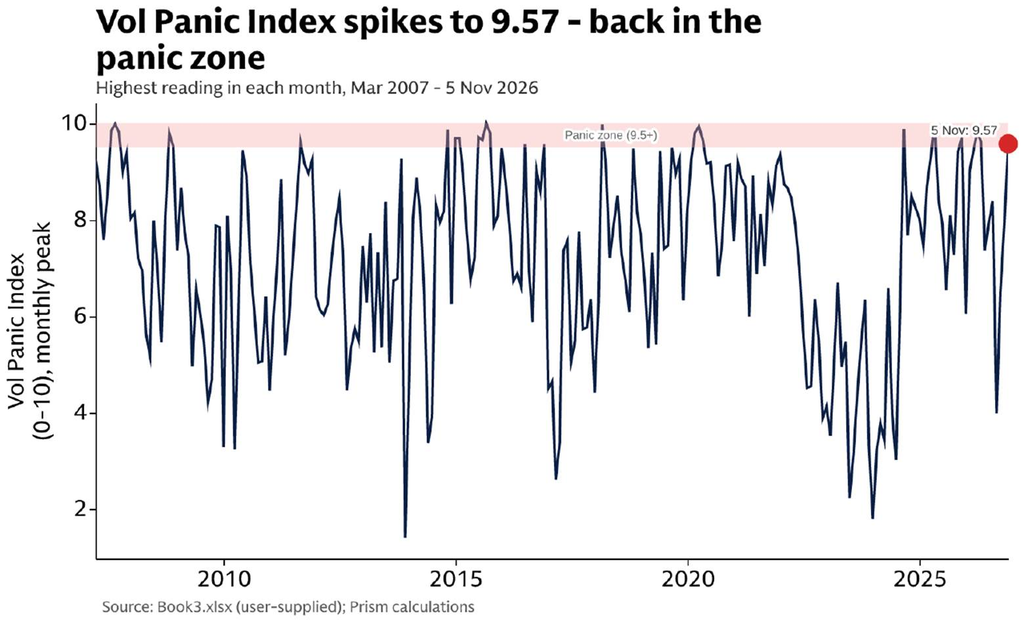
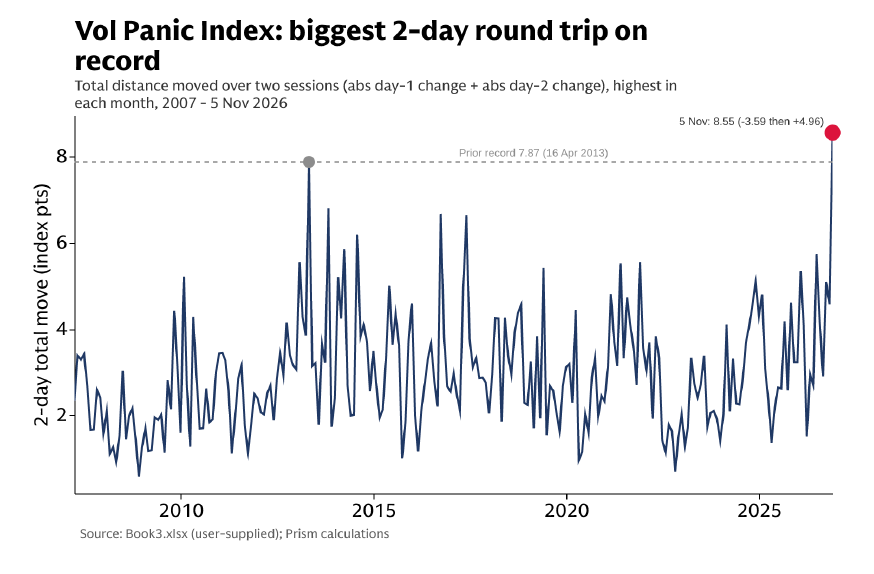
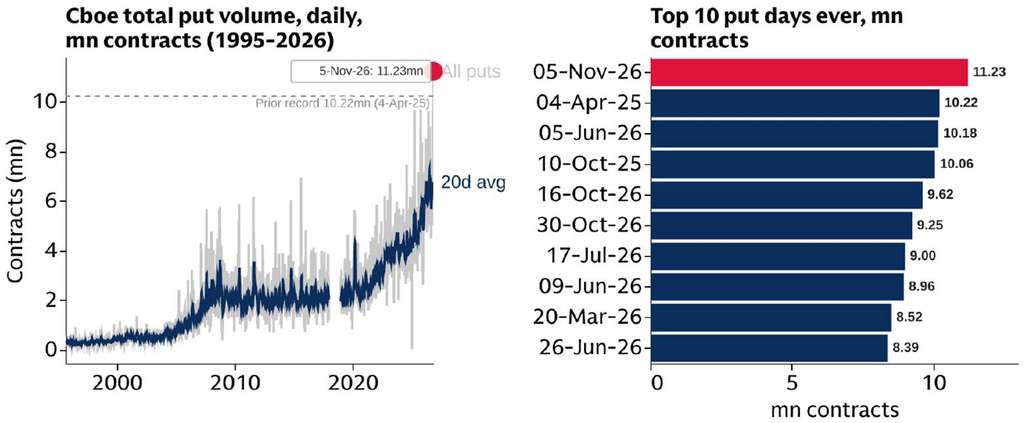
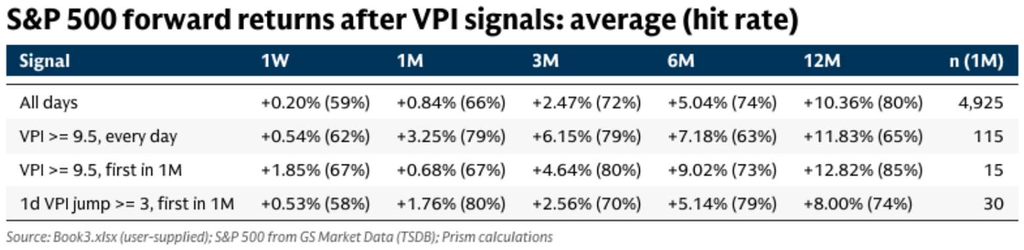
But they note history is “somewhat encouraging once panic reaches these extremes.” After the prior 15 panic signals above 9.5, the S&P 500 gained an average 4.6% over the next three months (higher 80% of the time) and 9.0% over six months (73%), although “the immediate path has been much less reliable, particularly while still in price discovery mode.”
For perspective, a week ago options priced a 1.84% move for the S&P 500 through Friday; it fell 2.7% on the week. The straddle through next Friday’s close, covering CPI, is priced at a 2.48% move.
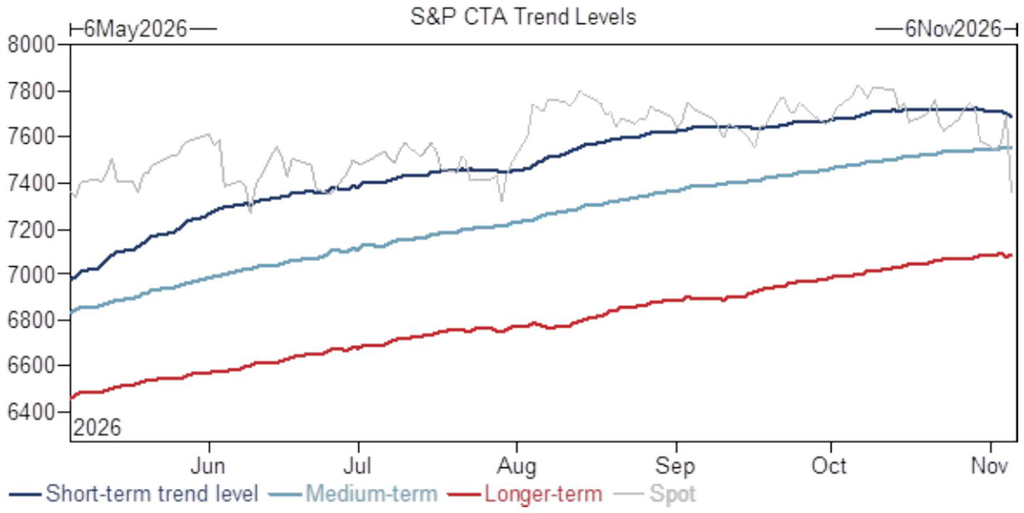
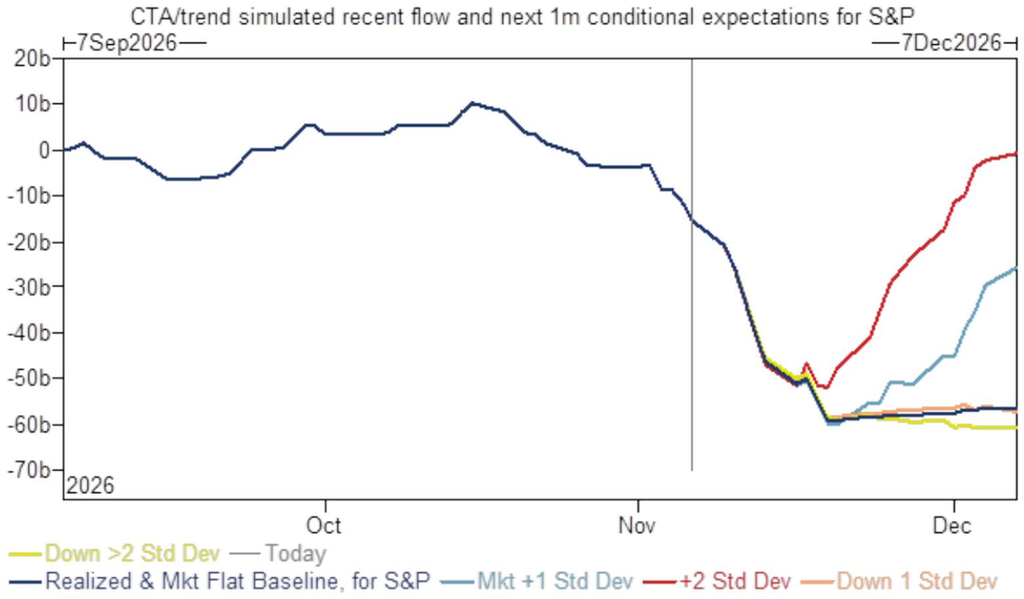
Turning to the systematic community, Goldman’s futures desk says CTA signals are now negative in around 60% of global equity markets at the short- and medium-term horizons, including the S&P 500, where the levels are around 7,685 and 7,550. It expects CTAs to sell $28bn of S&P futures over the next week and $45bn over the next month in its baseline scenario, “which would take the position to overall net short.”
The S&P 500 closed Friday at 7,376.86, below both levels and its 100-DMA (7,619), though Thursday’s low (7,350.35) held just above the 200-DMA (7,325), which the index hasn’t closed below since April 7th.
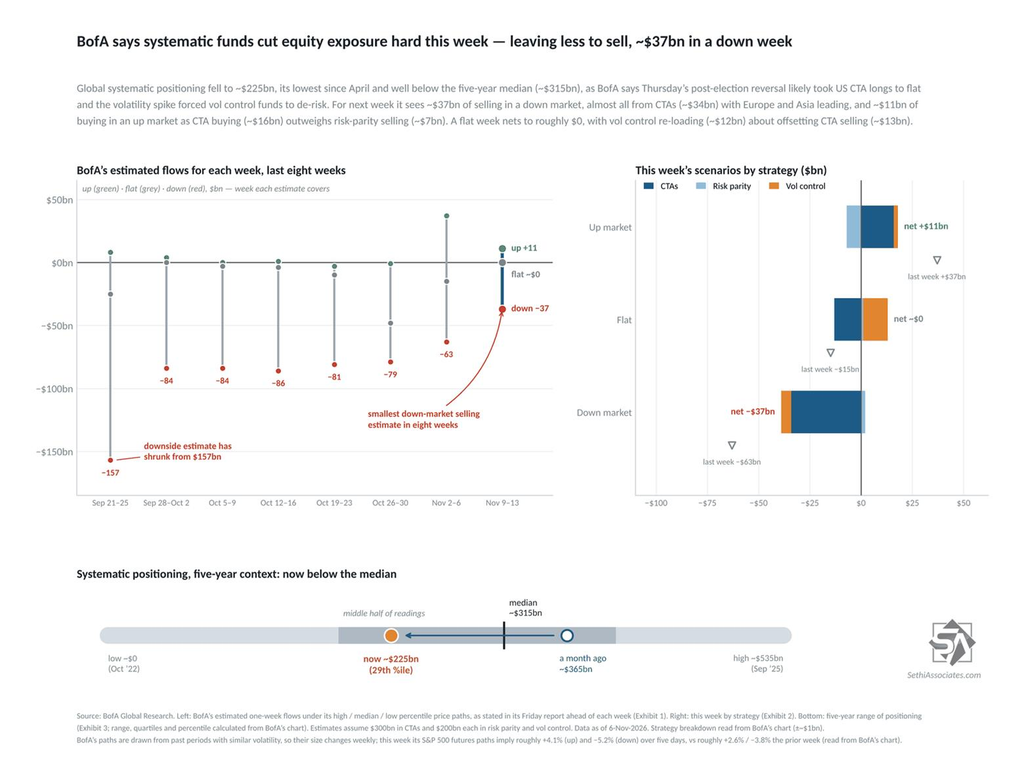
BofA estimates global systematic positioning fell to ~$225B, its lowest since April, from ~$290B last week and ~$365B a month ago, as the volatility spike also forced vol control funds to de-risk. In terms of CTAs, BofA no longer lists a sell trigger for the S&P 500 (from ~−0.1% last week), as Thursday’s post-election reversal likely took CTAs’ remaining US equity longs to flat. No triggers were listed for the Nasdaq-100 either, while the Russell 2000’s buy trigger is now +5.4% away (from +1.8%).
Positively, though, BofA is not looking for more selling from the systematic community in their base case with vol-control reloading offsetting more CTA selling:
• They see roughly no net change in a flat market (from −$15B of selling last week), as vol control adding ~$12B about offsets CTA selling of about $13B.
• +$11B of buying in an “up” market (BofA’s high-percentile path, roughly +4.1% for S&P 500 futures over five days this week; from +$37B last week), as CTA buying (~$16B) outweighs risk-parity selling (~$7B).
• −$37B of selling in a “down” market (BofA’s low-percentile path, roughly −5.2% for S&P futures this week; from −$63B last week), almost all from CTAs (~$34B), with Europe and Asia leading. That’s the smallest down-market estimate in eight weeks, though, showing the impact of the cleaner positioning.
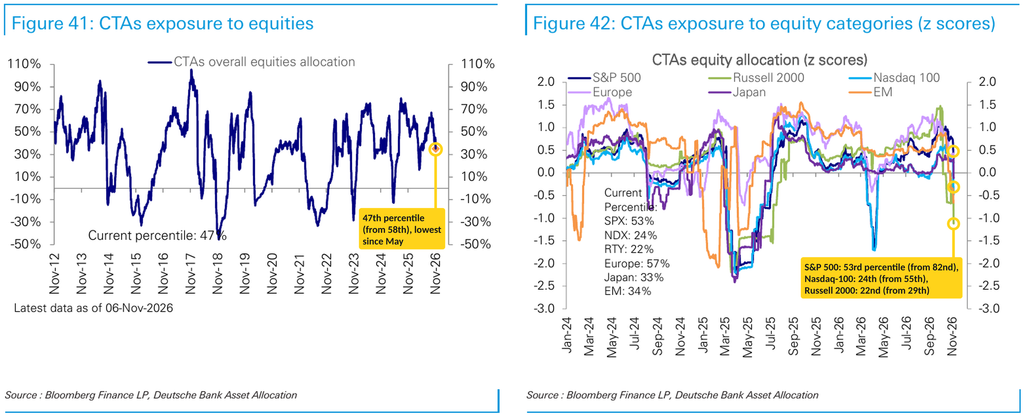
At DB, global CTA equity positioning fell to the 47th percentile (from the 58th), with the S&P 500 at the 53rd (from the 82nd), the Nasdaq-100 at the 24th (from the 55th) and the Russell 2000 at the 22nd (from the 29th).
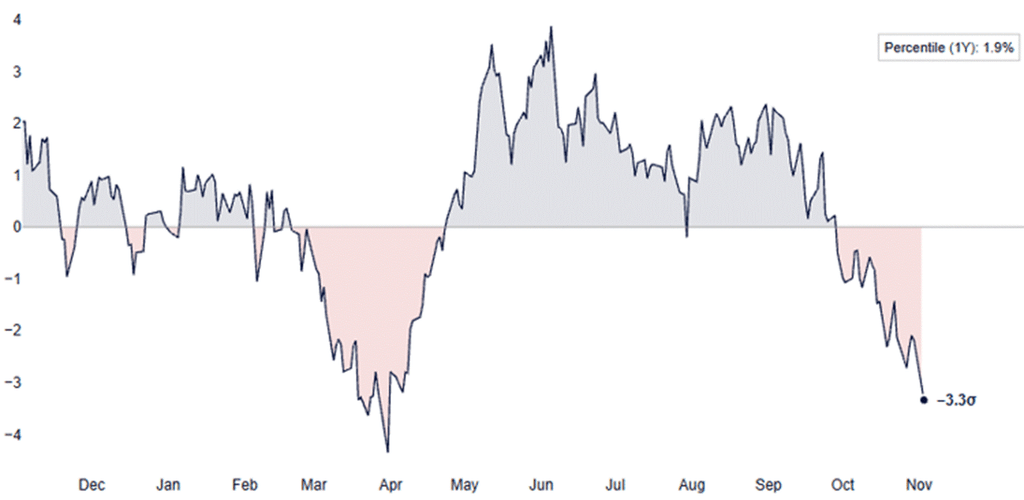
Even before the end-of-week selloff, Citadel’s CTA model saw much more selling than DB, estimating aggregate US equity positioning at −3.3 standard deviations as of November 3rd, below the 2nd percentile of its one-year range, the 10th percentile since 2018 and the lowest since March 31st. It’s down from +1.7σ three months ago and −1.0σ a month ago, with CTAs short for 26 consecutive sessions, which Rubner says leaves “considerable room for systematic buying as markets recover.”
DB estimates vol control* plunged to the 25th percentile (from the 77th), but risk parity** equity allocations little changed at the 83rd (from the 84th).
*Vol control strategies enter and exit based on changes in volatility over past windows (mostly 1-month and 3-month).
**Risk parity funds balance risk across asset classes based on relative volatility, often using leverage, to reach a target portfolio risk level.
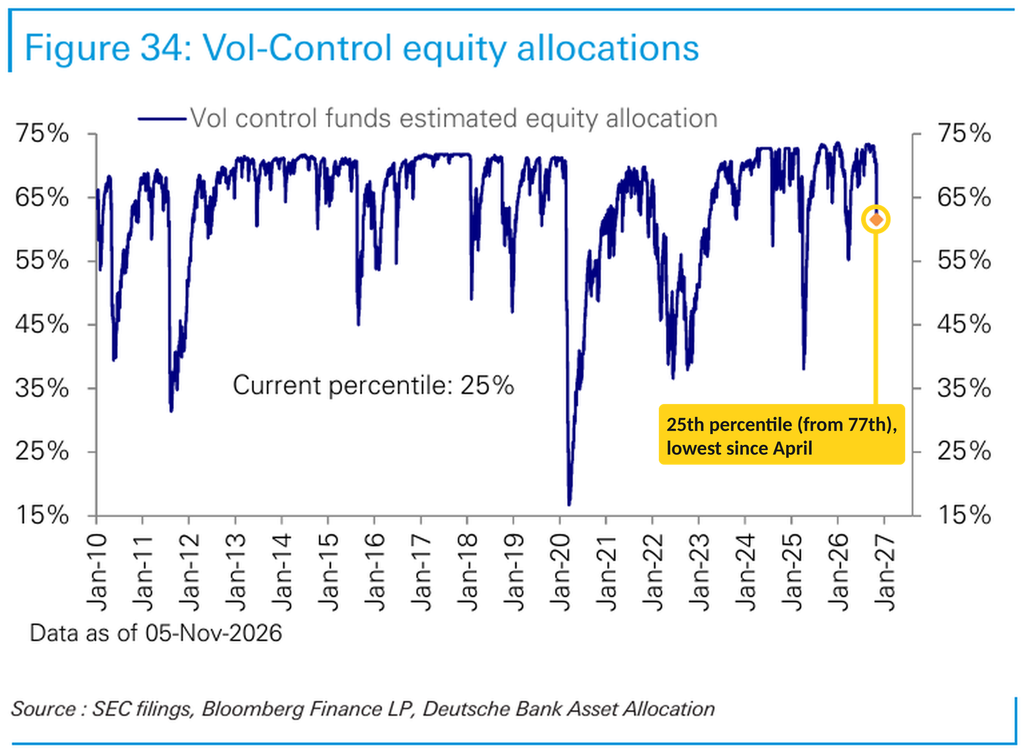
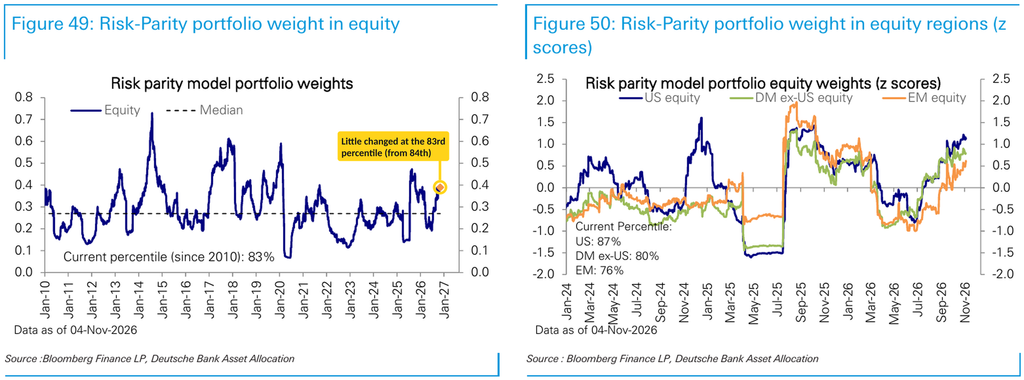
While a dialing back of volatility will see some mechanical releveraging from vol control as BofA notes, with the S&P 500’s 4.4% drop Thursday 1-month realized volatility jumped to 19.8% from 11.8% a week earlier, its highest since April 10th, while 3-month jumped to 13.7% from 10.5%, its highest since August 13th. That will stay in the lookback windows until we get one and three months out.
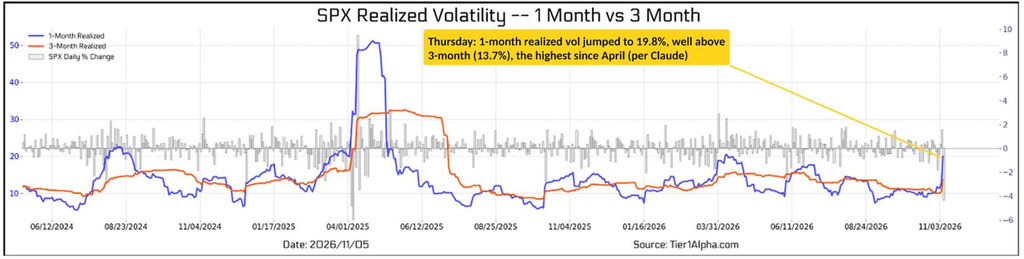
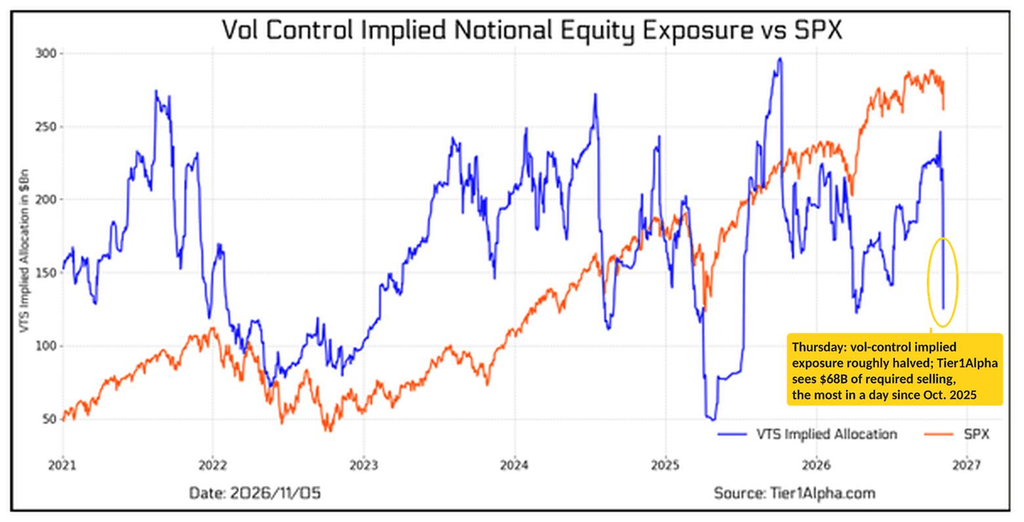
The jump in 1-month volatility makes it the main driver of flows according to Tier1Alpha. We have a mixed set-up for releveraging for the upcoming week. There are two 1.1% days dropping out (Wednesday and Friday), but that’s offset by just 0.1%, 0.0%, and 0.3% the other three days.
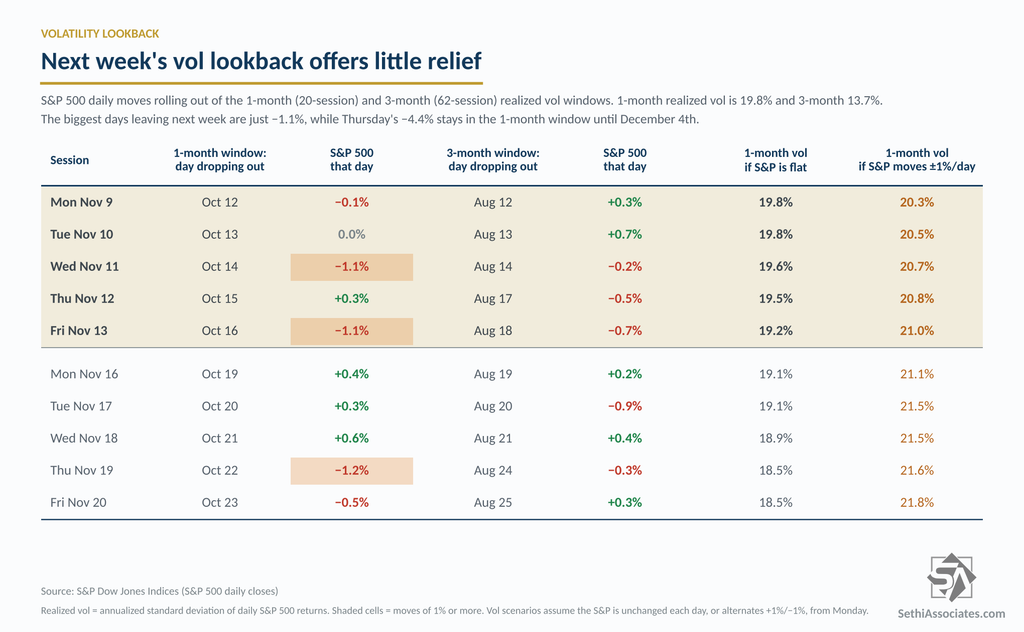
Even if the S&P were flat for the next two weeks, 1-month realized vol would only ease to about 18.4%, and Thursday’s drop doesn’t roll out of the 1-month window until early December. Barclays’ own scenarios (the colored lines) show exposure staying near half if realized vol runs around 20%.
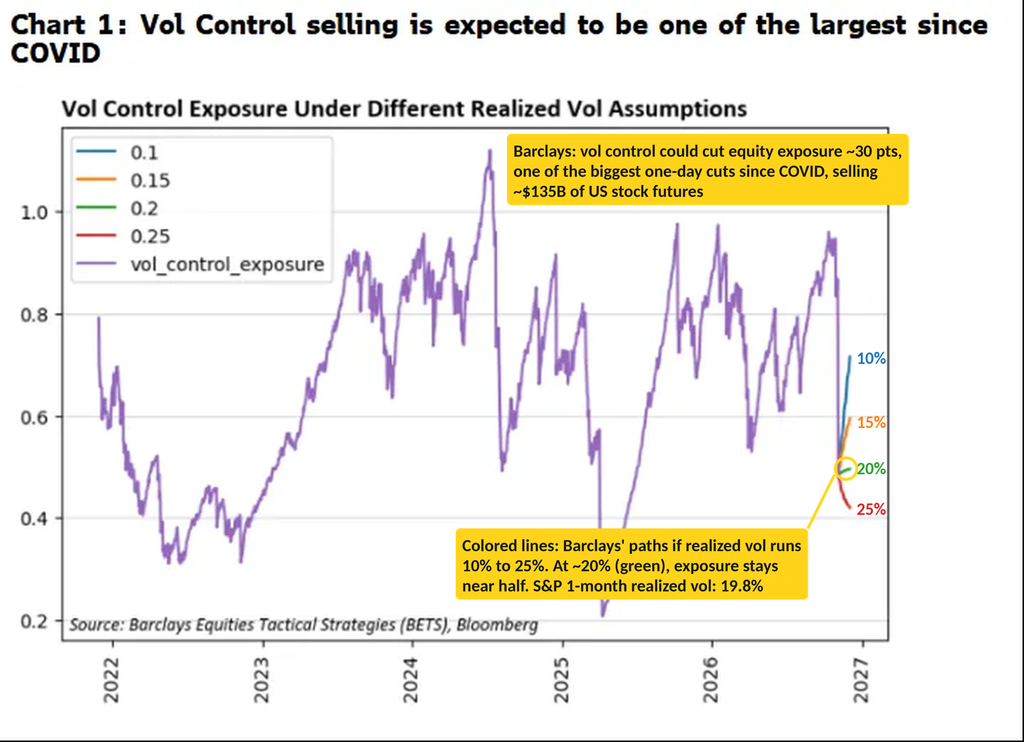
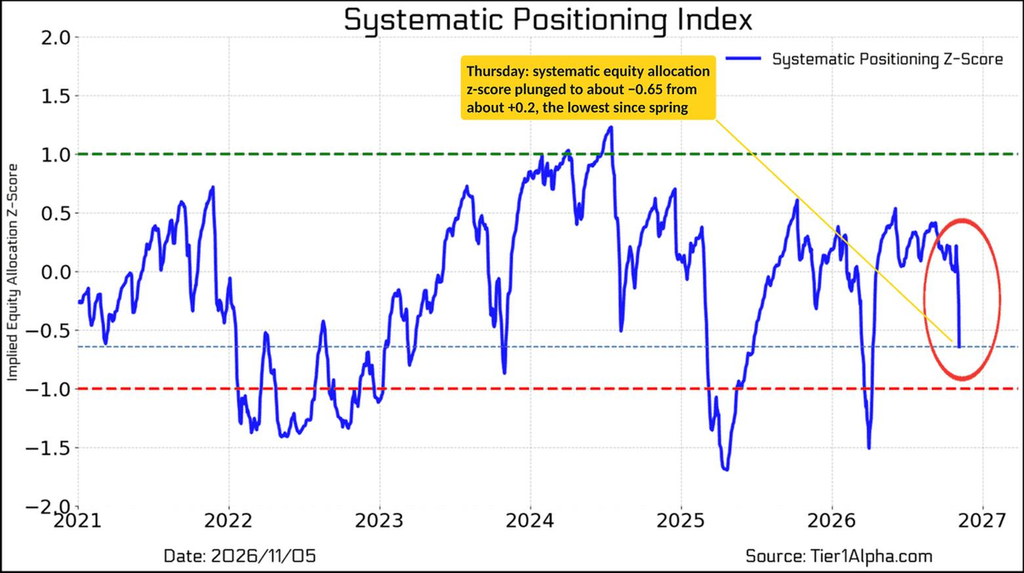
Tier1Alpha: “Until now, systematic weakness had been largely concentrated in CTA positioning, while vol-control funds remained relatively stable. With realized volatility rising alongside deteriorating momentum, both strategies are now reducing exposure together, creating a more persistent source of directional selling pressure, completely irrespective of any sort of fundamentals or narratives as to why markets are crashing in the first place.”
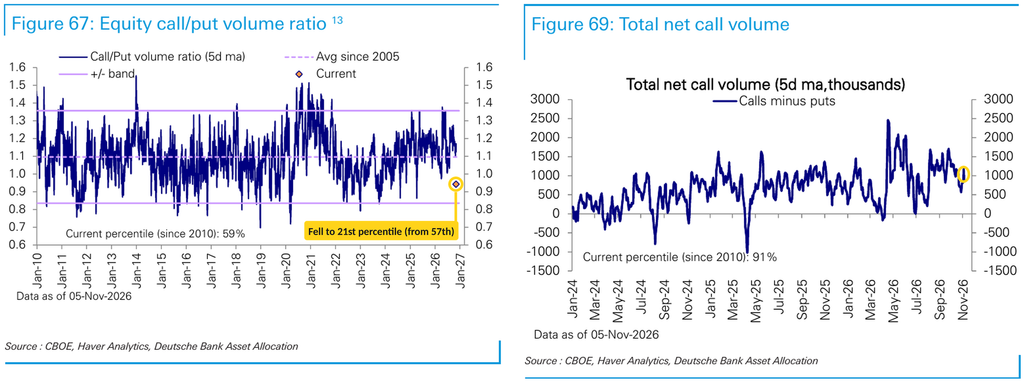
Similarly, DB’s call/put 5-DMA “declined sharply amidst the market rout” to the 21st percentile (from the 57th), with net call volume declining broadly across single-stock, index and ETF options.
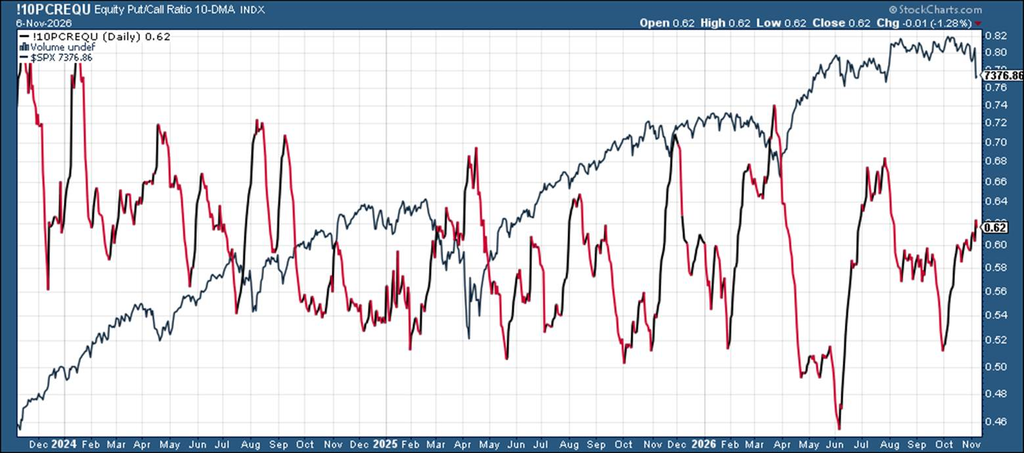
The CBOE equity put/call ratio’s 10-DMA rose to 0.62 (from 0.60), the highest since mid-August but still below July’s ~0.68 peak, so even with Thursday’s record put volume, traders aren’t hedging aggressively by this measure. To the extent this is moving higher it acts as a headwind as dealers have to sell to hedge the puts they are selling.
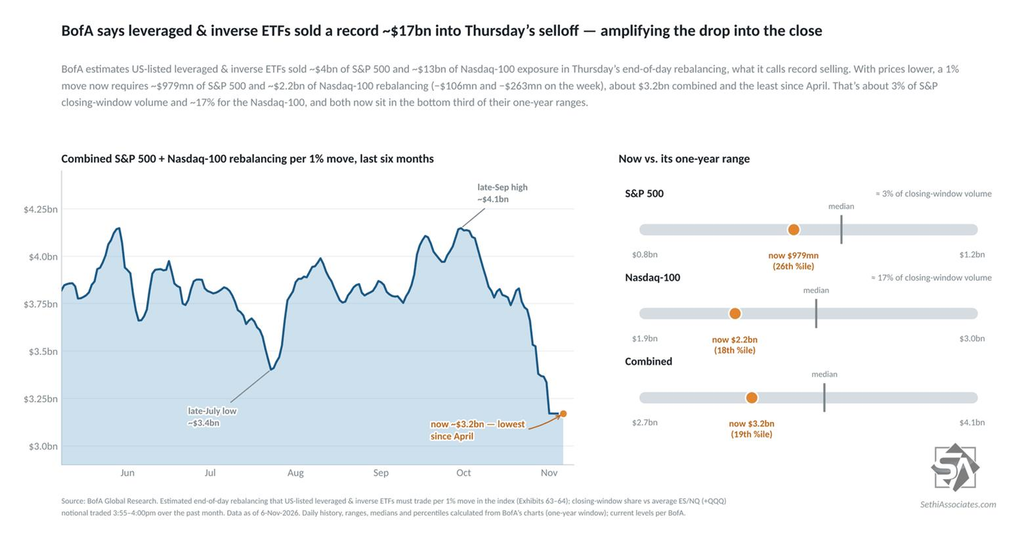
Turning to leveraged ETFs, which act as “negative gamma” per Charlie McElligott (funds have to buy or sell in the direction of market moves each day), BofA estimates US-listed leveraged and inverse ETFs sold ~$4B of S&P 500 and ~$13B of Nasdaq-100 exposure in Thursday’s end-of-day rebalancing, which it calls record selling. With prices lower, a 1% move now requires ~$979M of S&P 500 and ~$2.2B of Nasdaq-100 rebalancing (−$106M and −$263M on the week). That’s about $3.2B combined, the least since April, and equal to about 3% of S&P closing-window volume and ~17% for the Nasdaq-100.
So a benefit is the volatility induced from this cohort has been reduced by about a fifth from its late-September high (~$4.1B per 1% move), including about 10% this week alone.
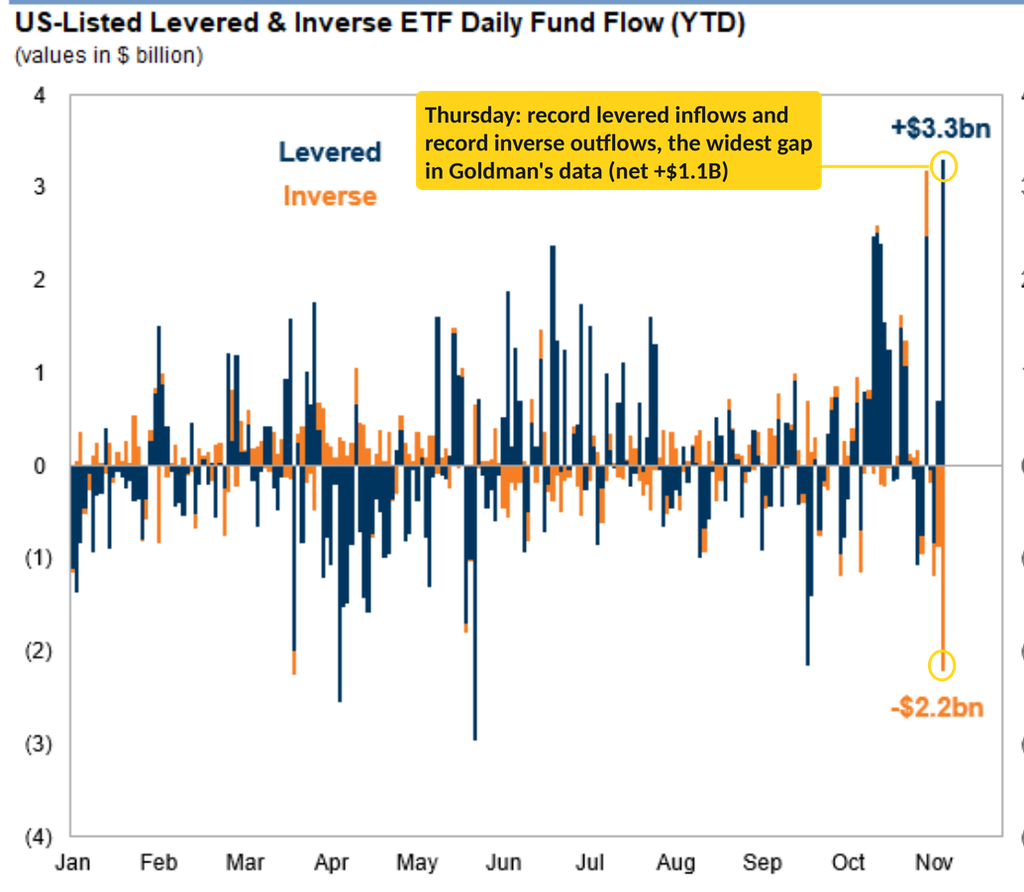
Goldman’s ETF desk adds that dip buyers used leverage Thursday. Levered ETFs took in a record $3.3bn while inverse ETFs saw a record $2.2bn of outflows (net +$1.1bn), the widest gap in its data.
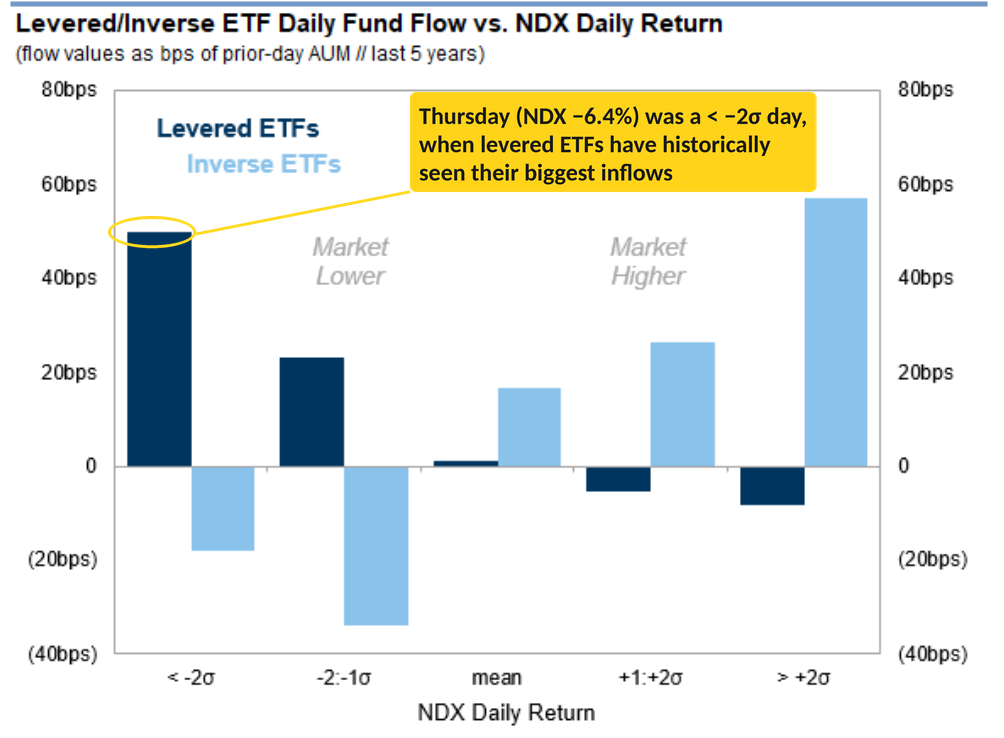
Which they say is typical, with levered ETF flows historically strongest on the market’s worst days (−2σ) and weakest on its best.
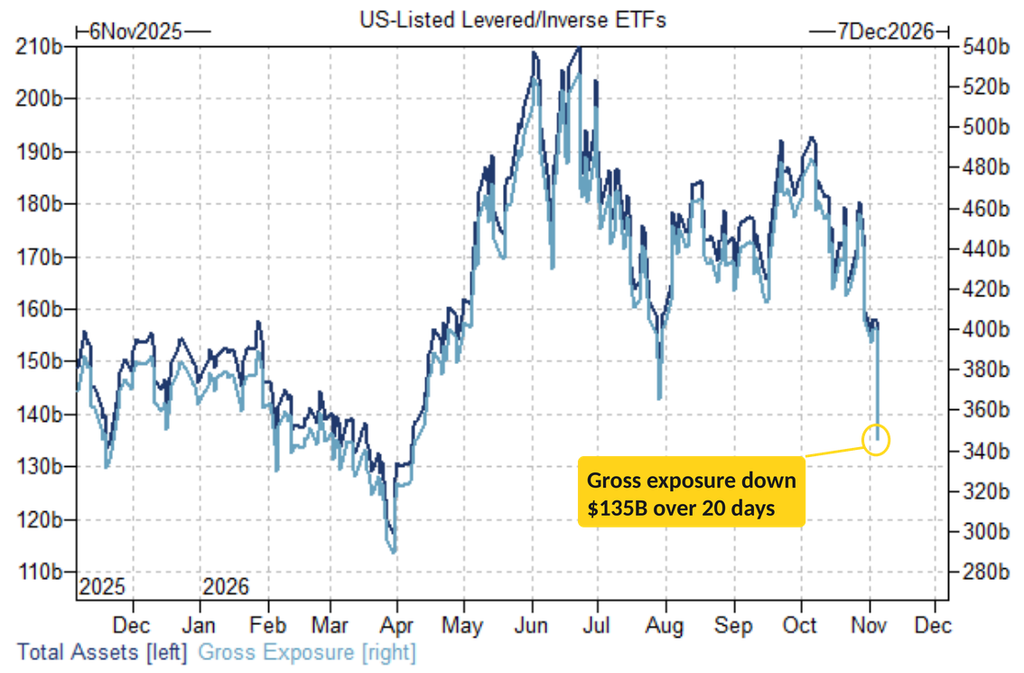
But per my note about the drop in AUM, they also note the complex has shrunk, with levered/inverse ETF AUM just under $140bn, down $55bn over the past 20 days, and gross exposure down $135bn over the same stretch, which should mean less forced buying and selling on big index moves.
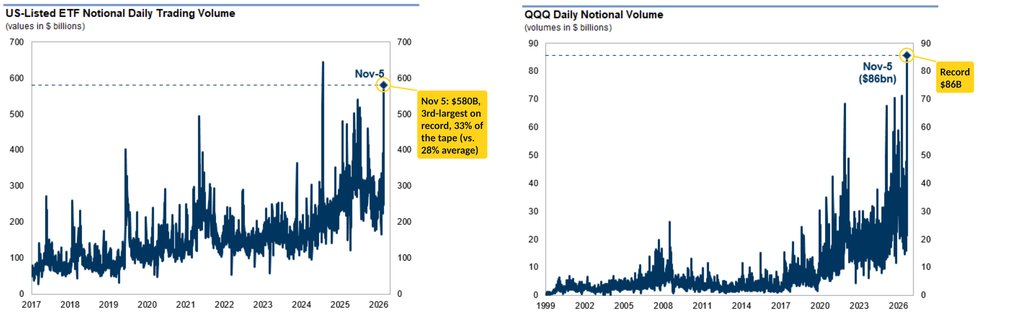
US-listed ETFs also saw their third-largest notional volume day on record Thursday ($580bn, 33% of the tape vs a 28% average), with QQQ setting a record ($86bn).
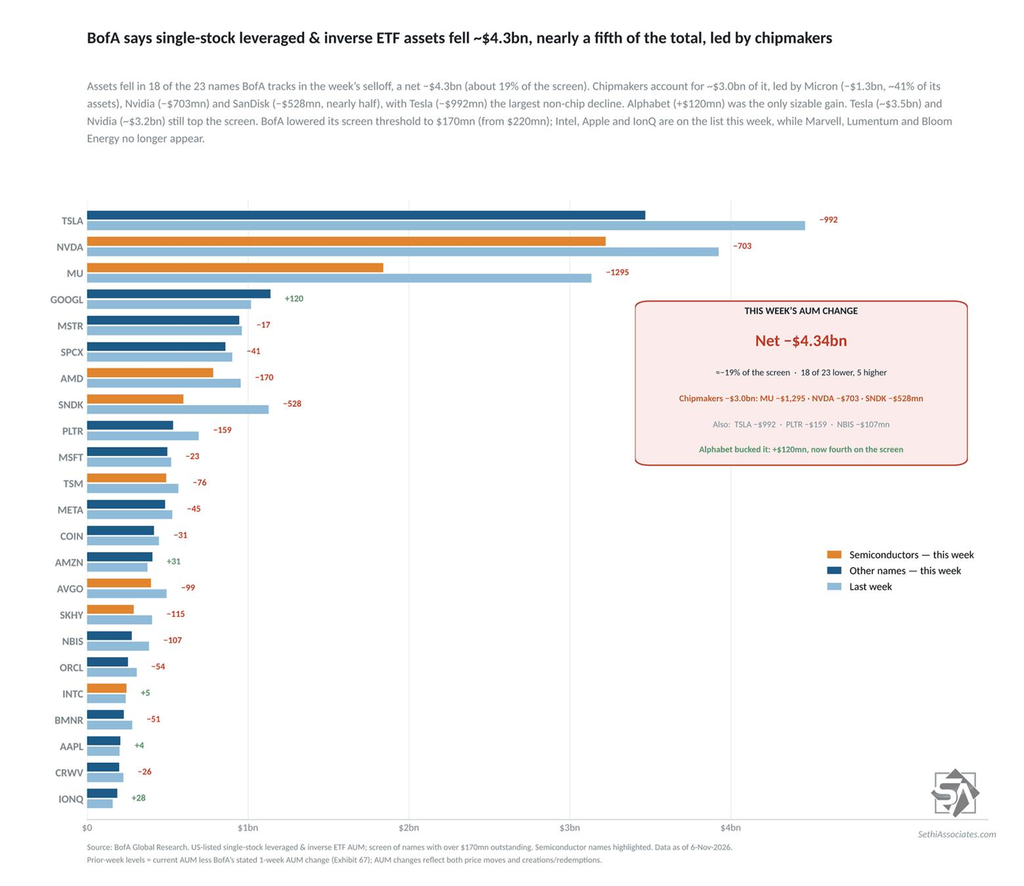
BofA says single-stock leveraged and inverse ETF assets fell a net ~$4.3B this week, shedding nearly a fifth of their total assets, with 18 of the 23 names it tracks lower. Chipmakers accounted for ~$3.0B of it, led by Micron (MU, −$1.3B, about 41% of its assets), Nvidia (NVDA, −$703M) and SanDisk (SNDK, −$528M, nearly half). Tesla (TSLA, −$992M) was the largest non-chip decline, while Alphabet (GOOGL, +$120M) was the only sizable gain. Tesla (~$3.5B) and Nvidia (~$3.2B) still top the list.
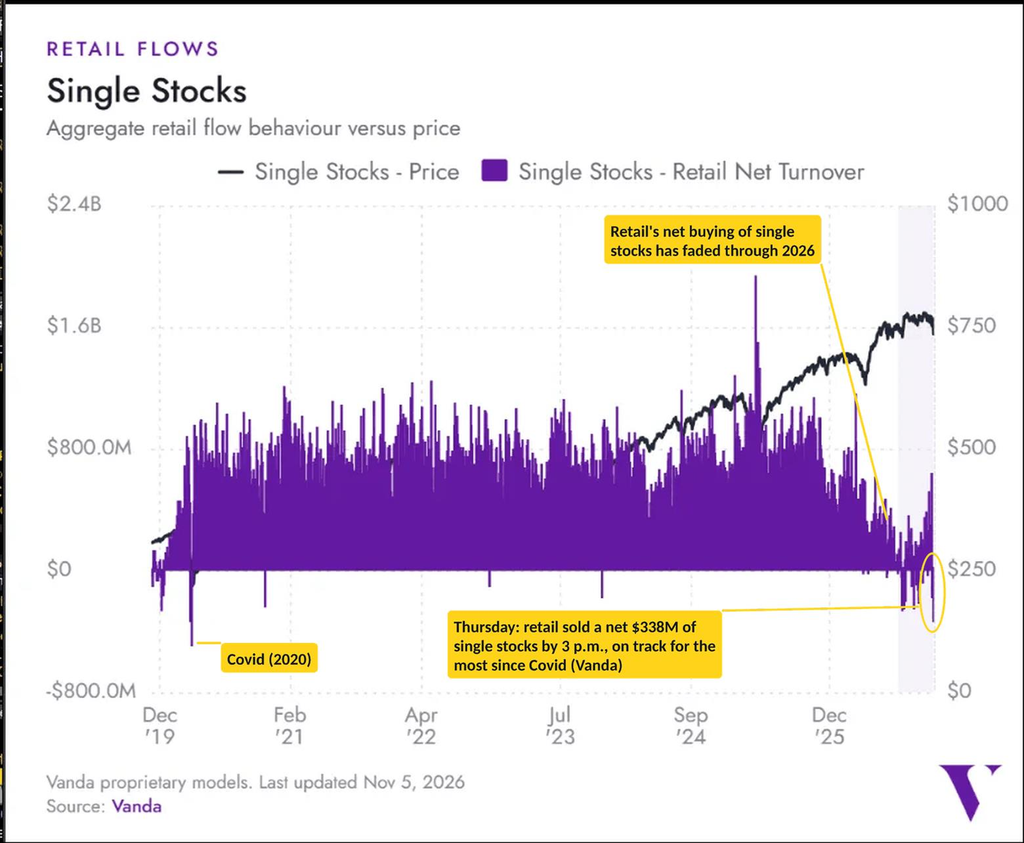
Turning to retail, the dip buyers who have been a reliable source of demand during previous pullbacks were reluctant to dive in according to Vanda Research who said retail traders were on track Thursday for their largest day of selling in individual stocks since the Covid-19 pandemic, having sold a net $338 million of single stocks as of 3 p.m. in New York. And as the chart shows, retail’s net buying of single stocks has faded through 2026. Retail may have shifted rather than retreated though, as Goldman’s ETF desk saw a record $3.3bn go into levered ETFs (a largely retail product) the same day.
That’s a change from what Citadel’s Rubner was seeing coming into the week. Retail had been a net buyer of US cash equities on Citadel’s platform for 22 straight sessions through November 3rd, accumulating nearly $33B in the sixth-longest and fifth-largest buying streak since 2017, with buying averaging $1.5B a session (1.4x the trailing-year average) even as the S&P fell 2.0% over the stretch. Of the 12 prior streaks of at least 15 sessions, the S&P rose during 10, with a median gain of 2.2%. Year-to-date retail net buying has reached a record $251B, above 2021’s full-year $241B. Citadel notes that flow was concentrated in ETFs, though, which fits with the record inflows into levered ETFs Thursday.
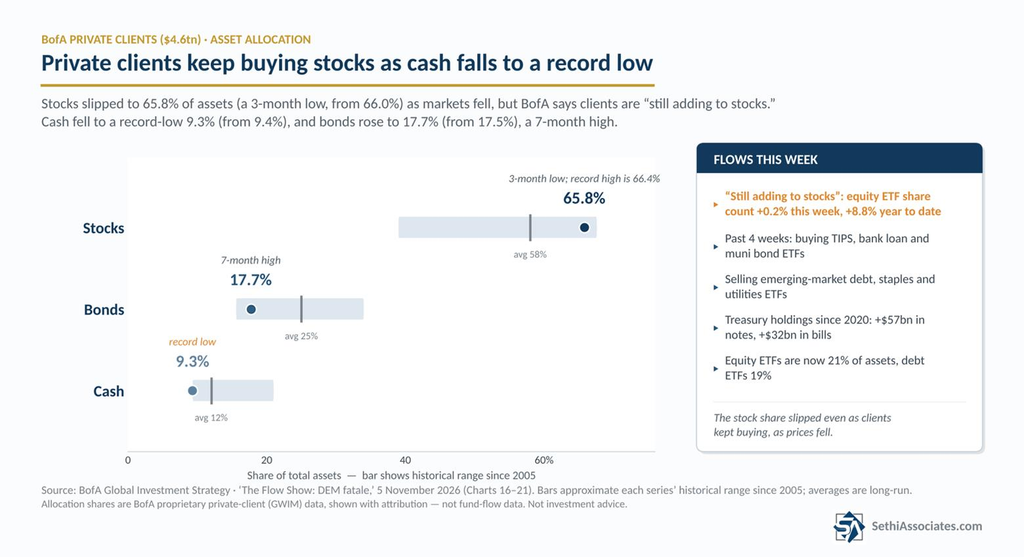
BofA also says its private clients ($4.6 trillion in assets) were “still adding to stocks” last week, even as their stock allocation slipped to 65.8% due to the decline in equity values, a 3-month low. Cash remained at 9.3%, a record low, while bonds rose to 17.7%, a 7-month high.
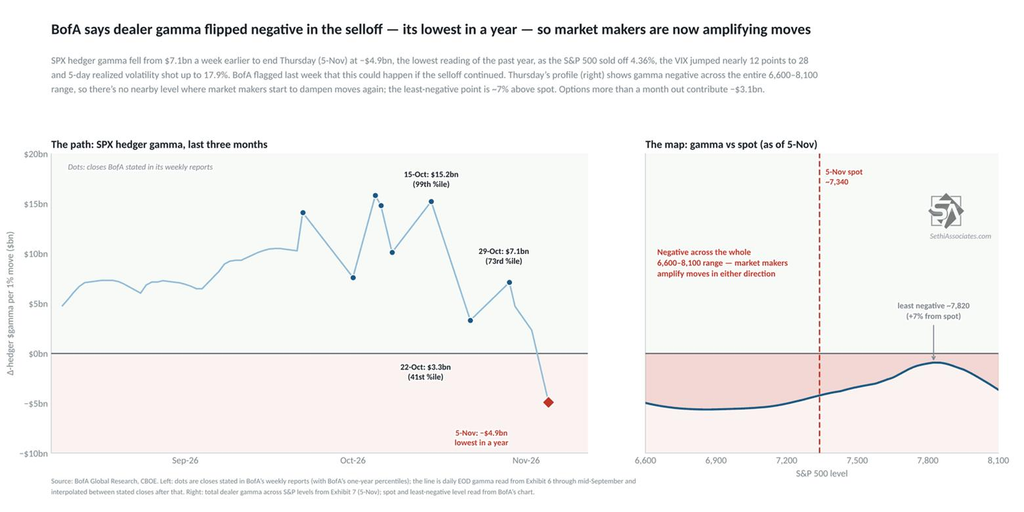
On gamma*, BofA says SPX hedger gamma fell precipitously this week and turned negative, ending Thursday at −$4.9B, its lowest reading of the past year and down from $7.1B a week earlier. The S&P 500 fell 4.36% that day, the VIX jumped nearly 12 points to 28, and 5-day realized volatility shot up to 17.9%. BofA had flagged this possibility last week.
Thursday’s profile shows gamma negative across the whole range BofA charts (6,600–8,100), so market makers amplify moves in either direction, and there’s no nearby level where that flips back.
*Gamma plays an important, if nebulous, role in market volatility. Positive gamma means options market makers buy and sell against price moves, which dampens volatility. Negative gamma means the reverse: market makers trade with the move, accelerating rallies and selloffs and adding to volatility.
Tier1Alpha (as of Thursday) agrees, saying dealers “have moved firmly back into negative gamma territory,” with its Gamma Volatility Throttle falling to −23.89 and 10-day realized volatility reaching 32.48. Under those conditions, they note, market makers “must hedge their delta exposure in the same direction as the underlying momentum, selling into weakness and buying into strength, amplifying intraday price swings.” Combined with leveraged ETF rebalancing “heavily skewed toward the downside,” Thursday “had all the hallmarks of a mechanically amplified selloff,” and Tier1Alpha hasn’t seen this combination of systematic selling since liberation day. Tier1Alpha does see a flip point to positive gamma, though it’s well above the market, at about 7,650 as of Thursday, some 3.7% above Friday’s close.
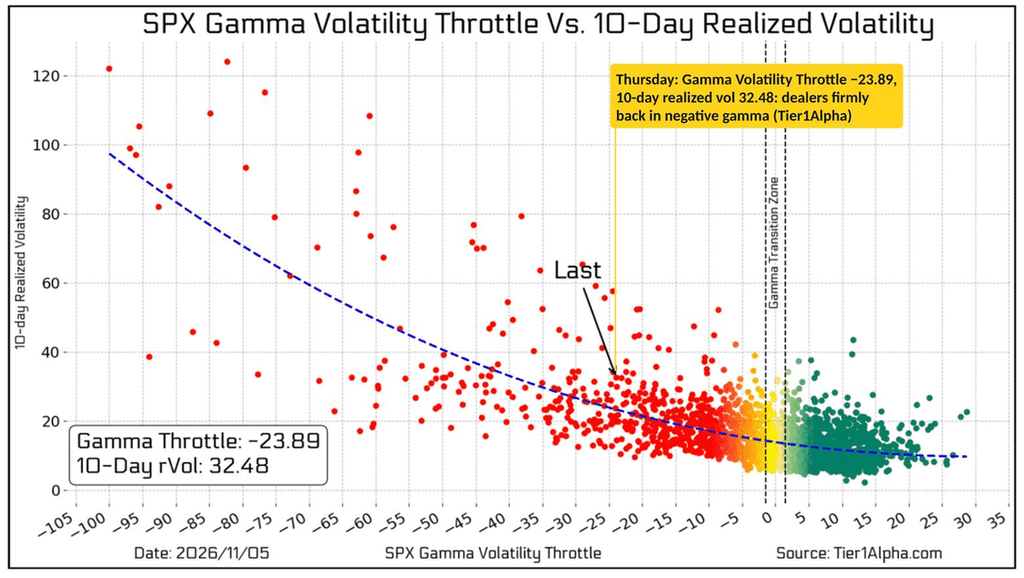
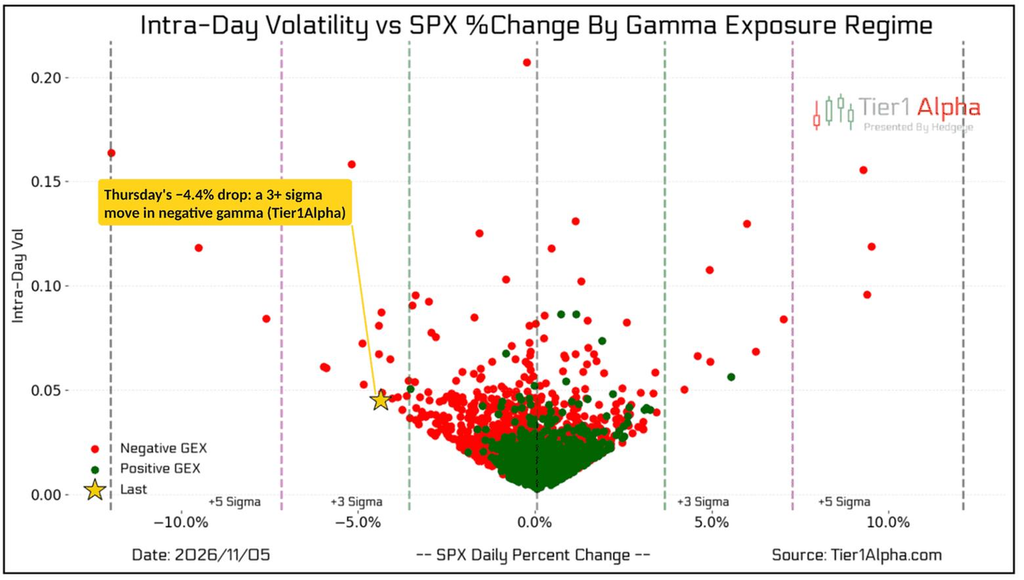
But they note it works both ways:
“It’s important to remember that dealer gamma and leveraged ETF rebalancing work in both directions. Just as yesterday’s weakness was amplified by mechanical selling, a reversal in momentum could quickly force many of these same participants to buy back exposure, creating conditions for an equally aggressive rally. But even under those circumstances, upside volatility is still volatility, meaning even a sharp rebound could leave any vol-sensitive strategies facing further selling requirements, again, leading to an overall unstable environment.”
So while Tier1Alpha “would not be surprised to see a sharp, gamma-driven rally over the next several sessions,” it says to distinguish “a temporary reversal in mechanical flows from a genuine improvement in underlying market structure.” Or as they put it, “don’t be fooled by the flows!”
Turning to corporate buybacks (an important source of underlying demand), the blackout period is now largely over. Citadel estimates this week there will be around 85% of S&P 500 index weight eligible to repurchase shares.
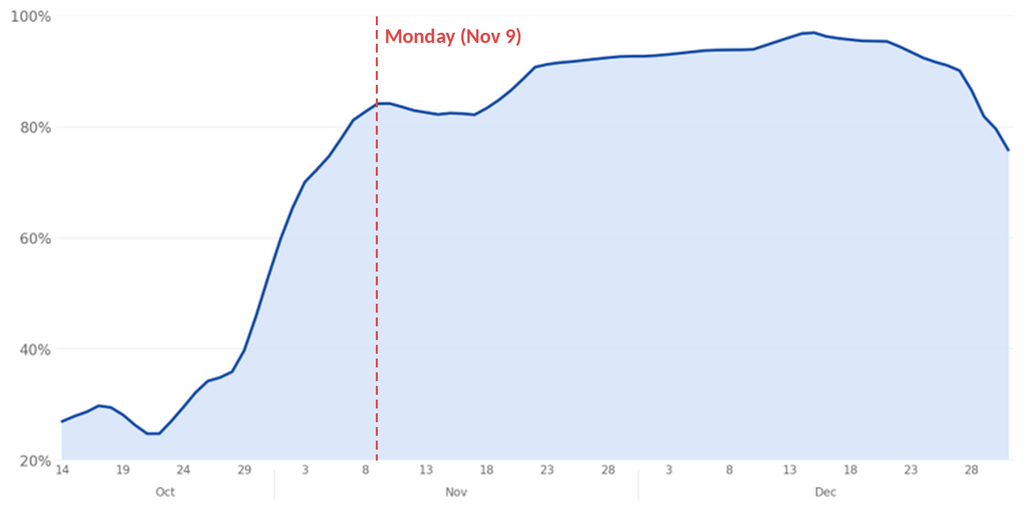
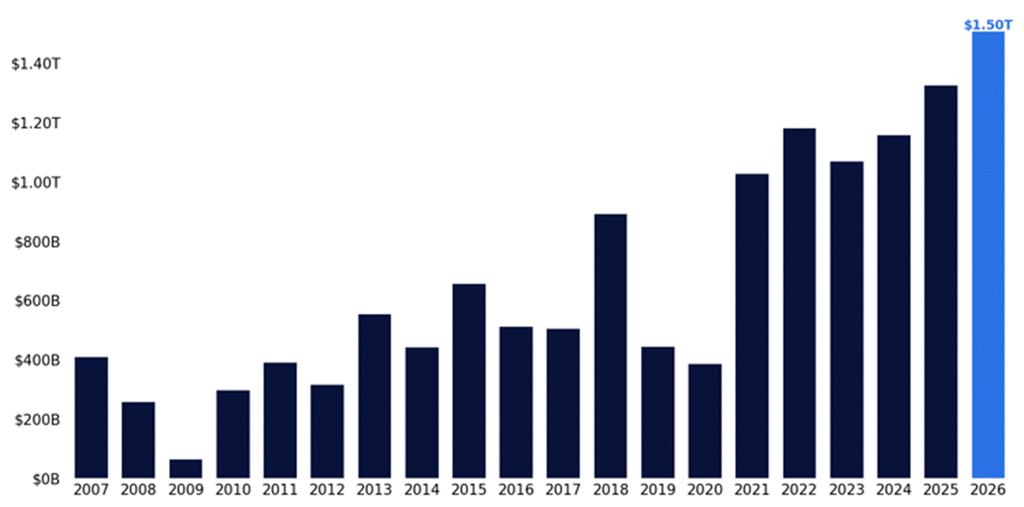
And the reopening comes against a record year for authorizations, with $1.5T of new repurchase programs announced through November 2nd, already above the previous full-year record set in 2025. October alone saw $166B, more than twice its historical average, with 30 programs of at least $1B announced since Citadel’s October update, and the pickup has extended beyond Tech.
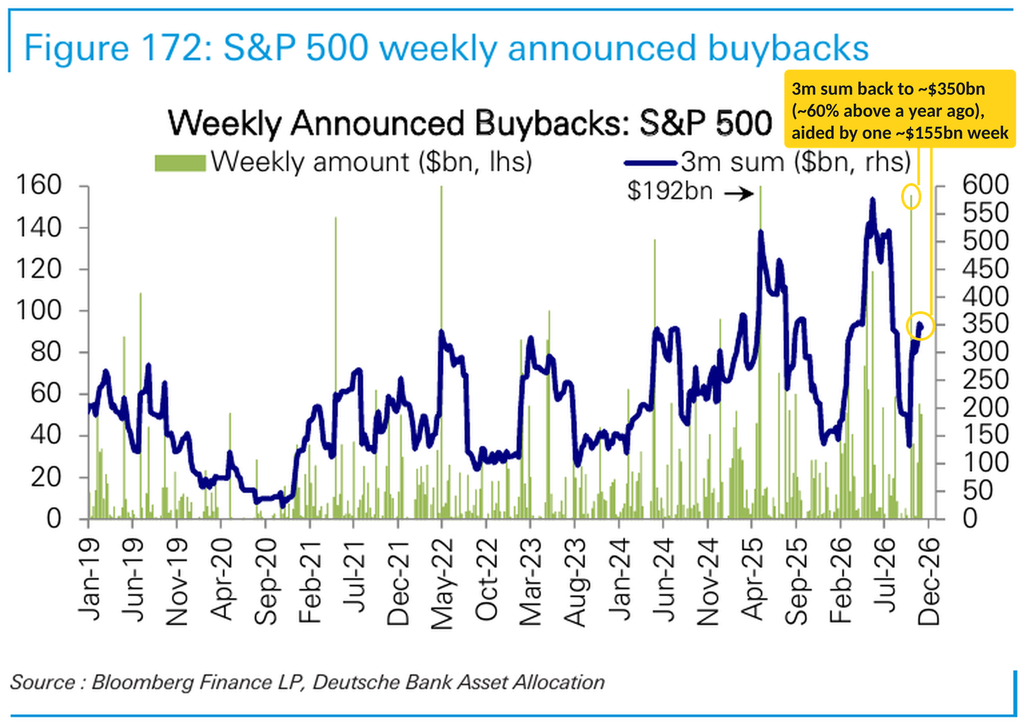
Similarly, DB’s tally of announced S&P 500 buybacks over the past three months has rebounded to about $350B, roughly 60% above the ~$220B of a year ago, after dipping to about $130B in mid-September. A single ~$155B week in late September accounts for much of the rebound.
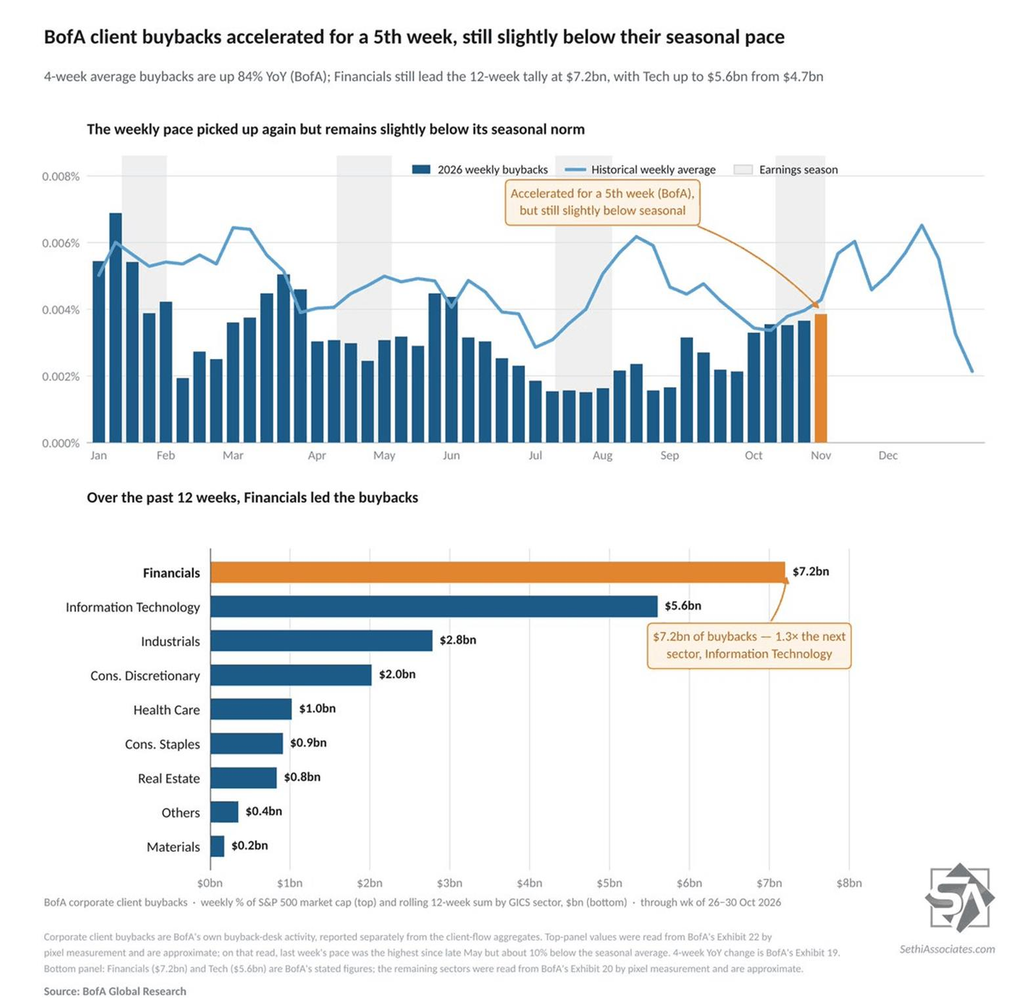
BofA meanwhile saw corporate client buybacks accelerate for a 5th week in the week ending October 30th, though they remain slightly below their seasonal average. It was the strongest week since late May but still about 10% below the seasonal average. On a 4-week average basis they were up 84% vs the year earlier, from +102% the prior week. Financials still lead the past 12 weeks at $7.2B, but the lead over Tech ($5.6B, up from $4.7B) has narrowed to about 1.3x from 1.5x.
Sentiment Slides Back Into Fear
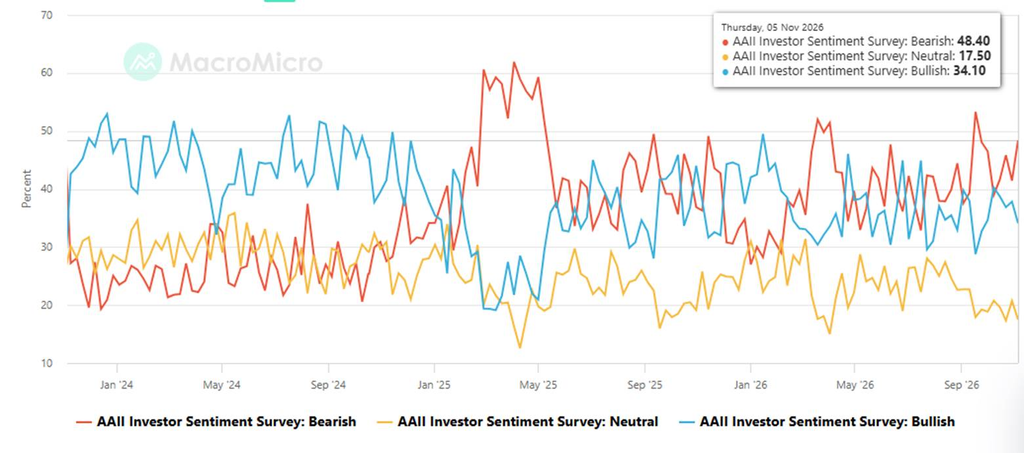
American Association of Individual Investors (AAII), a retail focused weekly investor survey, edged more bearish, although note the survey closed Wednesday night, so it caught only part of Wednesday’s rally and missed Thursday’s rout:
• AAII Bulls (those who see higher stock prices in 6 mths, blue line) fell to 34.1%, the least in six weeks, from 37.8% the prior week (still though above the 28.8% seven weeks ago, which was the least since September 2025), falling back below the long-term historic average of 37.5% after a week above.
• Bulls also remained below the level of the Bears (who see lower stock prices in 6 mths, red line), as the Bears rose to 48.4%, the most in seven weeks, from 41.4% the prior week (still though below the 53.3% seven weeks ago, the highest since May 2025). That leaves Bulls above Bears just twice in the last 16 weeks. Bears also remain above the long-term average of 31.0% for a 38th straight week (and they’ve only been below it 9 weeks since Dec 12, 2024).
• The Neutral camp (yellow line) dropped to 17.5%, the least in two weeks, from 20.7% (just above the 17.3% two weeks ago, which was the least since early April). It remains under the long-run average of 31.5% and has been over that only twice since July 2024.
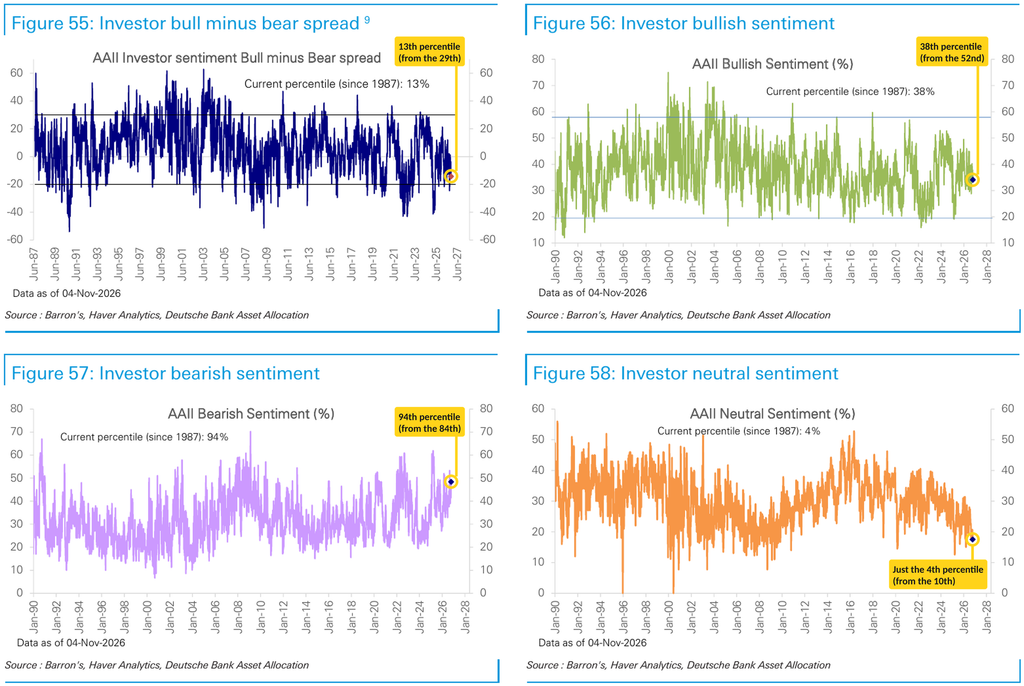
DB notes the bull-bear spread fell to the 13th percentile (since 1987) from the 29th, with bearish sentiment at the 94th percentile (from the 84th), bullish at the 38th (from the 52nd) and neutral at just the 4th (from the 10th).
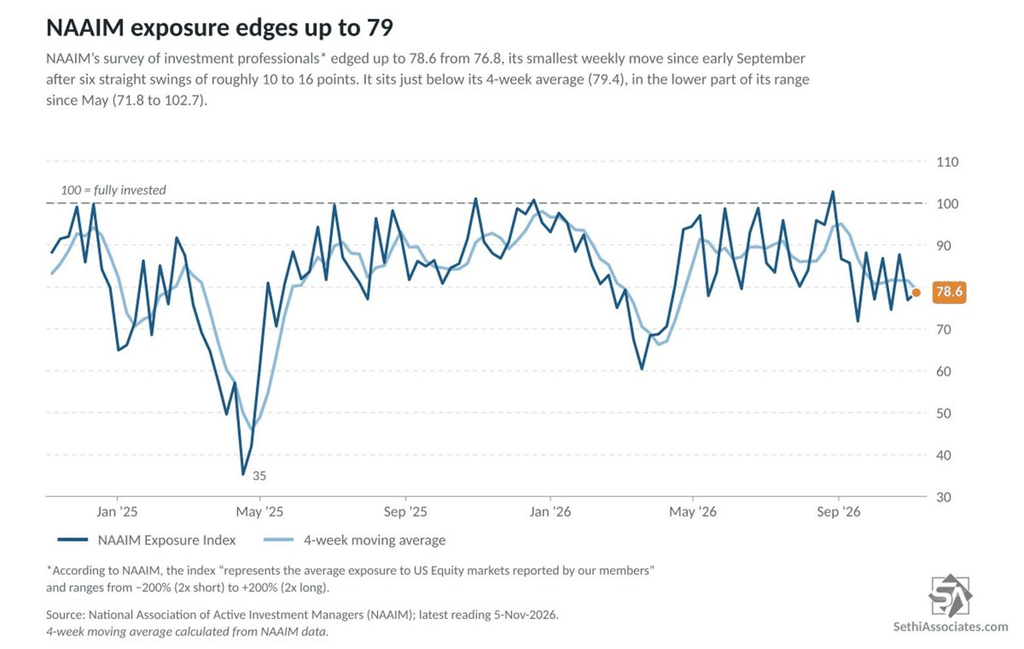
NAAIM’s survey of investment professionals* also missed the selloff, edging up to 78.6 from 76.8, its smallest weekly move since early September after six straight swings of around 10 to 16 points. It sits just below its 4-week average (79.4), in the lower part of its range since May (71.8 to 102.7).
*The index according to NAAIM “represents the average exposure to US Equity markets reported by our members” and ranges from −200% (2x short) to +200% (2x long).
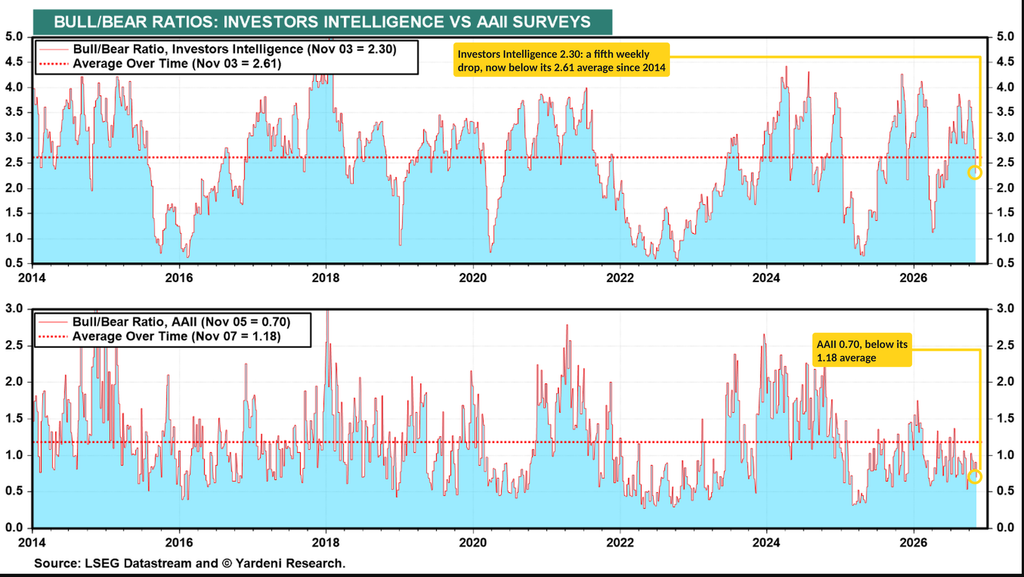
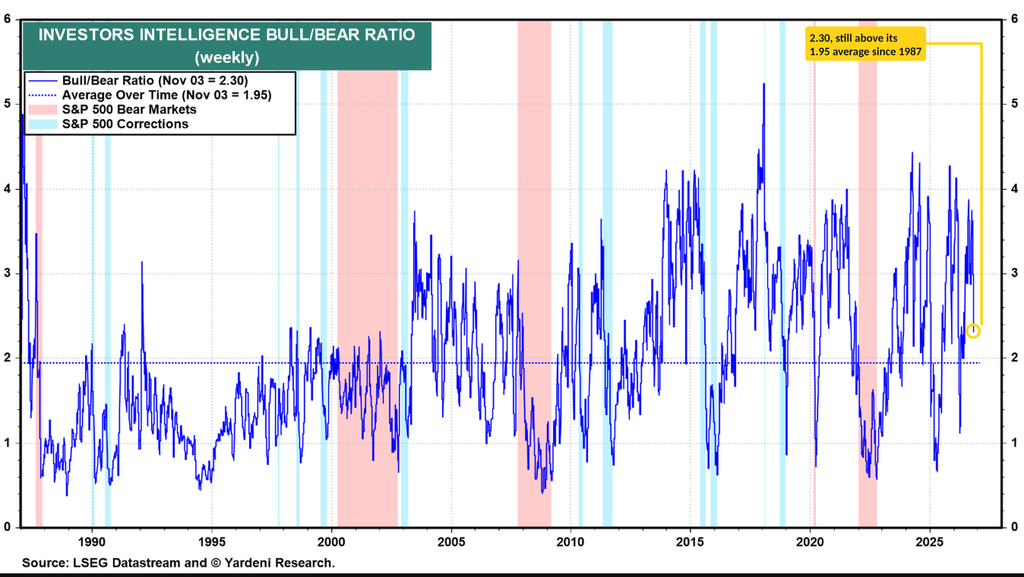
The Investors Intelligence (independent investment-newsletter writers) bull/bear ratio also was before Thursday’s selloff but still fell for a fifth week to 2.30 from 2.77, now below its 2.61 average since 2014 though still above its 1.95 average since 1987. Combined with AAII’s 0.70 bull/bear ratio (below its 1.18 average), the two surveys Yardeni tracks are both below average, and that was before Thursday’s drop.
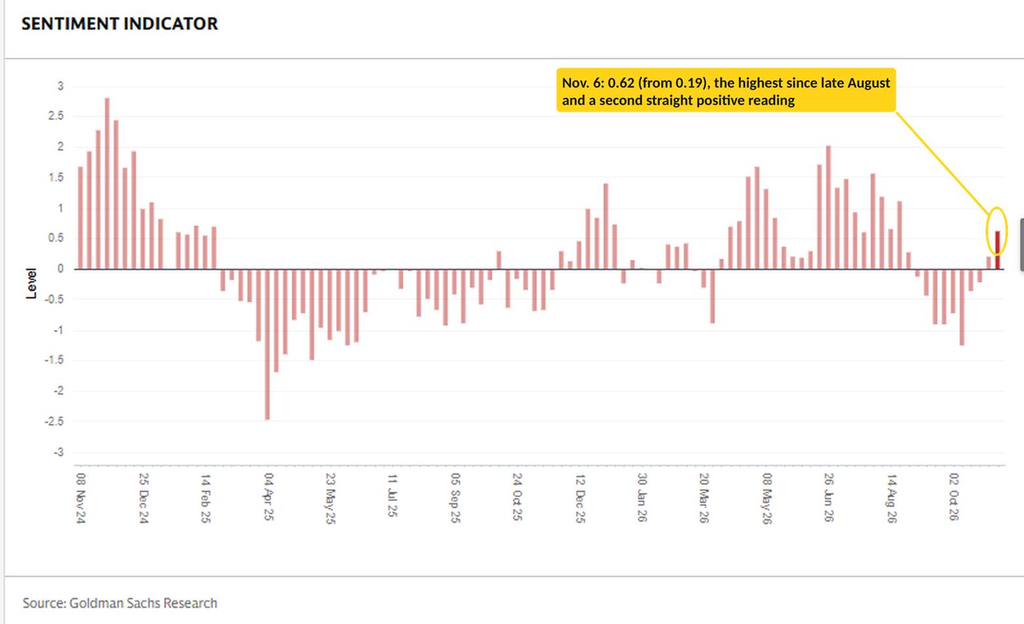
And surprisingly Goldman’s US Equity Sentiment Indicator* rose further to 0.62 (from 0.19 the prior week), its highest since late August and its second straight positive reading. The current reading is associated with a 1-month average return of around 1.1% since 2009, though with a positive rate of only about 49%.
*The indicator combines “six weekly and three monthly indicators that span [across the more than 80% of the US equity market that is owned by institutional, retail and foreign investors]. Readings of +1.0 or higher have historically signaled stretched equity positioning. Readings of -1.0 or lower have signaled very light positioning and have historically been a statistically significant signal for subsequent S&P 500 performance”.
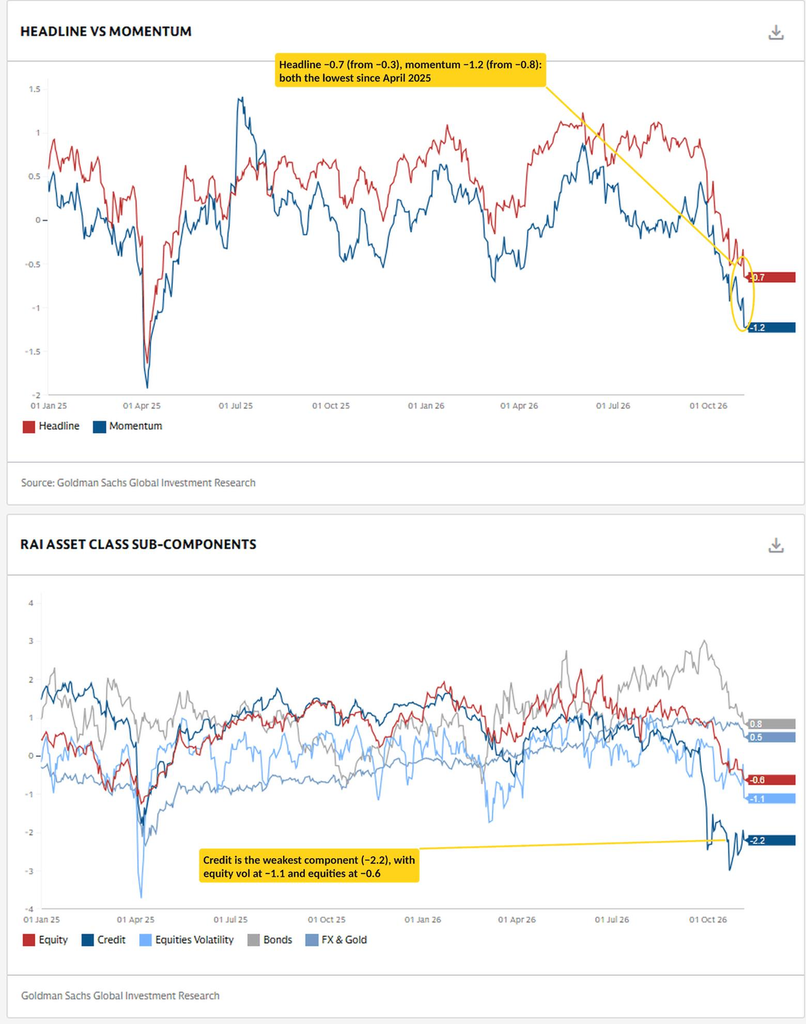
But Goldman’s Risk Appetite Indicator* fell to −0.7 from −0.3 the prior week, and the momentum index fell to −1.2 from −0.8, both their lowest since April 2025. By component, credit remains the weakest (−2.2), followed by equity volatility (−1.1) and equities (−0.6), while bonds (0.8) and FX & gold (0.5) are still positive.
*”Goldman Sachs Risk Appetite Indicator (RAI) aims to track the level of global market risk appetite and risk aversion based on various market variables. A sharp rise in the index can send a warning signal that investors have more risk appetite and are potentially exposed to a correction if consensus views are tested. Similarly, a sharp decline indicates a reduction in risk appetite, and at extreme levels it can indicate that markets may have overshot. RAI signals are most powerful when the level of risk appetite is very low below -1.5, with levels closer to -2.0 giving the clearest signal over longer time horizons, as at such levels the asymmetry of subsequent medium term equity return becomes very positively skewed. RAI momentum is designed to track short term shifts of market risk appetite, and subcomponents of the RAI.”
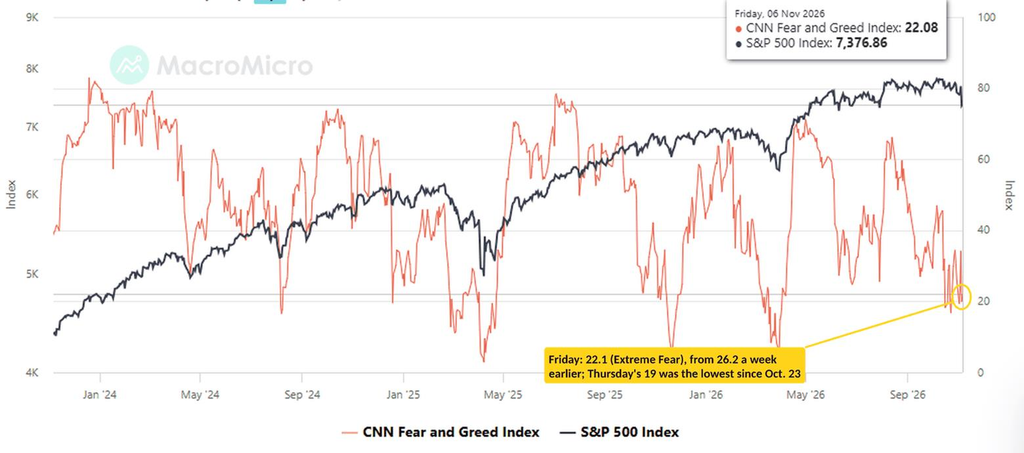
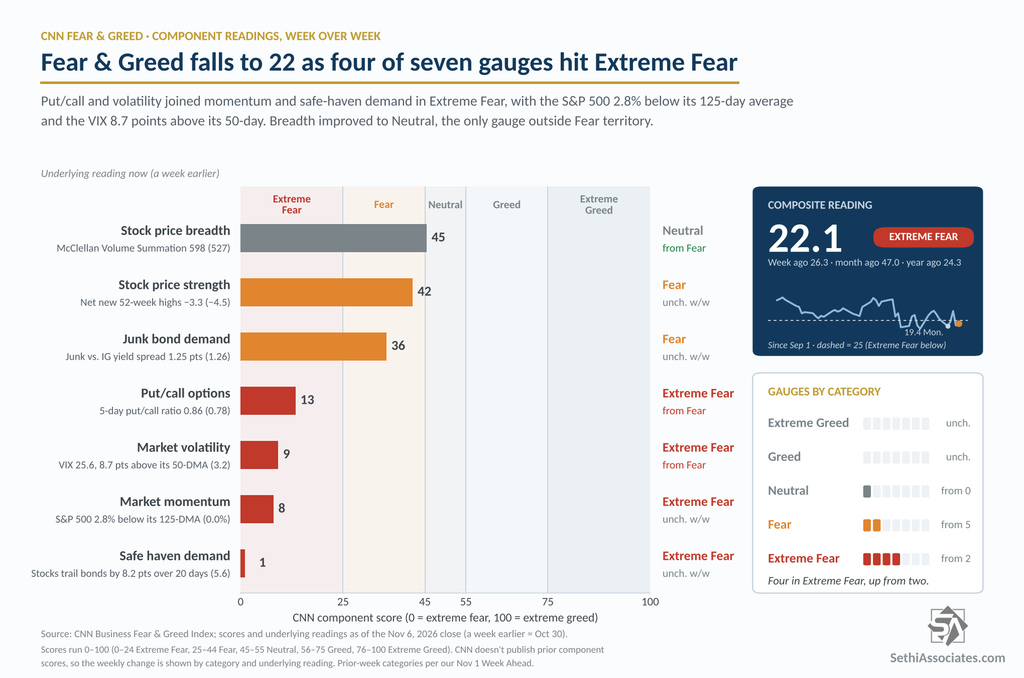
The CNN Fear & Greed Index ended the week at 22.1 (Extreme Fear), down from 26.2 (Fear) a week earlier. It fell to 19.4 on Monday, the lowest since October 23rd, and nearly matched that Thursday (20.0) before Friday’s bounce.
Four of the seven indicators are now in Extreme Fear, up from two, with two in Fear and one Neutral.
- Extreme Greed = None
- Greed = None
- Neutral = stock price breadth (McClellan Volume Summation Index) (from Fear)
- Fear = stock price strength (net new 52-week highs); junk bond demand (vs investment grade)
- Extreme Fear = market momentum (SPX vs 125-DMA); put/call options (5-day put/call ratio) (from Fear); market volatility (VIX & its 50-DMA) (from Fear); safe haven demand (20-day difference in stock/bond returns)
And I noted in previous weeks if you have any questions on the indicator, TheStreet Pro’s own Jason Meshnick is your guy, as he helped create it.
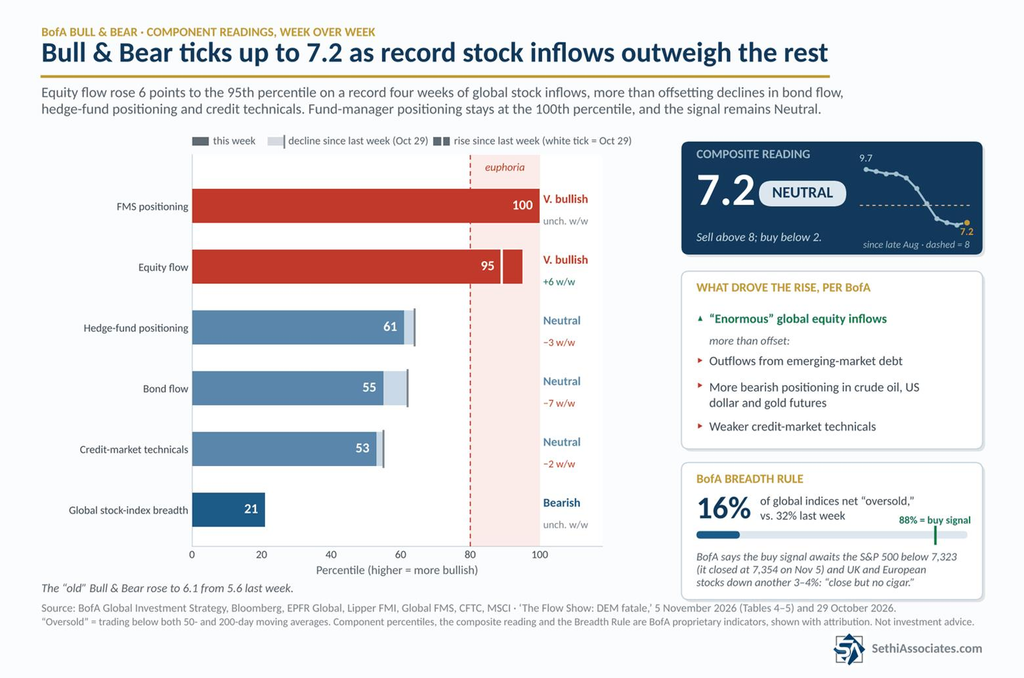
BofA says its Bull & Bear Indicator rose to 7.2 from 7.1, as “enormous global equity inflows” more than offset outflows from emerging-market debt, more bearish positioning in crude oil, dollar and gold futures, and weaker credit market technicals.
• Equity flow: up 6 points to the 95th percentile, after a record $65.6 billion of global equity inflows over the past four weeks.
• Bond flow: down 7 to 55.
• Hedge-fund positioning: down 3 to 61.
• Credit technicals: down 2 to 53.
• Fund-manager positioning: unchanged at 100.
• Global breadth: unchanged at 21.
The signal stays Neutral (sell trigger is above 8). Hartnett says a buy trigger “awaits SPX <7323,” with UK and European stocks down another 3–4%. The S&P 500 closed Thursday at 7,354, just 0.4% above that line (and Friday at 7,377, 0.7% above).
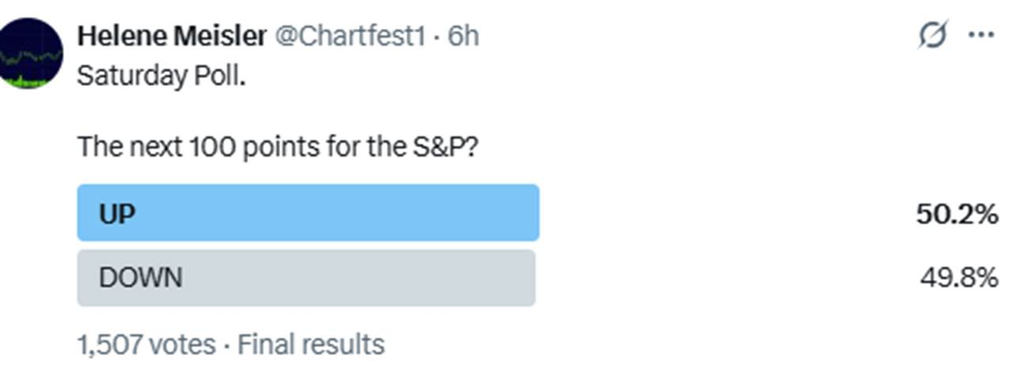
Helene Meisler’s Saturday poll on the direction for the next 100 points for the S&P 500 was basically split with 50.2% voting up versus 49.8% down (1,507 votes), down from 52.8% last week but still the fifth bullish result in six weeks.
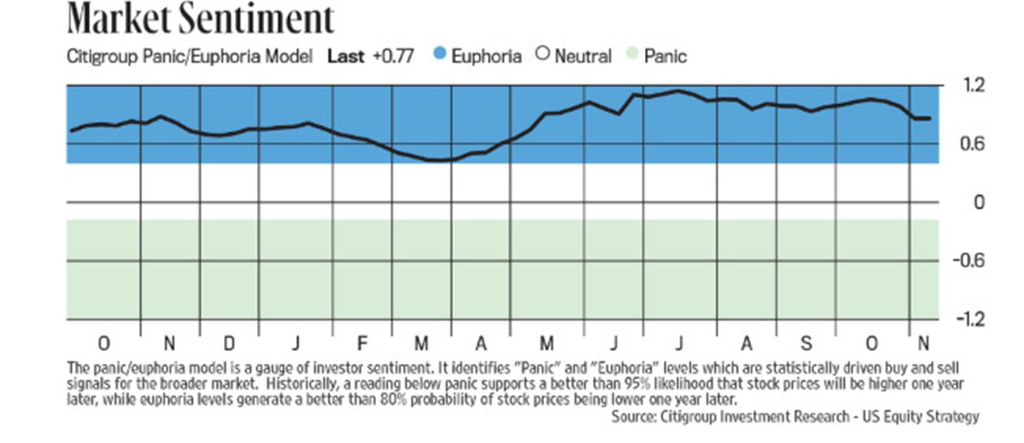
And Citi’s Panic/Euphoria Model, which Helene has each week in her Chart Fest, eased to +0.77 from +0.89 but remains in Euphoria, a level Citi says has historically come with “a better than 80% probability of stock prices being lower one year later,” although as I have indicated in the past the recent track record has been weak.
The Strong Start Never Came, So Now What?
Looking at the seasonality breakdown from Jeff Hirsch, editor of the Stock Trader’s Almanac & Almanac Investor Newsletter, next week is where November’s normally strong start has historically stalled.
Monday is trading day 6, the last of the six straight bullish days Hirsch counts to open the month. Over the past 21 years it has also marked the high of November’s first half, with the major indices up about 1.2–1.5% for the month on average. Tuesday has then been the weakest day of the week. The Nasdaq has fallen about 0.75%, the S&P 500, Russell 1000 and Russell 2000 about 0.5%, and the Dow about 0.3%. A Thursday bounce of 0.25–0.45% has mostly been given back on Friday. For the week, that leaves the Dow about flat, the S&P, Russell 1000 and Russell 2000 down about 0.15%, and the Nasdaq down about 0.5%.
Midterm years have held up better, though small caps and tech have had a rough Tuesday there too. On Tuesday in midterm years, the Russell 2000 has dropped about 0.65% and the Nasdaq and Russell 1000 about 0.25%, while the Dow and S&P edged higher. Those losses were recovered Wednesday (day 8). By then the Dow and S&P were up about 2.1% for the month, in line with Hirsch’s note that midterm Novembers are “climbing about 2% by the eighth trading day.” For the week, the midterm Nasdaq has gained about 0.6%, the Dow and S&P about 0.2–0.25%, and the two Russells about 0.1%.
Wednesday is also Veterans Day, so the stock market is open but the bond market is closed. The mid-month dip Hirsch describes deepens the following week, with the 21-year averages bottoming on trading days 13–14 (November 18th–19th), before the rally into month-end that has left the indices up about 2–2.7% for November across all years and 2.6–3.5% in midterm years (led by the Nasdaq).
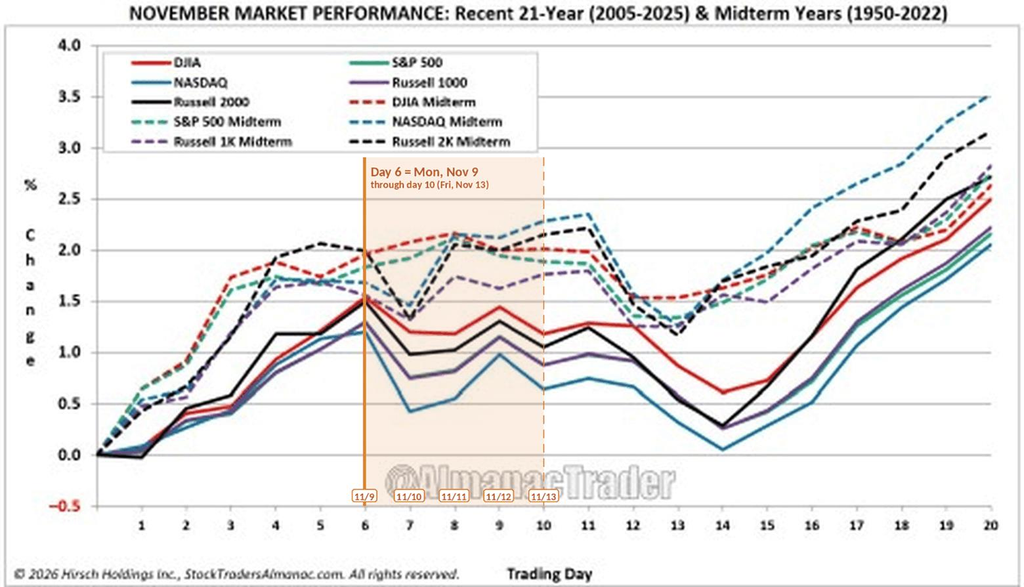
This year, though, the strong start never came. The S&P 500 is down 2.7% for November through day 5, and the Nasdaq-100 4.9%, reinforcing that seasonality is just a general guide to how markets have historically performed, certainly not a prediction of how they will actually perform.
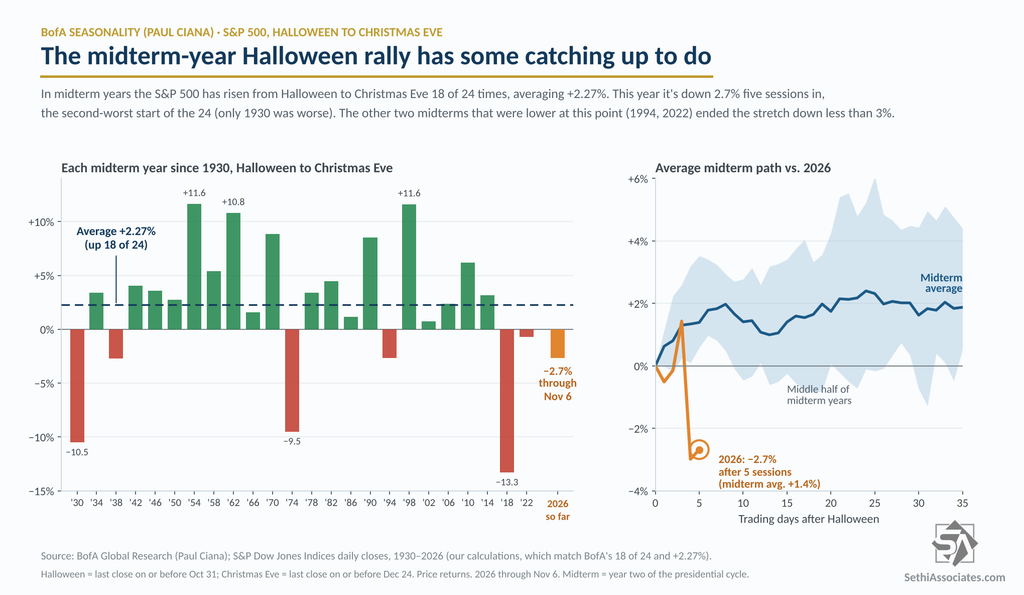
BofA’s Ciana separately noted last week that in midterm years, Halloween to Christmas Eve has been up 75% of the time (18 of 24) by +2.27%, and that when the S&P 500 is up year-to-date through October (as it was this year), November-December has risen 79% of the time since 1928. We obviously have a lot of catching up to do.
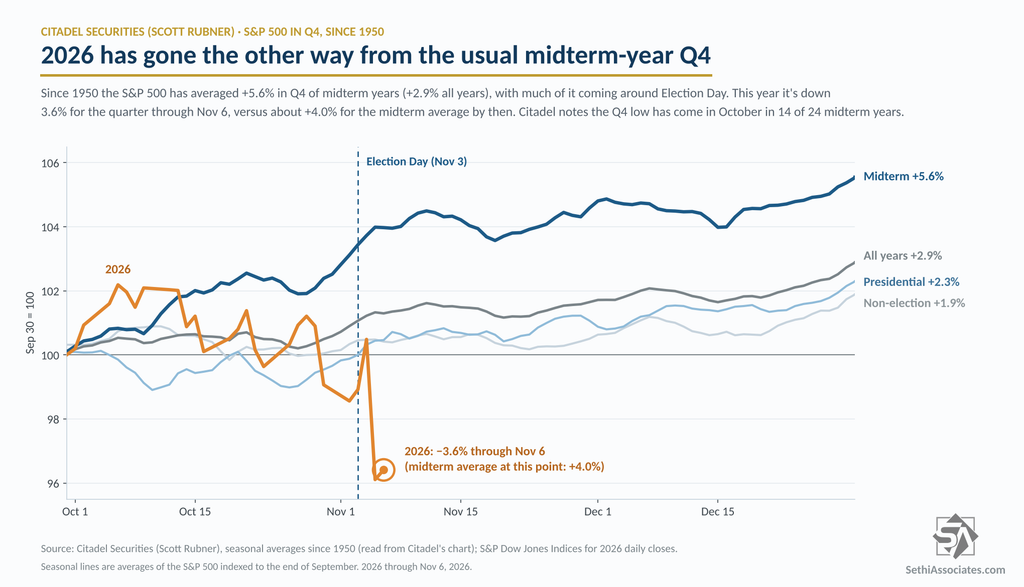
Citadel’s Rubner adds that since 1950 the S&P 500 has been higher six and twelve months after every midterm election, with a median twelve-month gain of 14.5%. Q4 of midterm years has been the strongest of the presidential cycle, averaging +5.6% versus +2.9% for all years, and November has averaged +2.2% in midterm years, with the first half of the month positive nearly 80% of the time (not this year so far).
This year the S&P 500 was lower from the end of September into the vote, versus an average gain of about 3.5% by Election Day in prior midterm years (although we were up nearly 11% at the end of October vs a normal YTD gain of around 1%), but the Q4 low has come in October in 14 of 24 midterm years, followed by a median rally of nearly 10% into year-end. That is out the window at this point as we’re already below the October low.
Wrap-Up – One Day at a Time
Last week’s Week Ahead was titled “Apple, Midterms and Jobs Test a Market on Edge.” While Apple wasn’t great (Apple fell 1.9% Tuesday after its report), the jobs report was, as noted in the Economy section, although that saw bond yields rising which dented the non-AI trade.
But it was the election which clearly was the major catalyst last week, seeing markets surge Wednesday only to drop sharply Thursday, sending the Nasdaq into a correction and the VIX up 70%.
I said Thursday that “markets did a lot of work today in flushing out any non-diehards (like myself) or completely passive investors, and I’d have to think if the buy-the-dip crowd still exists this is quite the dip to buy. As I said last week, a selloff like this often sees a bounce, and often a sharp one at that, but as I also said then until proven otherwise it will just be a bounce.” And bounce we did Friday, although it was a weak one, all in the AI names, with the average stock falling again into the weekend.
I said Friday I was very interested to see where all of the positioning and flow indicators stood, and the answer is, consistent with my Thursday comment, that a lot got cleaned out in a hurry. DB’s consolidated equity positioning fell to the 20th percentile from the 44th, one of the sharpest weekly drops on record, with discretionary investors at the 3rd percentile and Tech positioning at the 7th. Goldman’s hedge fund gross leverage had its biggest weekly drop since Covid and net leverage is back at the 0th percentile, and this time the beta-adjusted figures came down with it. BofA’s global systematic positioning is the lowest since April, Tier1Alpha has CTAs net short for the first time since Q2, and Goldman’s vol panic index hit 9.57.
I also wanted to hear from Deutsche Bank, which I suggested last Sunday may have been a little quick to go overweight Tech. They doubled down this week, saying “With the plunge this week, the risk-reward is now even more favorable,” and “While attention has focused on the blue sweep in the mid-terms as the driver of the selloff, the incremental news from Tuesday was quite modest. Opposition to data centers was already widely acknowledged as a large bipartisan issue even before the elections, suggesting the selloff this week was largely driven by a forced positioning unwind.” In that regard there were headlines I noted on Friday morning about hedge funds “blowing up.”
DB noted “Tech performance relative to the rest of the S&P 500 has now broken a little below its long-run trend channel, like overshoots seen around the start of the Iran war and Liberation Day.”
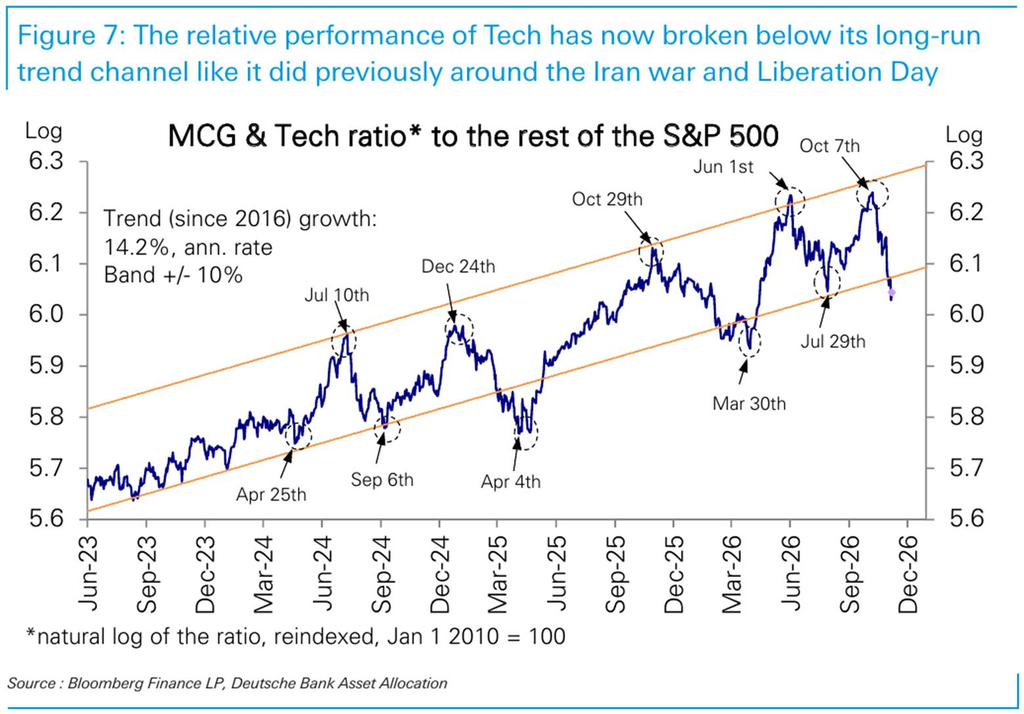
While we remain well under the typical duration, the relative drop in Mega-Cap Growth (MCG) and Tech vs. the S&P 500 is now the worst of the four prior rotations.
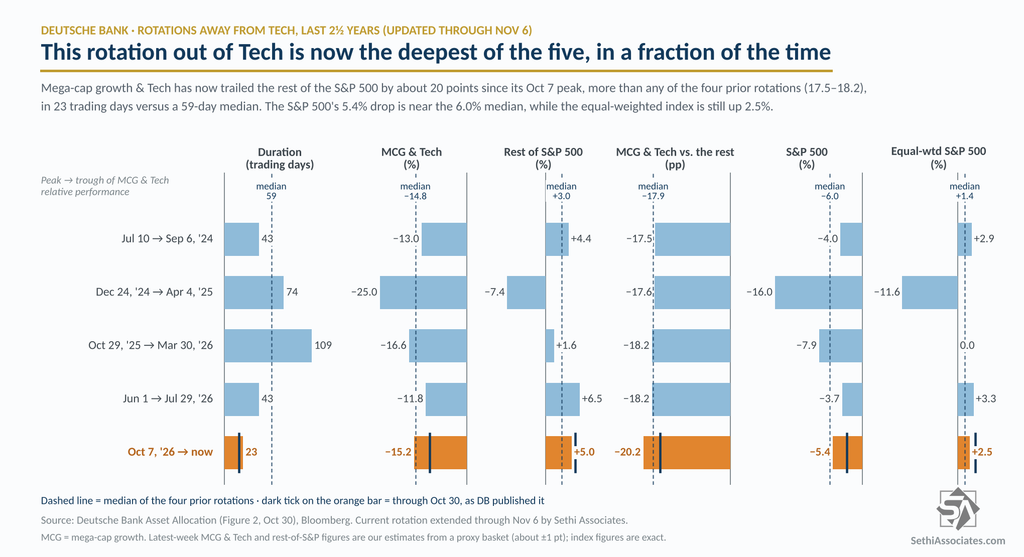
And on Goldman’s Tech-led drawdown framework from last week, Tech’s 18.4% decline is now past the 15.8% median, but the S&P 500’s 5.7% is still well short of its 9.8% median, and at a month old, this one is also far shorter than the average. As a side note, the rotation has also followed the playbook further, with value outperforming growth by 14.6% since October 6th and low-vol stocks the S&P 500 by 13.6%.
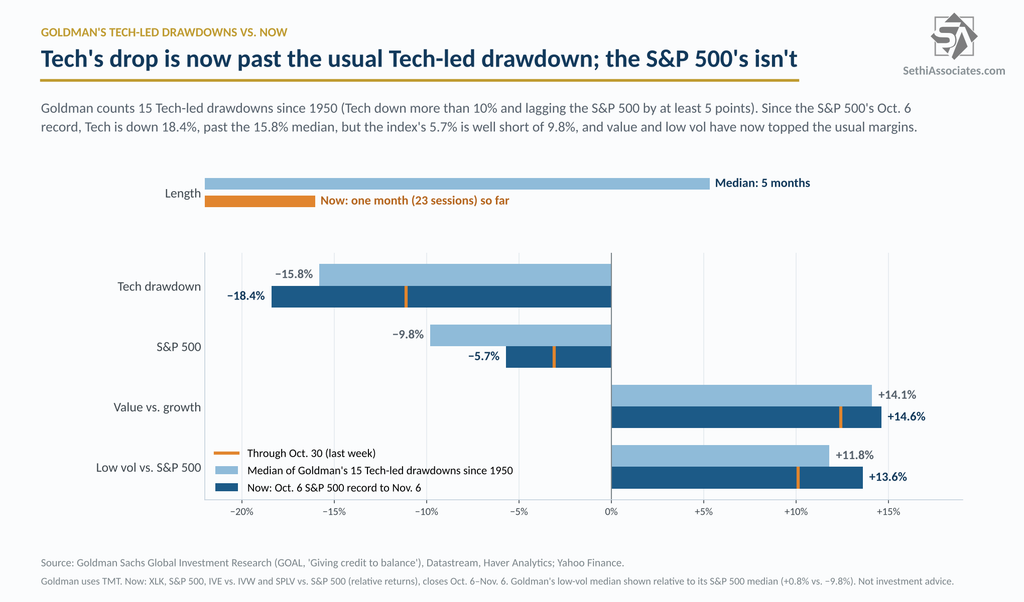
Goldman’s TMT specialists note that with semis valuations “nearly ~50% off the highs,” conversations are now turning to what’s priced in for AI capex (“more 2028+ than in 2027”), with a potential path higher for Tech around earnings (“NVDA still to come”), financing visibility, oil/rates relief and “lowered expectations & reset positioning.”
Of the others who I noted had been quite accurate the past two years but had turned more cautious (Rubner, Yardeni, Kettner, etc.), Rubner has also turned more positive. In “November: The Setup Improves,” written Wednesday (before Thursday’s rout), he says “the combination of light positioning, returning corporate demand, persistent retail buying, and historically favorable post-midterm seasonality creates a compelling setup for US equities into year-end,” and that “the path of least resistance for U.S. equities is higher into year-end.”
Yardeni isn’t specifically calling a bottom yet, but he says “we anticipated buying opportunities after the midterm elections, and Thursday’s selloff delivered some,” and he’s sticking with his 7,900 year-end target (about 7% above Friday’s close): “This remains an earnings-led bull market… We still view the AI backlash as another speed bump, not a roadblock.” He also notes the Nasdaq’s close below its 200-DMA isn’t new, as it rebounded sharply after liberation day and again after the Iran war started, “quickly resuming its uptrend both times.”
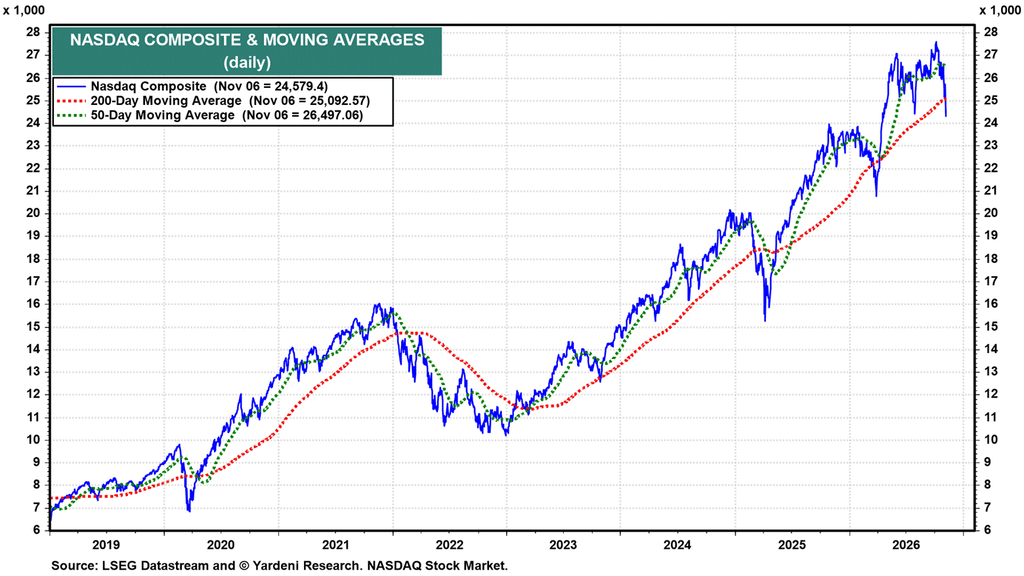
Kettner though said on Bloomberg Friday he wasn’t ready to step in yet. And in her Saturday Substack update, Helene says the head-and-shoulders top she drew in the QQQ last week “came to fruition,” and she’s still using the Sentiment Cycle comparison for the Nasdaq (see chart), but “despite all the hootin’ and hollerin’ there wasn’t much in the way of serious breaks.” And in her latest column she thinks A Market Washout May Be Setting Up the Next Tradable Rally.
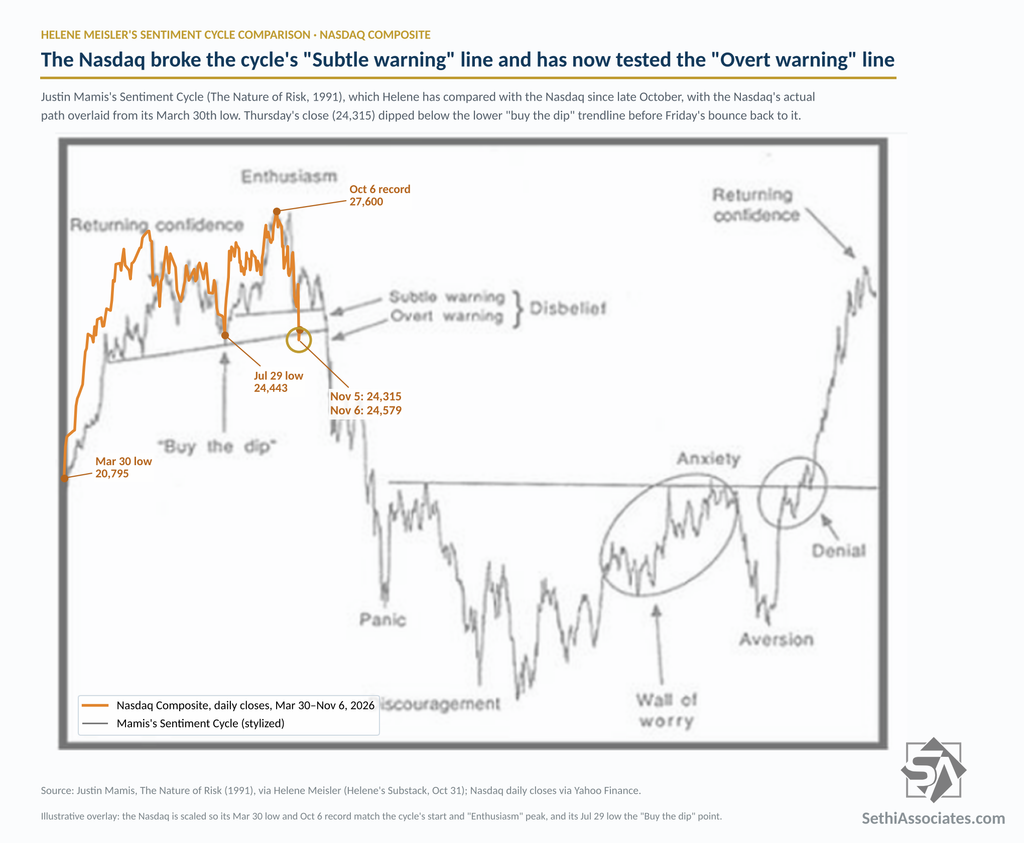
And history is on the side of the bulls from here. As noted earlier after Goldman’s 15 prior panic readings above 9.5, the S&P 500 gained an average 4.6% over three months (higher 80% of the time), and Bespoke finds that after a 4% drop in the S&P 500 the index has averaged a 2% gain over the next month and 6.7% over the next three. But as Goldman notes, “the immediate path has been much less reliable, particularly while still in price discovery mode,” and my McClellan analysis above is a warning: the four prior washouts that rebounded this slowly a month in all went on to lower price lows.

There’s mixed evidence as to whether or how much retail is buying the dip at this point, but as mentioned earlier, things will have to stabilize before systematic traders will step back in.
And that all puts to the side the potential for headlines from the White House. I said last week I “wouldn’t put in a buy order for November 4th just yet.” That proved right, if for a different reason than I expected. On the Middle East, Yardeni notes “no news of the re-escalation of the war in the Middle East has emerged since the midterms,” with hopes for a US-Iran deal taking Brent down to $98.32, though he still sees “a risk of re-escalation.” Positively, it does seem the current trajectory of news flow is towards a deal, but we’ve obviously seen this movie before.
So a lot of cross-currents in the short term. I’m taking it one day at a time right now, and will let the market action dictate my positioning. There are good arguments for it to go either way, but Friday’s weak bounce doesn’t make me super optimistic. Whatever happens, remember that moves can be quite sharp in either direction with the negative gamma in place accelerating moves.
But as I also said Thursday, “with markets having given back much of this year’s advance on what for now are just concerns about slower growth and positioning having been cleaned out… things certainly seem relatively favorable for upside once things stabilize.” In addition, earnings growth remains very solid, boosted by the strong economy; the Fed is clearly not interested in a rapid rate-hiking campaign (which is where things can turn ugly for equity markets); sentiment has plenty of room to improve; seasonality is supportive; and the buyback window is open.
The question is, of course, when we get that stabilization. CPI Tuesday (the last before the December FOMC) and Cisco and Applied Materials Thursday are the next tests, ahead of Nvidia later this month.
As always, let’s see what we get and go from there.
At the time of publication, in terms of securities mentioned, Sethi was long AVGO, CEG, GOOGL, OXY, SKYD, SPY, IWM, RSP and numerous Treasury ETFs, and short AMAT, META and MU.