October Payrolls Top Every Forecast as Unemployment Falls Back to 4.1%
Payrolls jumped 165,000 with 84,000 in upward revisions, topping every estimate, and wage growth beat. The household report was also very strong.
You've reached your free article limit
You've read 0 of 1 free Pro articles.

- US October Nonfarm Payrolls: 165,000 (est. 62,000; prev. 29,000; prev. revised 60,000)
- US October Private Payrolls: 159,000 (est. 58,000; prev. 46,000; prev. revised 78,000)
- US October Unemployment Rate: 4.1% (est. 4.2%; prev. 4.2%)
- US October Average Hourly Earnings month-over-month: 0.4% (est. 0.3%; prev. 0.1%; prev. revised 0.3%)
- US October Average Hourly Earnings year-over-year: 3.1% (est. 2.9%; prev. 3.0%; prev. revised 3.2%)
- US October Average Weekly Hours: 34.4 (est. 34.4; prev. 34.4)
- US October Labor Force Participation Rate: 61.9% (est. 61.8%; prev. 61.8%)
- US October Manufacturing Payrolls: 19,000 (prev. 9,000; prev. revised 13,000)
- US October U-6 Underemployment Rate: 7.9% (prev. 7.6%)
- US Two-Month Net Payroll Revision: 84,000
As a reminder, there are two surveys in this release. One is a survey of employers that asks how many people they paid in the survey week (this is where the headline “jobs” number and wage and workweek information comes from). The other is a survey of households that asks if people had a job in the survey week and other similar questions (if no job, were they looking for work, etc.). Because of the different populations surveyed and the different questions, there can be very different answers. The household survey is much more volatile with a smaller survey size, and many consider it less reliable.
Executive Summary
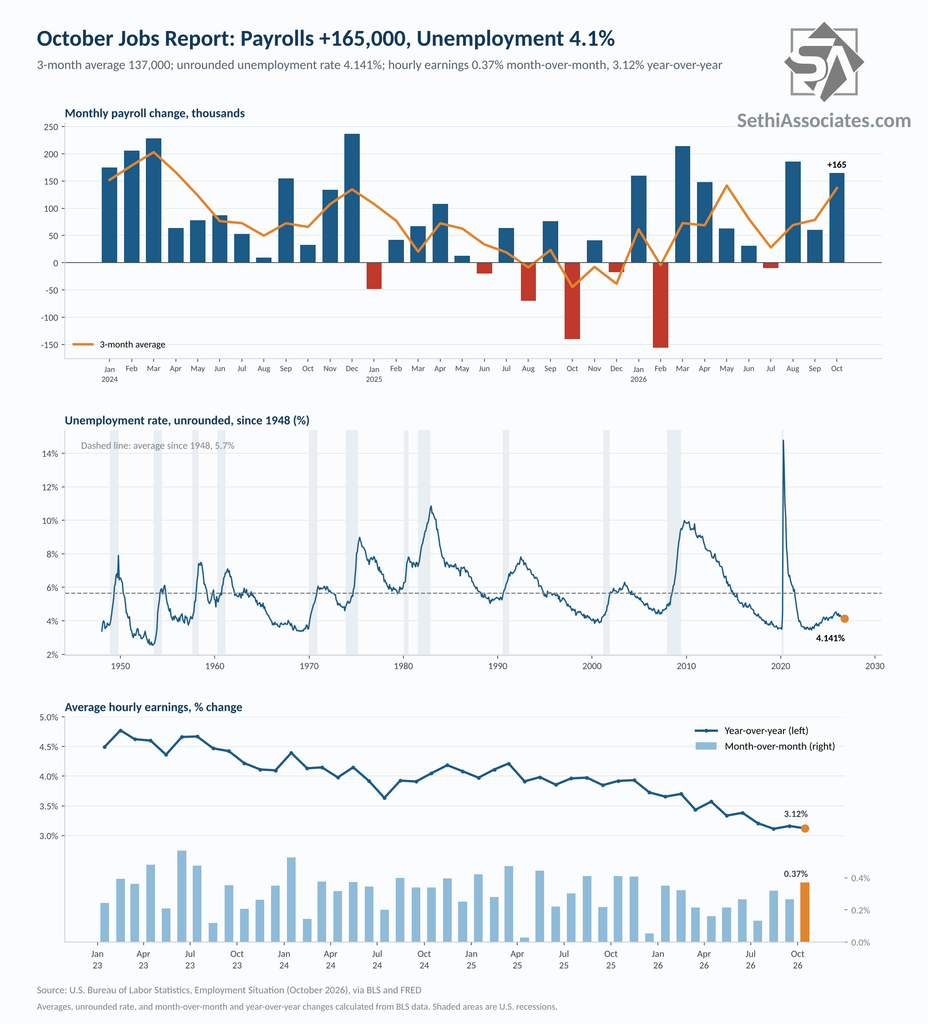
- Nonfarm payrolls rose 165,000 in October, more than double the 62,000 expected and above all 79 forecasts in Bloomberg’s survey. In addition, August and September were revised up a combined 84,000. That lifted the three-month average to 137,000, the best since May, from 51,000 a month ago.
- Hiring was led by professional and business services (70,000, the most since July 2022), health care (41,600) and transportation and warehousing (24,800). Manufacturing rose for a fifth straight month, and hiring breadth jumped to its widest since August.
- The household survey also was very strong adding 463,000 jobs, its third straight large gain, and the unemployment rate fell to 4.1% (4.141% unrounded) even as participation rose to 61.9%, the highest since February.
- The soft spots were a 339,000 jump in people working part time for economic reasons, which pushed the U-6 underemployment rate back up to 7.9%, and the longest median unemployment spell since November 2021.
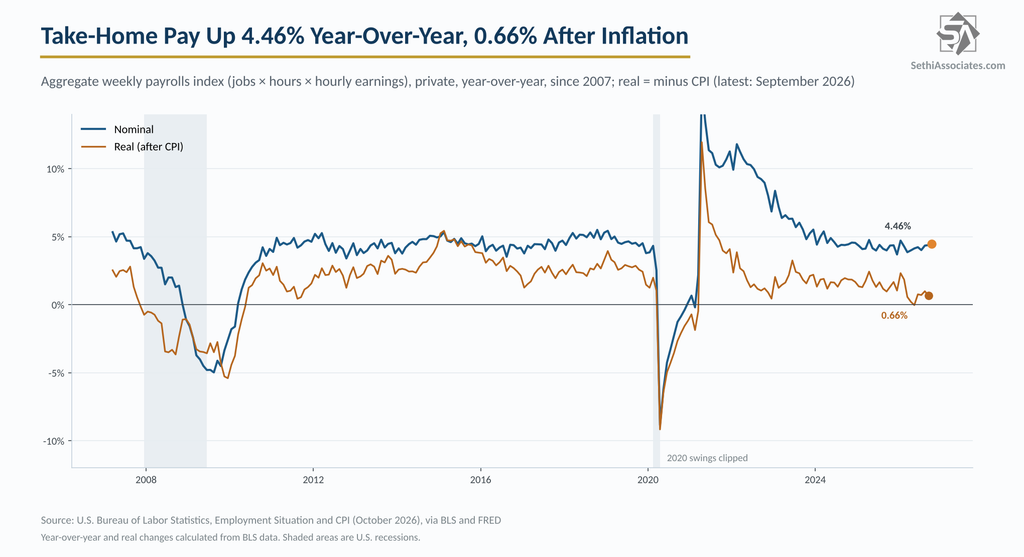
- Average hourly earnings rose 0.37%, the most since November 2025, and 3.12% from a year ago, both above forecasts. Total private take-home pay rose 0.47% and 4.46% year-over-year, the fastest since January, but after inflation it was up only about 0.7% as of September. Two-year Treasury yields rose and December rate-hike odds climbed to 74%, per Bloomberg.
- This post looks at the big picture of the Employment Situation report with a focus on jobs and incomes. My favorite metric for the economy from this report is at the end of this piece (aggregate weekly payrolls, or total private worker take-home pay), so be sure you get down to it.
Employer’s Survey
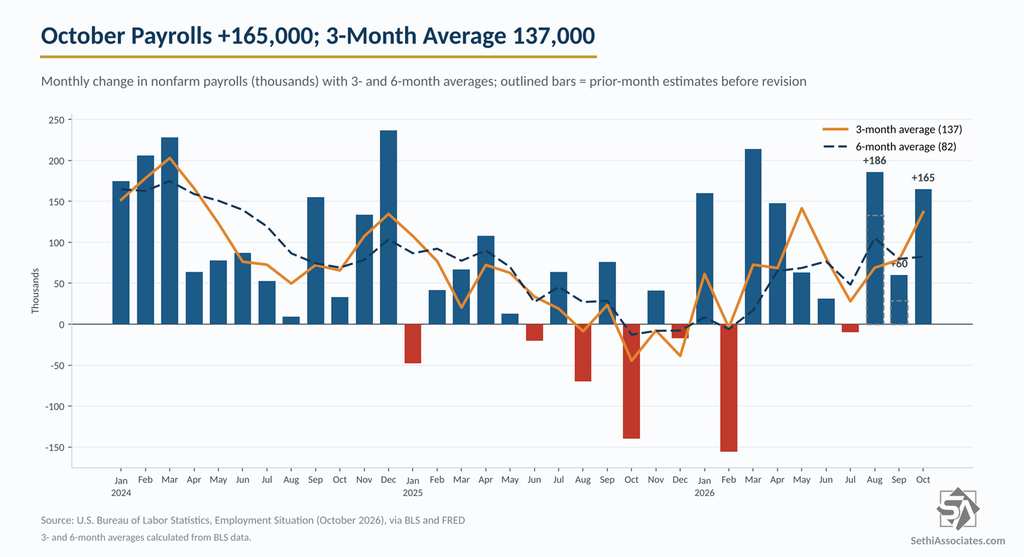
From the employer survey, October nonfarm payrolls rose 165,000, more than double the 62,000 expected and above every one of the 79 estimates in Bloomberg’s survey (the highest was 131,000). It was the biggest gain since August and well above the 48,000 average monthly gain of the prior 12 months. Per ZeroHedge it was a five standard deviation beat to the median forecast.
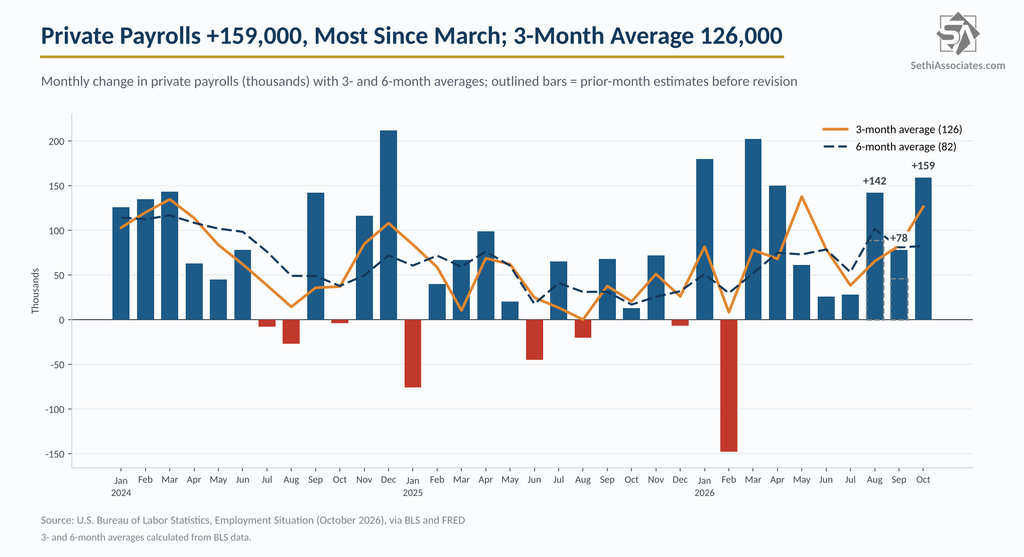
Revisions were favorable this time, adding another 84,000, with August revised up 53,000 to 186,000 (from 133,000) and September up 31,000 to 60,000 (from 29,000). That lifted the 3-month average to 137,000, the best since May, from 51,000 before revisions, while the 6-month average rose to 83,000. For the year, payrolls have averaged 86,000 a month and private payrolls 88,000, compared with just 10,000 and 25,000 for all of 2025.
That 137,000 3-month average compares with a breakeven rate (the job growth needed to absorb new entrants into the labor force) of around 50,000, as estimated by Bloomberg’s Chris Anstey. October’s gain was the third-largest of 2026, behind March (214,000) and August (186,000).
Services did most of the work, adding 144,000 after an upwardly revised 51,000 in September (from 28,000).
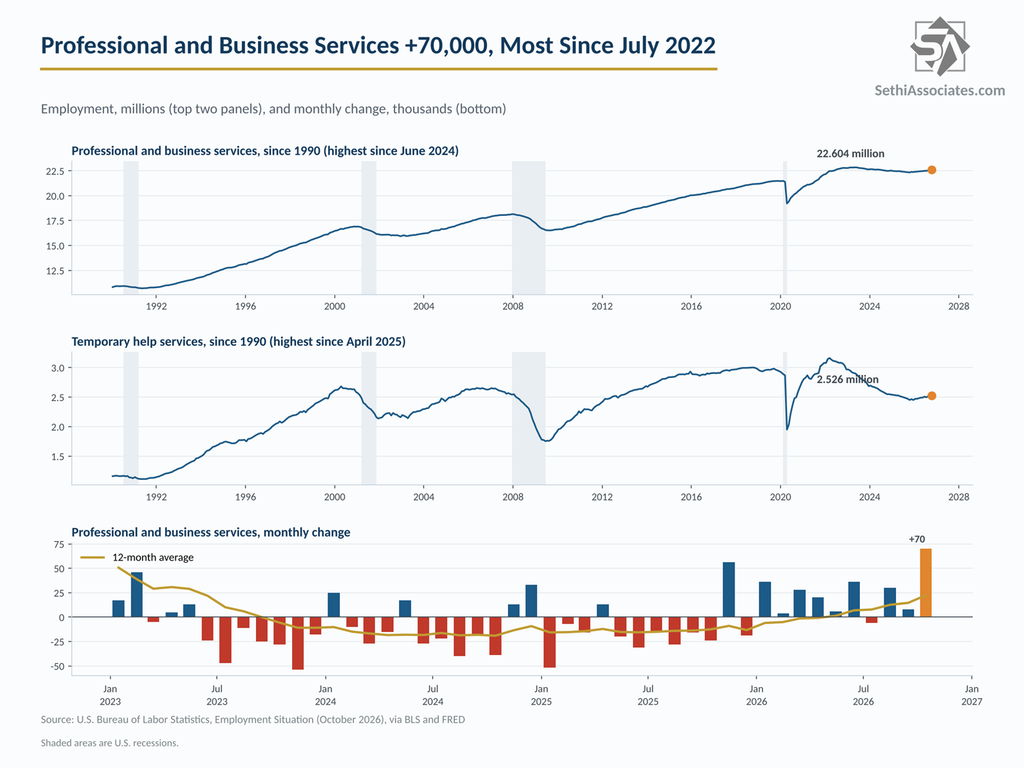
Professional and business services added 70,000, the most since July 2022 and well above its 15,000 average of the prior 12 months. Professional, scientific and technical services added 33,000 to another record, administrative and support services added 28,000, and management of companies added 9,000. Temporary help, often an early read on hiring demand, rose 18,600, the most since January, to 2.526 million, the highest since April 2025. Historically, gains in temp help and the broader sector have pointed to firmer private hiring over the following three to six months.
The sector has added 269,000 jobs since a low in October 2025, per the BLS. The sector’s overall employment is now the highest since June 2024.
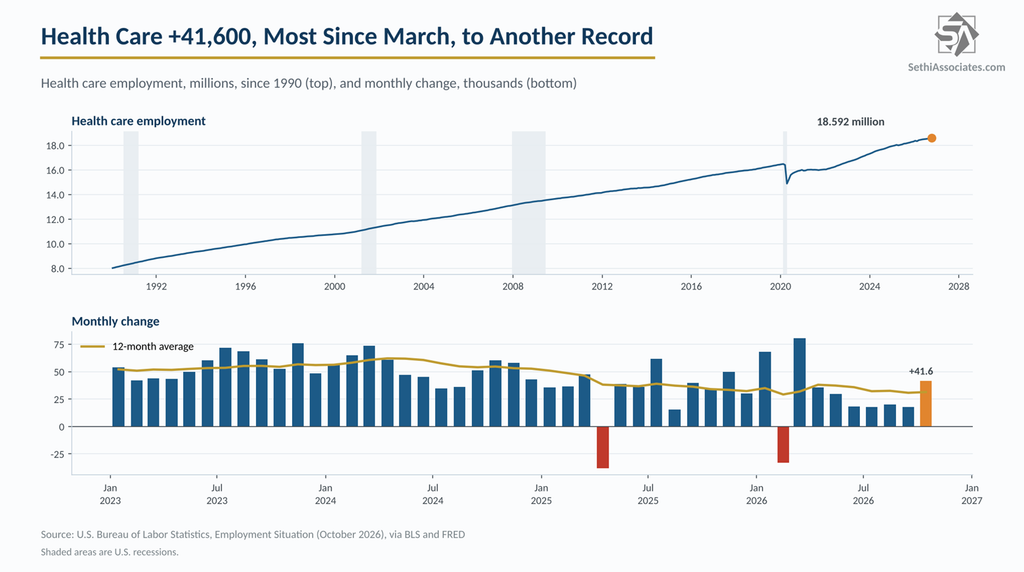
Health care added 41,600, the most since March and above its 31,000 average of the prior 12 months, led by hospitals (16,000), home health care (11,000) and outpatient care centers (5,000). Social assistance added 13,500. Health care employment is at another record.
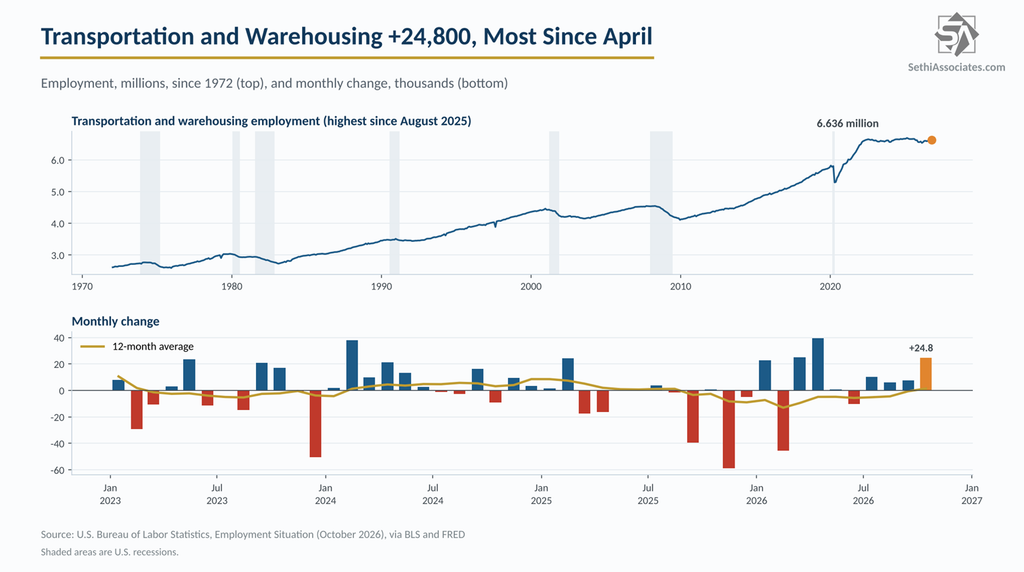
Transportation and warehousing added 24,800, the most since April, as couriers and messengers rose 17,000 and air transportation 4,000. The BLS says the sector has added 104,000 jobs since a low in February, with couriers and messengers accounting for 71,000 of that. Bloomberg’s Enda Curran noted the gain comes as the economy heads into the peak holiday season.
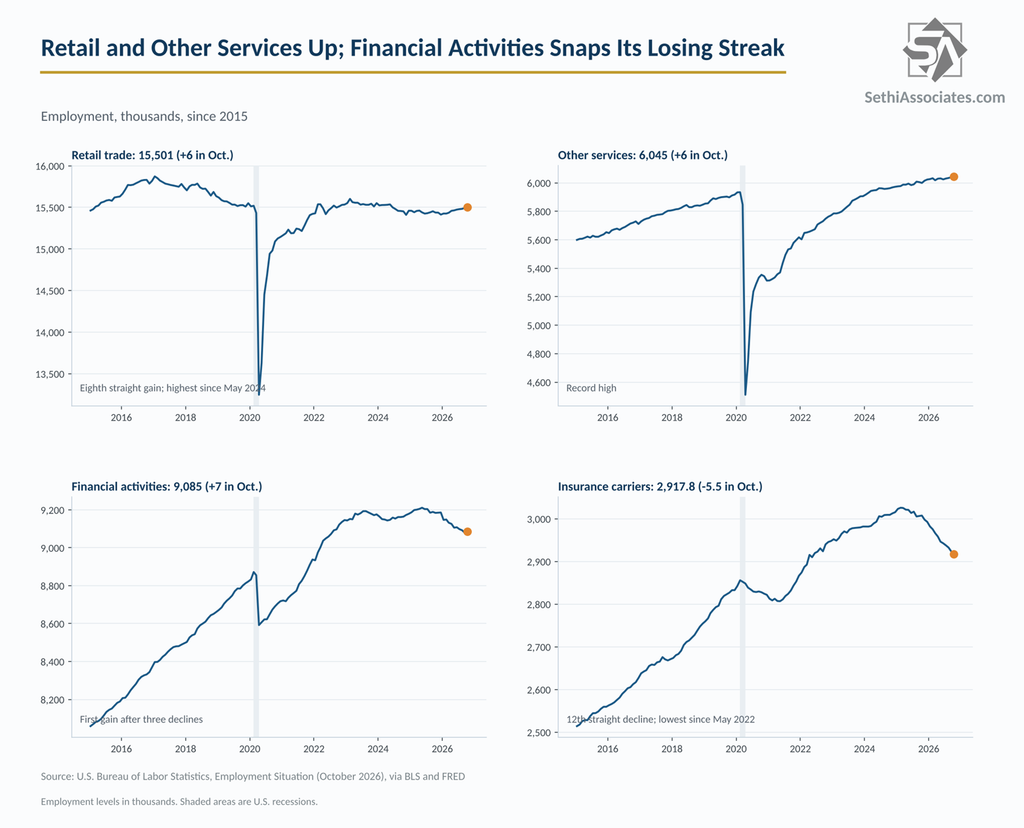
Retail trade added 6,000, an eighth straight gain, to the highest since May 2024. Other services added 6,000 to a record, and financial activities rose 7,000, its first gain in four months, though insurance carriers fell 5,500 for a 12th straight decline to the least since May 2022.
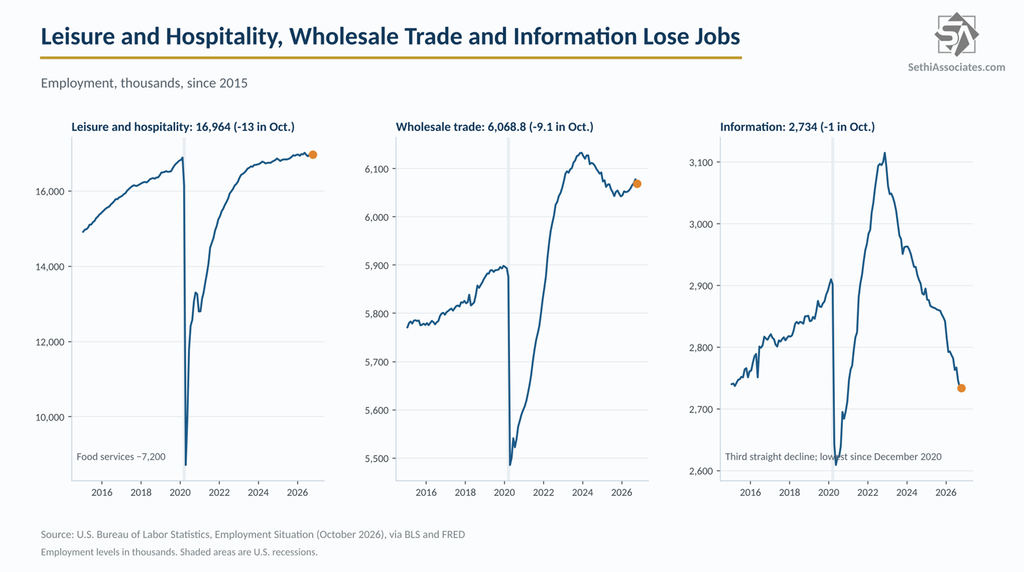
On the negative side, leisure and hospitality lost 13,000 (food services and drinking places down 7,200) and wholesale trade lost 9,100. Information lost 1,000, a third straight decline, to 2.734 million, the least since December 2020.
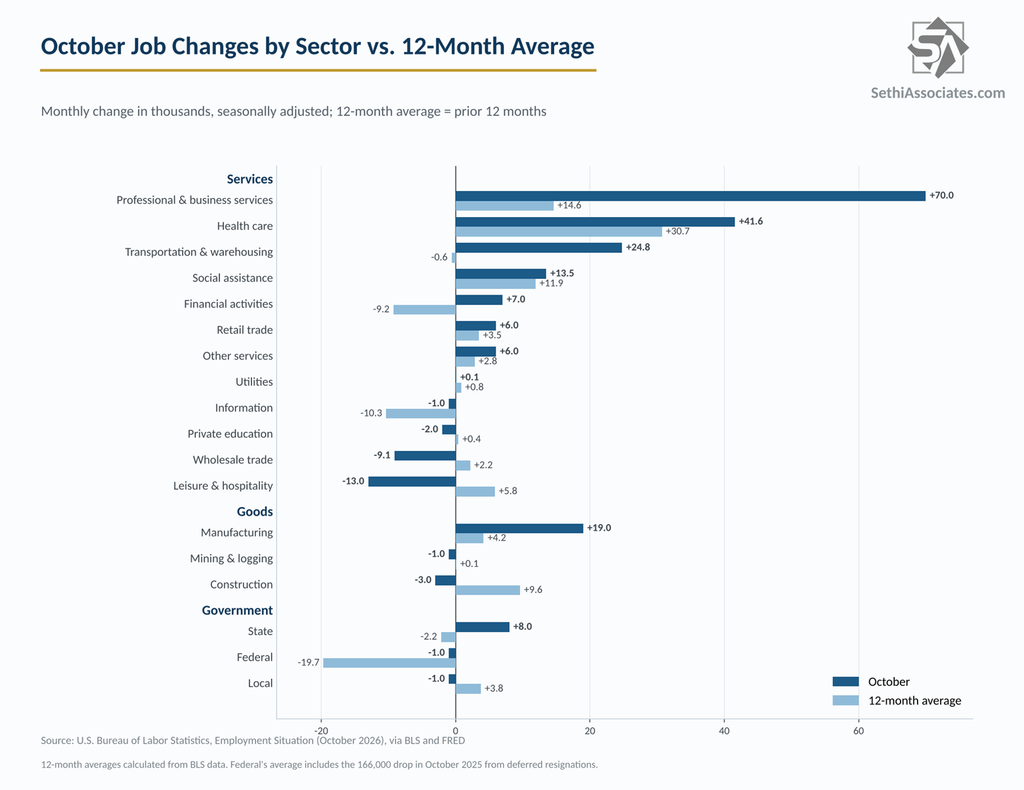
Goods sectors added 15,000 after an upwardly revised 27,000 in September (from 18,000).
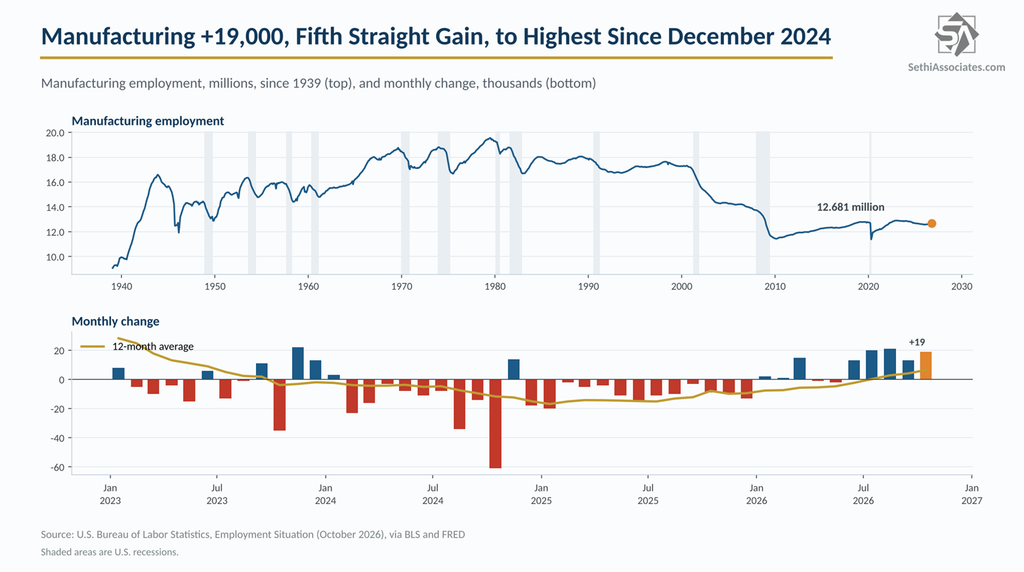
Manufacturing added 19,000, a fifth straight gain and the most since August, to 12.681 million, the highest since December 2024. That puts factory employment 8,000 above January 2025, even after manufacturing lost 113,000 jobs in 2025. It is now up 101,000 since a low in December 2025, with computer and electronic products (7,000), machinery (4,000) and primary metals (4,000) leading in October. Durable goods makers added 25,000, the most since November 2024, while nondurables lost 6,000.
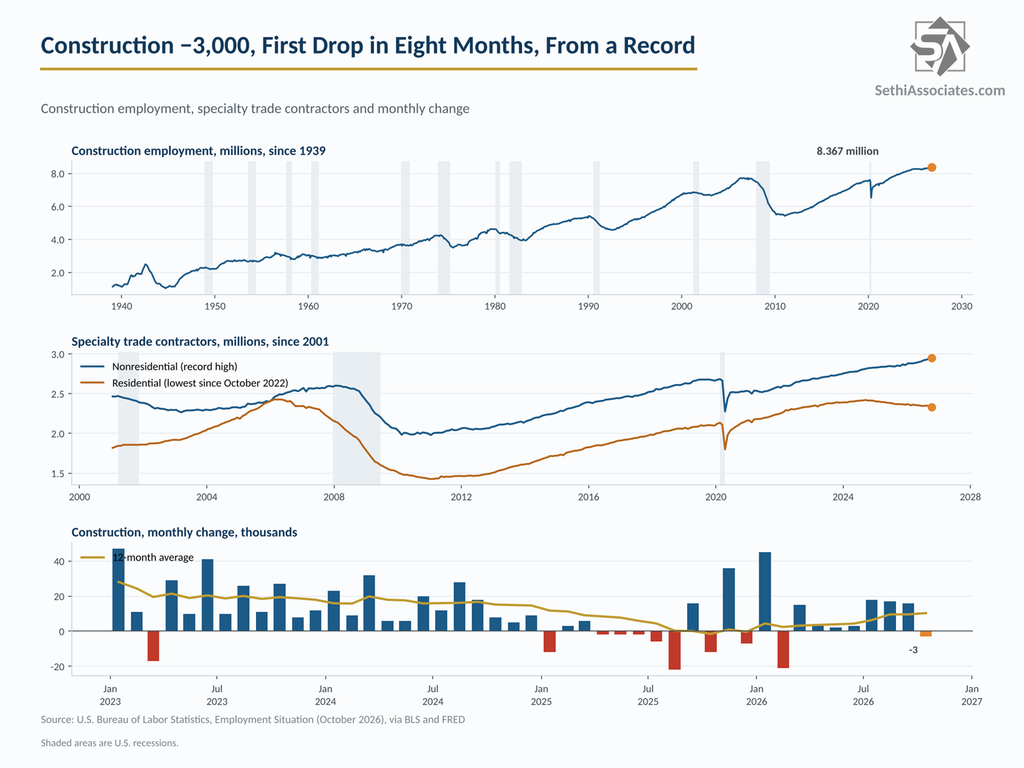
Construction slipped 3,000, the first decline in eight months after adding 74,000 jobs over the prior seven, from a record 8.370 million in September (revised up). Nonresidential specialty trade contractors, where data center work shows up, still added 7,900 to another record, while residential specialty trade contractors lost 15,200 to the fewest since October 2022.
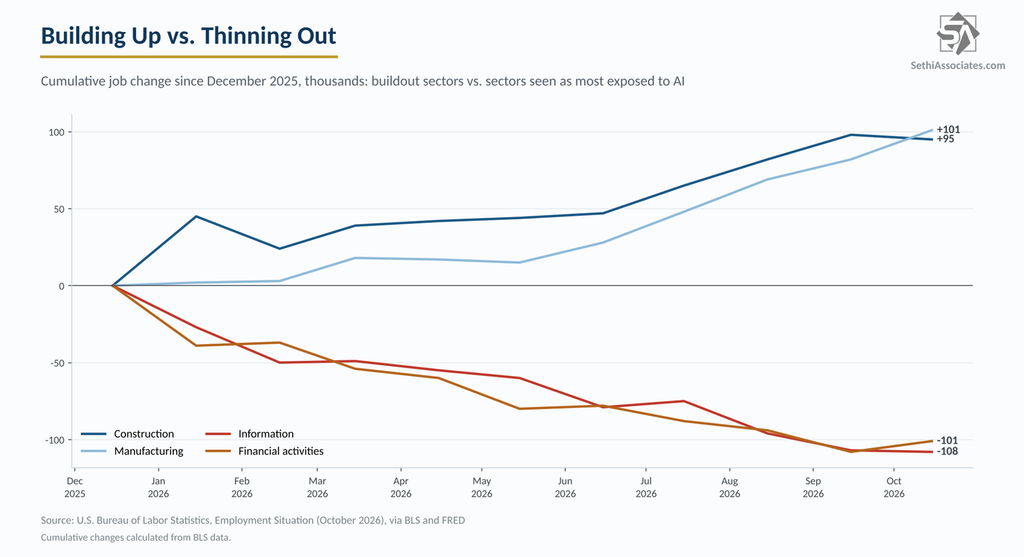
Since December, construction and manufacturing have added about 95,000 and 101,000 jobs, while information and financial activities, two of the sectors seen as most exposed to AI, have each lost more than 100,000.
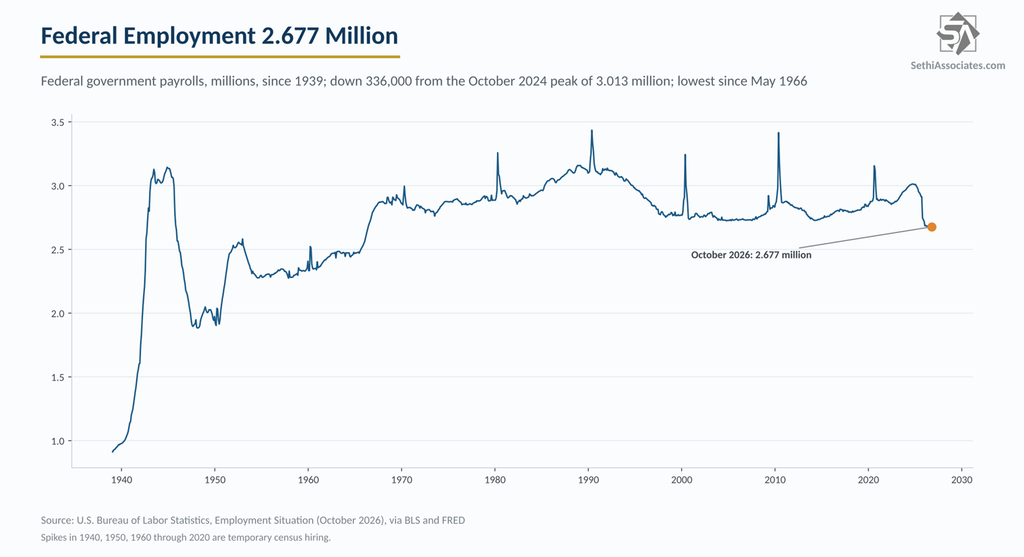
Government added 6,000 after a revised loss of 18,000 in September. State government added 8,000, and local government lost 1,000. Federal employment fell another 1,000 to 2.677 million, the lowest since May 1966, and is now down 336,000, or 11.2%, from its October 2024 peak.
Private payrolls rose 159,000, the most since March, against 58,000 expected, after an upwardly revised 78,000 in September (from 46,000). The three-month private average rose to 126,000, the best since May.
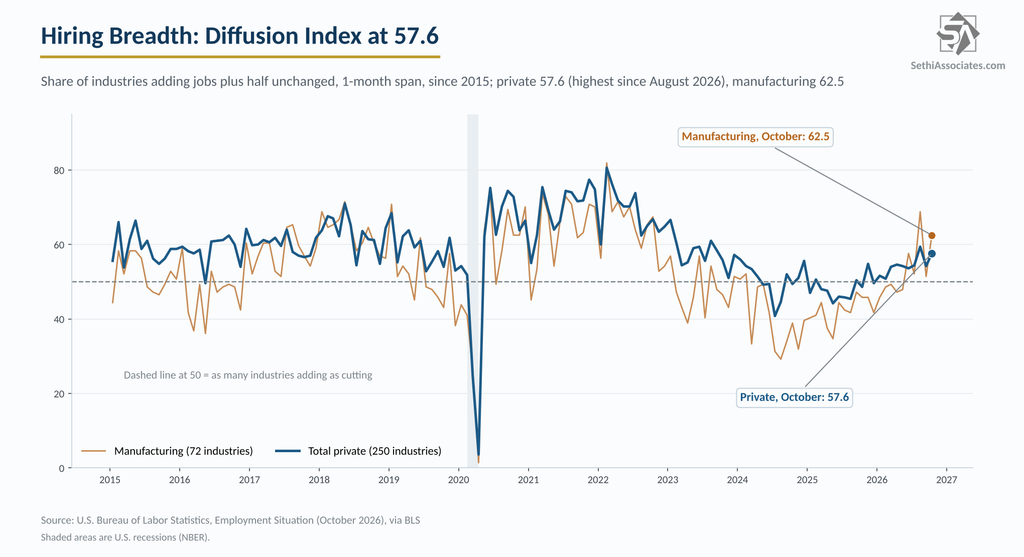
The breadth of hiring improved too. The diffusion index (the share of 250 private industries adding jobs, plus half of those unchanged) rose to 57.6, the highest since August, and September was revised up to 54.2 from 49.0, so it never actually dipped below 50. For manufacturing, the index rose to 62.5 from an upwardly revised 51.4 (from 46.5).
Household Survey
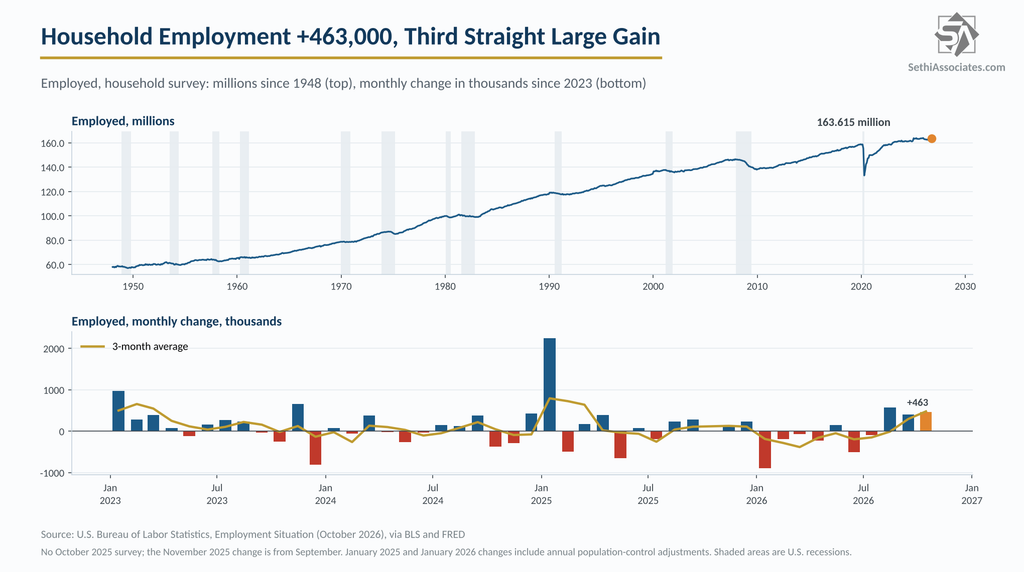
The household survey was strong again. The number of employed people rose 463,000, the third straight large gain (1.44 million over three months), to 163.615 million, the highest since December 2025.
The labor force grew 421,000 to 170.683 million, also the highest since December.
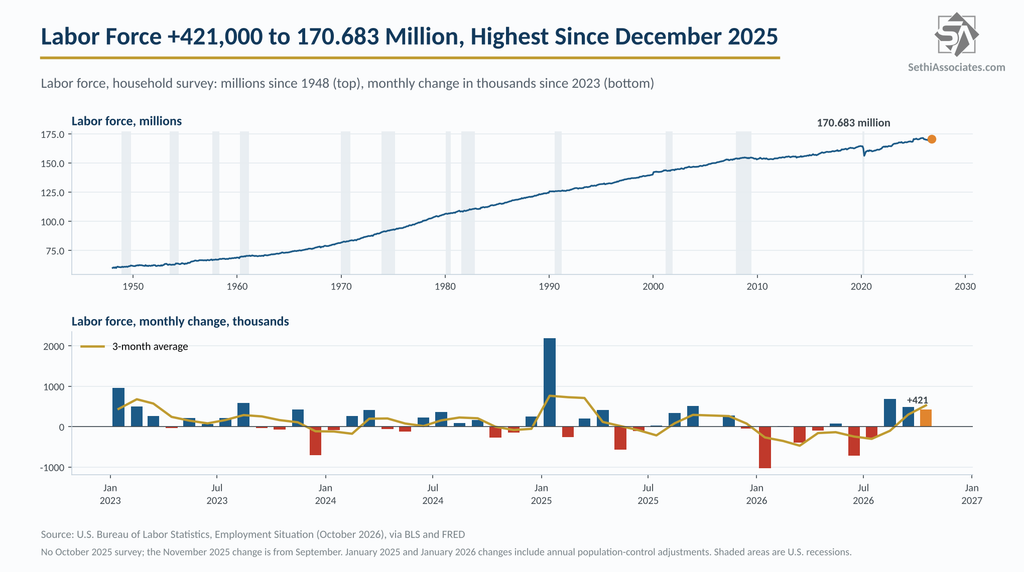
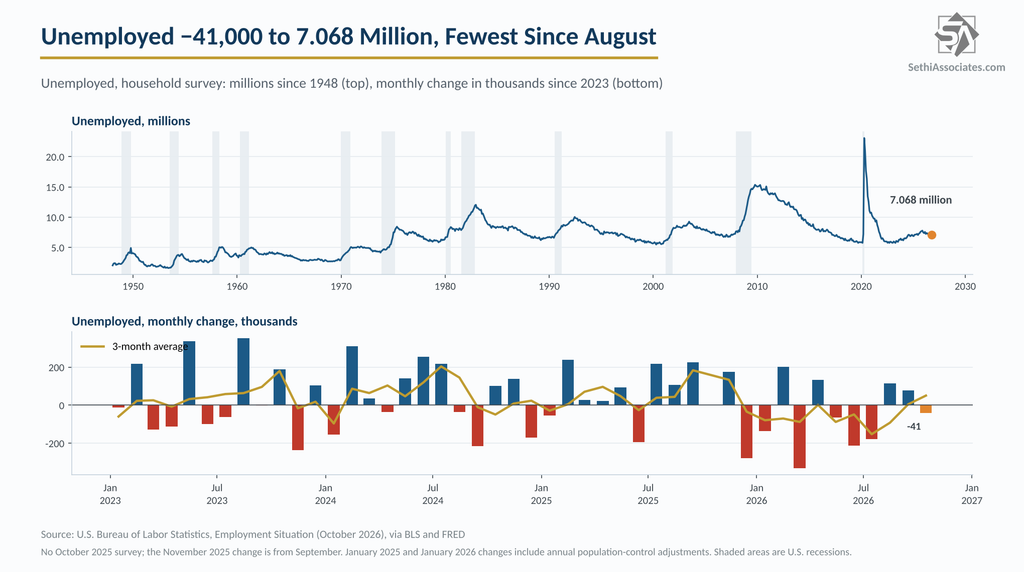
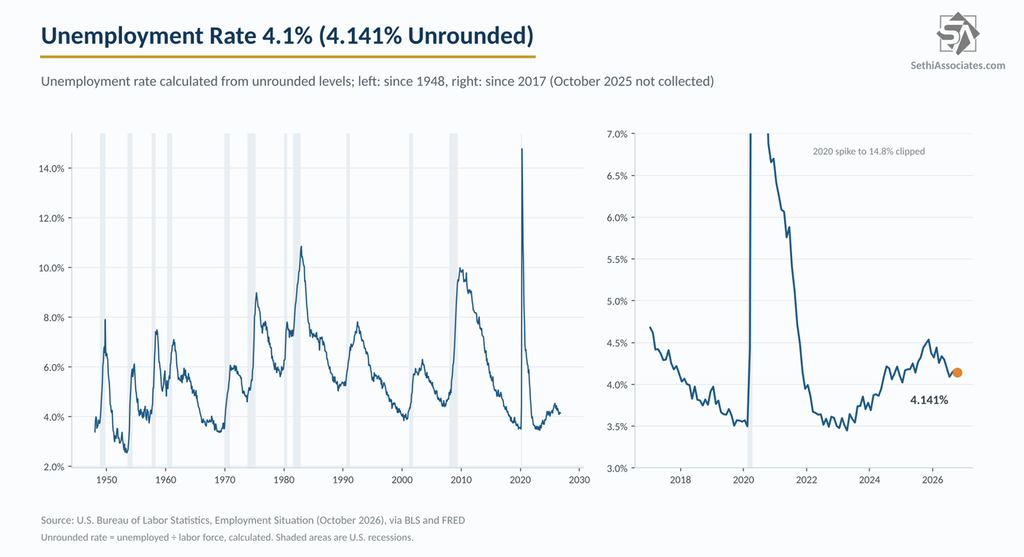
With employment growth outpacing the labor force, the number of unemployed fell 41,000 to 7.068 million, and the unemployment rate dropped back to 4.1%. Unrounded, it fell to 4.141% from 4.175%, the lowest since July. Only 21 of the 79 economists in Bloomberg’s survey had expected a decline.
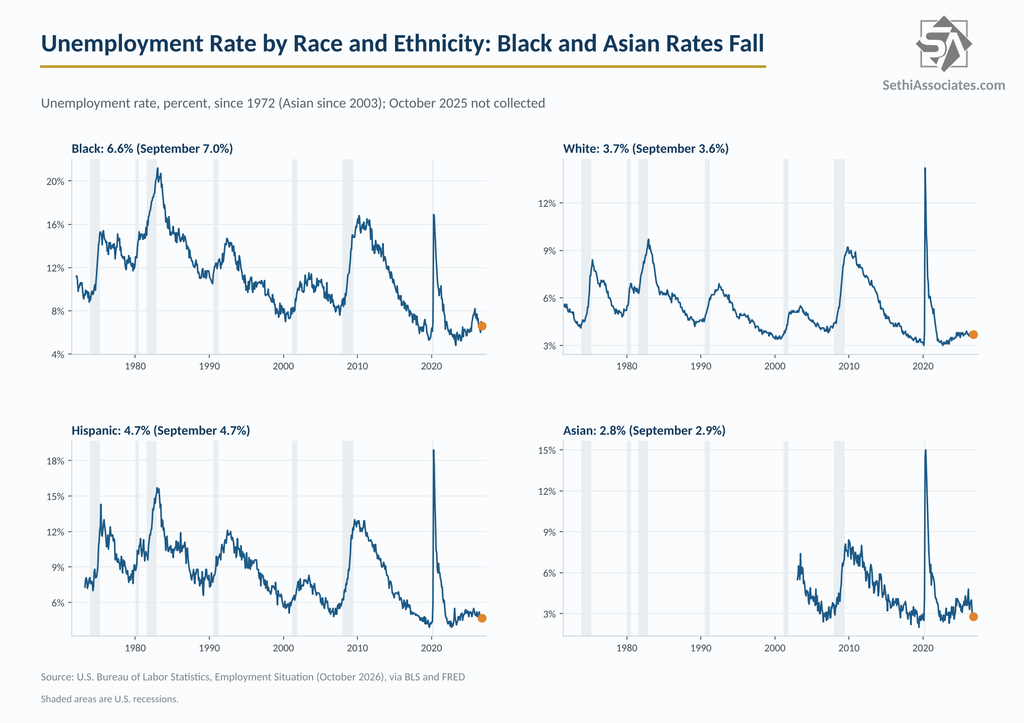
By group, Black unemployment fell to 6.6% from 7.0%, and Asian unemployment fell to 2.8%, the lowest since March 2024. White unemployment rose to 3.7% from 3.6%, while Hispanic unemployment was 4.7%.
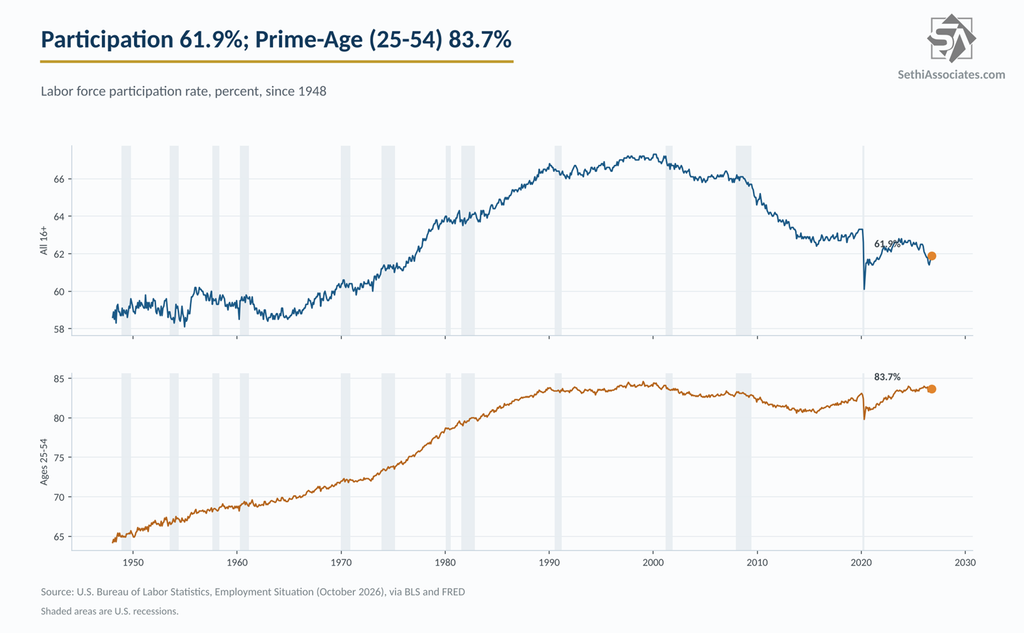
The labor force participation rate rose to 61.9% (61.91% unrounded, from 61.79%), the highest since February. Only one of the 19 economists who forecast participation expected it to rise, per Bloomberg. The number of people outside the labor force fell 293,000. Prime-age (25-54) participation held at 83.7%, and the prime-age employment-population ratio held at 80.7%.
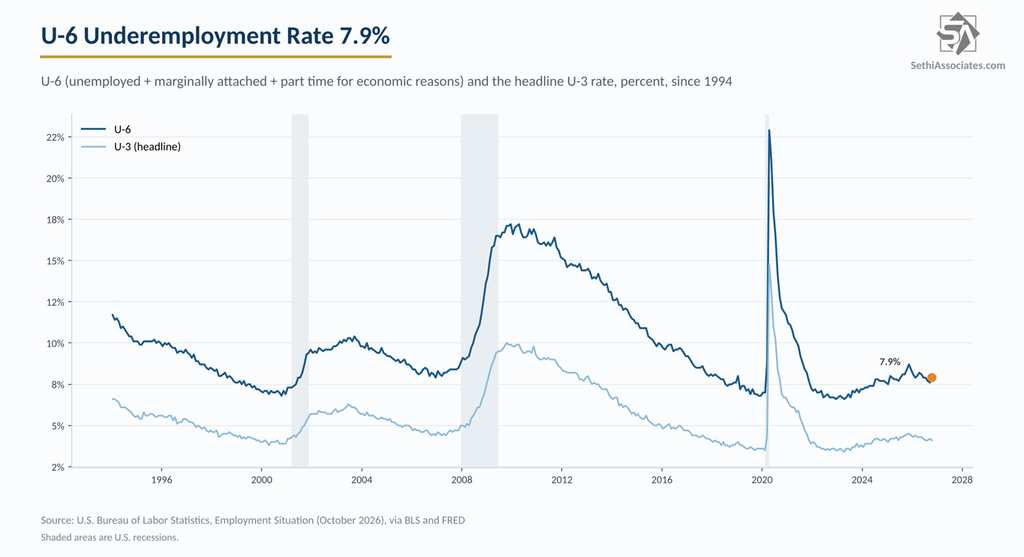
A weak spot was underemployment. The number of people working part time for economic reasons jumped 339,000 to 4.84 million, the most since April, and the U-6 underemployment rate rose to 7.9% from 7.6%, back to where it was in June and July. Marginally attached workers rose 171,000 to 1.639 million, and discouraged workers rose to 448,000. Even so, full-time workers rose 714,000 while part-time workers fell 242,000.
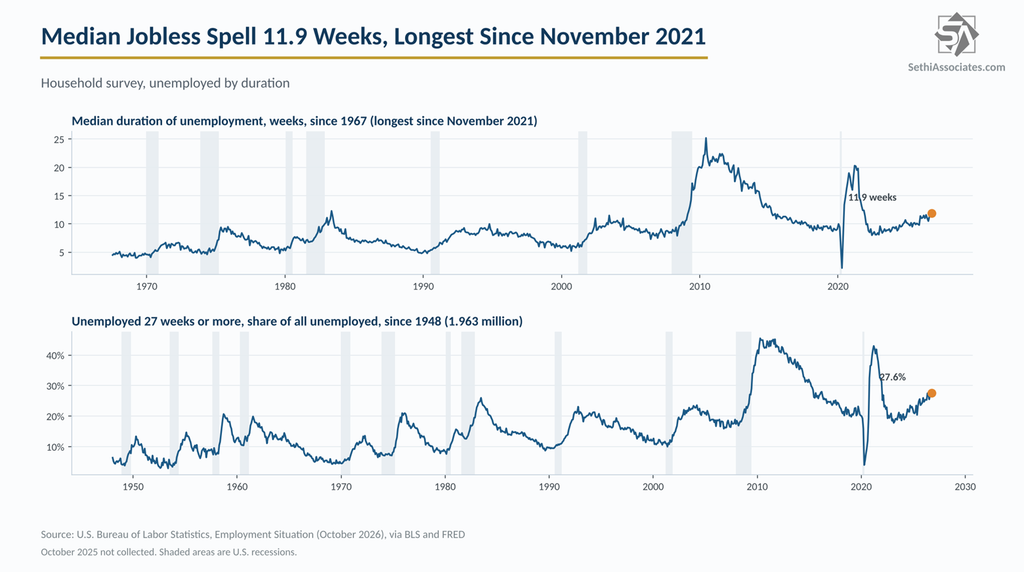
And long-term unemployment edged up. Those jobless 27 weeks or more rose 19,000 to 1.963 million, the most since May and 27.6% of all unemployed, and the median spell of unemployment lengthened to 11.9 weeks, the longest since November 2021. That fits the “low hire, low fire” picture: few layoffs (initial jobless claims are at the joint-lowest since 1969), but those who lose a job are taking increasingly longer to find a new one. Positively, though, they’re still looking rather than leaving the labor force.
Incomes
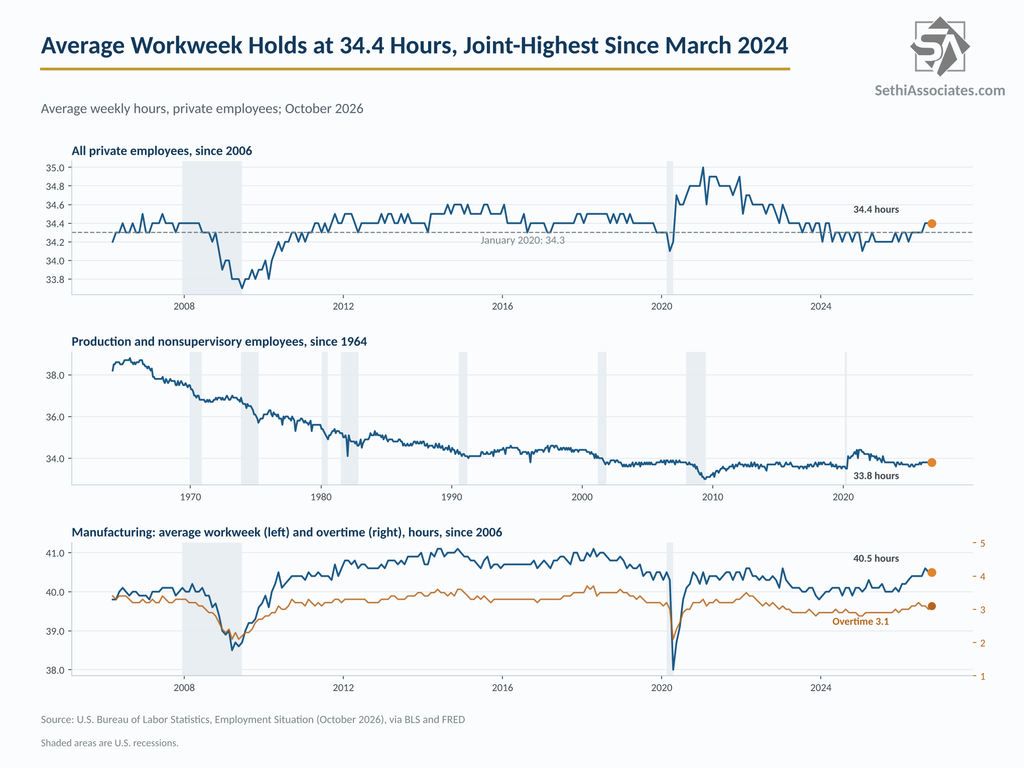
The average workweek was unchanged at 34.4 hours, as expected, holding at the highest since March 2024, a tenth above January 2020. In manufacturing, the workweek held at 40.5 hours and overtime rose 0.1 hour to 3.1.
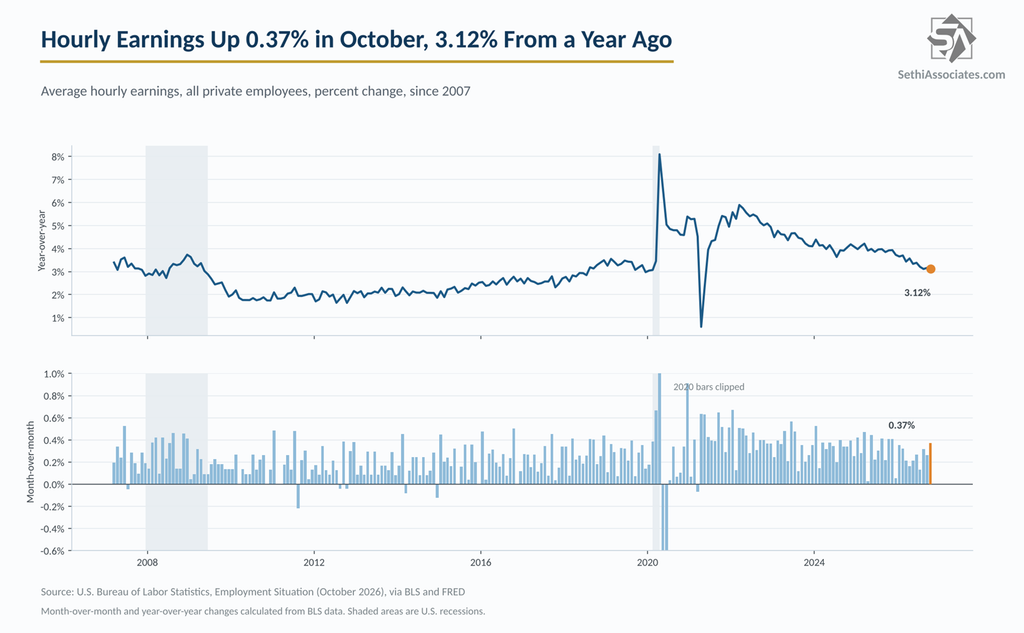
Average hourly earnings rose 14 cents, or 0.37%, to $38.00, the most since November 2025 and above the 0.3% consensus (only five of 61 economists in Bloomberg’s survey expected 0.4%). September was revised up to 0.26% from 0.13%.
From a year ago, average hourly earnings rose 3.12%, above the 2.9% expected, after an upwardly revised 3.16% in September (from 3.02%), although that is off the lowest since May 2021 in August. Production and nonsupervisory workers saw gains of 0.37% month-over-month and 3.31% year-over-year.
Putting together the stronger payroll gain, the steady workweek and the bigger hourly earnings increase, the index of aggregate weekly payrolls, which I consider among the most important metrics from this report as it represents the total take-home income of private employees, rose 0.47% month-over-month, the most since August, after an upwardly revised 0.33% in September (from 0.19%). It is calculated as the total number of jobs × hourly earnings × the workweek, and Nick Timiraos calls it “a good monthly proxy for nominal income growth and correlates well with nominal GDP growth.”
From a year ago it rose 4.46%, the fastest since January and a bit above its 4.2% average in the decade before the pandemic (2010-2019).
Adjusted for inflation, though, the gain is much more modest: with September CPI at 3.7% year-over-year, real aggregate weekly payrolls were up just 0.66% as of September, down from 0.99% in August and well below their 2.5% average in that pre-pandemic decade.
Market Reaction
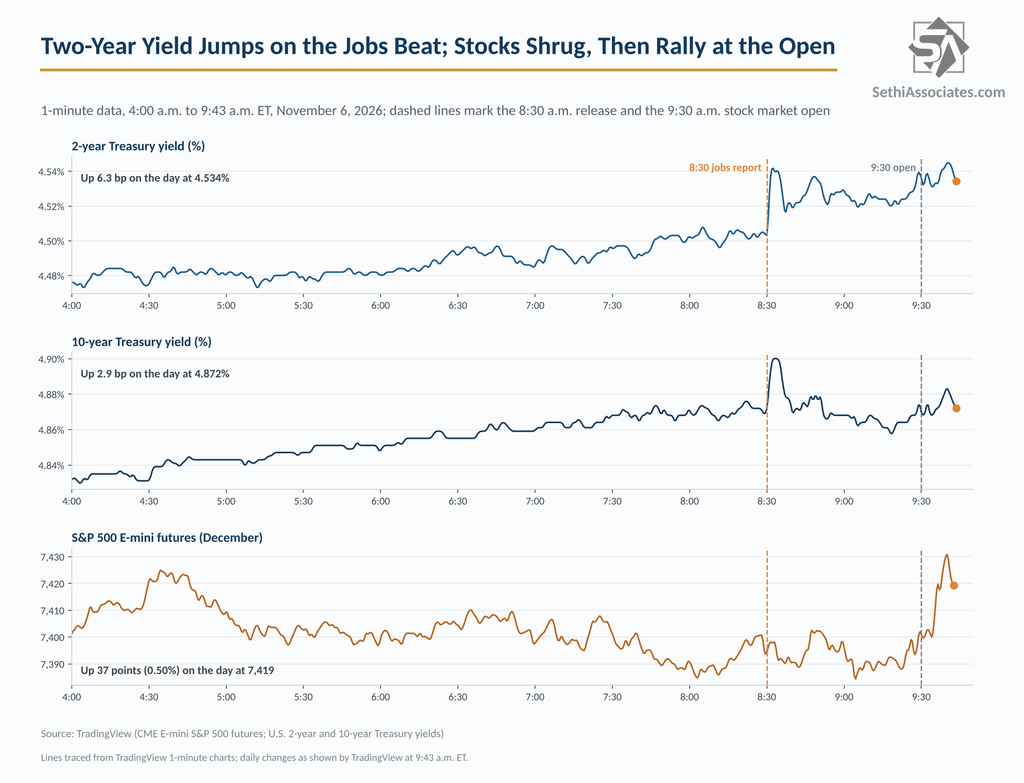
The data pushed rate-hike bets modestly higher with pricing for a December hike rising to 74% from 67% before the release per Bloomberg. Stocks shrugged off the report, with S&P 500 futures initially dropping before quickly recovering (the index has climbed from those levels since). The two-year yield rose around 4 basis points on the release now up around 7 basis points on the day.
Analyst Reactions
- Bloomberg Intelligence’s Ira Jersey: “There’s nothing weak in the report at all except the underemployment rate moving a bit higher, but the rest of the underlying data was solid.” He said it is hard to see how a full hike in the first quarter of 2027 isn’t priced back into the market quickly.
- Bloomberg’s Chris Anstey: “Not seeing any anomalies here at first glance, things look across-the-board positive.” With nobody in Bloomberg’s survey forecasting a gain as big as 165,000, plus the upward revisions, he said “this really blew away expectations,” and that the report “underscores there’s nothing to worry about with regard to the job market for the Fed right now.”
- Bloomberg’s Enda Curran: “At first glance this is strong across the board.” On the jump in December hike pricing to 74%: “Given the inflation backdrop, it would take a significant stock market wobble to pare back bets on a Fed hike.” Looking ahead, he said “the bigger story right now is how pronounced will the AI sell off be and does it trigger a deeper market rout. That would be a whole new variable for the Fed.”
- Fitch Ratings’ Olu Sonola: “Strength on strength. This is a very strong labor-market report on the heels of solid GDP and consumer-spending data last week, reinforcing the economy’s positive momentum… The labor market’s resilience keeps the Fed focused on inflation and pushes the policy debate further toward a December rate hike.”
- Florian Ielpo at Lombard Odier Asset Management: “The key point is that this report once again confirms the economic strength highlighted by the Fed and all but seals the case for a December rate hike… Main Street is doing just fine, thank you.”
- Natixis’ Christopher Hodge, on the wage beat: “These data are noisy and still, not terribly impressive… Our nominal income proxy and suite of labor tightness indicators still suggest little inflationary impulse from the labor market.”
- RBC Capital Markets’ Izaac Brook: “I don’t think there is a ton of ‘new’ signal in the big beat beyond that payroll prints remain very volatile and in aggregate the labor market is still healthy, which was already known.”
What to Watch
This report caps a week of strong labor data: ADP’s October beat, job openings were strong across the board, announced job cuts were the fewest for an October in three years and jobless claims are near 1969 lows. With the labor market no longer a reason to wait (even a soft November report just ahead of the Fed’s next meeting can be shrugged off as reversion to the mean), really the only thing stopping a December hike is a very cool set of inflation prints next week.