Construction Spending Drops the Most Since April 2020 on Record Remodeling Decline
September construction spending dropped 1.9% but almost entirely from the volatile remodeling estimate.
You've reached your free article limit
You've read 0 of 1 free Pro articles.

US Construction Spending (M/M) Sep: -1.9% (est 0.6%; prev 0.9%; prev R 2.0%)
Executive Summary
- Construction spending fell 1.85% in September, the most since April 2020, against expectations for a 0.6% gain. But August was revised up to a 1.98% gain, so spending is about where it was in July.
- The drop came almost entirely from a 13% drop in the implied residential remodeling figure, the largest on record (to 1993). Note though that is a very noisy figure that has seen the initial figure revised by 2.3 percentage points on average.
- Data centers and power though remained robust with data center spending up 90% from a year ago. For the third-quarter as a whole spending on those categories exceeded the total gain for the quarter.
September Construction Spending
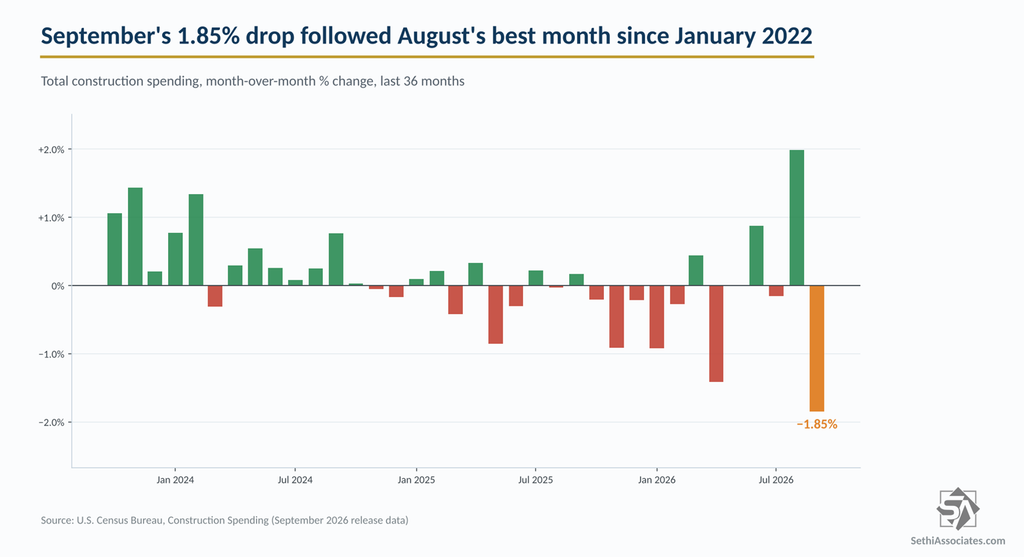
The headline miss looks worse than it is: September’s drop mostly reversed August’s upwardly revised jump. Spending fell 1.85% to $2.19 trillion at a seasonally adjusted annual rate, the largest decline since April 2020 and well short of the 0.6% gain expected. August though was revised up to a 1.98% gain, now its best month since January 2022, from 0.85%. Put the two months together and spending is up about 0.1% from July.
Unlike August’s gain, the September decline though was described as statistically significant: the release puts it at “1.9 percent (±0.7 percent) below the revised August estimate.” Spending is down 2.66% from a year earlier and 2.9% for the year to date.
Why the Drop May Be Noise
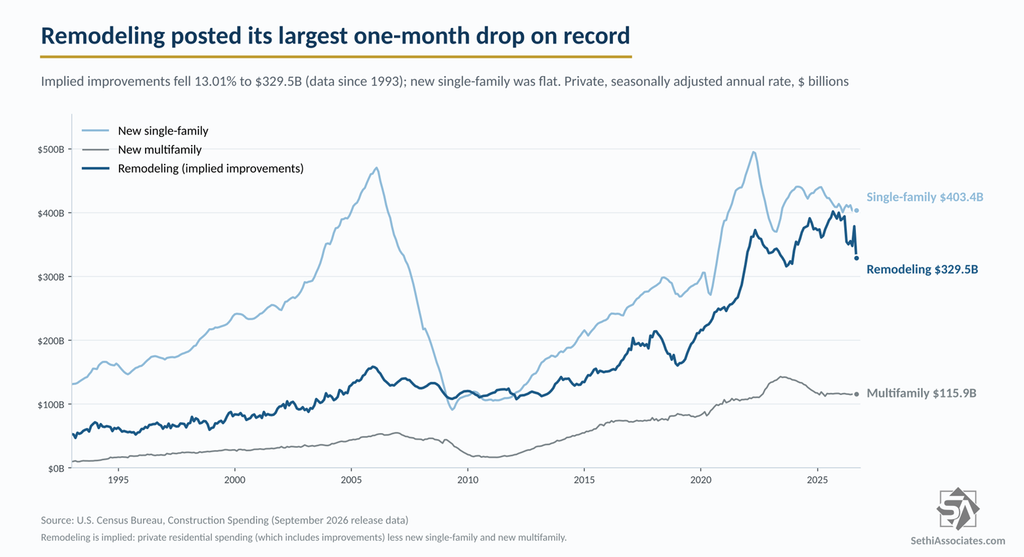
Private residential construction fell 5.48%, the most since February 2009. Census doesn’t publish a separate residential remodeling figure but it can be implied by subtracting from the total new single-family construction, which was flat (-0.01%), and multifamily, which edged up 0.06%. That implies a decline of 13.01% to $329.5 billion, the largest one-month drop in data going back to 1993. That $49.3 billion decline was larger than the entire $40.9 billion drop in private construction. Excluding remodeling, total spending rose 0.43%.
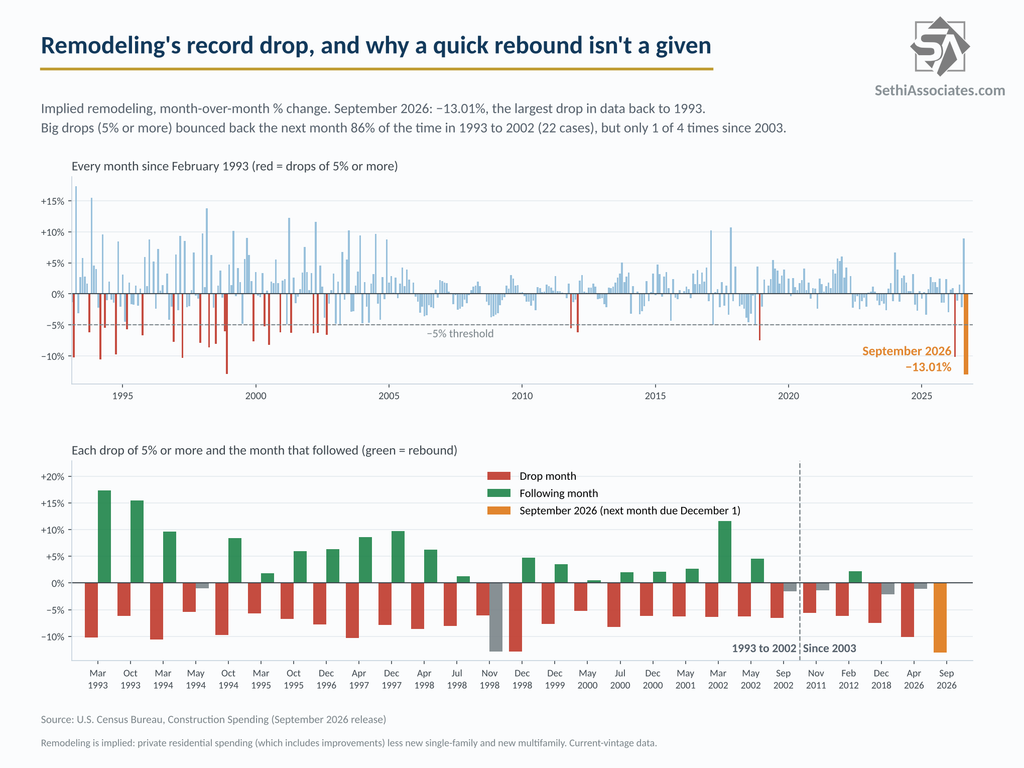
Notably, such large drops (5% or more) were much more frequent prior to 2002 when we saw 22 of them. Of those 19 saw a significant mean reversion the following month (86%). However, since then, there have only been four, and only one rebounded.
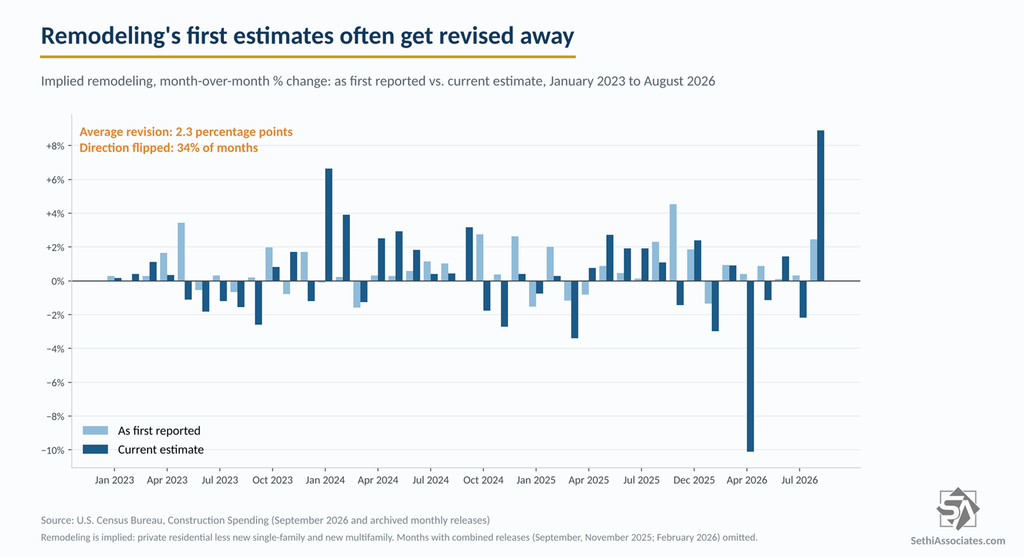
What may be more likely is a significant revision. Comparing each month’s first estimate since January 2023 with the current one, implied remodeling has been revised by 2.3 percentage points on average, and the direction flipped in 34% of months. August’s figure alone went from a 2.46% gain to 8.91%. Total spending, by comparison, is revised by about 0.6 points on average.
Overall, new single-family construction is down 2.36% from a year earlier.
Data Centers and Power Continue to Lead
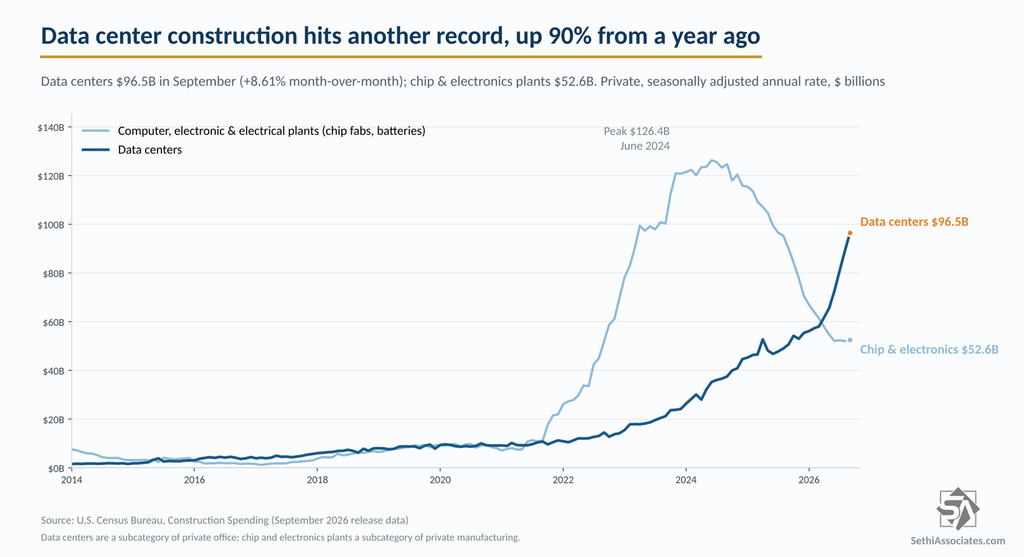
The remodeling data hid continued robust spending on data centers and power. Data center construction hit another record at $96.5 billion, up 8.61% in September and 90.26% from a year earlier, the fastest annual growth since April 2016. It was the 10th straight monthly gain. Data centers now make up 66% of private office construction and 4.4% of all US construction spending.
ConstructConnect counts $74.8 billion in planned data center projects expected to break ground within six months, even after September starts slowed to $9.4 billion from August’s record $25.8 billion, according to its November Data Center Report.
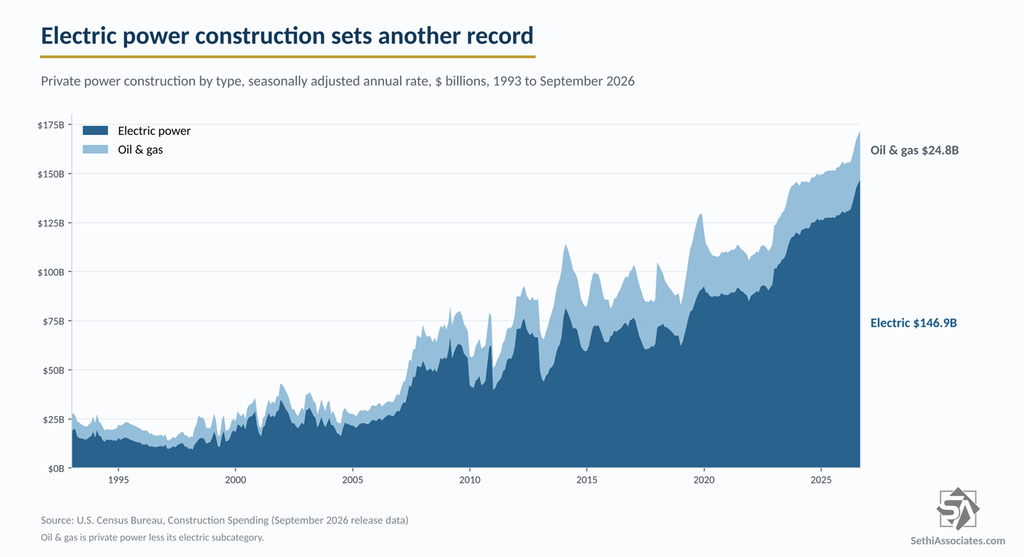
Private power construction also set a record at $171.7 billion, up 12.12% from a year earlier. Electric power, 86% of that total, rose 1.31% to a record $146.9 billion.
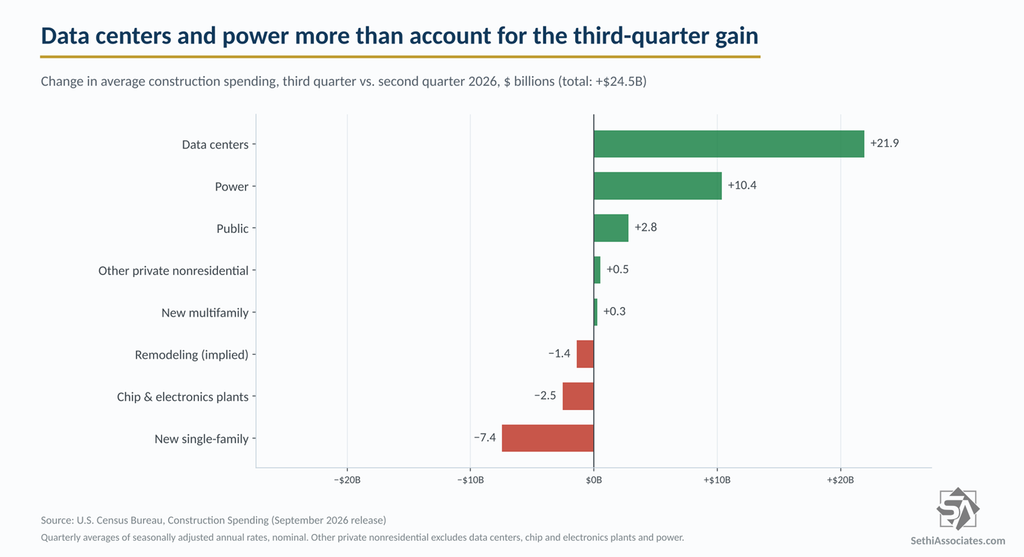
For the third quarter as a whole, average spending rose $24.5 billion from the second quarter. Data centers added $21.9 billion and power $10.4 billion, more than the total gain. New single-family construction subtracted $7.4 billion and chip and electronics plants $2.5 billion.
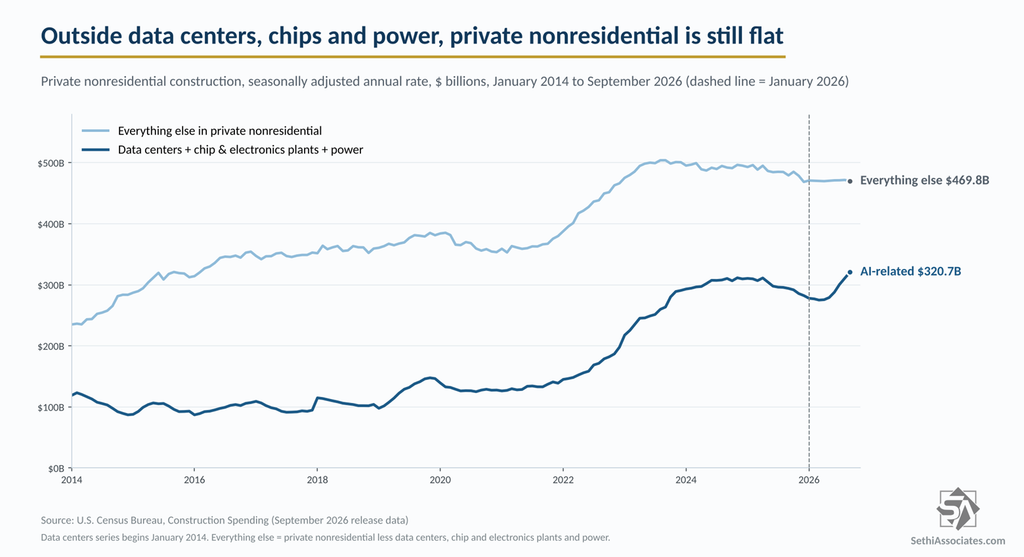
Everything else in private nonresidential construction was $469.8 billion in September, essentially unchanged from $470.7 billion in January.
What It Means for GDP
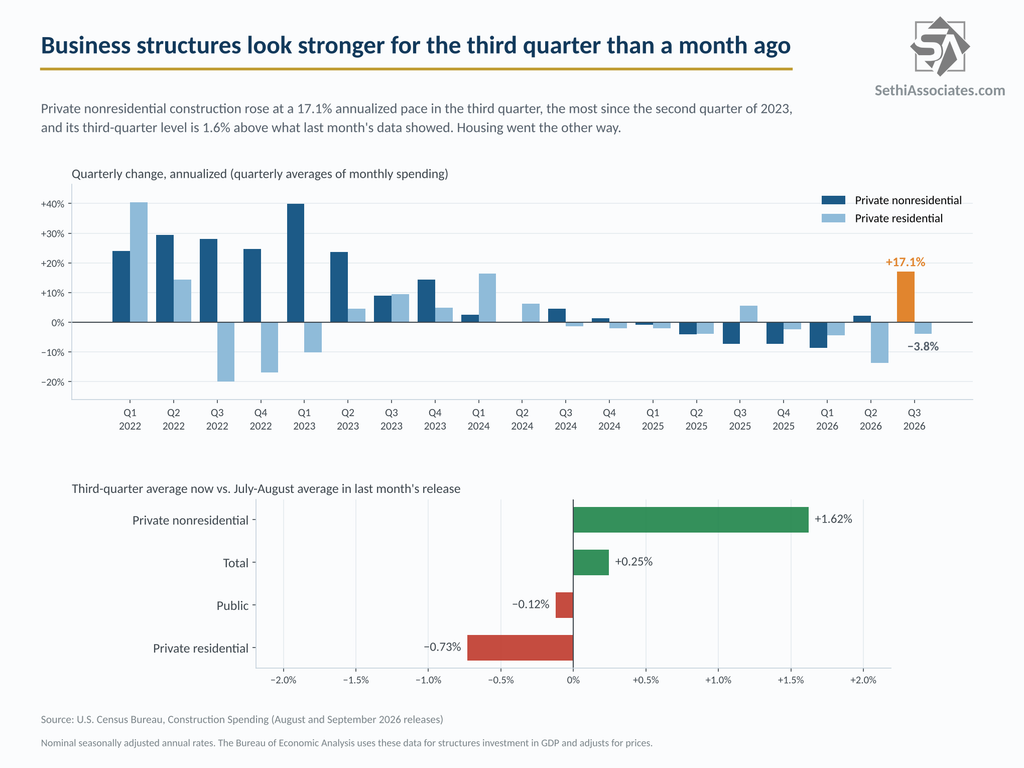
Construction spending comes in to GDP through the Bureau of Economic Analysis’s estimates of structures investment according to the Census Bureau. The September data point to a small upward revision to third-quarter GDP, about 0.1 percentage point, all from business structures. September’s record remodeling drop shouldn’t hit GDP directly, because BEA estimates home improvements from its own indicators, such as remodelers’ payrolls, rather than the Census figure.
What to Watch
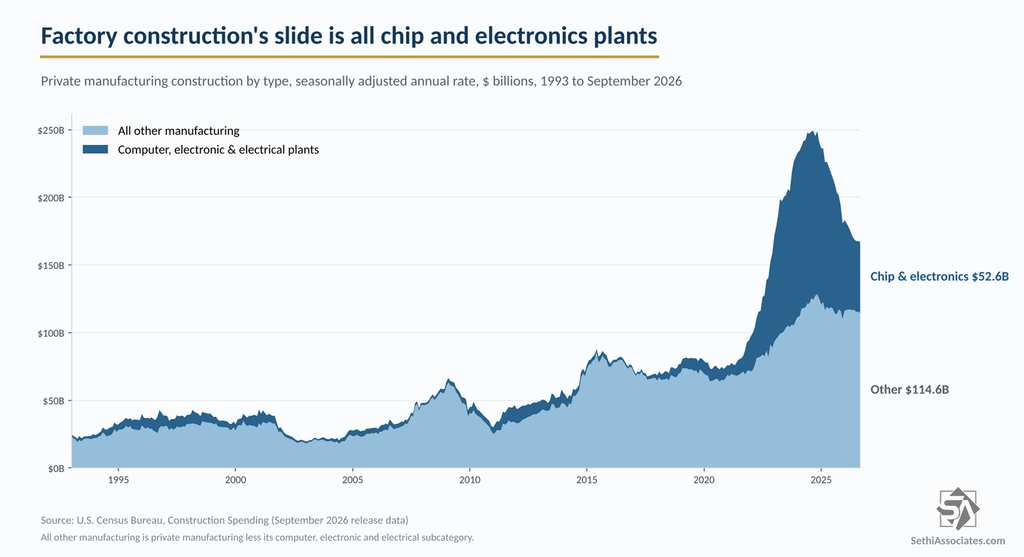
The October report on December 1 should show if that big drop in remodeling is revised away. Watch also whether data center spending keeps climbing at 8% or more a month and whether chip and electronics plant construction, which rose 0.97% in September for its best month since November 2024, has bottomed. That category is still down 41.71% from a year earlier and has pulled private manufacturing down for 8 straight months.
Public construction was little changed, slipping 0.05% in September, and is up 0.99% from a year earlier.
Charts are built from Census Bureau data. Census Bureau release | Census historical data