A Market Washout May Be Setting Up the Next Tradable Rally
Heavy selling in tech and semiconductor stocks is pushing sentiment and momentum indicators toward extremes that often precede powerful short-term rebounds.
You've reached your free article limit
You've read 0 of 1 free Pro articles.

Was it just the other day we discussed that seasonality doesn’t always work? Then, of course, the S&P rallied 120 points yesterday just to prove that statistic about Halloween rallies correct by making the S&P up ten points over that one-week period. Can you understand why seasonality is not my thing? That was a lot of angst for ten points.
I have often wondered if folks are not turning terribly bearish now because of the time of the year and that seasonality statistic about midterm years and rallies. I’m sure there is some of that going on.
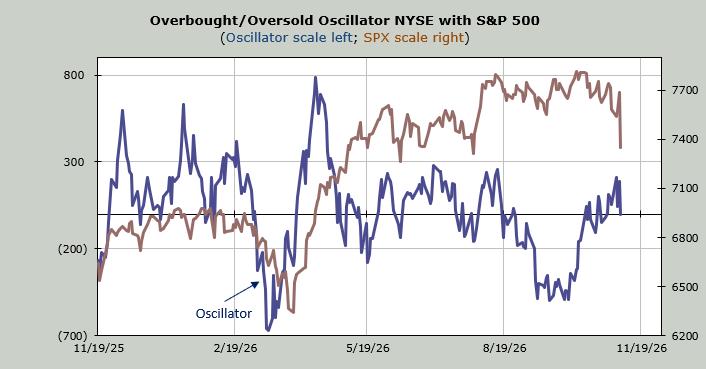
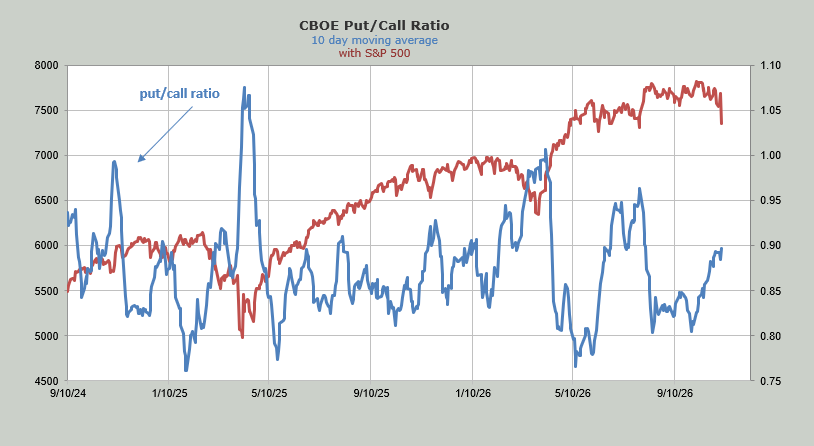
But we did have a change in sentiment on Thursday. The put/call ratio closed at 1.06, which is the highest reading since late July. I will call that progress since it is the first day there were more puts than calls traded in more than three months. Of course, that came on the heels of Wednesday’s equity put/call ratio being the lowest at .44 in six weeks. Whiplash!
The ten-day moving average of the total put/call ratio did notch up, though, and is now fractionally under .90. Heck, a few more days and we might get this near .95!
But the real story of the day was the selling. There were 13 billion shares that traded on Nasdaq, and for once that had nothing to do with penny stocks trading a few billion shares each. The volume in the QQQs was 128 million shares. We have to go all the way back to the Tariff Tantrum of April 2025 to see that much volume traded.
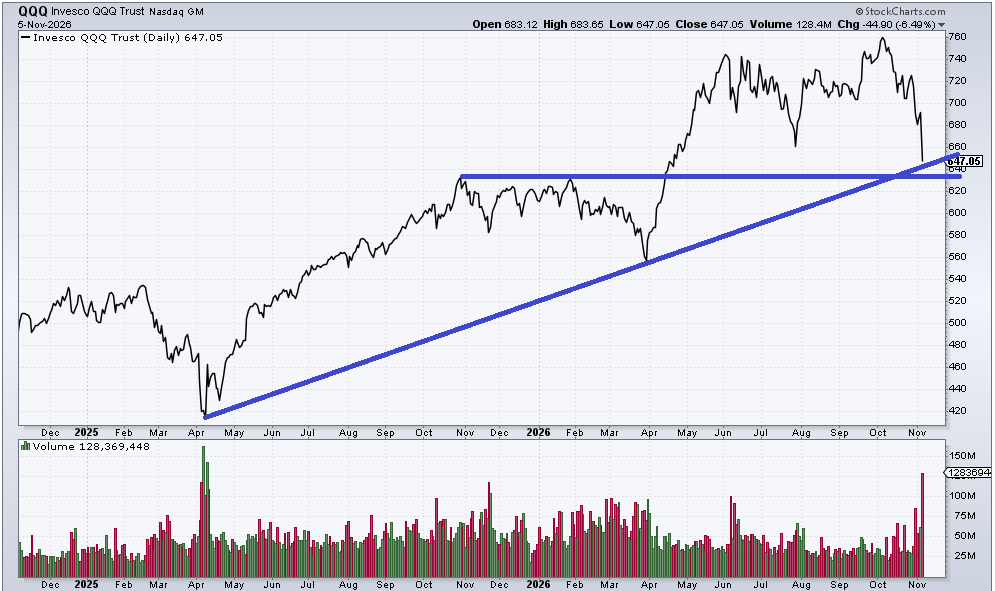
You will notice on the chart that I’m using closing prices and not the usual high-low-close. Close observers might also notice that this is an arithmetic chart rather than my usual logarithmic chart. On the log chart, that uptrend line has broken. The break is marginal, but it has broken, so I thought we’d have a different look using an arithmetic chart.
Either way, you can see the QQQs are coming into support in this 640 area. In times like this, I don’t much care about the price levels. I want to see the indicators. I want to see the statistics line up. Price is secondary to me. In fact, it is often better if it breaks price because that helps change the sentiment.
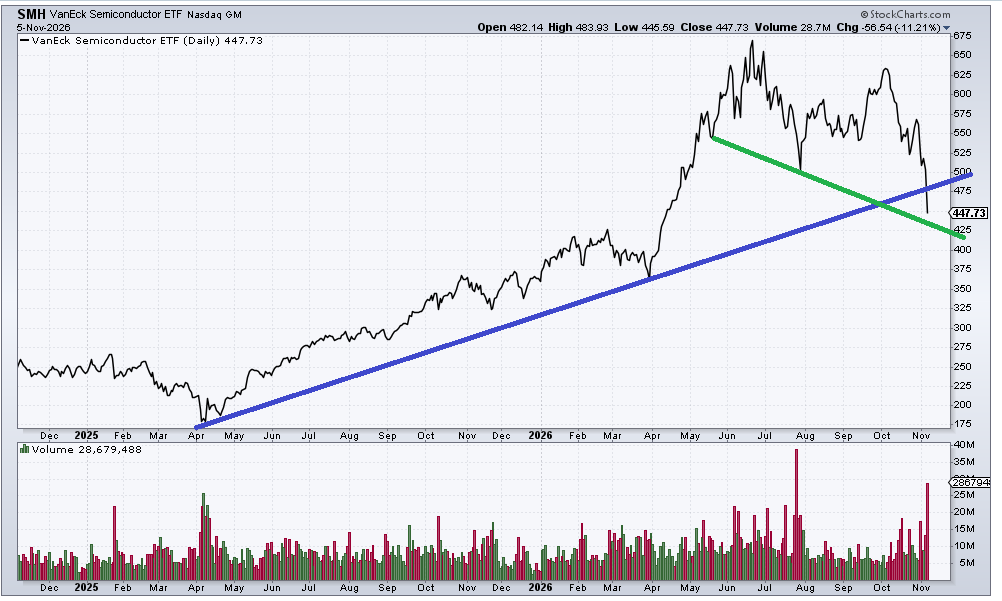
The SMH also traded a lot of volume. Not nearly as much as it traded in July, but that was extraordinary. It did break the uptrend line. But it hasn’t yet tagged the green line. For me, it’s the volume, though, as panic selling should lead to an oversold rally. I have not updated the chart against the Sentiment Cycle, but I will do so over the weekend. Remember that we were at Overt Warning (or so I thought) earlier this week, and the next spot on the chart would be heading into Panic.
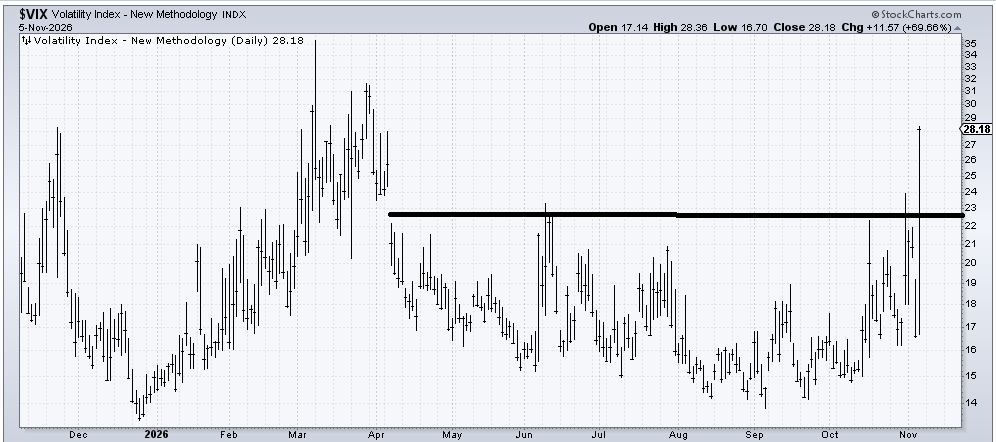
Then there is the VIX. I wanted it to break out and look jumpy, and it finally has done so. I typically like more than one day of jumpiness, but at least this is on its way.
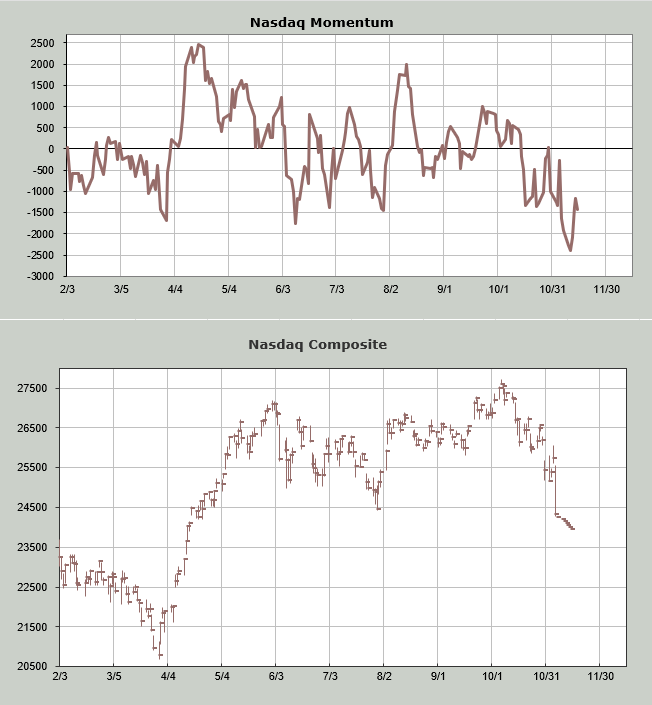
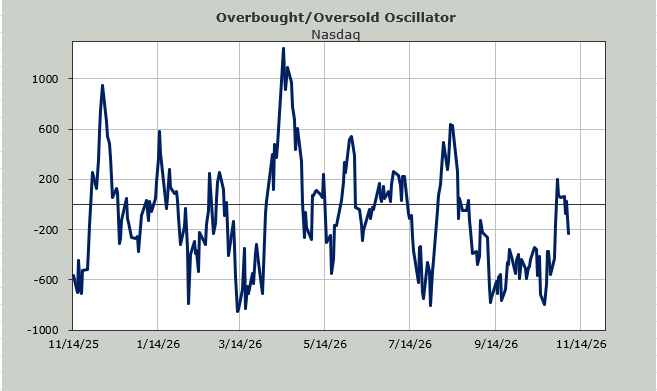
I will end by showing you the Nasdaq Momentum Indicator. This is an Overbought/Oversold Oscillator where I use price instead of breadth. I walk price down until I find the day that the Momentum Indicator goes up, even if price goes down. That is when we are at an oversold condition.
This is not meant to find the exact day but the general time frame. This turns upward Tuesday next week. As I said the other day, I thought we would be back to oversold sometime next week, and now we at least have some of the other indicators with the potential to line up too.
Finally, I should note I think we’re only talking about an oversold rally at this point. But it ought to be tradable.