Are Investors Still Complacent?
The Either/Or market came to a screaming halt Thursday, but what do the indicators say about investor sentiment?
You've reached your free article limit
You've read 0 of 1 free Pro articles.
The Market
As someone who has been dying to get rid of the complacency and the Either/Or Market, I should be careful what I ask for. We surely got rid of the Either/Or Market today (that goes on the positive side of the ledger). But did we get rid of complacency?
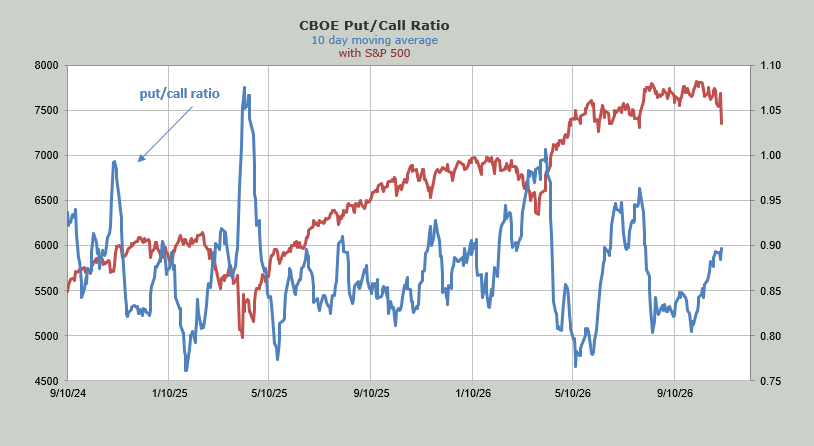
We are on our way, I think. For starters, the put/call ratio chimed in over 1.0 for the first time since late July. The ten-day moving average (chart shown below) ticked up a notch. Boy, would it be helpful if we had a few more days of high readings (regardless of what the market does).
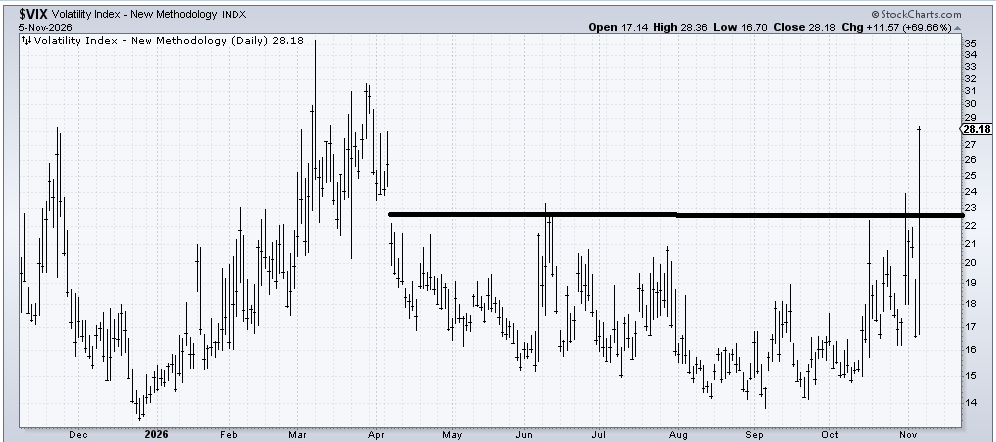
Then there is the VIX. I have asked for it to get jumpy, and I would say today was a great start. Is today enough? Maybe, but I typically like it to be more than one day just because the first day folks tend to be more in shock than anything else.
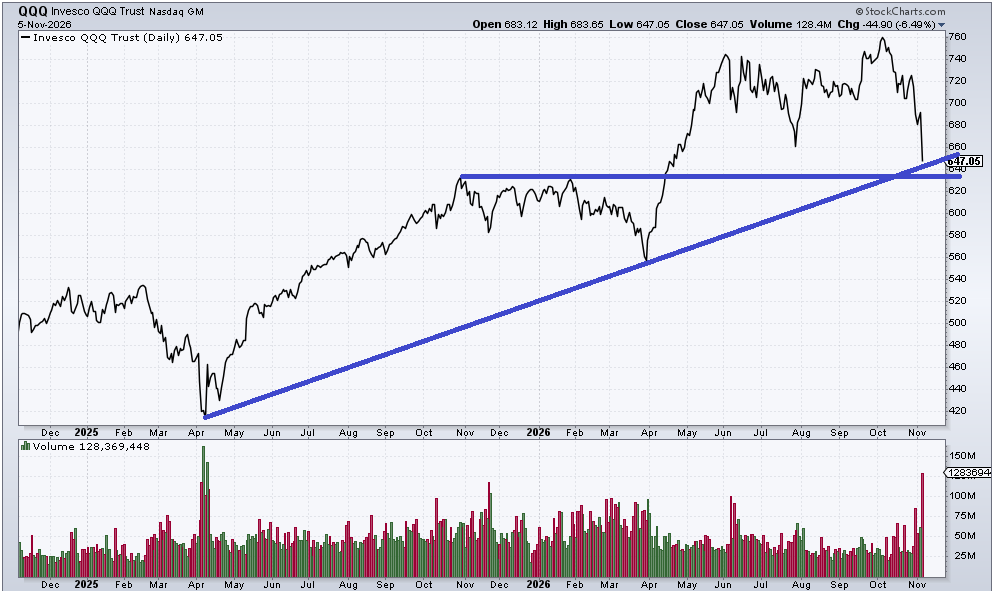
I have asked for the volume in the QQQs to fly over 100 million shares, and today we saw 128 million shares. That is the highest reading since the Tariff Tantrum in April 2025. If you are wondering why I am showing a chart that has just closing prices of the QQQs instead of the usual High-Low-Close, that is because this is also not a logarithmic chart (also what I typically use); it is arithmetic. The arithmetic chart shows we are just about at an uptrend line dating back to that Tariff Tantrum low, connected to the War Low. And it happens to come in at the tops of the highs we broke out from in April this year.
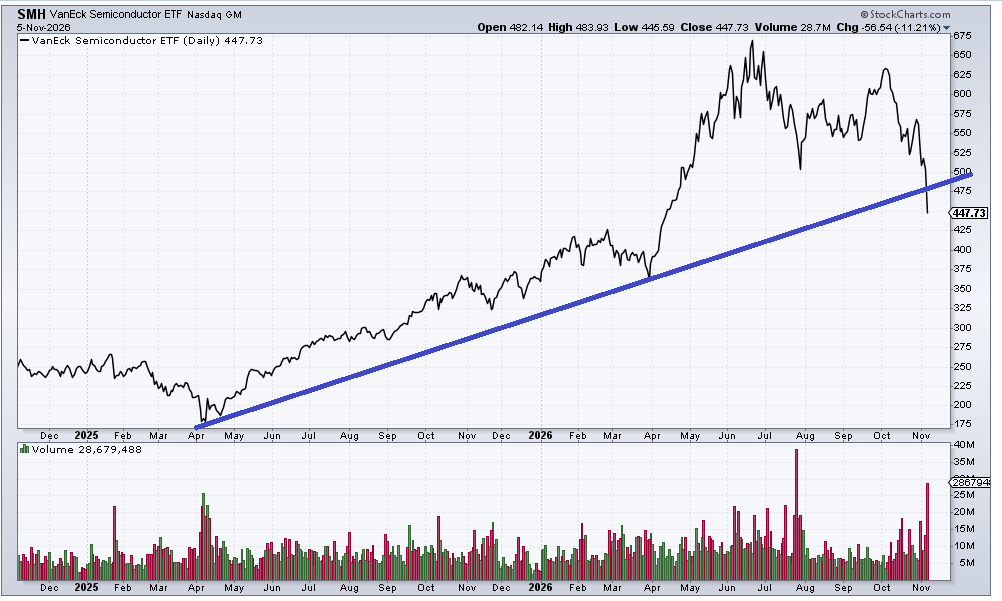
When I draw in the same line on SMH (or the SOX), it has broken. But look at the volume on SMH. It is not quite the screaming high volume as we had in late July, but it too is finally getting up there.
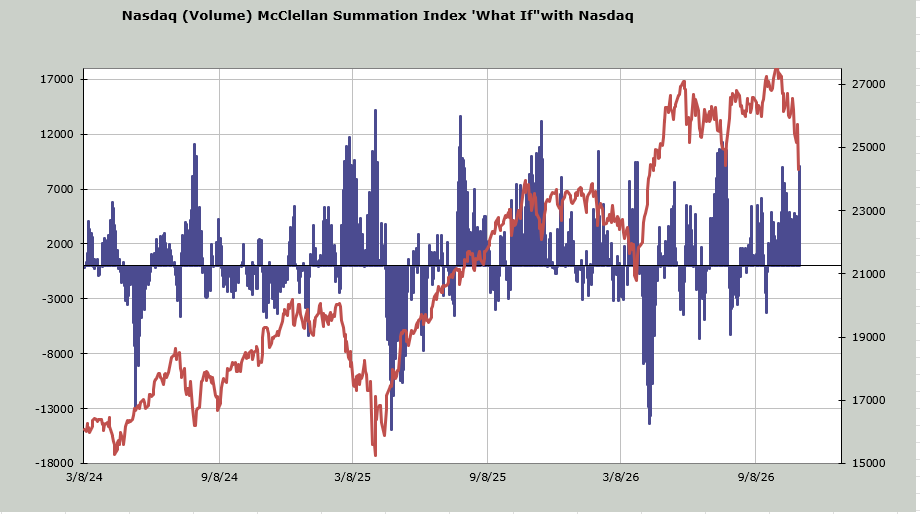
Then there is the ‘what if’ for the Nasdaq McClellan Summation Index, where I use volume. It currently requires a net differential of +9.1 billion shares to halt the decline. That means up minus down volume would have to equal or surpass +9.1 billion shares for the indicator to stop going down. In my experience, when this gets over +10k billion shares or even a bit higher, Nasdaq is very oversold.
This brings me to the Nasdaq Momentum Indicator. We discussed this earlier in the week when I said I thought the market could rally Wednesday/Thursday and then come down again. I plugged in lower closes for Nasdaq over the next week, and the indicator stops going down and heads upward on Tuesday of next week. As a reminder, the exact day is not what I would focus on, but the general time frame. When the indicator goes up and price goes down, it is a sign of short-term oversoldness.
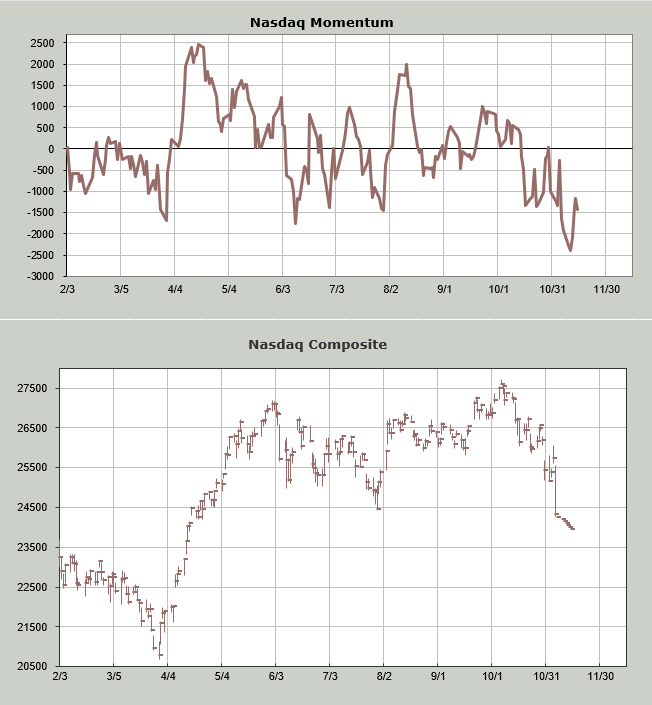
This is the part where it gets a bit tricky. I can see the ingredients for an oversold rally developing, but I don’t want to be too early, so over the next few days I will simply be on the lookout for this to develop. I should end by noting I don’t think we’re talking about more than a trading rally at this point because the number of stocks making new lows on Nasdaq got to 850 this week, and that needs to dry up. And today saw only 83% of the volume on the downside. I would love that to get to 90%.
New Ideas
If I delve into the oversold condition, it will be to buy an index like the QQQs or SPY. For a trade.
Today’s Indicator
The ten-day moving average of the put/call ratio is discussed above. I’d like to see it higher.
Q&A/Reader’s Feedback
Helene welcomes your questions about Top Stocks and her charting strategy and techniques. Please send an email directly to Helene with your questions. However, please remember that TheStreet.com Top Stocks is not intended to provide personalized investment advice. Email Helene here.
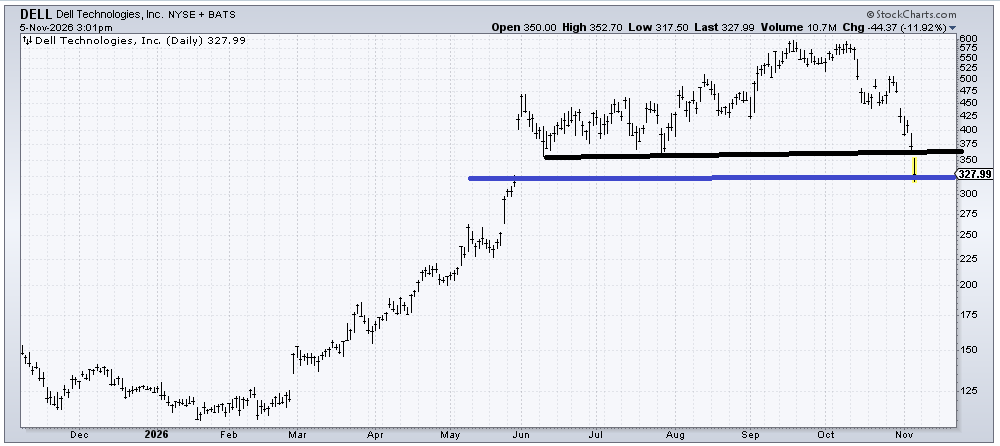
Dell (DELL) should bounce off this blue line area (325) because it is filling the gap, but that top it broke down from (black line) looks like a top to me. If it rallies to that 350-360 area, I’d take my profits from the trade and go.
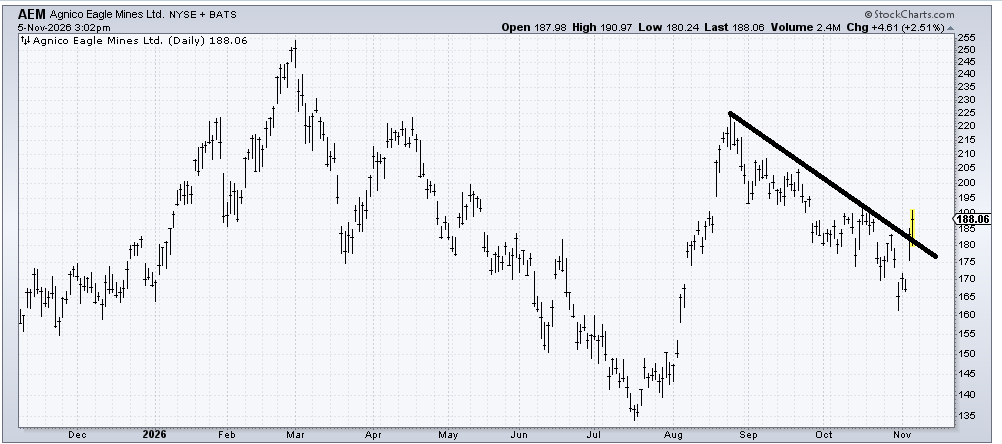
Agnico Eagle Mines (AEM) is a gold stock that finally crossed that downtrend line. I think it’s a little overbought up here, so if it dips into that 180 area, I’d buy it.
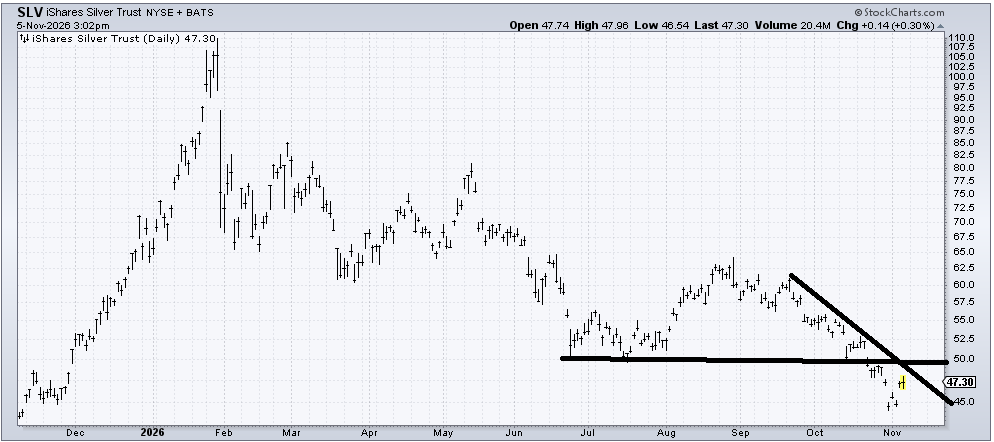
I continue to think SLV had a bubble that popped in January. Is it oversold enough to bounce from here? Yes. Maybe into the 50-52 area.
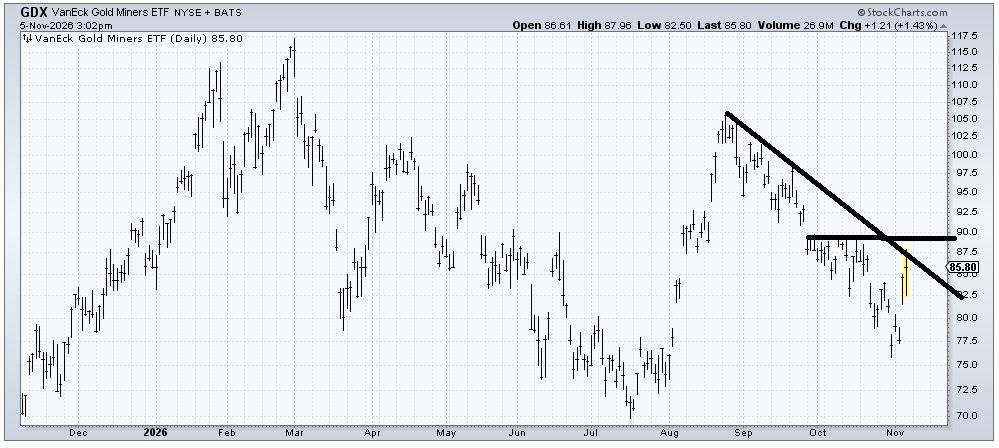
GDX is an ETF to be long gold stocks. Again, I am a fan of GLD now, but this has a lot of resistance from here to 90, so it could use a bit more work to eat through the resistance. If it can’t get over 90 in the next month, I’d give up on it.
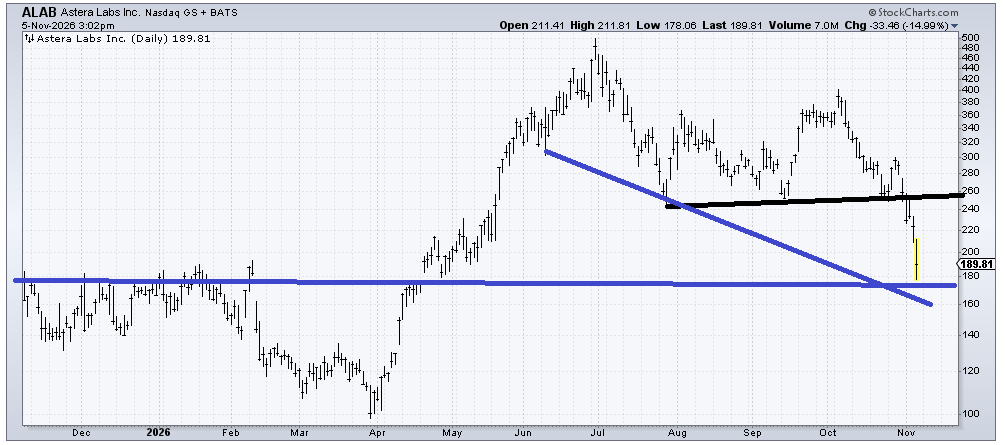
Astera Labs (ALAB) has support at that blue line area (175-180). I suspect we see a bounce in the coming days. But resistance now looms overhead in that 240-260 area.
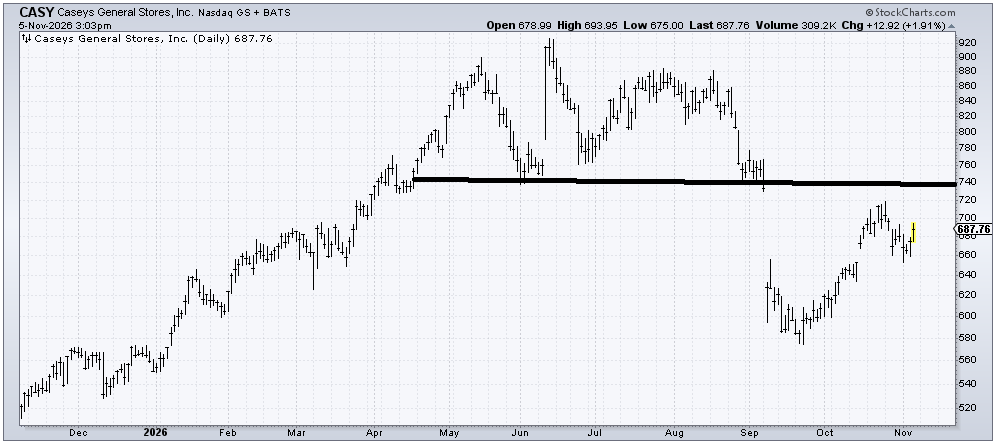
Casey’s General Store (CASY) might fill that gap up above around 740, but I’d like to see it come down in the next few weeks to test that 600 area since that would seem like a good retest. So, on a rally near 740, I’m a seller, and in the 600 area I’m a buyer.