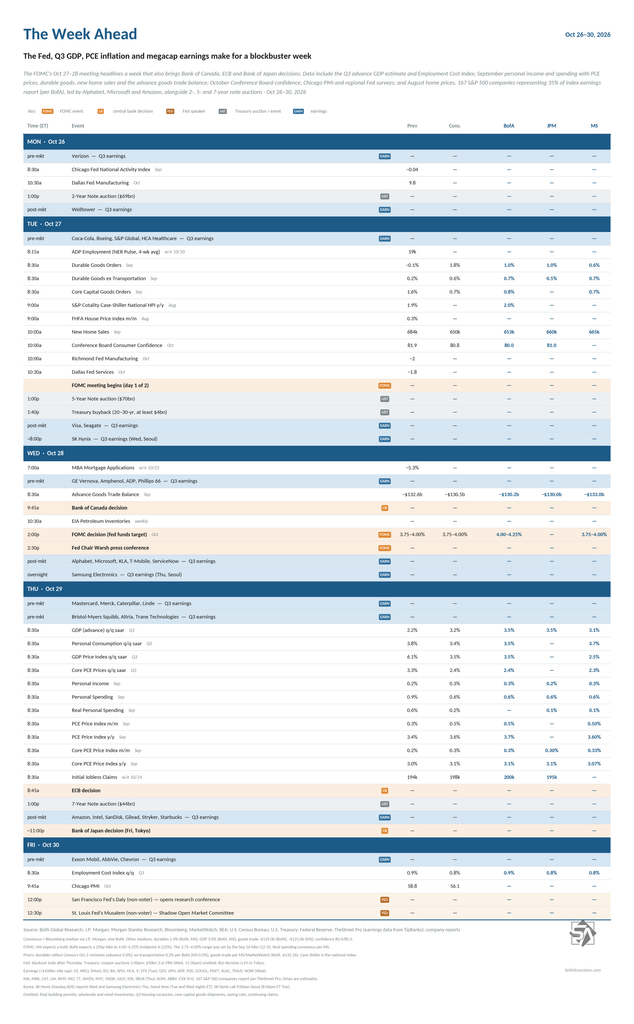
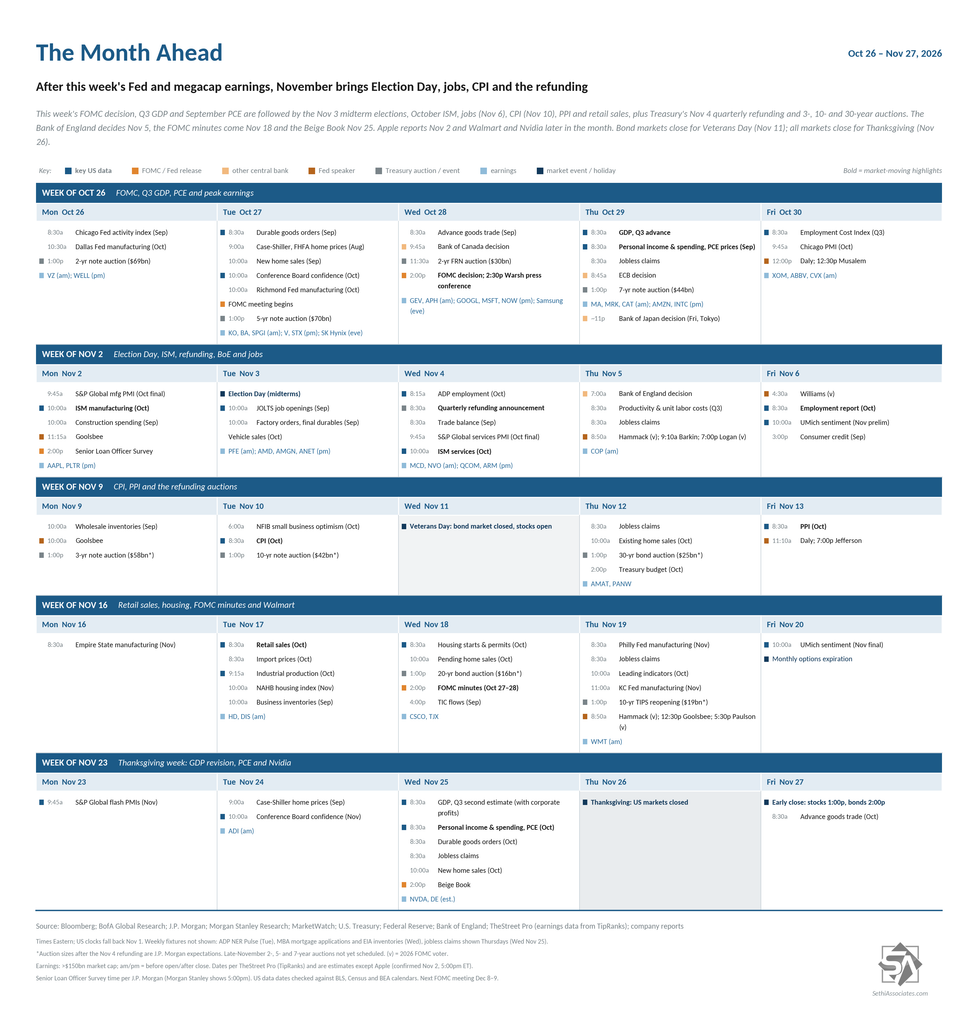
It’s a big week for US economic data, headlined by the advance estimate of Q3 GDP which will also include the September personal income and spending data. Accompanying both those reports will be PCE prices, the Fed’s preferred inflation metric. Other September reports include durable goods orders, new home sales, the advance goods trade balance and the Chicago Fed National Activity Index.
October reports include Conference Board consumer confidence, the Chicago PMI, and the Dallas Fed and Richmond Fed manufacturing surveys. For August, we get the S&P Cotality Case-Shiller and FHFA home price indexes. For Q3 we also get the Employment Cost Index (the Fed’s preferred wage inflation index), and we’ll also get the usual weekly reports (ADP, mortgage applications, unemployment claims, etc.).
The FOMC meets October 27–28, with the decision Wednesday at 2pm ET followed by Chair Warsh’s press conference at 2.30pm. The decision is either going to be a yawner (if they hold and Warsh gives his now familiar spiel about too high inflation, no forward guidance, etc.) or a shocker (if they either hike or Warsh changes tack and starts giving more forward-looking guidance about the path for rates or perhaps breaks some news on any of the five “task forces” – remember there’s no updated Summary of Economic Projections this meeting). In terms of other speakers, the blackout period ends Friday morning, with San Francisco Fed President Daly and St. Louis Fed President Musalem already on the schedule for later that day. Notably, it’s not just the Fed but fellow G-7 central banks in the Bank of Canada (Wednesday), ECB (Thursday) and Bank of Japan (Friday in Tokyo) also announcing decisions.
Non-Bill (>1yr in maturity) US Treasury auctionsalso pick up with a trio made up of $69bn of 2-year notes Monday, $70bn of 5-year notes Tuesday and $44bn of 7-year notes Thursday.
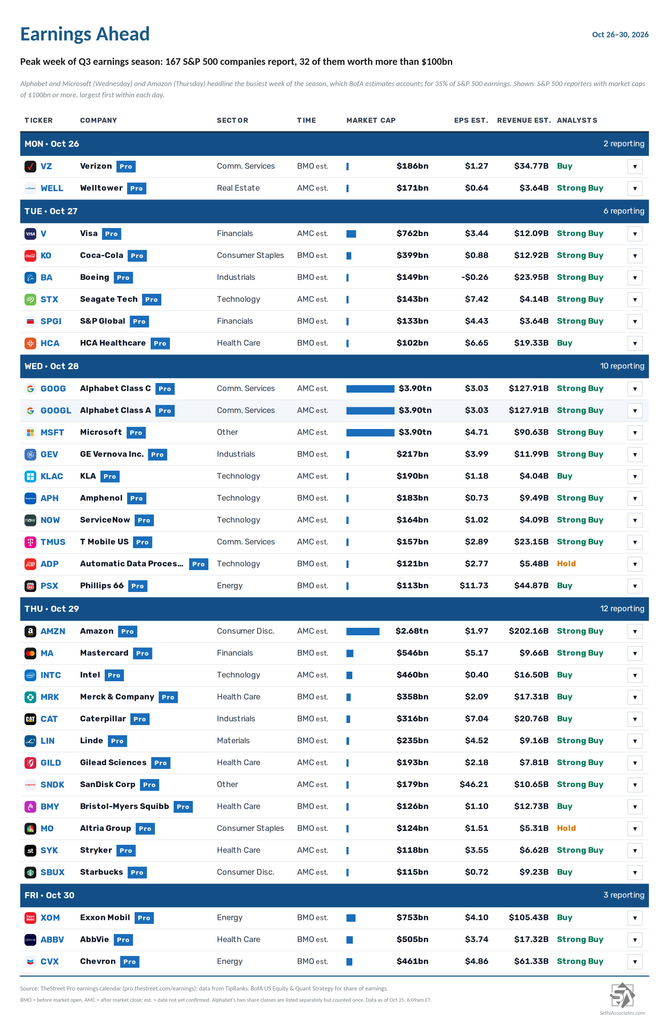
Meanwhile, Q3 earnings season hits its peak with 168 S&P 500 components reporting (35% of index earnings according to BofA), 33 of them with market caps over $100bn:
Friday: Exxon Mobil (XOM), AbbVie (ABBV) and Chevron (CVX)
Outside the US we’ll get earnings from Korean heavyweights SK Hynix (SKHY) and Samsung Electronics (SSNLF) giving further AI datapoints and non-Tech reads from European bellwethers Novartis (NVS), AstraZeneca (AZN), Sanofi (SNY), Shell (SHEL), TotalEnergies (TTE), BP (BP), Porsche (POAHY), Mercedes-Benz (MBGYY), and Volkswagen (VWAGY).
Ex-US highlights from Deutsche Bank:
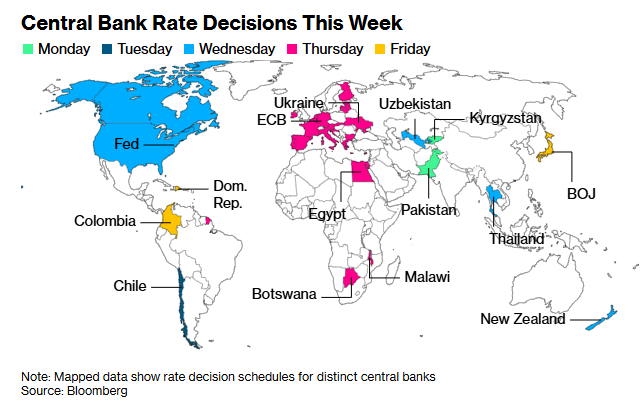
The week ahead features a busy calendar of central bank decisions, led by the Fed on Wednesday. Our US economists expect rates to remain unchanged. The Bank of Canada and the Reserve Bank of New Zealand will also announce policy decisions that day.
The ECB follows on Thursday, with our economists expecting policy rates to remain unchanged. It will also release its bank lending survey on Tuesday. The Bank of Japan rounds out the week on Friday, when our Chief Japan Economist also expects a hold.
In European data, the focus will be on Friday’s flash October CPI releases for the euro area, including Germany, France, and Italy. Our economists forecast year-over-year inflation of 2.92% in Germany, 3.58% in France, and 4.95% in Italy. Friday also brings preliminary Q3 GDP figures for key member economies and the euro area as a whole. Germany will publish its October Ifo survey on Monday and November GfK consumer confidence on Wednesday. In the UK, the main event will be the Autumn Budget, which Chancellor Healey is scheduled to deliver on Wednesday.
Japan also has a busy economic calendar. Friday’s releases include October Tokyo CPI, along with September labour market and economic activity data.
Political events will also feature prominently. Brazil holds the second round of its presidential election this Sunday, followed by legislative elections in Israel on Tuesday. In China, the Central Committee’s plenum runs from Monday through Thursday. Other events include the EU–Canada summit on October 29–30 and the G20 foreign ministers’ meeting in Atlanta on October 30–31.
This post will go through in order (in case you want to skip around): the economy, the Fed and interest rates, earnings, valuations, breadth, positioning, sentiment, seasonality, and then my wrap-up.
The Economy Continues to Grow Above Trend
Looking first at the economy, my intro has remained the same since the start of the Iran conflict (and longer term, more or less all of the past five years – I’ve not had a recession probability above 40% since the pandemic): “we continue to see it weathering the various storms remarkably well due in large part to resilient consumption (boosted by huge increases in wealth over the past few years despite slowing incomes) and AI-spending… with data of late showing a stable (and perhaps accelerating) economy, but one that is also boosting inflation.”
As noted previously, while things tailed off in July into the start of August, since then we have seen economic momentum rebound outside of the housing sector. The caveat as mentioned three weeks ago is that nonfarm payroll growth stalled out (which though may simply be a function of a harsh seasonal adjustment), and we got a relatively weak personal income figure.
Last week was lighter on data and for the most part it remained consistent with the foregoing:
Initial jobless claims fell to the least since July, the 16th week below 200,000 since 1969, while continuing claims rose 25,000, the largest weekly increase since February, but remain near the least since April 2023.
ADP’s preliminary weekly hiring report for the four weeks ending October 3rd fell for the first time since mid-August but only after upward revisions to the prior two weeks took the prior week to the highest since early June. The 4-week moving average still rose to +80.7k, a seventh week of gains and the best since July 11th.
Housing starts fell to the lowest since May (which was the lowest since May 2020), below all estimates in a Bloomberg survey, while building permits slipped with single-family permits down the most since April 2025 to the lowest annualized pace since March 2023.
I had said two weeks ago, “the most concerning item to me at this point is wage growth, but so far that hasn’t dented consumer spending with the large gains in wealth from stock and home prices.” I can’t say that after the September retail sales number, but that’s just around one-third of consumer spending, so we’ll see what the full numbers bring at the end of the month. While many credit the AI-boom with carrying the economy, consumption was 68% of GDP in the first half of the year.
We’ll get that fuller picture on consumer spending, as well as the rest of the economy, this week.
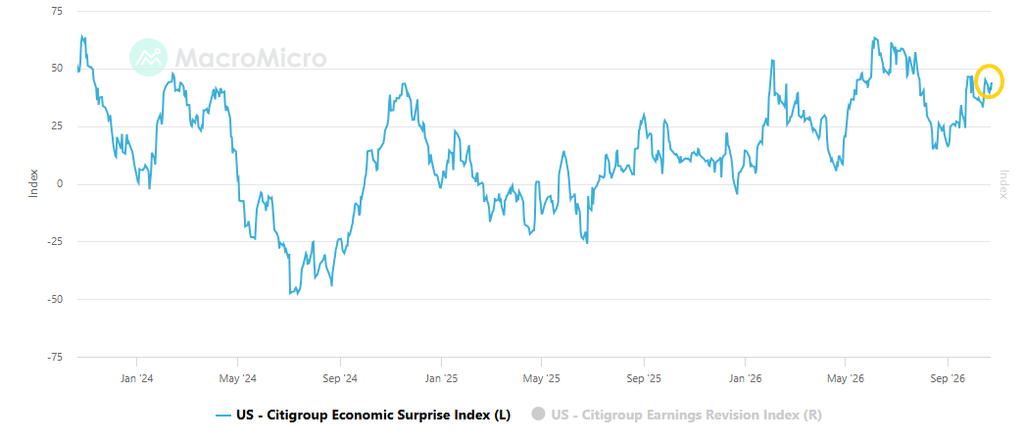
With the weak housing data the Citi economic surprise index eased back to 44.4 from 46.1 a week earlier,still much closer to the highs of the year than the lows.
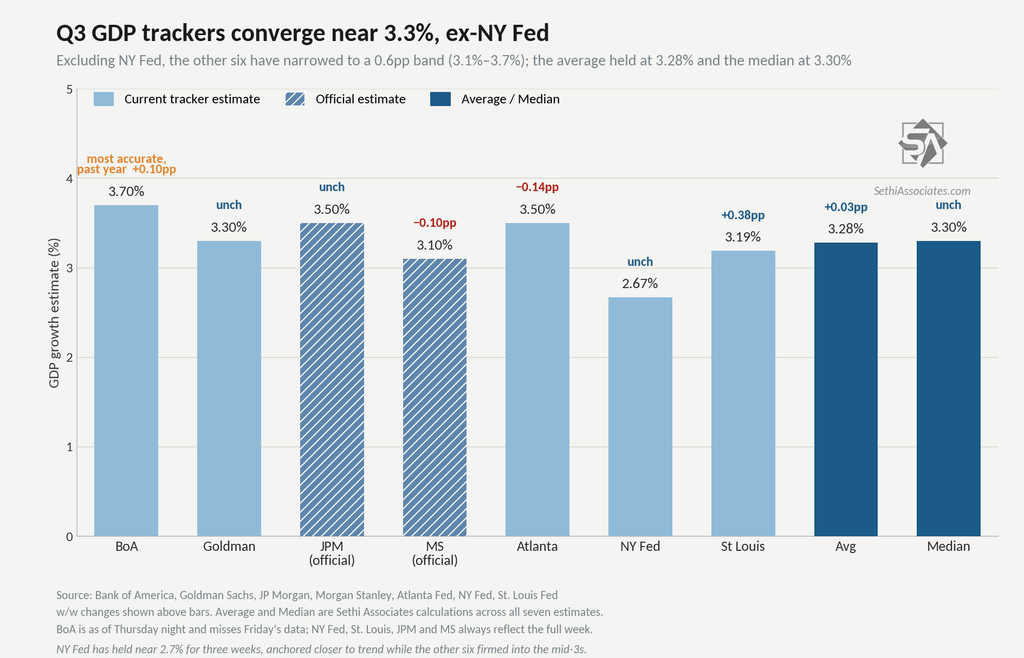
And Q3 GDP estimates were little changed outside of the St. Louis Fed which saw a healthy boost leaving just the NY Fed not expecting at least a 3.1% GDP result this week. The average moved to +3.28% from +3.25% the prior week, and the median remained at +3.30%, very strong growth.
BofA (who has been the most accurate over the past year) +3.7% (from +3.6% the prior week). Goldman +3.3% (from +3.3%) JPM +3.5% (+3.5%) Morgan Stanley +3.1% (+3.2%) Atlanta Fed +3.50% (from +3.64%) NY Fed +2.67% (+2.67%) St. Louis Fed +3.19% (+2.81%) Avg = +3.28% (from +3.25%) Median = +3.30% (from +3.30%)
Here’s MS on their thoughts on Q3 GDP and looking forward:
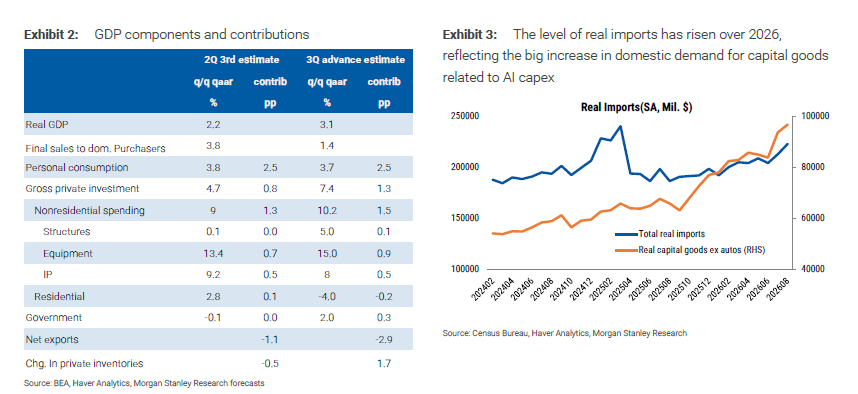
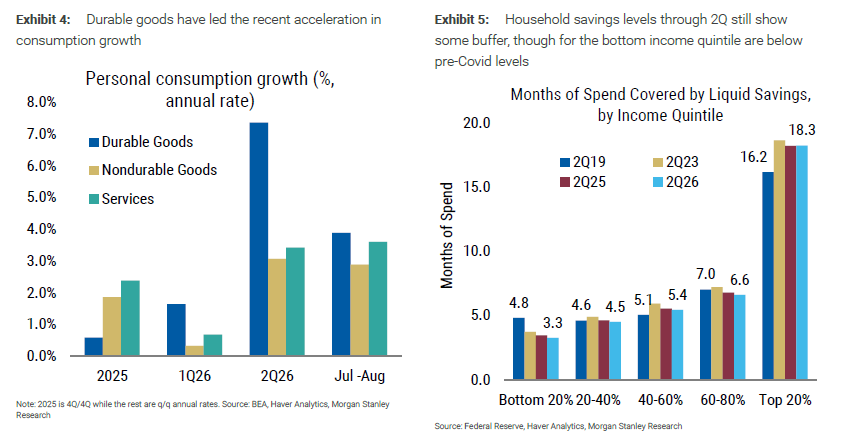
Next week’s advance estimate of third-quarter GDP will provide another data point. We expect a strong report… Business investment is robust, growing 10.2%, although, as we have noted, imports offset part of the contribution from AI capital spending. We estimate that net trade will subtract 2.9 percentage points from quarterly growth, while inventories add 1.7 percentage points. The main story, in our view, is consumption, which we are tracking at a robust 3.7% growth rate. … Some of the strength in third-quarter consumer spending, however, may be more statistical than real. Residual seasonality in inflation means that inflation tends to be higher in the first quarter, mechanically weighing on real consumption growth. This effect reverses over the rest of the year…. Looking at the four-quarter change helps smooth out these seasonal distortions. Even our forecast of 3.7% annualized consumption growth in the third quarter, following a 3.8% increase in the second, implies year-over-year growth of 2.6%—solid, but not exceptionally strong …. We see several headwinds that should moderate consumer spending as we look ahead to 2027. High inflation continues to weigh on real income growth…. As a result, the saving rate is at its lowest level since 2022. Although recent wealth gains justify this low saving rate in our models, we think there is limited room for further declines. Liquid savings measured in months of spending have continued to fall for the lowest-income quintile (Exhibit 5).
Meanwhile, tax refunds have likely been spent, and interest rates have moved higher…. Cuts to entitlement spending under the OBBBA also become a larger drag on the economy over time. If the legislation is implemented as written, reductions to SNAP and Medicaid would make fiscal policy a slight drag on consumption next year. … The extent of the slowdown remains an open question. We forecast real consumption growth of 1.9% at a quarterly annualized rate in the fourth quarter and 1.5% in the first quarter, with most of the slowdown coming from goods…. If consumption growth moderates as we expect, the Fed can continue to recalibrate policy to counter the second-round effects of higher oil prices. If it does not, a more aggressive hiking cycle may still be necessary.
And from JPM (Feroli):
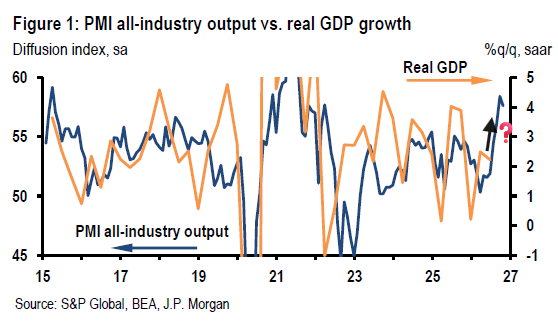
The pattern of recent months continued this week: economic data were mostly solid, with housing the notable exception, while price pressures continued to build, as reflected in both the flash PMIs and rising oil prices. As in September, the strong flash PMIs (Figure 1) point to GDP growth above 4%—well above our 1.75% fourth-quarter forecast—suggesting some upside risk.
The employment signal also remained strong, with the all-industry employment index posting its second-highest reading in more than four years and manufacturing employment growth reaching its fastest pace since March 2012. These readings are consistent with the upbeat signal from jobless claims and our forecast for payroll growth to strengthen into 2027.
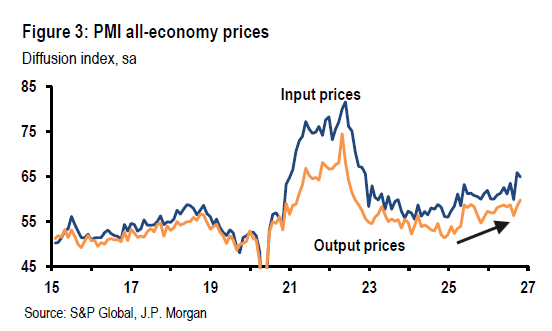
But Feroli also flagged that strong growth is pushing up prices
Input costs remained elevated amid higher energy, transportation, raw-material, and labor costs, while output price inflation accelerated to its highest level since August 2022. Manufacturing supplier delivery times also lengthened by the most since 2022, and backlogs continued to rise as strong demand strained firms’ operating capacity.
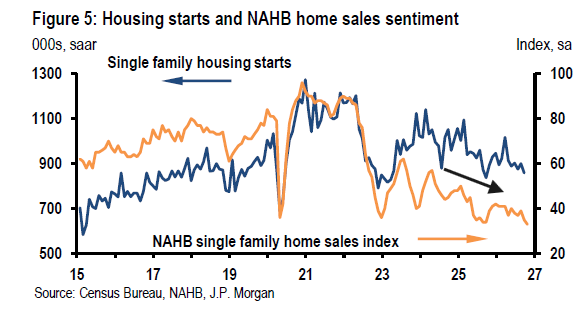
And also consistent with my commentary this year, Feroli notes housing remains a drag:
This week’s slate of housing data pointed to a further deterioration in activity across one of the economy’s most interest-rate-sensitive sectors. Taken together, the latest data indicate that residential investment will likely remain a drag on growth into year-end, with weakness late in 3Q leaving the sector on a soft footing heading into 4Q.
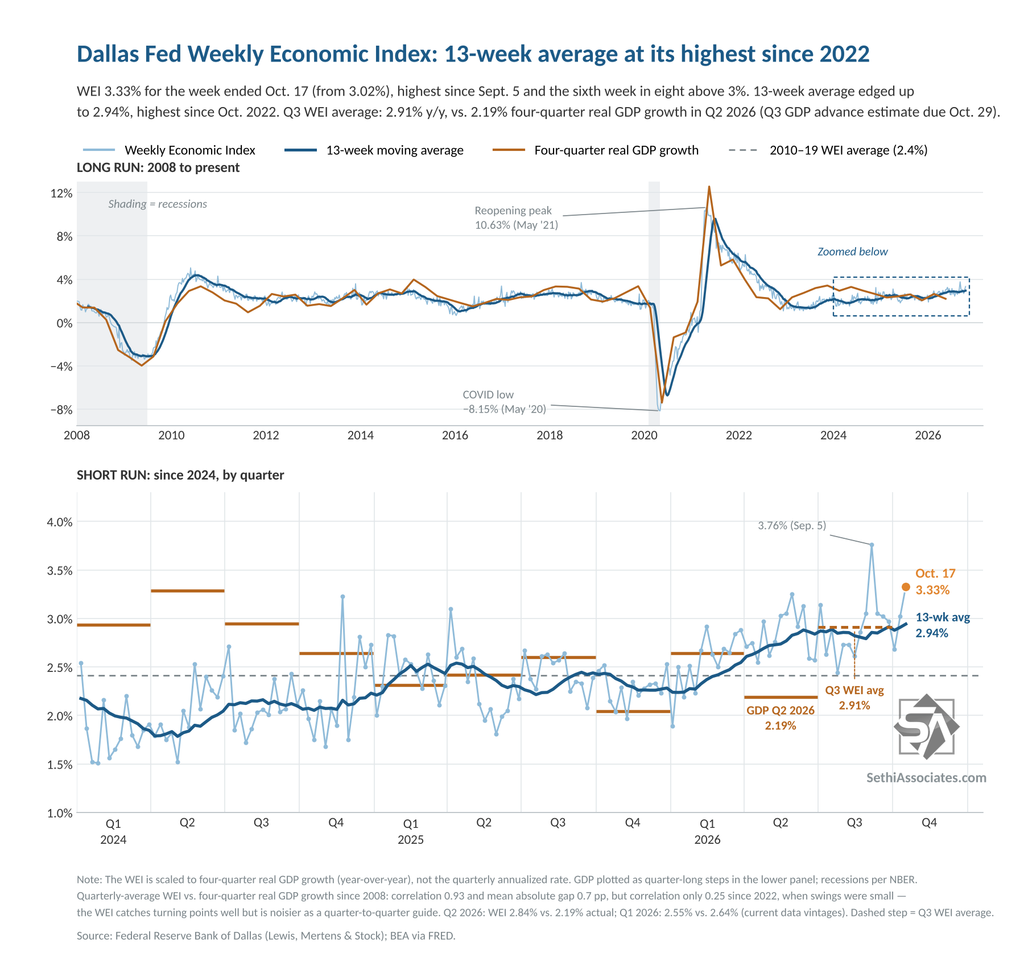
And as you know if you’re a regular reader, one of my favorite GDP trackers is theWeekly Economic Index from the Dallas Fed.*
In the week through October 17th (so doesn’t have last week’s data) it extended further over 3% to +3.33% from +3.02% the prior week (as revised), the sixth week in eight over 3% and the highest reading since the week of September 5th (+3.76%).
More importantly, the 13-week average also edged up to 2.94%, the best since October 2022, continuing to evidence economic momentum that is above trend (the 2010–19 average was 2.4%). For Q3 it averaged +2.91% y/y, which would be the strongest y/y GDP growth since Q3 2024, ahead of Thursday’s first estimate.
*The WEI is scaled as a y/y rise for real GDP (so different than most GDP trackers which are Q/Q SAAR) and uses 10 daily and weekly economic series but runs a week behind other GDP trackers.
It has over time tracked actual GDP closely (a 0.92 correlation since 2008, see chart) although for Q2 it came in high predicting +2.80% y/y GDP growth vs the actual first estimate of +2.10%, while for Q1 it predicted +2.48% vs 2.66%. More importantly, it has consistently indicated no recession and relatively healthy growth since the pandemic (which is what we’ve experienced), never dipping below +1% since 2021.
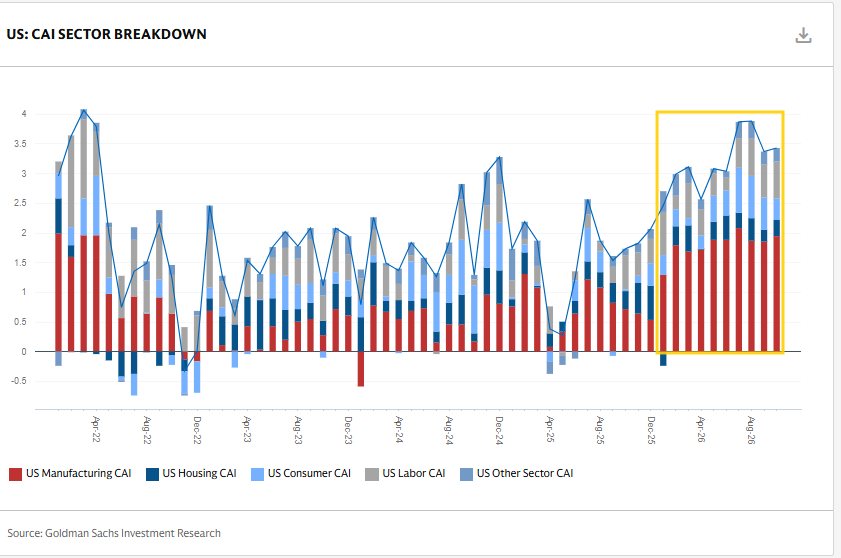
Goldman raised their October US Current Activity Indicator* a tenth to 3.4% but downgraded September a tenth to 3.3% down from the post-2022 peak of 3.9% in July and August. “Still, it’s the strongest 10-month stretch since early 2022.
*The CAI is their “real-time measure of inflation-adjusted economic momentum using 37 inputs.”
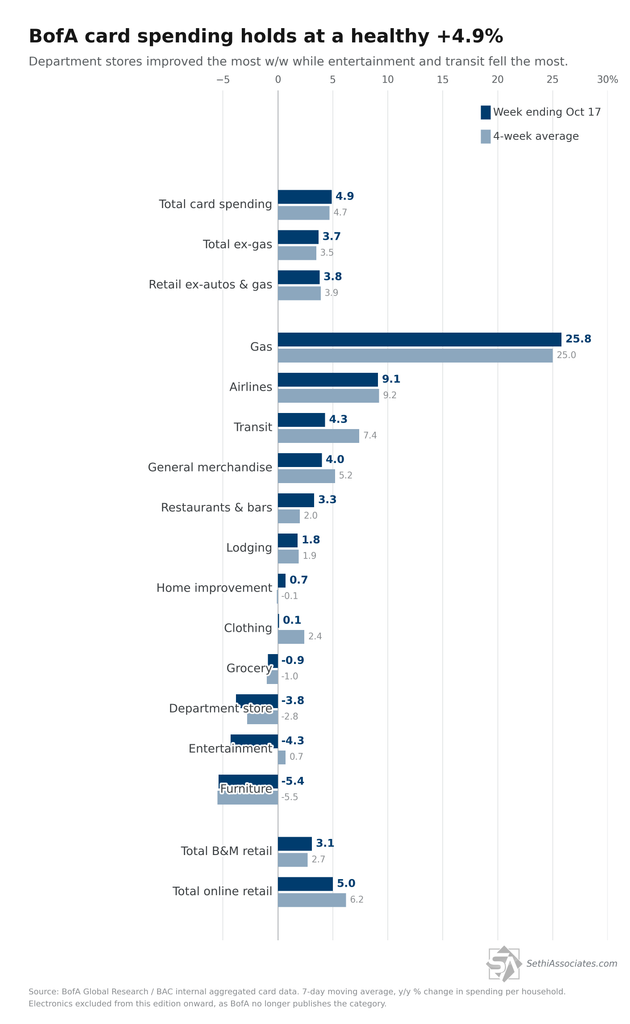
BofA card spending (credit+debit) came in at a healthy +4.9% versus the year-ago period (y/y) in the week ending October 17th, easing slightly from +5.1% the prior week. Ex-gasoline and autos spending growth though fell more to +3.8% y/y from +4.6%, which leaves October’s two full weeks averaging +4.2%, below the roughly +5.5% pace of late September.
Ex-autos and gasoline +3.8% y/y (+3.9% four-week moving average)
The headline was steady, but the mix shifted. Department store spending growth improved the most week over week, while entertainment saw the largest decline. On the income split, BofA again noted that lower-income spending growth has consistently outpaced higher-income over the past several weeks.
Gasoline rose to +25.8% y/y (from +25.1%), still elevated versus a year earlier.
Among categories, airlines (+9.1%, from +10.3%) remained the strongest outside of gas, and restaurants & bars firmed to +3.3% from +2.4%. Transit gave back most of the prior week’s jump, falling to +4.3% from +10.9%. Online retail eased to +5.0% from +7.7%, and general merchandise (+4.0%, from +5.7%) and clothing (+0.1%, from +2.7%) also softened.
Four categories were negative y/y, up from three the prior week: furniture (−5.4%), entertainment (−4.3%, from +3.4%), department stores (−3.8%, improved from −5.1%), and grocery (−0.9%).
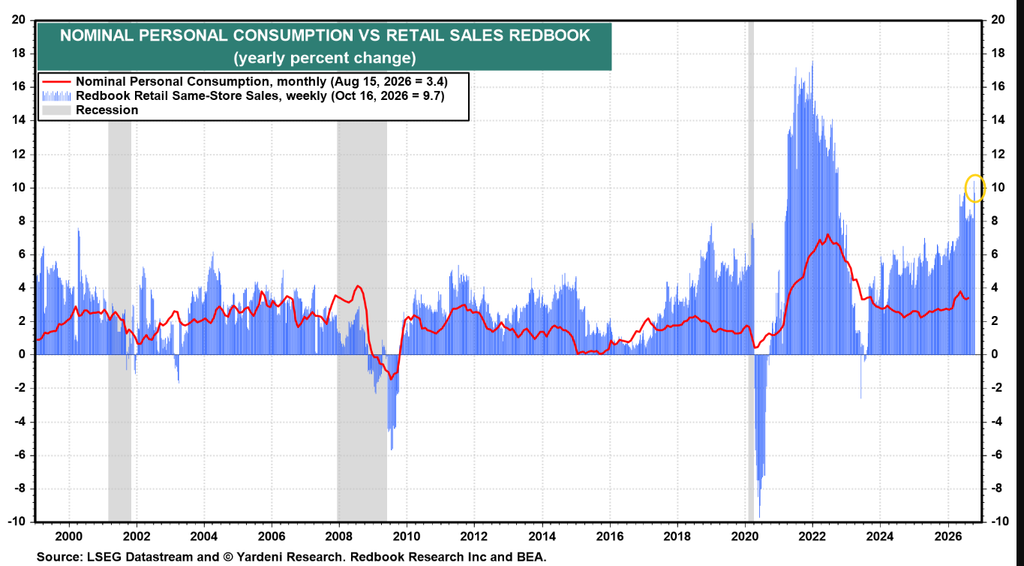
Redbook sales* in the week of October 16th decelerated but remained very healthy at +9.7% y/y growth, after hitting +10.4% the prior week, which was the best since 2022, well above the 2025 average of +5.8% y/y.
*Redbook sales are same-store sales across a panel of large general-merchandise retailers, such as department stores, discount chains, apparel retailers, drugstores, and warehouse clubs.
Goldman is also optimistic about consumption:
Official spending data implies a resilient consumer. Although core retail sales increased by only 0.1% in nominal and declined by 0.1% in real terms in September, this mostly reflects a normalization from a 1.2% nominal and 1.1% real growth pace in August. Furthermore, real PCE spending remains robust, with the August personal spending report showing 2.6% real spending growth on a year-over-year and 3.9% growth on a 6-month annualized basis [we’ll get an update on that this week].
And while a small share of the strength in recent spending data can be attributed to election-related spending by nonprofits (which is counted in the official PCE spending data), and we expect higher energy prices will soften real spending growth to 1.5% in 2026Q4 (qoq annualized), we have become less concerned about a significant slowdown in spending growth given its continued resilience. We forecast near-potential spending growth of 2.3% in 2026 and 2.1% in 2027 on Q4/Q4 bases.
A Snoozer or a Shocker?
Turning to interest rates and the Fed, a little history as to how we got here. I had noted three weeks ago that “the center had spoken”:
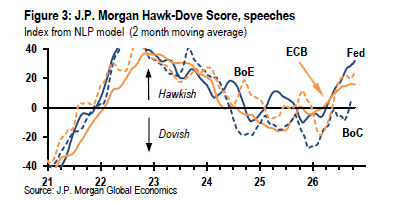
we saw two key Fed members come out Tuesday (NY Fed President Williams) and Thursday (Vice-Chair Jefferson) making it clear that the core of the Fed (which is comprised of typically the Chair, Vice-Chair and NY Fed President and also almost certainly includes Powell, so a third of the FOMC) sees “no need for urgency” for a rate hike.
It would be highly unusual for two such high profile Fed members to give such a speech without having cleared it with the Chair. In fact, I think it is not unlikely that they did it in close coordination to try to bring down the market probabilities on an October hike which had exceeded 70%.
Which I said was further confirmed by leading voice Governor Waller the week after:
As I mentioned in the Thursday update Waller said “I anticipate additional hikes to support a timelier return of inflation to our 2 percent goal. But there is some flexibility about when those hikes will occur. The hikes do not need to come at consecutive meetings, but they should be in place in an acceptable period of time.” This further confirmed October is off the table, but December is highly likely. See the Thursday report link above for more on Waller’s comments.
And then I mentioned Williams returned to “take some heat out of 2027 Fed rate hike expectations in an interview with Bloomberg News.”
Williams said if the outlook plays out as he expects, “it may be appropriate to have one more rate hike” this year, and he doesn’t see “any reason to believe that we would need to do more,” though he caveats that saying “we’ll have to see.” Note also though the “may” is still attached to the “one more rate hike”.
On the drivers of inflation: -Tariffs: the effects “mostly are in the rearview mirror.” -Energy: “the bigger story” for the near-term inflation outlook, and now passing through into core, with airfares “the most obvious example.” -AI: “the one that I’m watching the closest right now,” with “abrupt and large” price increases in AI-driven subsectors and “signs of some spillovers into labor costs in construction.”
But he noted underlying inflation measures “have clearly come down,” with the NY Fed’s multivariate trend inflation around 2.3% and the Dallas Fed trimmed mean around the same level over the last six months, and he expects overall inflation to be “near our 2% target for the year as a whole next year.”
On rates: -He thinks the neutral rate has moved up “a quarter to half a percentage point” from 2019, but the longer-run real neutral rate is still “around one percent or a little bit above” so “we’re not that far from neutral.” -On 10-year yields near 5%, he said he doesn’t like the phrase “the market’s doing our work for us,” adding “I also don’t like the word pause.” -Ahead of … CPI, he said he has no specific core print in mind: “I’d prefer low to high.”
“This is not an economy that is overheating overall.”
That saw rate hike expectations for 2027 fall to 50 basis points (two regular-sized hikes) from 61 prior to him speaking. But then came the inflation prints:
Headline consumer prices (CPI) rose 0.649% in September, just rounding down to the 0.6% expected, but still the most since March and core (excluding food and energy) rose 0.33%, the most since April, against the 0.2% expected. Only 11 of 73 economists in Bloomberg’s survey had forecast 0.3%.
And after PPI, import prices rose 1.13% in September, the most since May, above the 1.0% expected and were up 8.10% from a year earlier, the most since July 2022 as fuel prices rebounded and nonfuel import prices hit their highest annual rate since April 2022, with semiconductor prices posting an eighth straight record year-over-year gain.
But then as I mentioned last week “something nobody (outside of perhaps BofA’s derivatives team) saw coming happened. It all reversed. I’ve yet to find a conclusive answer, but the best one I’ve heard — and at this point the one that has been accepted by the zeitgeist — is that at the same time, the AI trade was cracking due to fears of the sustainability of the AI buildout. A material slowing in that would have ripple effects both through the wealth channel (equity gains have been fuel for spending given the slowing income gains as I’ve mentioned numerous times) and through the direct impact on AI-related purchases.”
Which left just Chair Warsh that Thursday night to change those expectations before entering the Fed’s blackout window. As I had said was likely in my preview, Warsh declined to do so, which firmed expectations for an October hold:
“We made very clear that we would deliver price stability, and we removed a dose of accommodation about a month ago,” Warsh said. “I don’t prejudge meetings. I don’t believe in saying now what I might do at the meetings that we have in the balance of this year.”
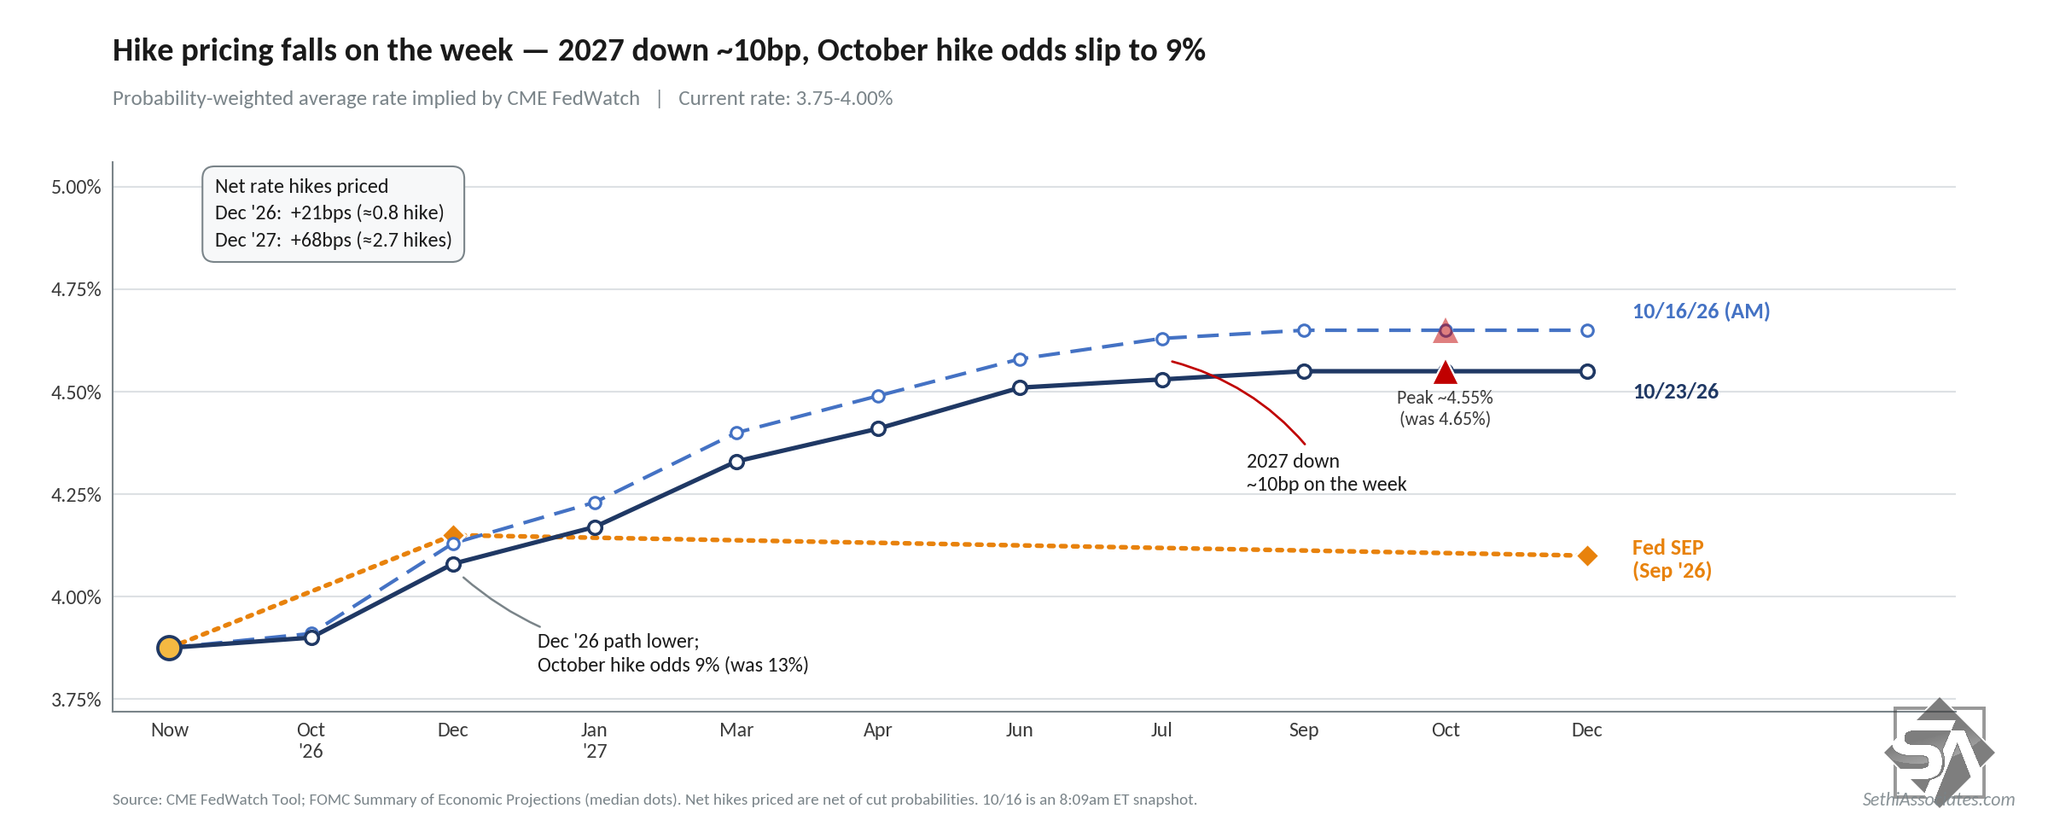
And with the AI trade continuing to crack last week we saw Fed rate hike expectations go with it ending Friday with “October now a 91% chance of a hold, and December a 78% chance of a hike. 2027 expectations see 68 basis points of total hikes priced through December next year. Those though are down notably from a week ago.”
The Fed has never hiked with less than a 10% chance priced into markets, so we’re either going to get the biggest surprise to markets the Fed has ever delivered (on par with the surprise 75 basis point hike in 2022) or a relative snoozer that is already priced. It would be quite something though if they did hike (which is what BofA still calls for by the way) as it would not only be a huge hawkish surprise – a handful of days before the election – but it would also mean the long-standing “troika” at the top of the Fed in Chair-Vice Chair-NY Fed President (Warsh-Jefferson-Williams) had been busted wide open.
In terms of the rest of the meeting it is expected to also follow the “snoozer” pathway, particularly as there is no new Summary of Economic Projections and Chair Warsh has consistently been cutting back the length of the press conference and providing little information. Again, a change to that would be a big surprise. But the one thing that won’t surprise is dissents. The other regional Fed Presidents (Hammack in particular) have expressed a preference for continued rate hikes.
JPM agrees with market expectations:
Based on incoming data, there is a reasonable case for a Fed hike next week. But intermeeting remarks by a variety of FOMC members — including NY Fed President Williams, Vice Chair Jefferson, and Governors Bowman and Waller — suggest that the core of the Committee is not diverging from the signal sent in September. The news is likely reinforcing the case for a hike in December, and increasing the possibility of further moves next year.
Beyond likely dissents, there will likely be color provided around the FOMC discussion. Chair Warsh will be pressed to explain why the committee remained on hold and will likely fall back on the need for time to observe the impact of last month’s hike and a likely shift in the language of the statement that suggests a bias to hike further.
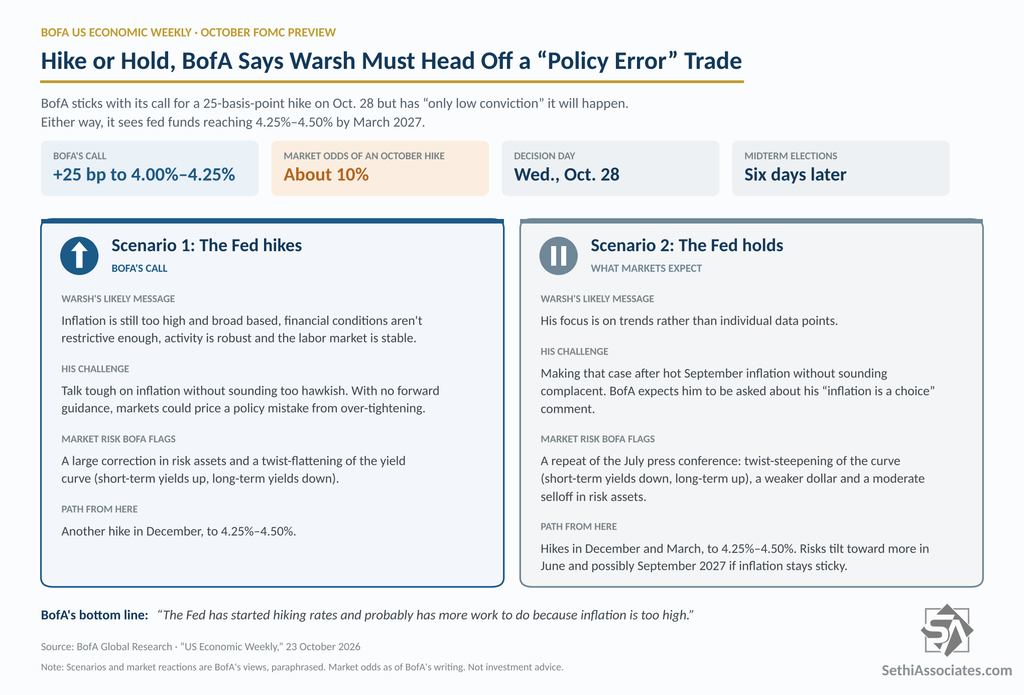
As mentioned though Bank of America economist Aditya Bhave and team are sticking with their out-of-consensus call for a 25-basis-point hike. BofA says the large beat in September inflation “bolsters the case for an Oct hike,” but concedes it would be “a heavy lift,” with markets pricing only about a 10% chance and the meeting falling six days before the midterm elections. Despite its “strong conviction that the Fed should hike,” BofA says it has “only low conviction that it will.” That makes the reasoning behind sticking with the call a little questionable.
BofA frames the meeting as a test of Chair Kevin Warsh’s resolve to bring a “sea change” to the Fed’s forward guidance. Vice Chair Philip Jefferson and New York Fed President John Williams gave what BofA calls “heavy-handed forward guidance” that led markets to price out an October hike. Whichever way the Fed goes, BofA says Warsh’s job at the press conference will be to head off a “policy error” trade. A hike risks markets pricing in over-tightening, which BofA says could bring a large correction in risk assets and a flatter yield curve. A hold invites questions about the Fed’s inflation-fighting credibility. It also risks a repeat of the July press conference: a steeper curve, a weaker dollar and a moderate selloff in risk assets.
In BofA’s view, the bigger picture barely changes either way: the Fed has more work to do. If the Fed holds, BofA still expects hikes in December and March. It sees risks tilted toward more increases in June and possibly September 2027 if inflation stays sticky despite favorable base effects.
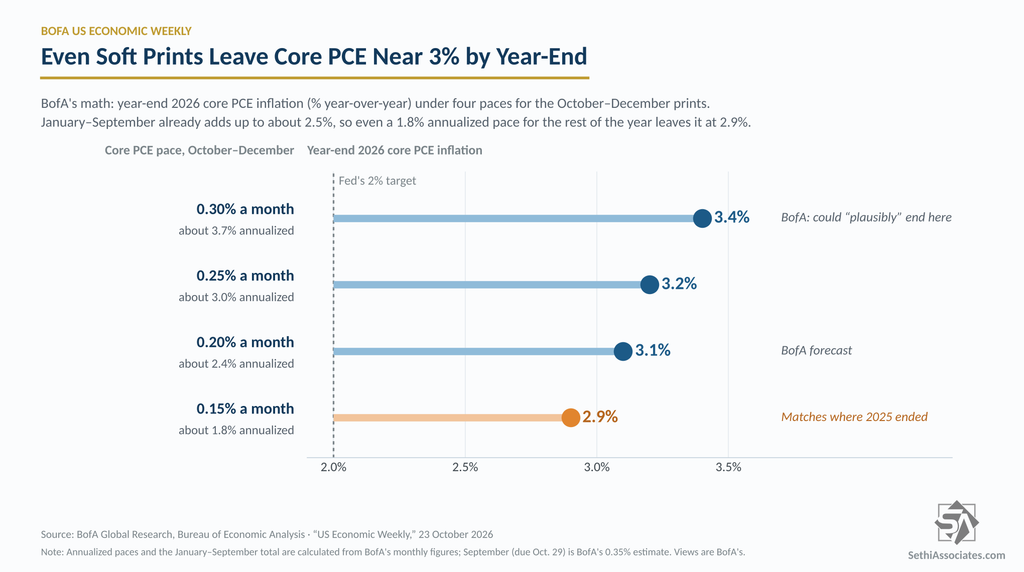
Thursday’s September PCE report is part of that case. BofA expects core PCE prices to rise 0.3% (0.35% unrounded – note that is their wording), lifting the year-over-year rate a tenth to 3.1%. Its math shows how little room 2026 has left. Even a 0.15% monthly pace for the rest of the year, roughly 1.8% annualized, would leave core PCE at 2.9% in December, where it ended 2025. BofA also sees third-quarter GDP growth at an above-consensus 3.5% annualized (that’s their house call).
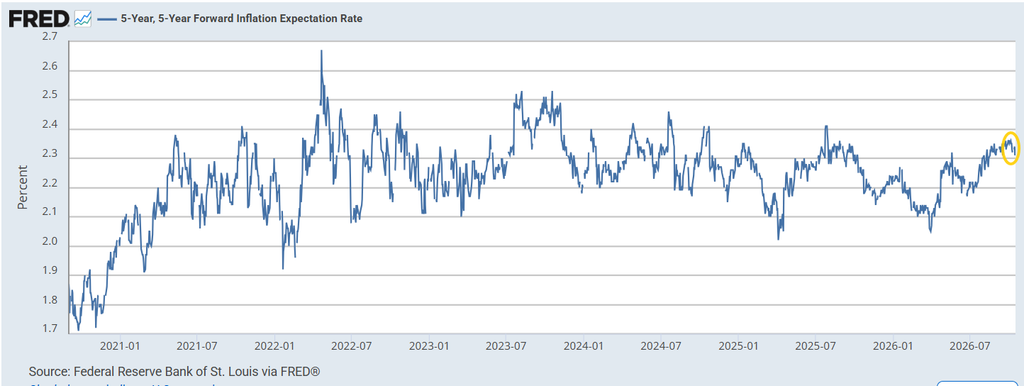
Taking a quick look at inflation expectations, those continue to remain well below their post-pandemic highs with the Fed favorite 5-year, 5-year forward rate (expected inflation starting in 5 years over the following 5 years) ending Friday at 2.33%. While it is near the highest in a year, it’s well below the peaks in 2022 and 2023.
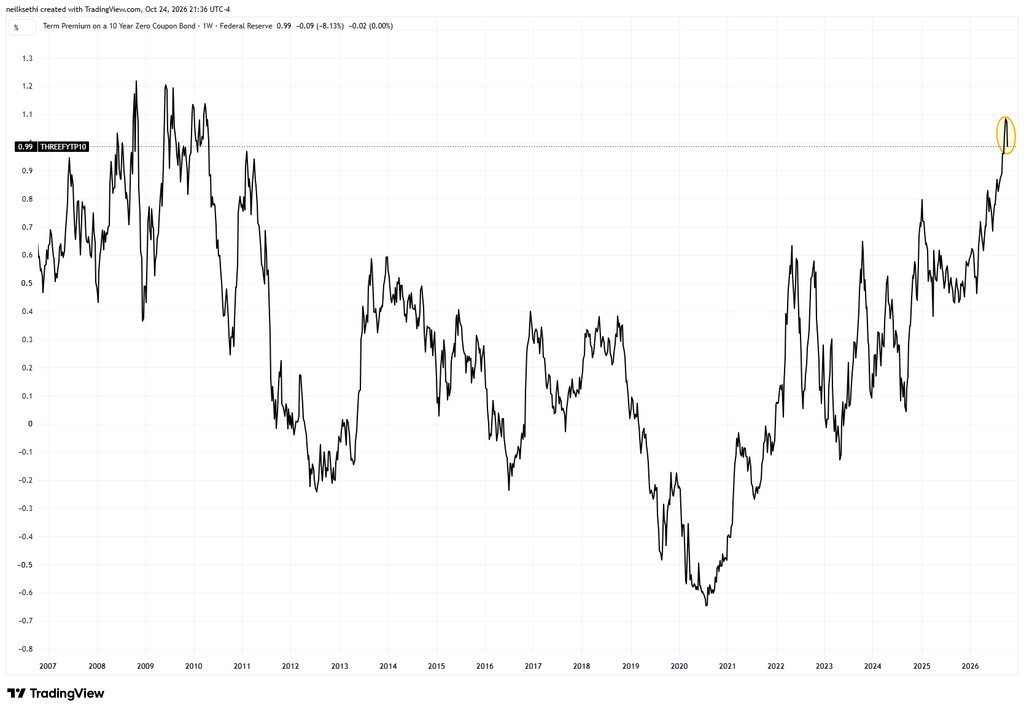
And the further drop in nominal yields last week, as discussed in the Friday update, saw term premium (the extra yield investors demand to hold a longer-term bond instead of continually rolling over short-term bonds for the same period) — which has been the main source of pressure on the long end — fall for a second week, and by more this time, from the highest since March 2010, according to the Kim-Wright model.
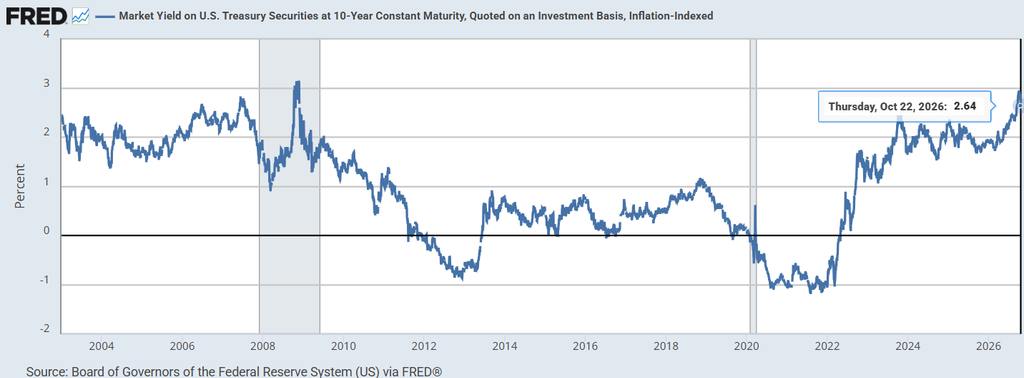
Which in turn saw the 10-year real rate (via the hypothetical constant-maturity, 10-year Treasury Inflation-Protected Security) ease back for a second week to 2.64% down from 2.88% two weeks ago.
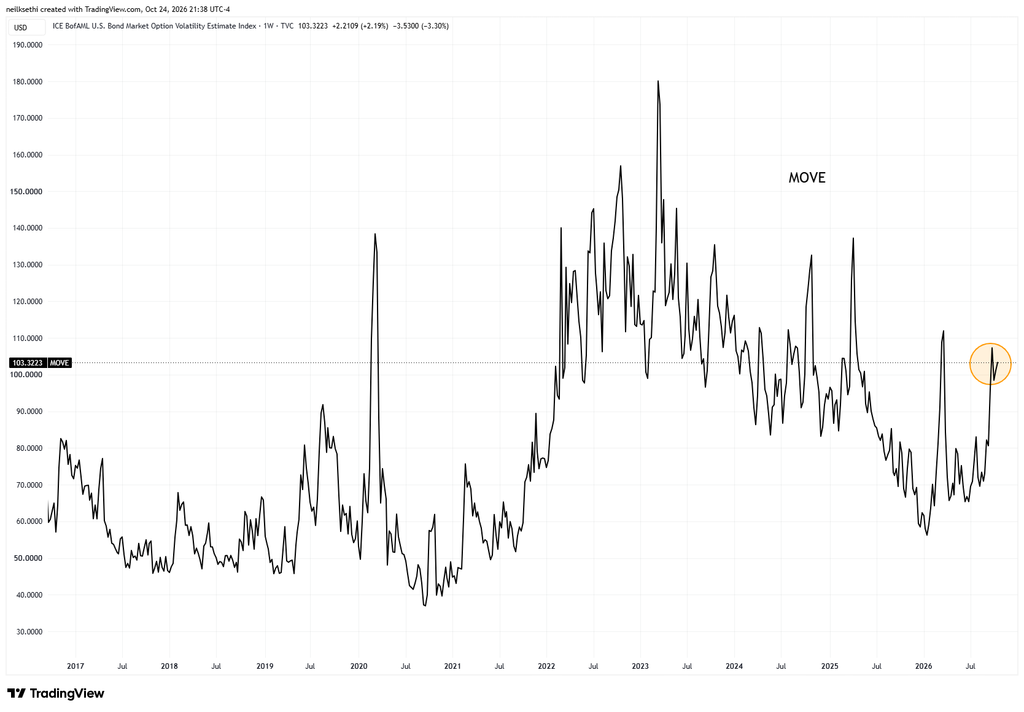
But big down moves are just as “volatile” as big up moves so the MOVE index (expected 30-day volatility for Treasuries) remains relatively elevated.
Overall,I said a month ago, “we remain above my new ranges established at the start of August for the 2-year and 10-year” which saw the top of the range at 4.75% on the 2-year, 5% on the 10-year, and 5.75% on the 30-year, and we are now (barely) back into those ranges as I indicated I thought would happen by year end (we never exceeded 5.75% on the 3-year). I still think chances are good we end up under those levels at year-end, but there’s a lot of data between now and then.
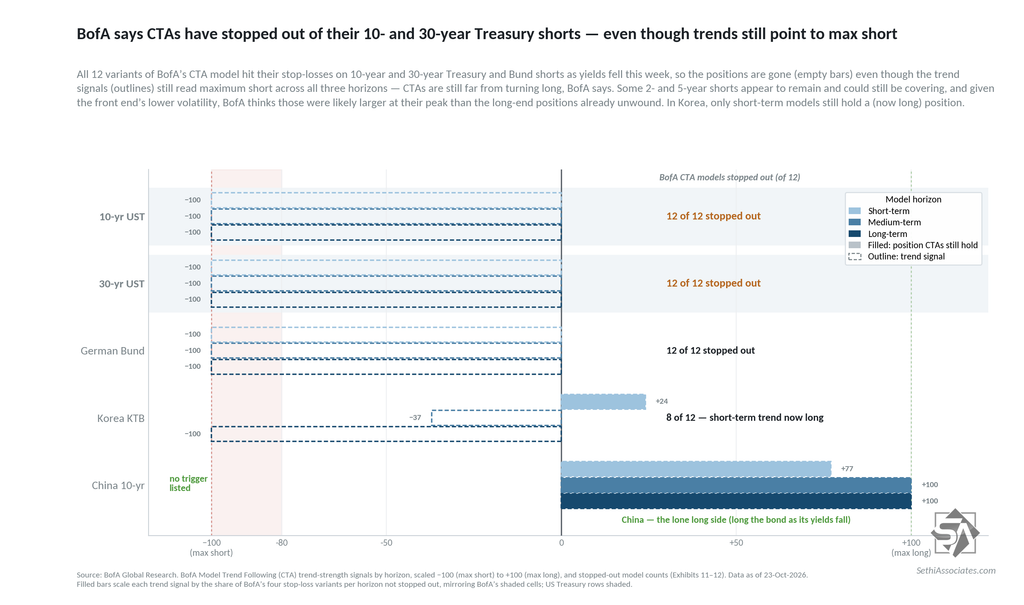
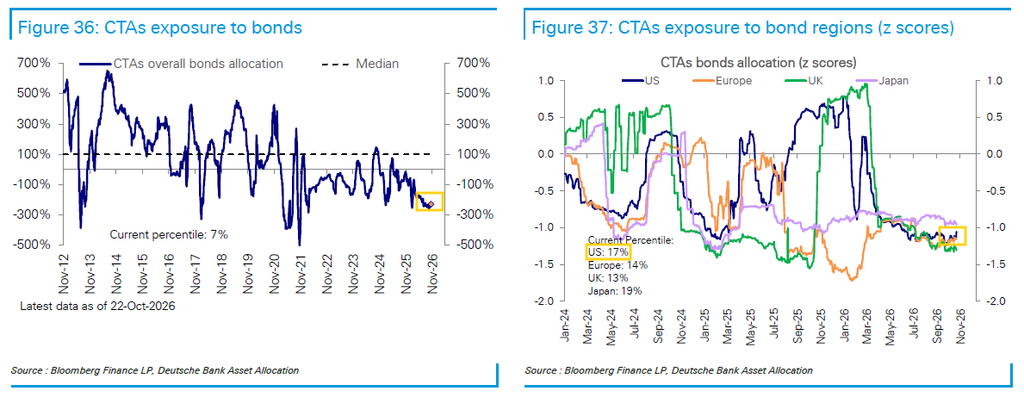
And I mentioned a week ago that we had seen some bond shorts covering, and we got a lot more this week according to BofA bringing them to roughly flat positioning:
“CTA short covering spread through the belly and long end of the US Treasury curve this week as yields declined alongside equities, contributing to a broader de-grossing of CTA positions across asset classes. TY [10-year] and longer-dated futures crossed all of our risk management thresholds, but some 2yr and 5yr shorts appear to remain and could still be in the process of covering.
“Given the front end’s lower volatility, the front end shorts were likely larger at their peak than the long-end positions already unwound. Despite the covering, Treasury futures trends remain at maximum negative levels across lookbacks, suggesting CTAs are still far from turning long.”
But DB continues to see just modest CTA covering with US net positioning at the 17th percentile to 2012 (from the 11th the prior week). Globally they’re at the 7th percentile (from the 4th).
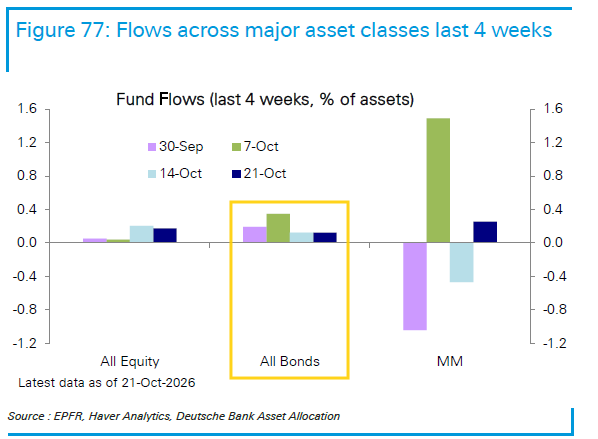
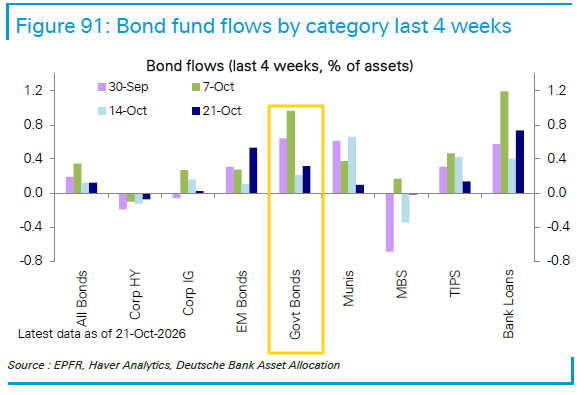
And DB continues to see bond fund inflows, at around $10B for a second week, the fifth straight week of inflows.
A good chunk of that once again went into Treasuries, along with healthy flows into EM and bank loans; only high yield saw notable outflows.
I’ve said for the past month “we remain in a precarious place for bond shorts. There will be that huge short covering rally that will see yields plummet, at least briefly.” And it seems that we got at least a good amount of that short covering rally, although positioning appears at best neutral at this point.
Earnings Growth Robust But Past the Peak
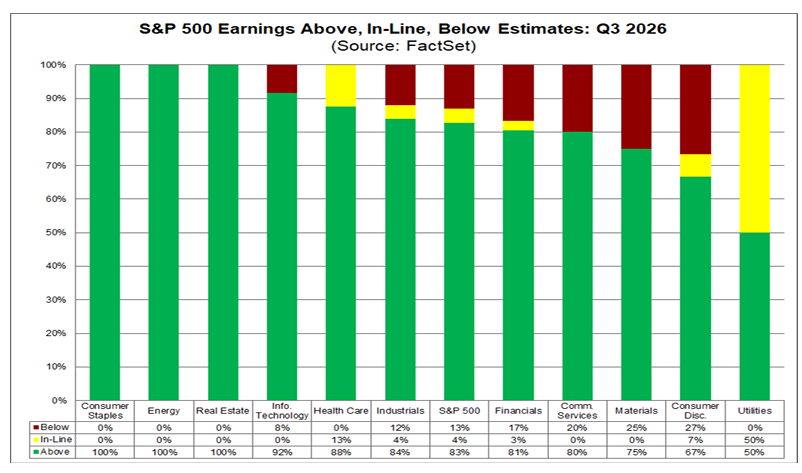
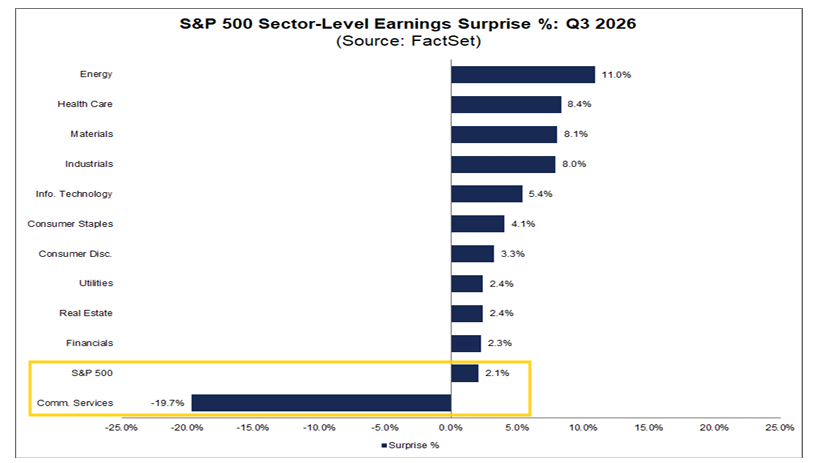
Looking at Q3 earnings, we remain relatively early in the season with just 24% of the S&P 500 reporting by earnings weight through Thursday according to FactSet, but beats have remained high with 83% beating, slightly below the 86% beat rate in Q2 (which was the best since Q2 ‘21) but above the 5-year average of 78% and the 10-year average of 76%.
The magnitude of the beats though remains weak at just +2.1%, less than a tenth of the +26.5% in Q2, “although that was a high bar, the best since FactSet began tracking the metric in 2008. But it is also well below the 10-year average of 7.4% and the 5-year average of 7.0%.
That said, as you can see the Communications sector has a nearly 20% negative surprise ratio due to Meta’s $9.9 billion settlement with state attorneys general over harm to teens, which was booked against its earnings. According to MarketWatch that takes what would have been a still historically weak 5.5% to just 1.2% (I don’t know the reason for the discrepancy with the 2.1% FactSet number).
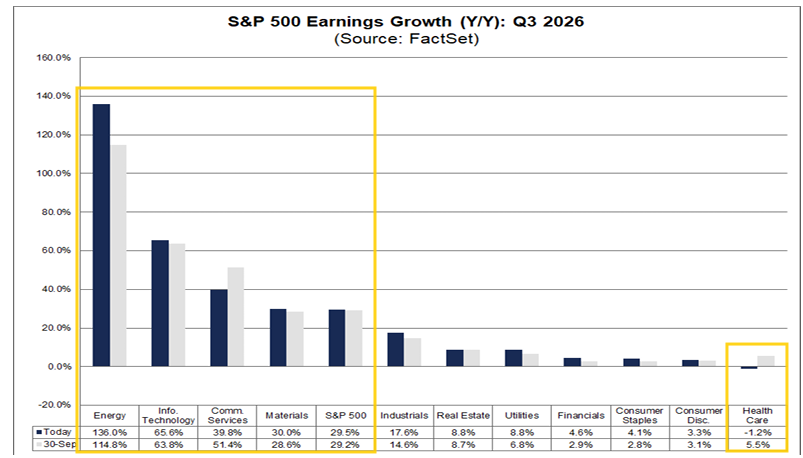
But despite the weak surprise number, Q3 expected earnings growth rebounded five tenths to +29.5%. Energy extended to +136.0% y/y growth (up from +79.3% at the start of the quarter — July 1st), followed by Tech +65.6% and Comm Services +39.8% (but down from +50.1% pre-Meta).
We continue to have one sector expected to have negative y/y growth in Health Care -1.2% although up from -2.6% the prior week (but down from +5.5% at the start of the quarter).
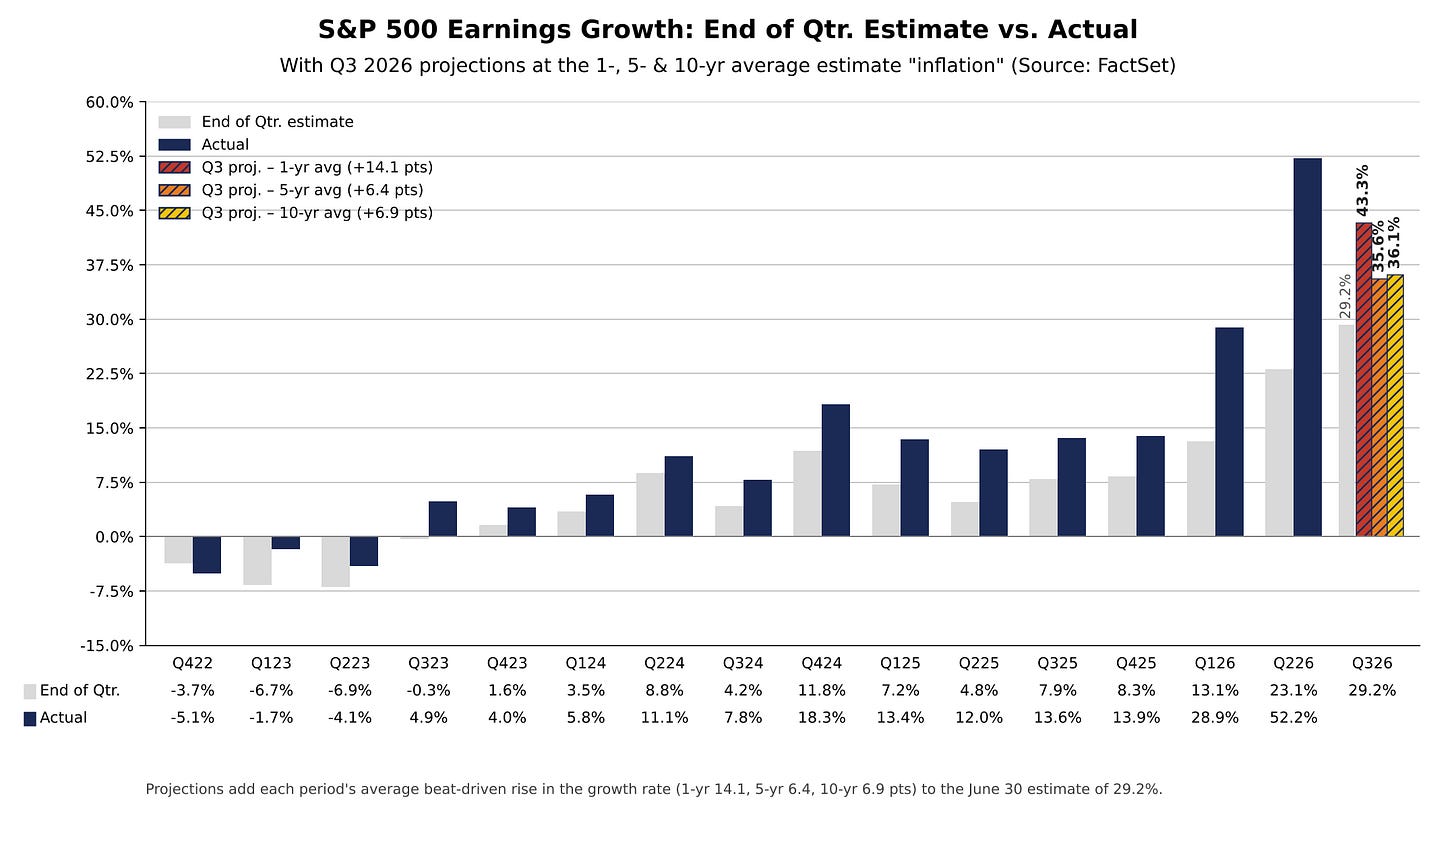
And just a reminder on the typical “earnings inflation” we see each earnings season (numbers are from the start of the quarter which is where the “inflation” metrics are measured to):
As those who followed me over from Neil’s Newsletter know ahead of each earnings season I discuss how if past is any guide the earnings growth for the coming earnings season can be expected to come in well above expectations at the start of the season.
According to Factset data, over the past 1, 5 & 10 yrs S&P 500 companies have beaten earnings expectations by 13.8%(!), 7.0% & 7.4% respectively, resulting in “inflation” to the earnings estimates on average over the quarter by 14.1%(!), 6.4% & 6.9% respectively over where they stood as of the start of the quarter (in this case June 30 which was 29.2%).
Using those averages would mean Q3 earnings could come in at +43.3%(!), 35.6%, or 36.1% respectively.
Actual earnings by the end of the quarter have failed to surpass expectations at the start of the quarter in only 3 of the past 43 quarters (Q1 ‘20, Q3 ‘22, and Q4 ‘22 are the only exceptions according to Factset).
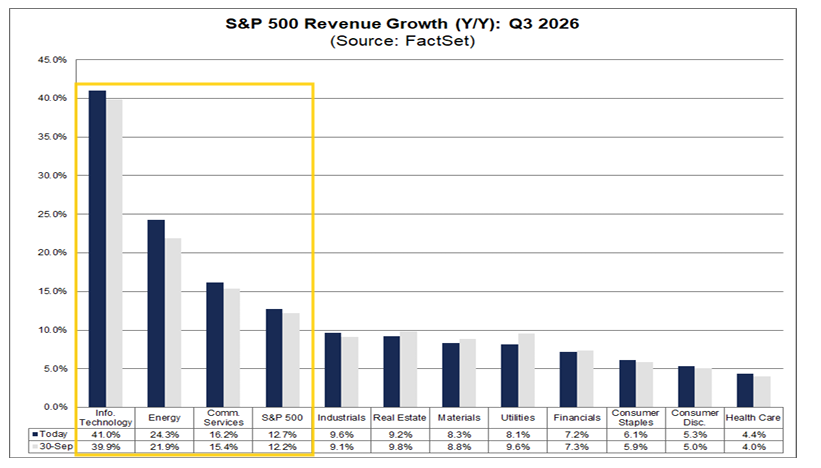
Q3 revenue growth expectations rose to +12.7%, on track for a third consecutive quarter of double-digit revenue growth after +15.5% in Q2 which was the best since Q4 2021 (16.1%).
Expectations are led by Tech (+41.0%), Energy (+24.3%), and Communications (+16.2%).
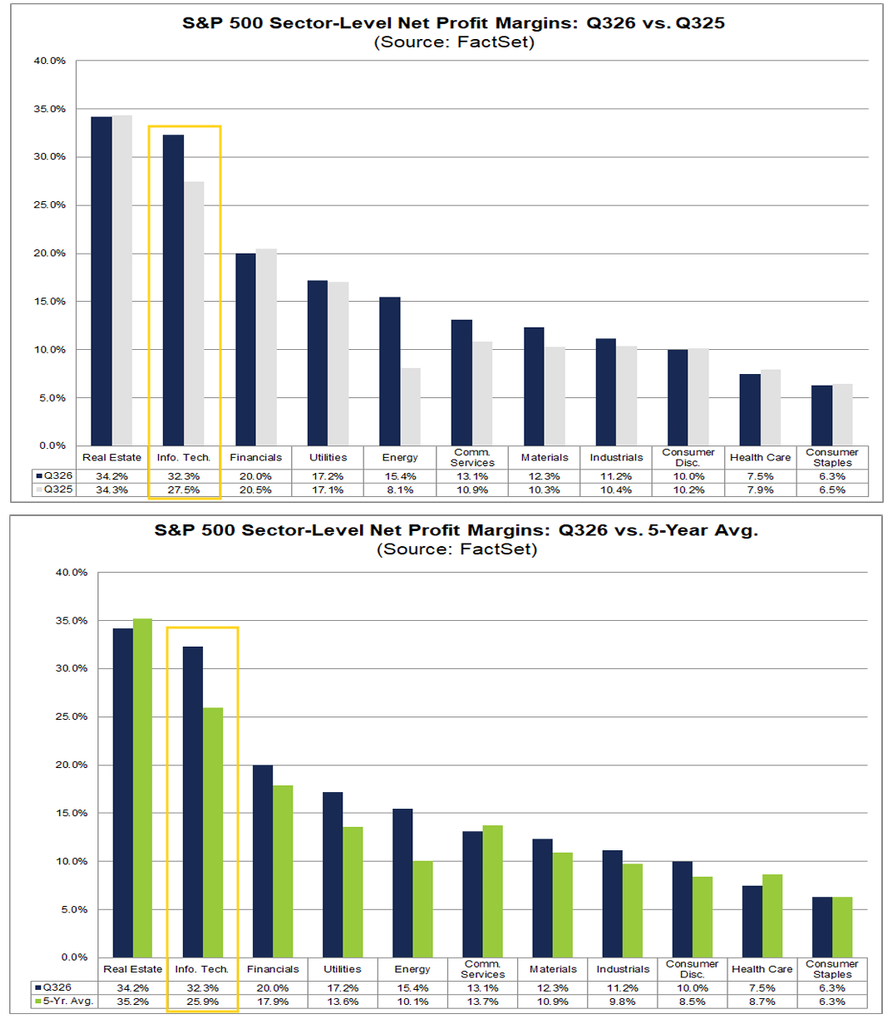
Which continues to boost profit margins estimated by Factset to come in at an elevated 14.9%, the second highest on record (since 2009) after 17.0% in Q2, up from 13.0% a year ago, in large part due to Tech’s 32.3% margin up from 27.5% a year ago and versus the 25.9% five-year average (due in no small part to the huge increase in semiconductor margins).
As a side note, FactSet says the 17.0% in Q2 was boosted by the valuation gains in Amazon (AMZN) and Alphabet (GOOGL) in their investments in OpenAI, Anthropic, etc. Excluding those, it would still have been a record at 15.1%.
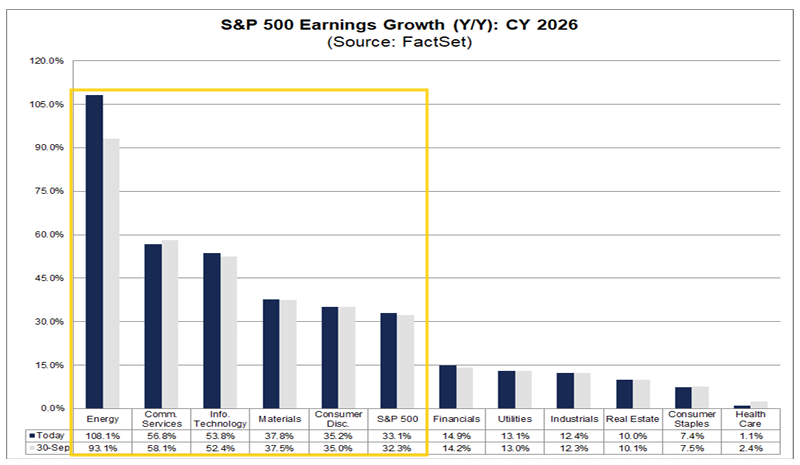
Boosted by those record margins, 2026 SPX earnings growth expectations also moved up to +33.1%, up from +24.0% on June 30th, +17.1% on March 31st, and over double the +14.8% at the start of the year.
As in 2025, Tech is a leader with y/y earnings growth of +53.8% (up from +28.6% at the start of the year) but Energy is expected to exceed that (on a percentage basis) at +108.1% (up from +6.4% at the start of the year) along with Communications +56.8%. Those sectors along with Materials (+37.8%) and Consumer Discretionary (+35.2%) represent the five sectors expected to come in above the SPX average.
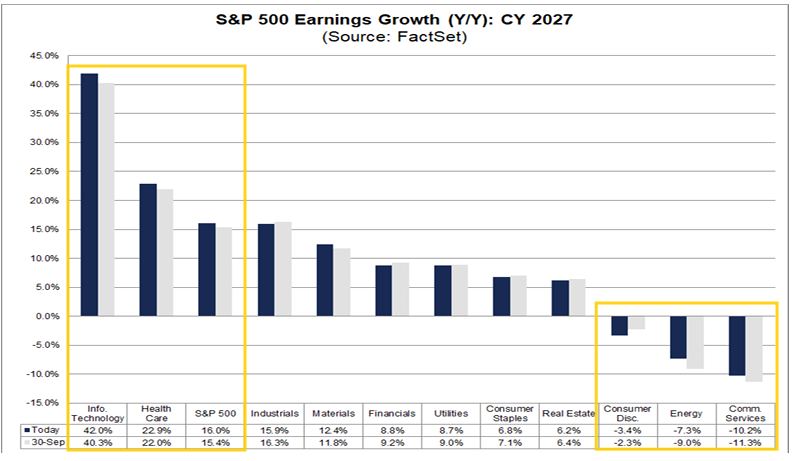
And 2027 earnings are expected to be up another +16.0% on top of the elevated 2026 results, which is down though from +17.5% as of June 30th as analysts are not carrying over all (but still most of) the boosts in 2026 earnings to next year. Still it’s a double digit advance on top of what is expected to be a 30%+ gain in 2026. That would also represent a fourth straight year of double-digit earnings growth for the S&P 500, something we’ve rarely seen.
2027 is expected to be led again by Tech (+42.0%, up from 24.6% at the start of the second quarter on April 1st, despite the huge increase in 2026 estimates since then) followed by Health Care (+22.9%) which is expected to see a big turnaround after lagging in 2026. No other sector though is above the SPX average showing the reliance on Tech to hit that number.
With hyperscaler investment gains (in Anthropic, OpenAI, etc.) expected to slow, the sectors that have seen the biggest boosts from that are now expected to see negative y/y growth (Comm Services, -10.2% from +8.2% at the start of the third quarter, and Consumer Discretionary, -3.4% from +13.9%) along with Energy (-7.3%) as petroleum prices are expected to soften.
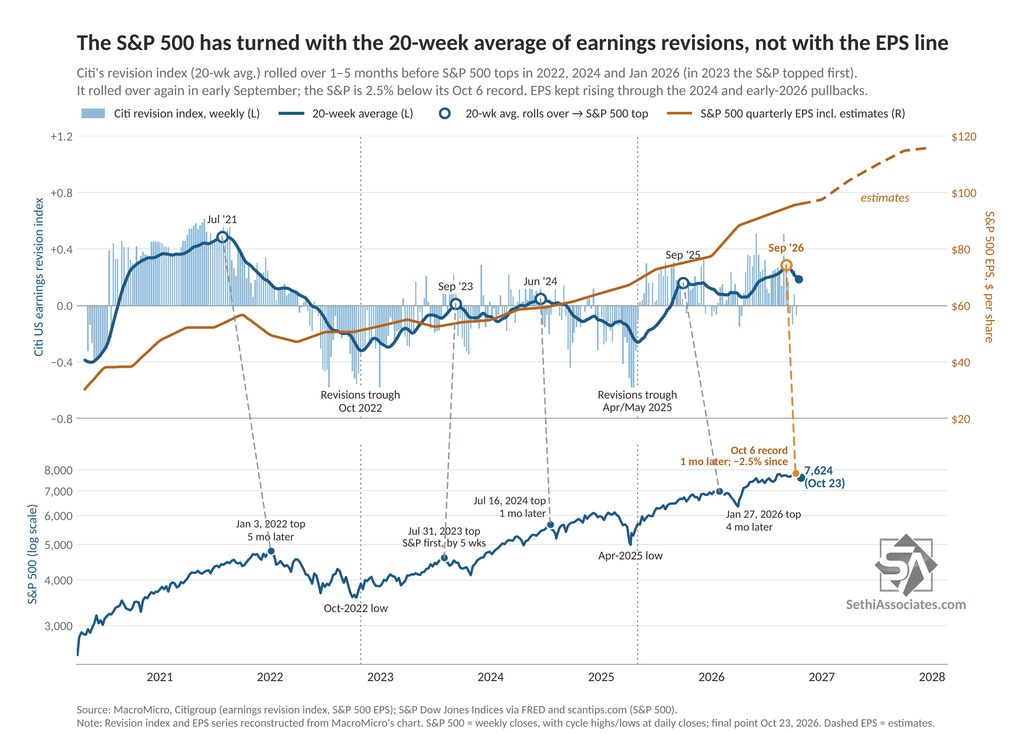
Citigroup’s earnings revision index was flat (0.00) this week after three negative readings in the prior four. More important, its 20-week moving average is still sliding. It’s fallen every week since mid-September, to 0.18 from 0.28. That’s still positive, but in three of the four prior rollovers since 2021 the 20-week turned 1–5 months before an S&P 500 top (Jan ‘22, Jul ‘24, Jan ‘26), followed by declines of 8.5% to 25% (in 2023 the SPX topped first). The S&P 500 is down 2.5% since its October 6th record. It’s still too early to tell how much further (if any) the softening has to go.
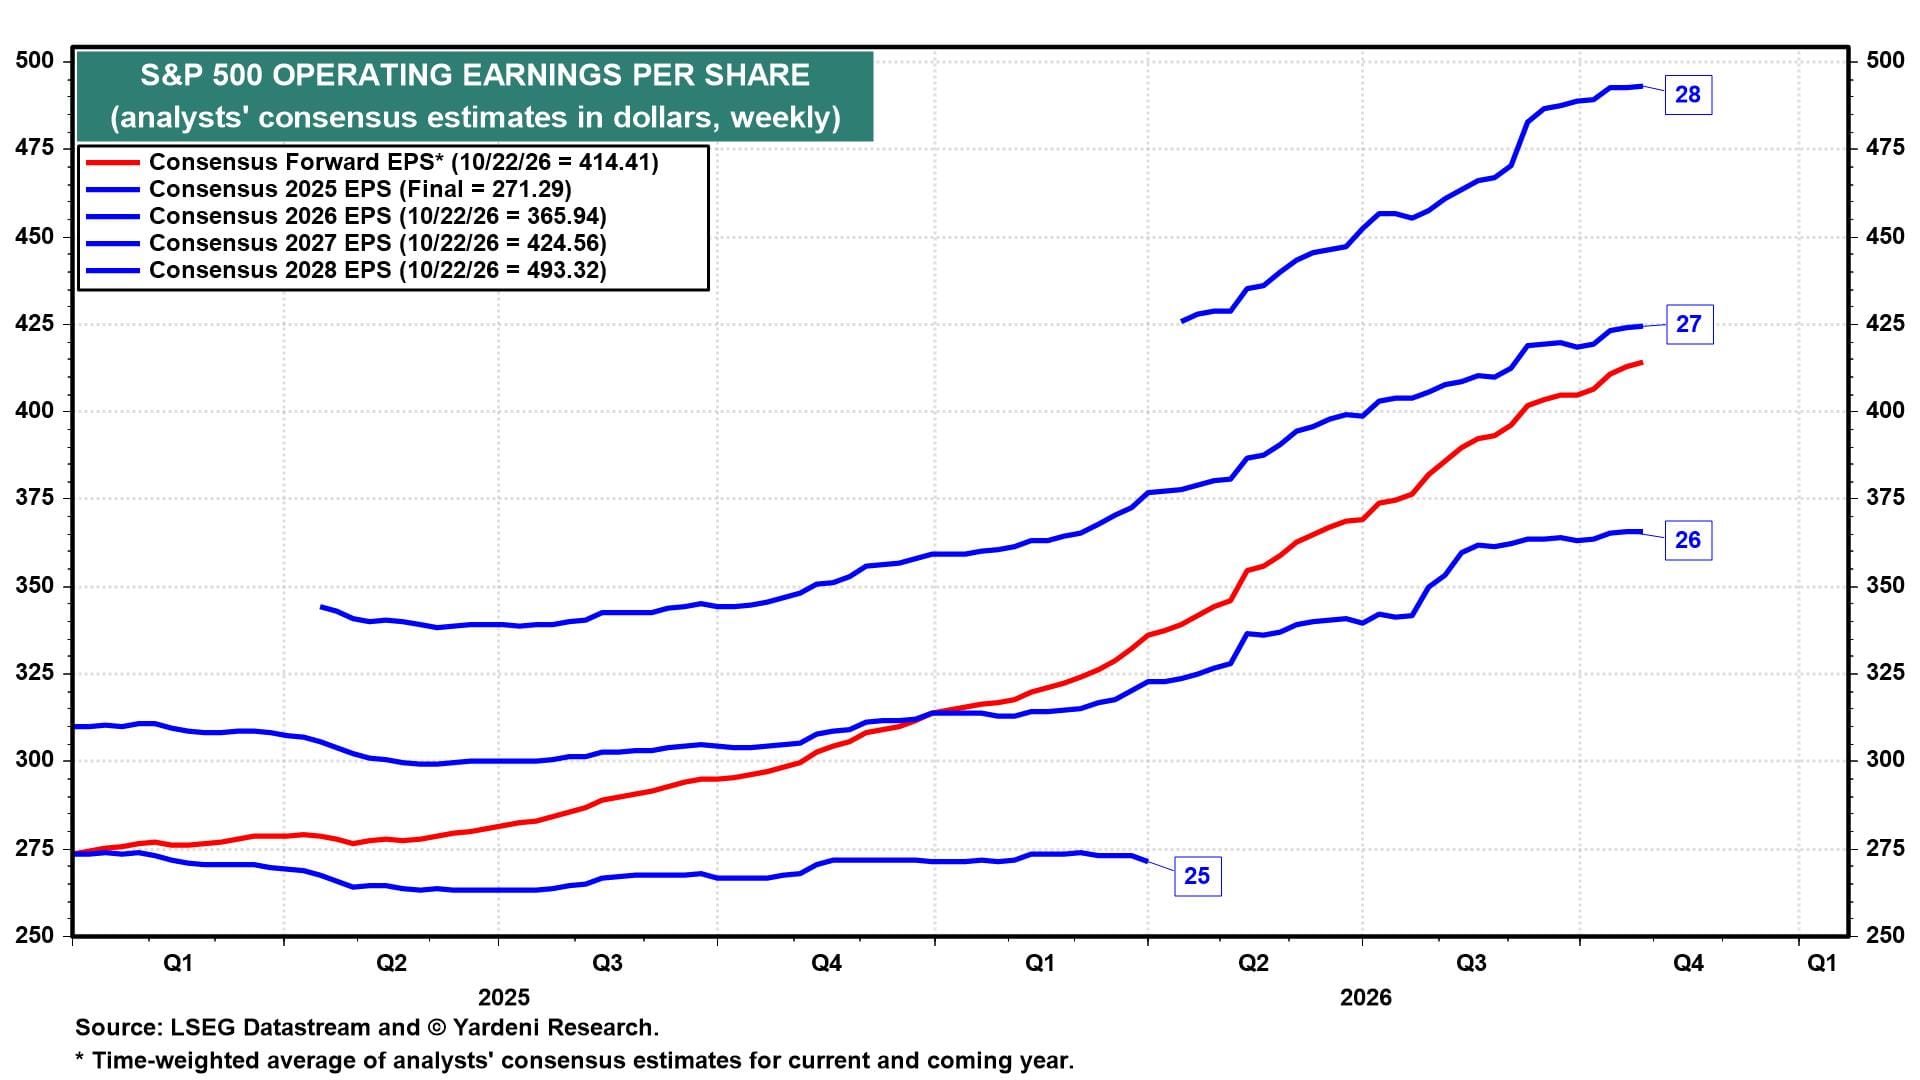
S&P 500 forward earnings per share rose to a record $414.41 during the week of October 22 (chart). It is converging on the analysts’ 2027 consensus estimate of $424.56, up from this year’s estimate of $365.94 (chart).
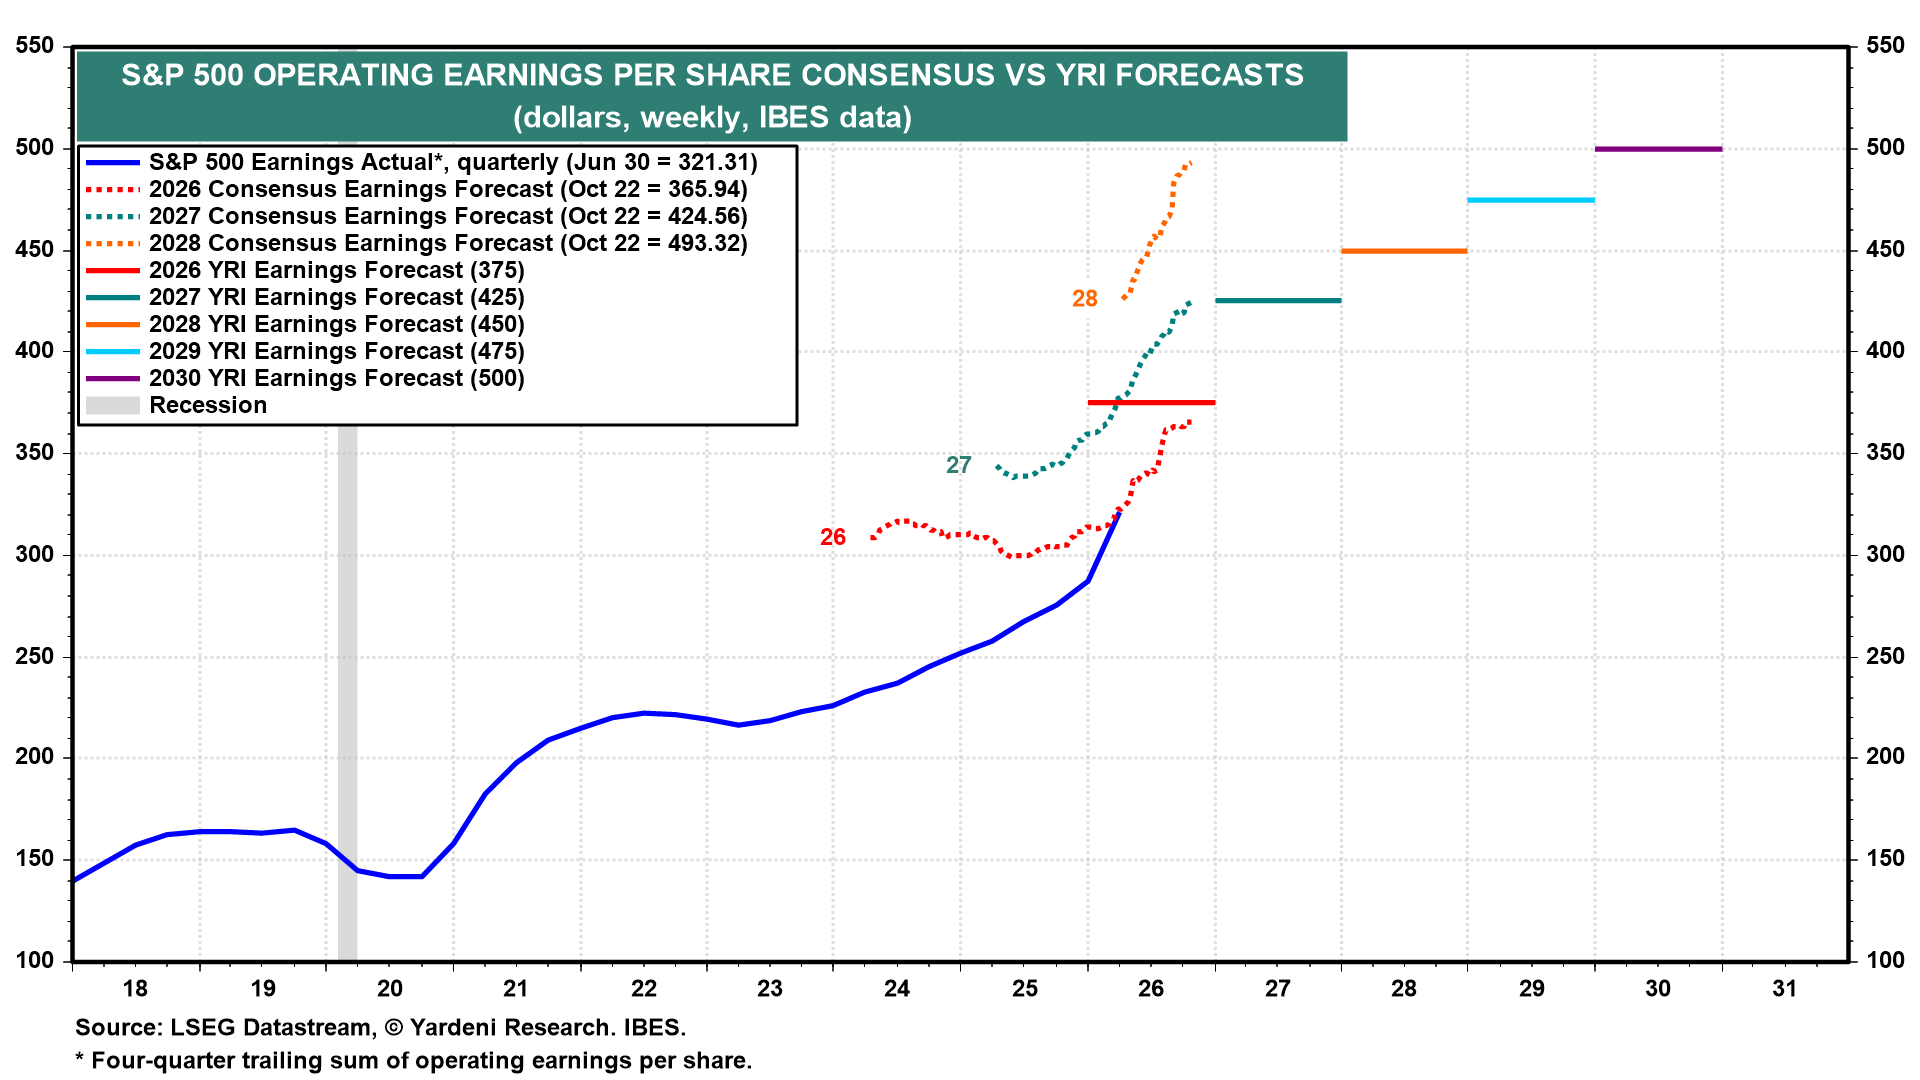
The 2026 consensus is closing in on our $375 per-share forecast (chart). The consensus for 2027 matches our $425 forecast. The 2028 consensus is already $493.32, well above our $450 forecast for that year and almost at our $500 target for 2030! If the analysts are right, the S&P 500 could rise to 10,000 by the end of next year. We are sticking with that target for the end of 2029. We think the analysts are too bullish on earnings.
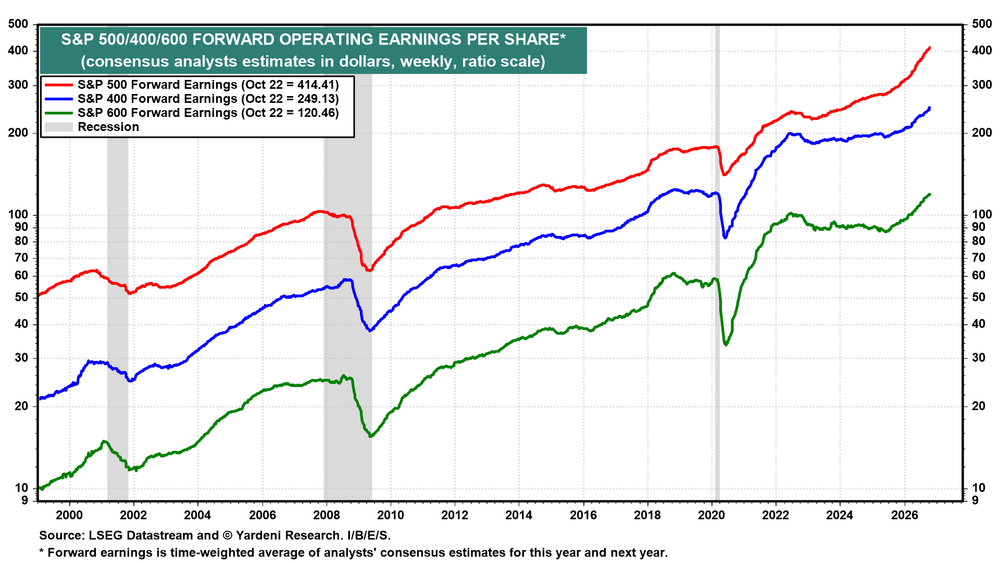
Forward earnings for the S&P 400 and S&P 600 are also at record highs (chart).
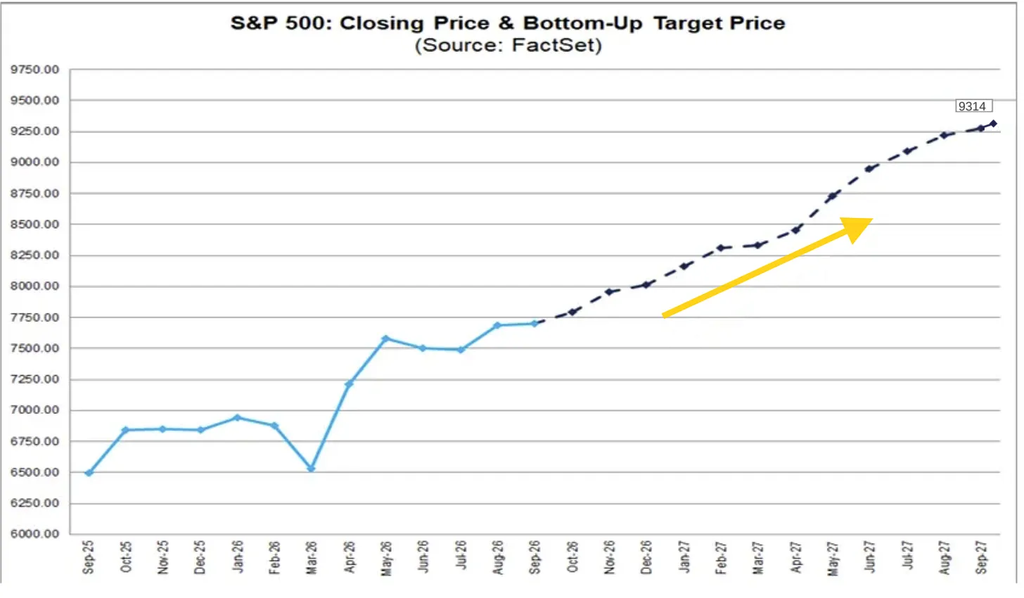
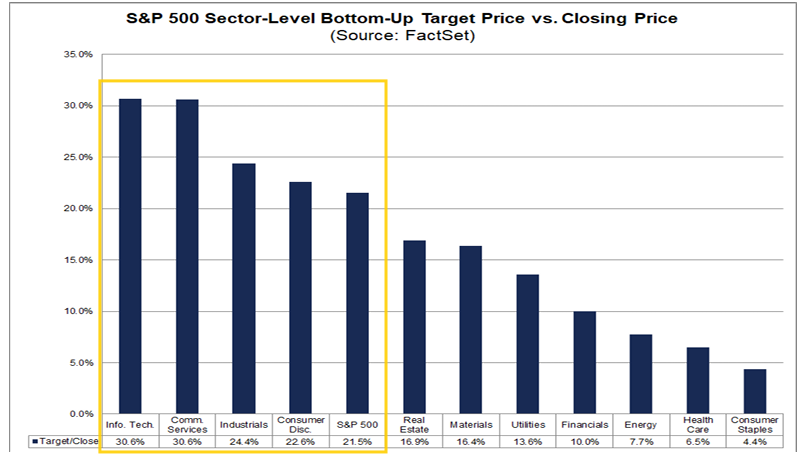
Analysts meanwhile collectively continue to think that the S&P 500 has a lot of upside with FactSet’s compilation of analyst bottom-up SPX 12-month price targets little changed at 9,314 (−3pts w/w, ~+985 pts since March 31st, ~+1,385 pts since Thanksgiving, and ~+2,620 pts since July 1, 2025). That would be +21.5% from Thursday’s close, up from +20.3% the prior week as the index fell about 1% w/w.
Info. Tech. (+30.6%, up from +26.8% the prior week) and Comm. Services (+30.6%, up from +21.4%) are now tied as the sectors expected to see the largest 12-month price increase, followed by Industrials (+24.4%). On the other side, Consumer Staples (+4.4%, down from +7.6%), Health Care (+6.5%) and Energy (+7.7%) remain the only sectors with single-digit expected upside, with Financials (+10.0%) just at double digits.
As a reminder we started the year with a 12-month bottom-up price target of 8,000 and according to FactSet the last 20 yrs (through 2024) analysts have been on avg +5.9% too high from where they start the year, but they have underestimated it five of the past six years (including 2025 when they saw 6,755 at the start of the year and we ended at 6,845). Currently we’re about 4.4% away.
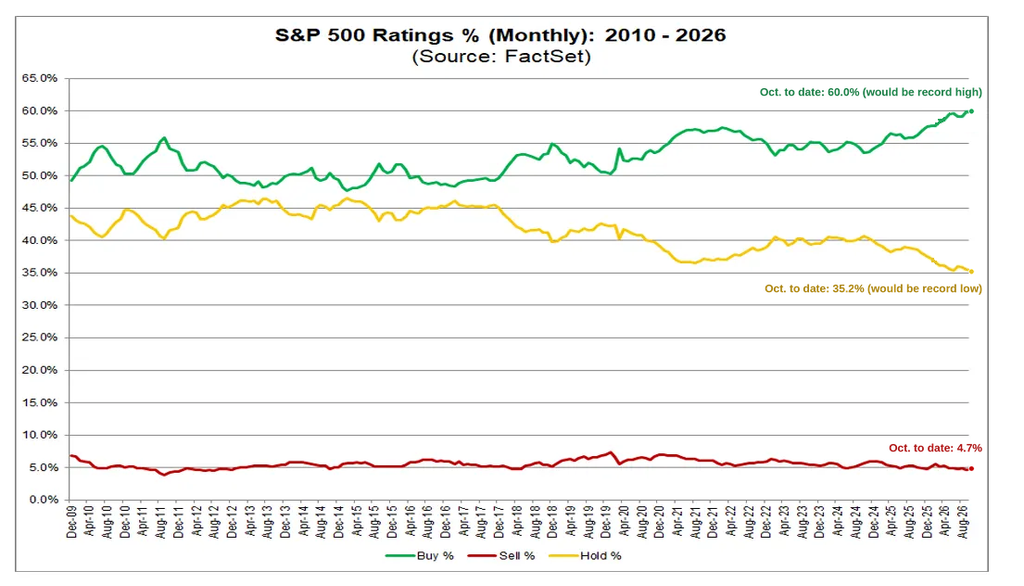
In terms of analyst ratings, buy and hold ratings continue to dominate with buy ratings at 60.0% (down from 60.1% the prior week). That would still be a new month-end record high (to 2010) if it holds through the end of October. The 5-year month-end average is 55.8%.
Hold ratings are at 35.2% (down from 35.3%), which would be a new month-end record low (to 2010) if it holds, vs the 5-year month-end average of 38.7%. Sell ratings are at 4.7%, remaining in their narrow range since 2009 but below the 5-year month-end average of 5.6%.
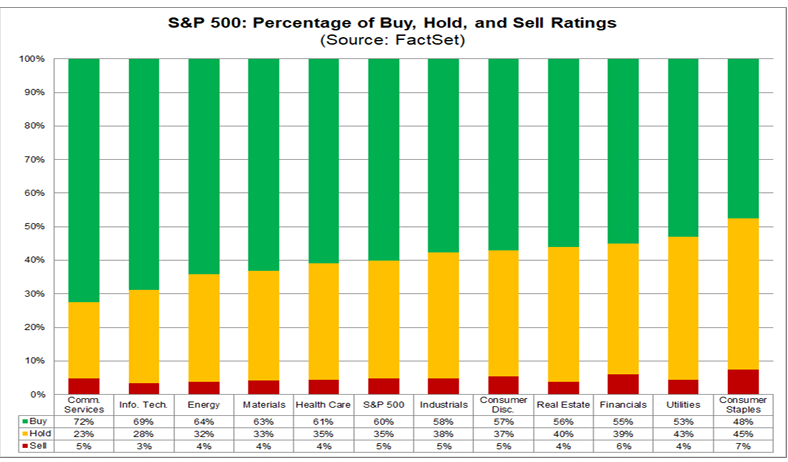
At the sector level, Communication Services (72%) and Info. Tech. (69%) have the highest share of buy ratings, while Consumer Staples has the lowest (48%) and the highest share of sell ratings (7%).
Valuations Still Under Pressure
Valuations outside the Mag-7 continue to push lower, all though around the least since liberation day.
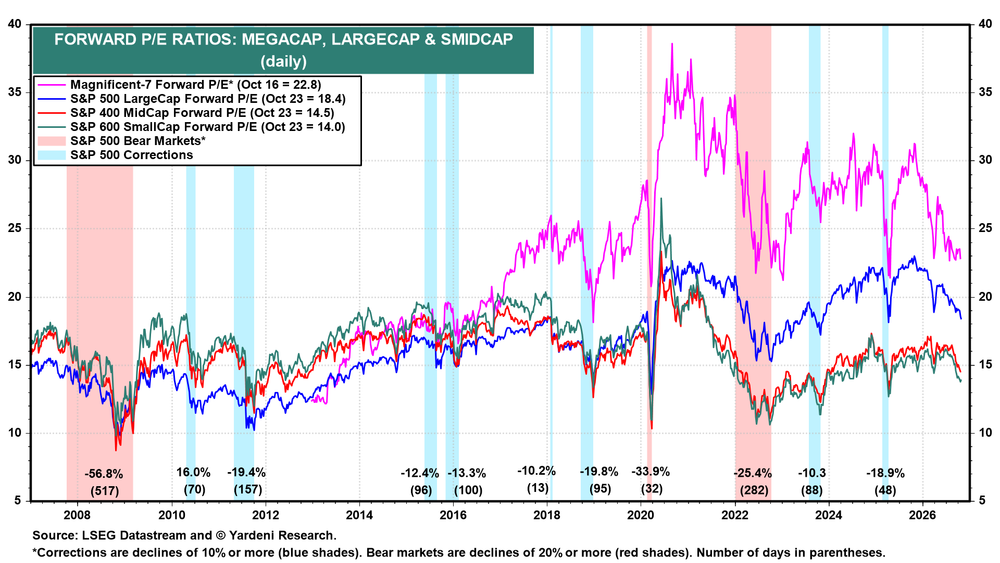
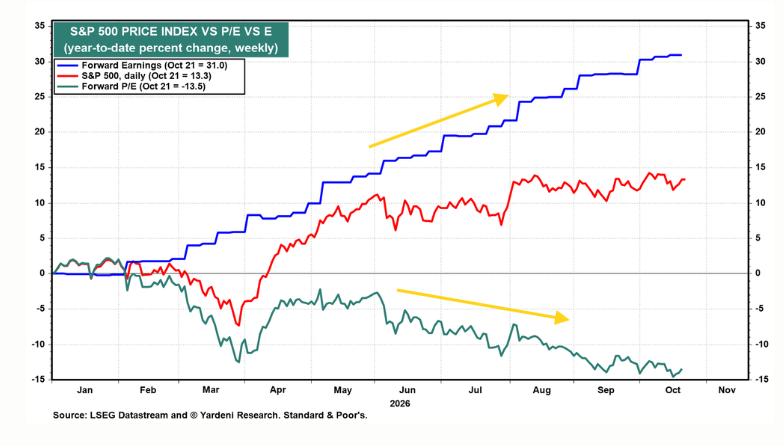
Yardeni: “Valuation multiples continue to compress despite strong earnings (chart). The Magnificent-7’s forward P/E is 22.8, down from a 2026 peak of 28.5. The S&P 500, S&P 400, and S&P 600 trade at 18.4, 14.5 and 14.0, respectively.”
He also notes: “The S&P 500 is up 13.3% ytd, despite a 13.5% contraction in its forward P/E. That’s because FEMO [Fabulous Earnings Momentum] has overwhelmed waning FOMO [Fear of Missing Out], with forward earnings jumping 31.0% since the start of the year (chart).
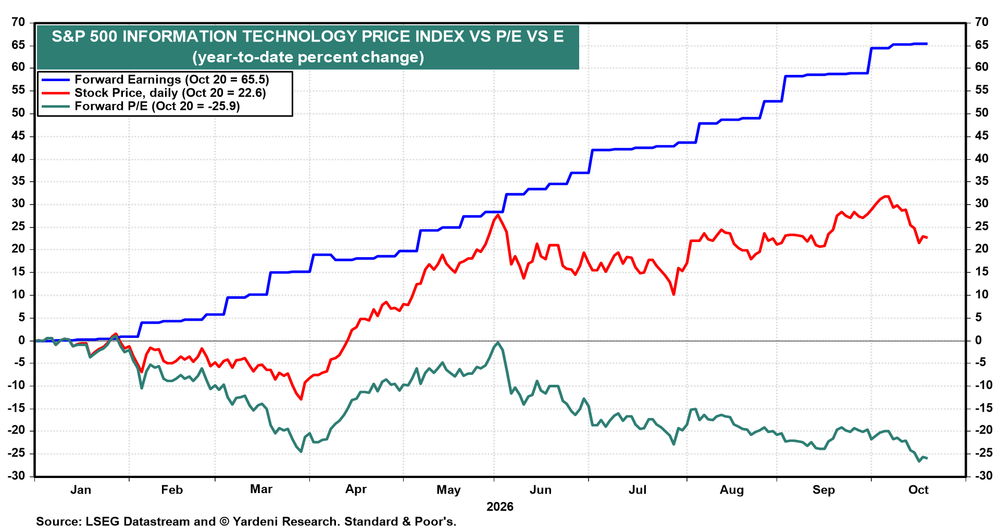
“The divergence is even more striking in Information Technology. The sector’s forward earnings has soared 65.5% ytd, while its forward P/E has plunged 25.9%. The S&P 500 IT stock price index has risen 22.6% ytd, powered by FEMO (chart).”
Breadth – Continues to Improve
After saying for two weeks “breadth metrics more universally improved this week outside of the Nasdaq,” I can add the Nasdaq to the list for this week even if it is pretty marginal.
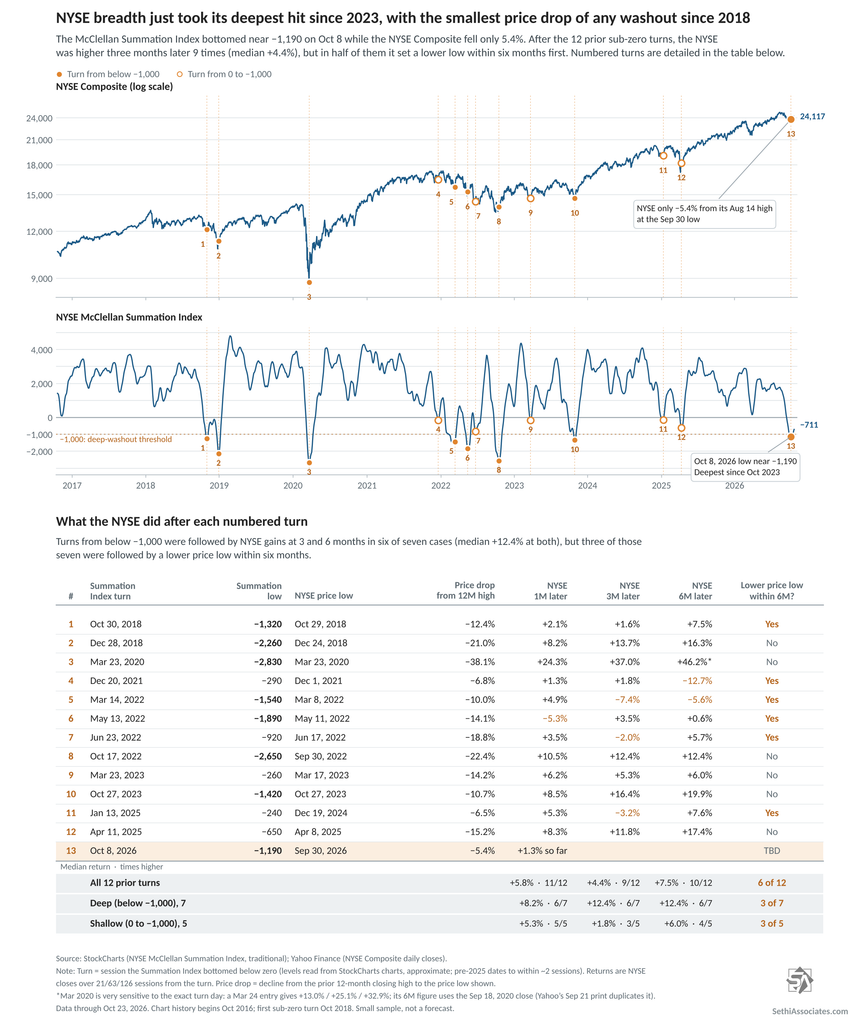
The McClellan Summation Index (red line, broadly whether the typical stock is doing relatively better or worse than the index) has continued its turn higher from the lowest since October 2023. As a reminder last week I gave Claude’s analysis on rebounds from sub-zero washouts. Here’s Claude’s update this week:
Across all 12 prior sub-zero turns, the NYSE was higher a month later 11 times. But 11 sessions in, this rebound is one of the softest.
The NYSE is up 1.3% since the Oct 8 turn, against a median of 4.9% at the same point after prior turns. The Summation Index has climbed about 475 points to −711, against a median of roughly 1,290. Only two prior turns started slower on price, October 2018 and June 2022, and both were followed by lower price lows. That said, this washout came with the least price damage of the 13 turns, so there was less ground to make up.
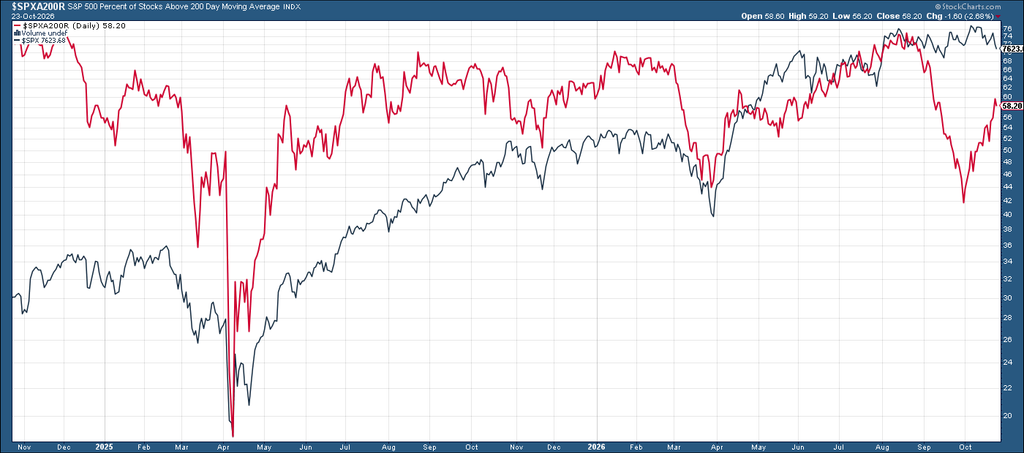
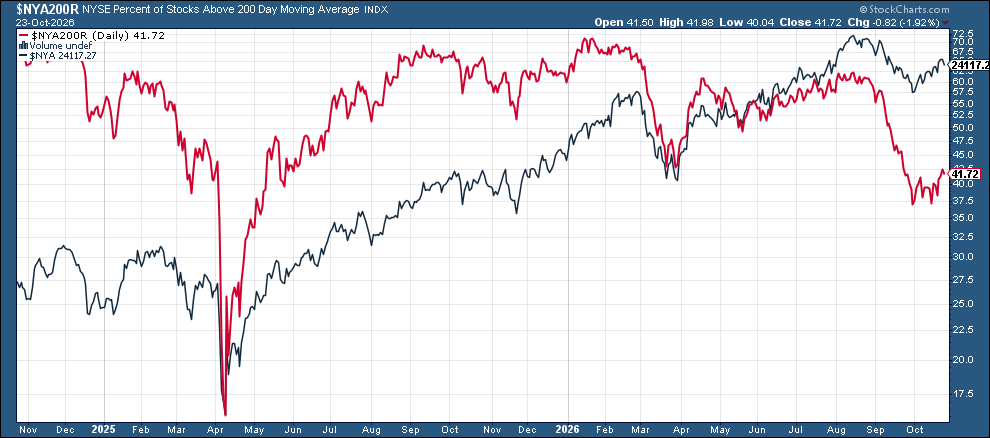
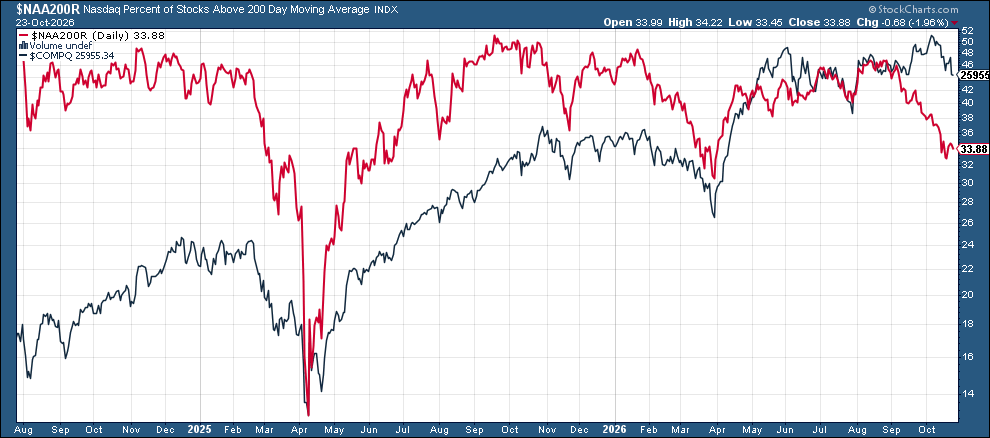
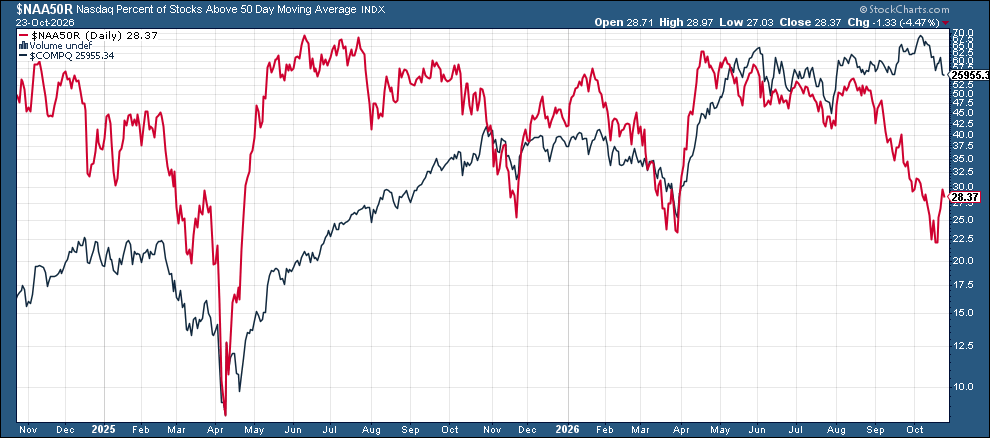
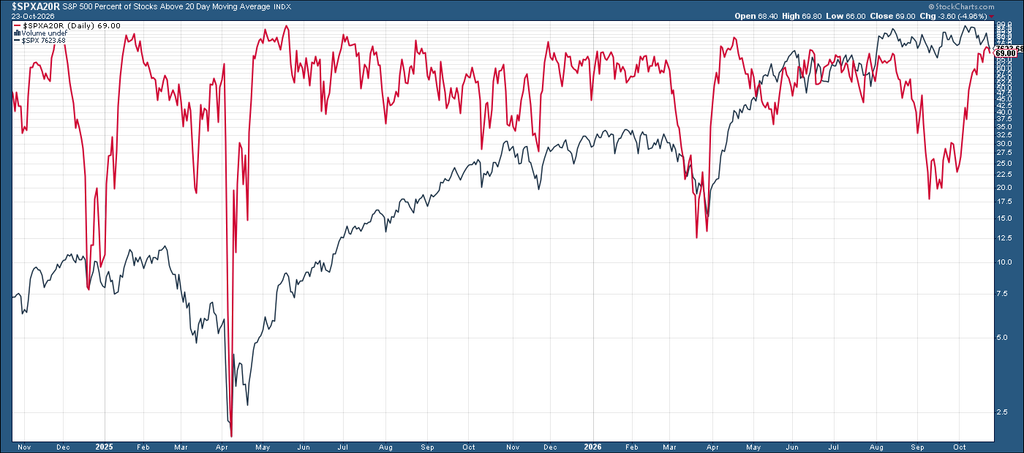
Percentage of stocks over 200-DMAs (red lines) are mixed. The S&P 500 has seen the most progress now up to 58%.
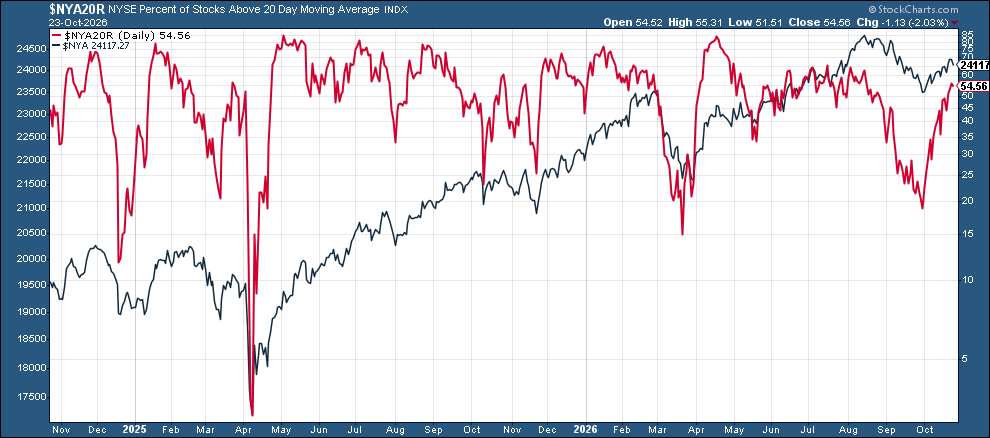
The NYSE though saw more progress this week than in prior weeks.
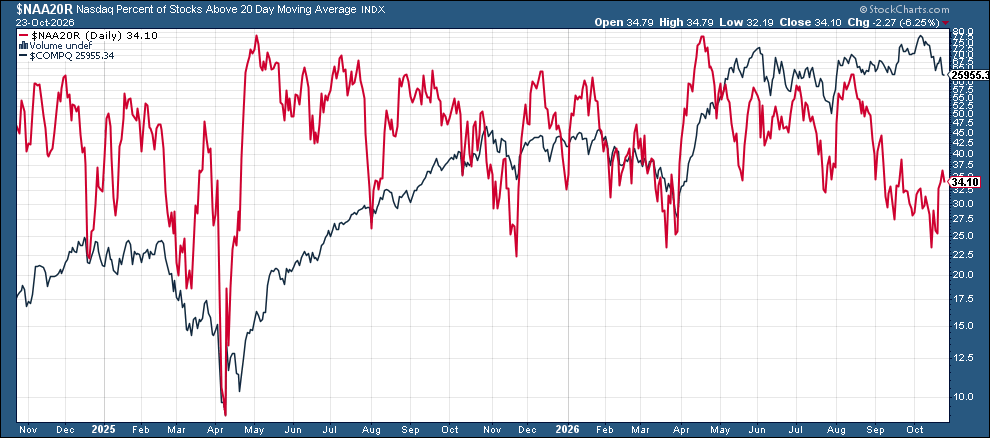
While the Nasdaq at least is off the lows.
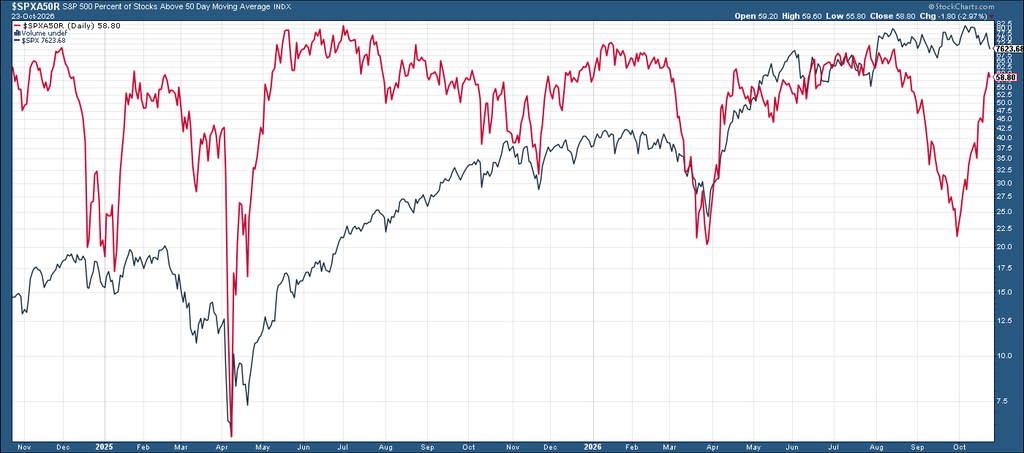
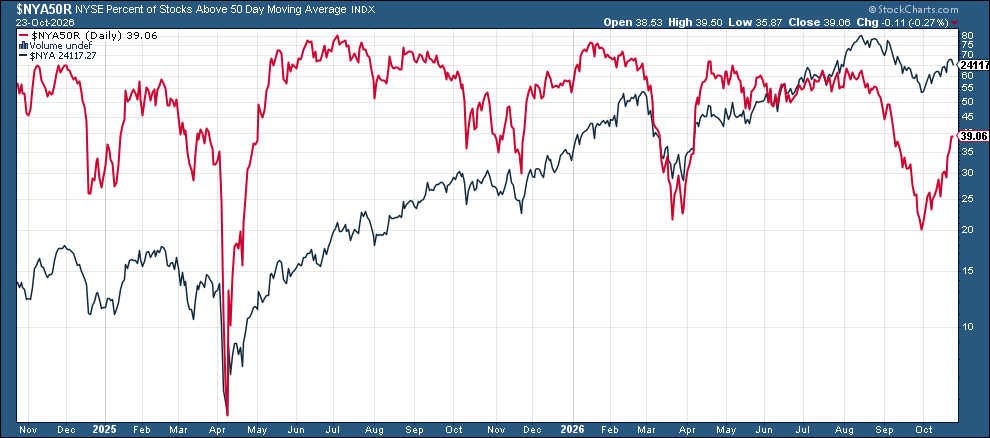
And a similar story for shorter-term 50 & 20-DMAs.
50-DMAs
20-DMAs
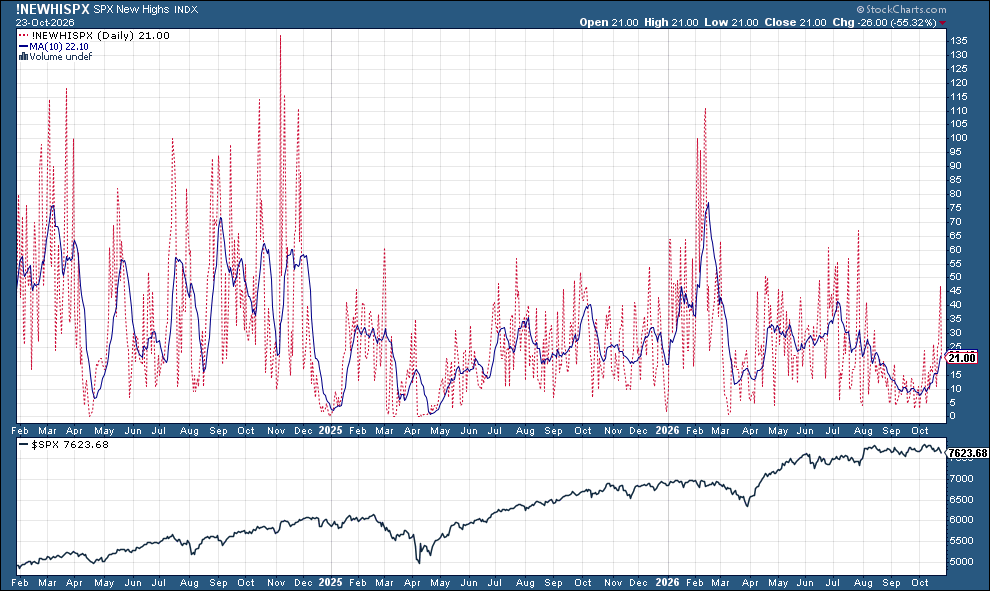
SPX new 52-week highs jumped to 47 Thursday before pulling back Friday but the 10-DMA (blue line) is now the highest since early August.
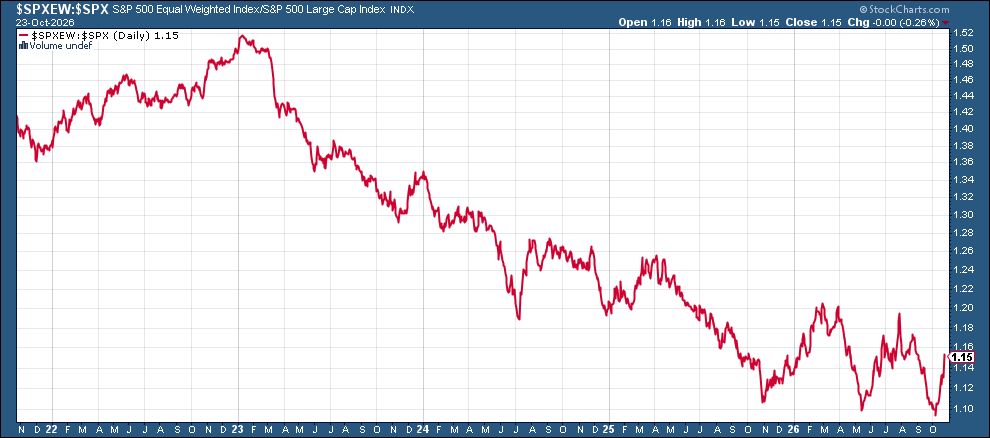
And the ratio of the equal-weight SPX to the cap-weighted has continued its bounce after hitting the lowest level since 2003, although still just up to where it was at the end of August.
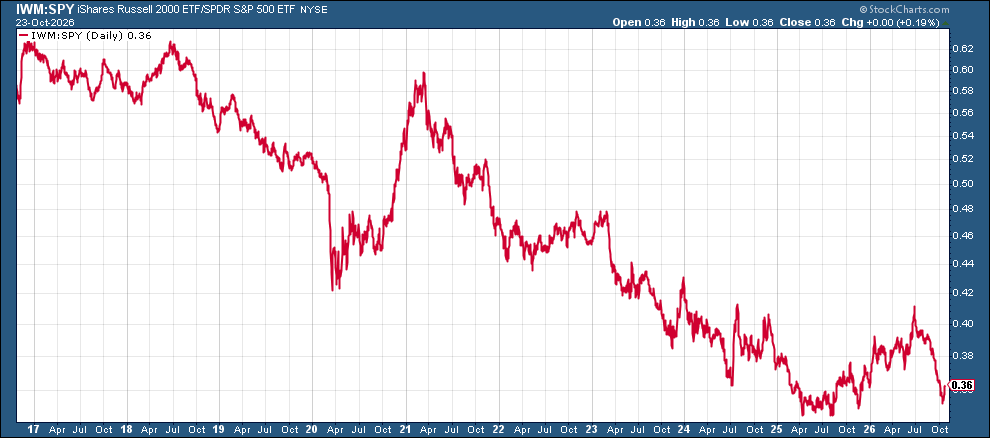
The ratio of small caps to large caps (Russell 2000 to SPX) much less progress.
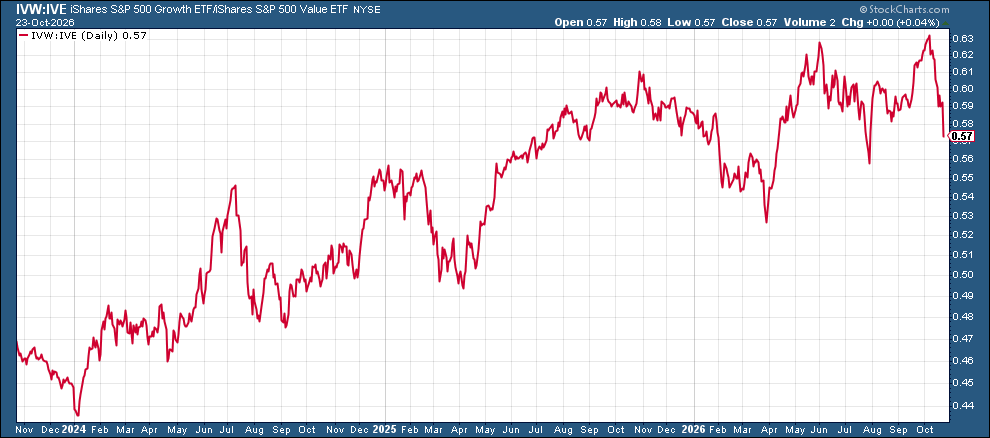
While S&P 500 growth/value continued its sharp fall this month from an all-time high.
Positioning Pulls Back Amid Broad De-Risking
Deutsche Bank:
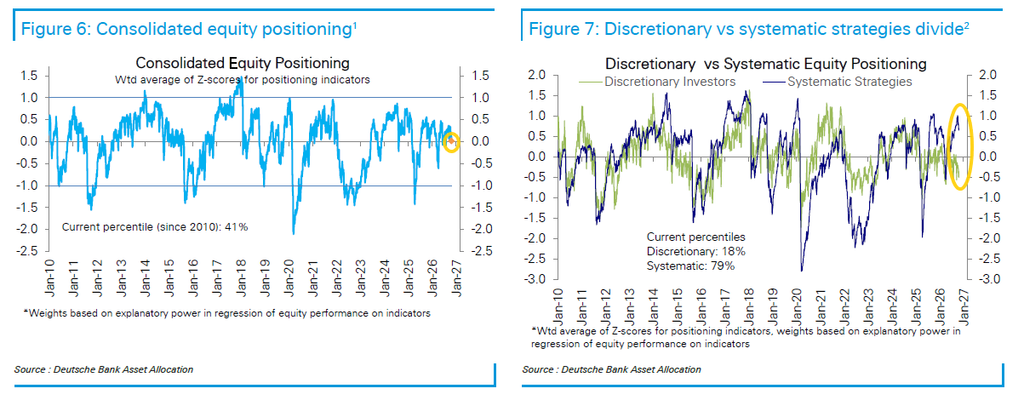
Overall, equity positioning has now fallen to neutral (0.02sd, 41st percentile), with discretionary investor positioning (-0.50sd, 18th percentile) at the lowest in over a month.
Systematic strategies’ positioning (0.65sd, 79th percentile) also fell this week from elevated levels but is still overweight.
Positioning in large caps (0.28sd, 59th percentile) declined to modestly overweight, whereas in small caps (-0.79sd, 12th percentile) it has declined sharply to its biggest underweight since April 2023.
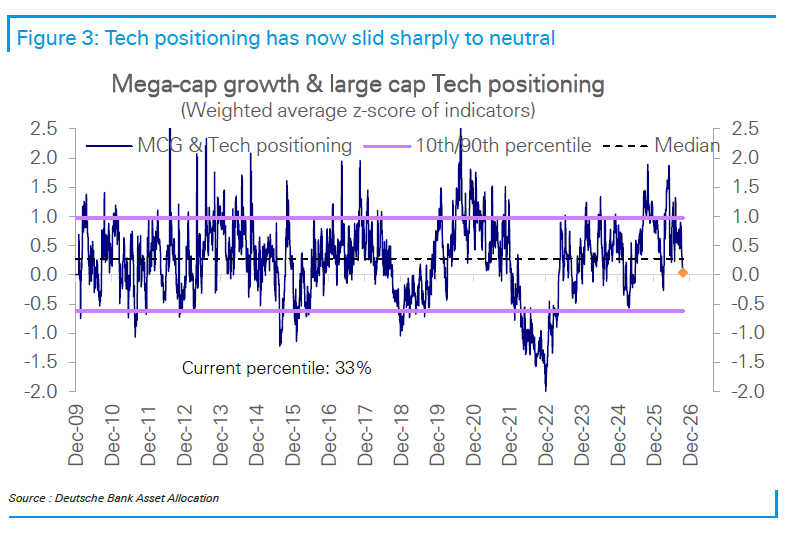
Tech positioning has plunged since the early-October peak from near the top of its historical range (85th percentile) to neutral and is now near Iran-war lows.
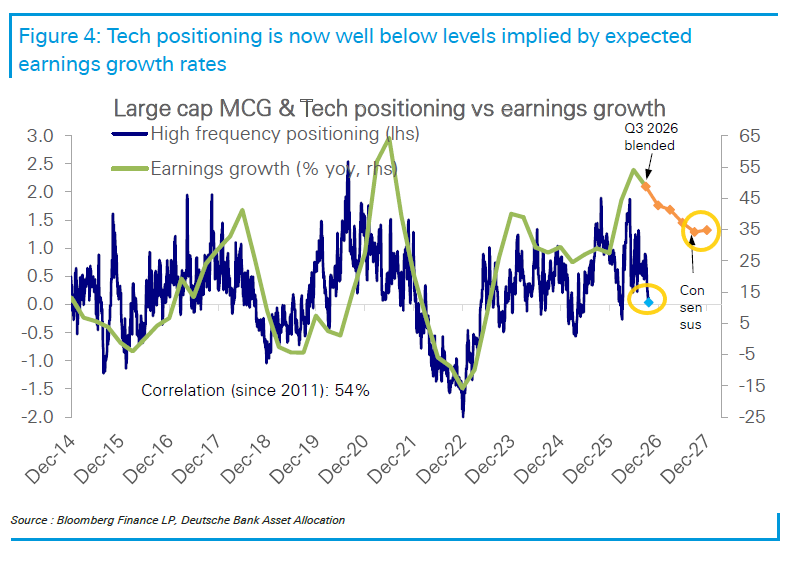
Tech positioning is well below levels implied by earnings growth.
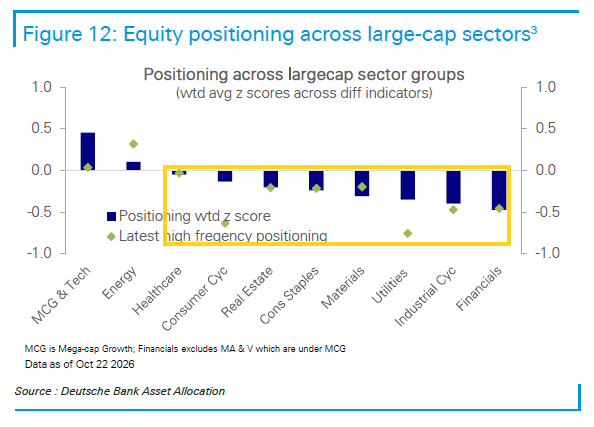
Positioning in most other sectors rose this week but is still neutral to underweight, except for Energy where it is modestly above neutral.
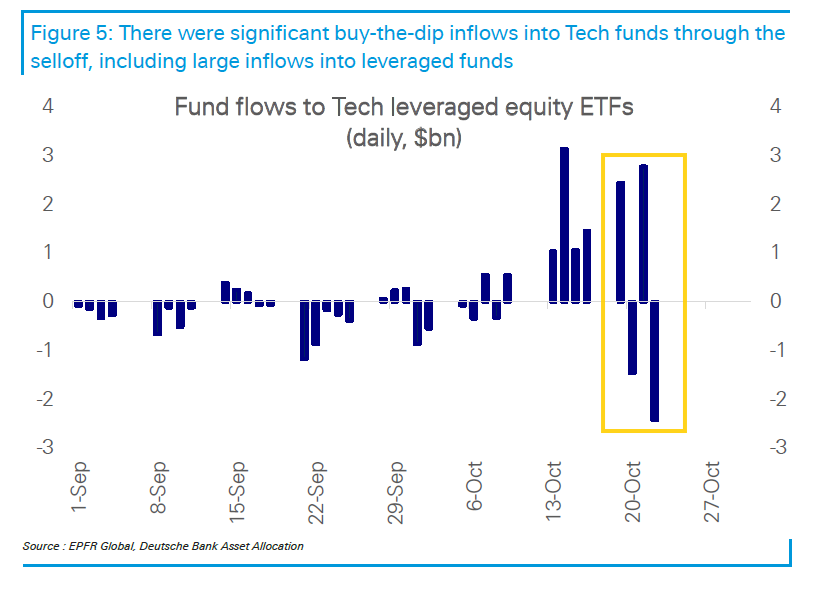
In terms of flows, DB saw consistent inflows the prior week, but last week was very volatile:
Thursday’s selloff this week was accompanied by outflows of $1.5bn. If the recent inflows into Tech continue to get unwound, it could prolong the selloff, but it also speaks to the underlying risk appetite and potential for sharp V-turns in the other direction if sentiment shifts.
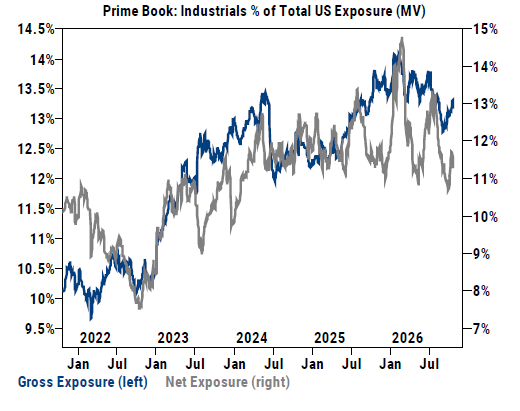
Goldman didn’t get into Tech in their hedge fund report but noted significant selling in Industrials:
HFs net sold the sector for a 2nd straight week (7 of last 8) and at the fastest pace in more than 6 months (-1.8 SDs 1-year). Ground Transportation (long-and-short sales), Electrical Equip (long-and-short sales), Trading Companies & Distributors (short sales), and Construction & Engineering (long sales) were the most net sold subsectors, while Aerospace & Defense (long buys)–and to a lesser extent – Airlines (short covers), Professional Svcs (short covers), and Air Freight & Logistics (short covers) were the most net bought. Industrials gross/net allocations (% of total US Prime book) now stand at 13.2%/11.4%, in the 15th/25th and 62nd/26th percentile vs. the past year.
But as you might expect the recent strength in Staples (as well as Real Estate, both up three straight weeks) saw performance chasing from hedge funds last week although positioning remains low:
Staples and Real Estate (i.e., defensives & bond proxies) were by far the most net bought US sectors in both $ and SD terms, driven by long buys and to a lesser extent short covers. This week’s % net buying was the largest since Jul ’25 for Staples (+1.8 SDs 1-year) and the largest in more than 5 years for Real Estate (+2.4 SDs 1-year).
[Still,] US Staples long/short ratio now stands at 0.97 (slightly net short), in the 39th/13th percentile vs. the past year/three years. US Real Estate long/short ratio now stands at 1.55, in the 44th/32nd percentiles vs. the past year/three years.
Overall hedge fund net positioning got more extreme this week with Goldman seeing hedge fund gross leverage increasing to the 64th 1-year percentile while net leverage fell further to 43.4% (it can’t get any lower than the 0 five-year percentile), meaning hedge funds are running their smallest net long in at least five years. Unsurprisingly then the long/short ratio remained at the 0 percentile over the 1, 3, and 5-year lookbacks. Only around liberation day has been lower.
Goldman’s strategists added:
Rotations in the equity market this week reflected a sharp hedge fund derisking.
On Thursday our Hedge Fund VIP long/short basket pair fell by 4%, a decline only rivaled during the past decade on DeepSeek Monday in January 2025 and during the COVID sell-off in March 2020.
Likewise, GS Prime Services data show a large decline in gross leverage that has contributed to an unusually challenging environment for hedge fund returns. Following the unwind of the last two weeks, they estimate that fundamental hedge fund net leverage registers close to 5-year lows while gross leverage remains well above historical averages.
And Nomura’s McElligott says the action this week, which resulted in a “traumatic risk-management unwind” that saw 124 pair trades stop out on the firm’s Long/Short monitor including 47 greater than three standard deviations, 26 greater than four and 6 greater than five, will just further incentivize hedge funds to “‘Survive Drawdowns’ and avoid having their Capital culled ahead of the new year PNL turn…so it’s ‘De-risking and Shut-It-Down’ -mode even if some juicy looking trades are there.”
This also he says explains why the VIX has remained relatively contained despite the broad derisking:
‘THE’ incremental leveraged Equities $ is no longer ‘Long-Short Eq HFs’ running high Nets, but instead, ‘Multi-Strat Market-Neutral’ running low / no Net, i.e. for every long $ there is a short $, as an substantial reason IMHO as to why ‘Corr 1’ moves in Equities have become ever-increasingly rare, and require a true ‘Macro Tail Shock’.
Turning to systematic positioning, BofA saw significant selling from the systematic community last week and sees CTAs now into a sell cycle.
CTA equity positioning continues to narrow following another difficult week for technology shares. Price trends are projected to weaken across most equity markets next week. Higher realized volatility could also reduce position sizes where CTAs remain long.
S&P 500 futures are now the only equity market in this report with consensus long positioning across model speeds and risk tolerances, but that exposure is increasingly at risk, with the first sell trigger only 0.5% below current levels.
As they noted, the sell trigger for the S&P 500 now sits just around −0.5% away (from ~−1.1% last week), and it’s now the only equity market in BofA’s report where CTAs are still long across all model speeds. The Nasdaq-100’s sell trigger is even closer at ~−0.2% (from ~−0.9%). For the Russell 2000 they see a sell trigger at ~−3.0% (from essentially at its trigger last week) along with a buy trigger at +2.4%.
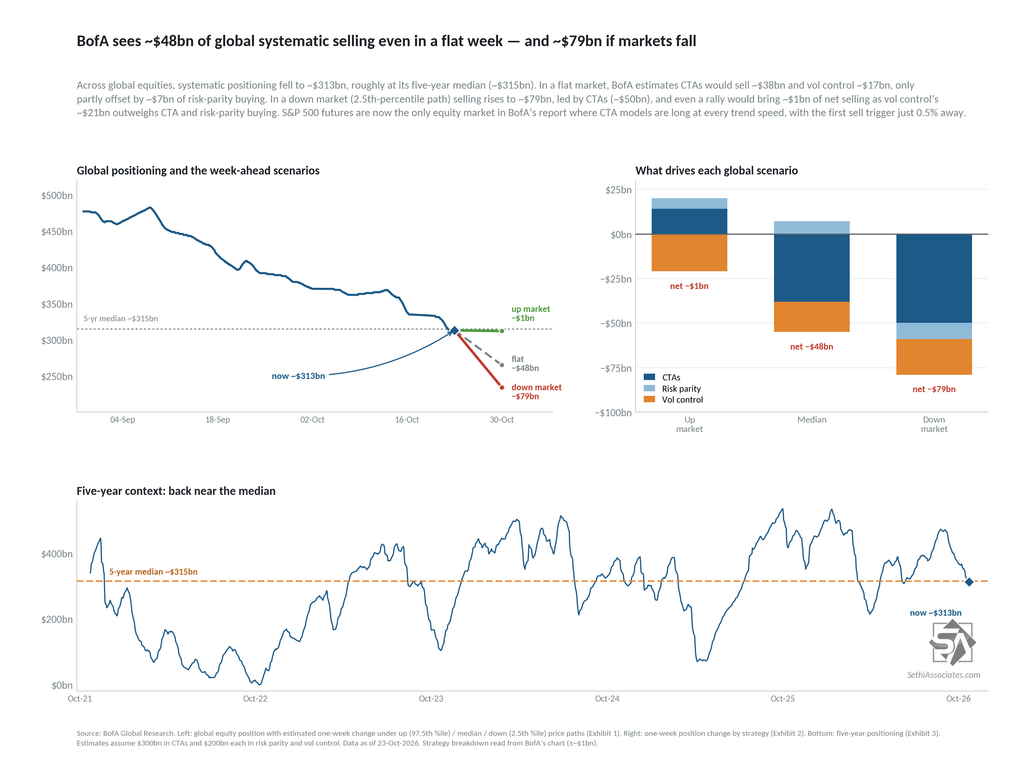
Globally they see selling in all scenarios for the upcoming week:
−$79B of selling in a “down” market (defined as the 2.5th percentile price path or ~−2.9%, different than Goldman who uses −4.5%; from −$81B last week), with CTAs selling ~$50B, vol control ~$20B and risk parity ~$9B
−$48B of selling in a flat market (from −$10B last week) as selling from CTAs (~$38B) and vol control (~$17B) more than offsets ~$7B of buying from risk parity
−$1B of selling in an “up” market (defined as the 97.5th percentile price path or ~+3.5%, similar to Goldman; from −$3B last week) as ~$21B of vol-control selling offsets buying from CTAs (~$14B) and risk parity (~$6B).
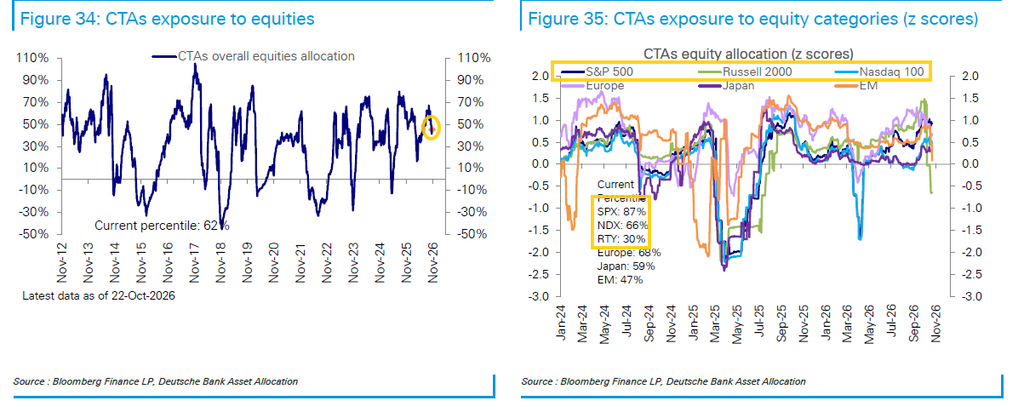
DB says they saw global CTA positioning as having declined to the 62nd percentile to 2010 from the 66th the prior week (but down from the 89th six weeks ago), but they see positioning remaining relatively full in the S&P 500 at the 87th percentile. The Russell 2000 though is at just the 30th percentile, while the Nasdaq-100 fell to the 66th.
Looking at vol control* positioning, with the increased volatility DB saw a healthy drop to the 81st percentile since 2010 from the 98th the prior week
*vol control strategies enter and exit based on changes in volatility over past windows (mostly 1-month and 3-month).
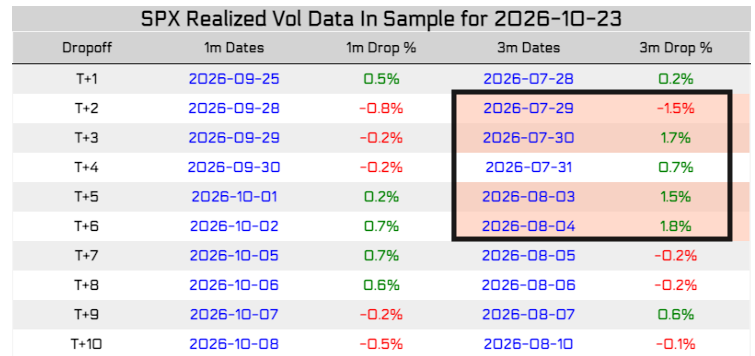
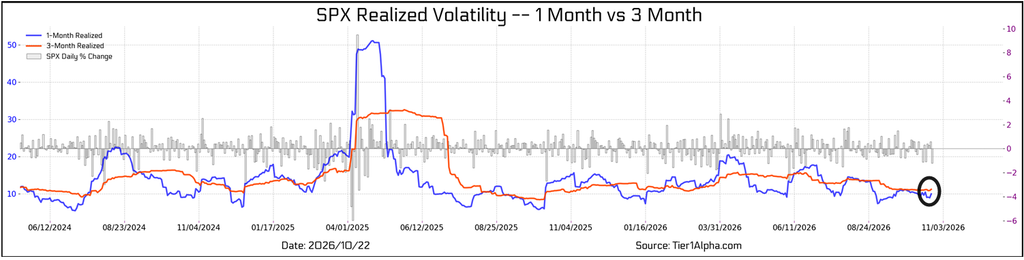
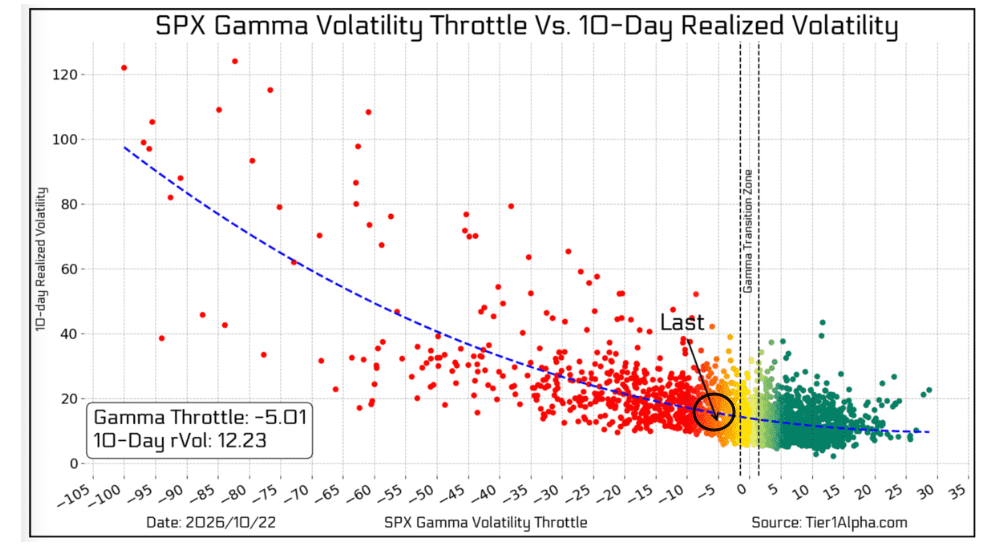
Normally I’d expect quite a bit of continued selling from vol control in the coming week, but the setup is much more favorable than in past weeks: four days with moves of at least 1.5% fall off the 3-month lookback, which Tier1Alpha says is the predominant volatility trigger as it remains above the 1-month. The 1-month lookback is much less favorable, with no 1% days and three 0.2% days rolling off.
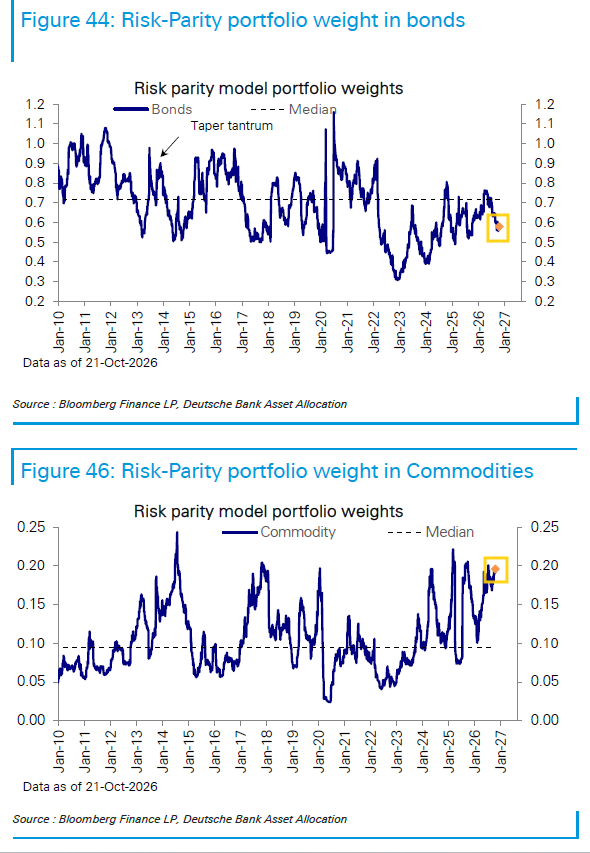
While for risk parity* DB saw no change in US equity allocations remaining at the 85th percentile. Bond exposure though “remained below historical norms” while commodities remained elevated (percentiles weren’t given this week).
*Risk parity funds balance risk across asset classes based on relative volatility, often using leverage, to reach a target portfolio risk level.
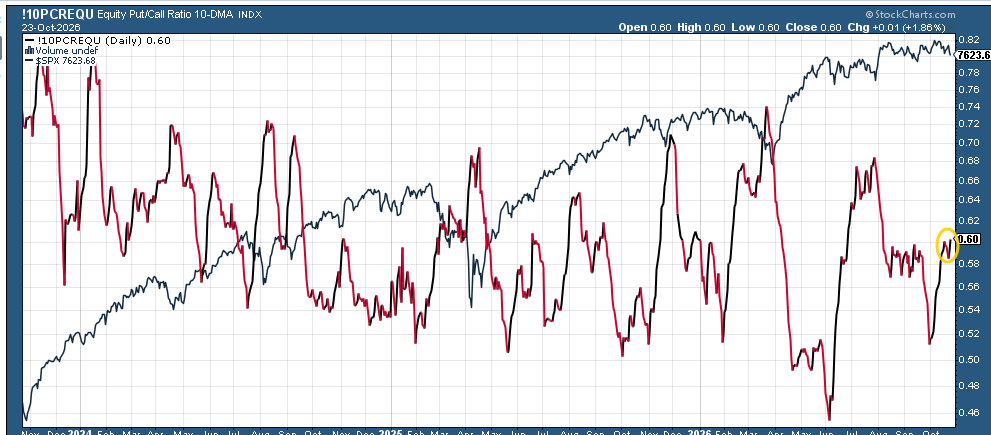
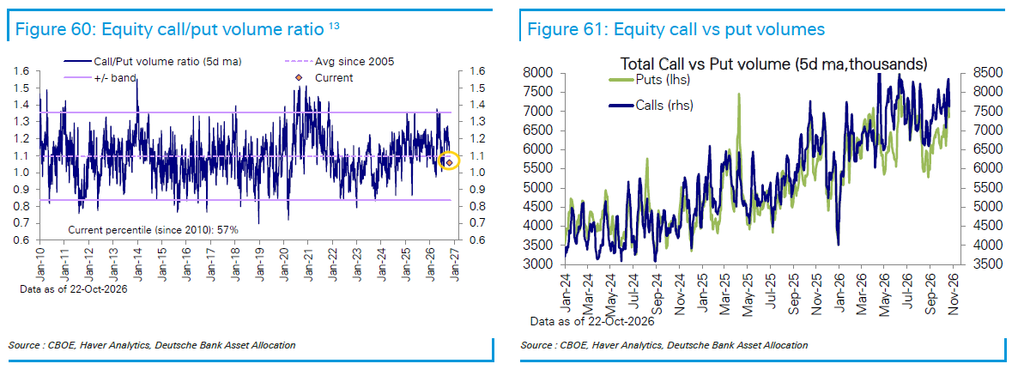
The equity put/call ratio (10-DMA) edged up to the highest since early August, though it was little changed from the prior week.
But DB said the 5-DMA of call/put volume fell for a fourth week to the 57th percentile from the 77th the prior week and 90th four weeks ago.
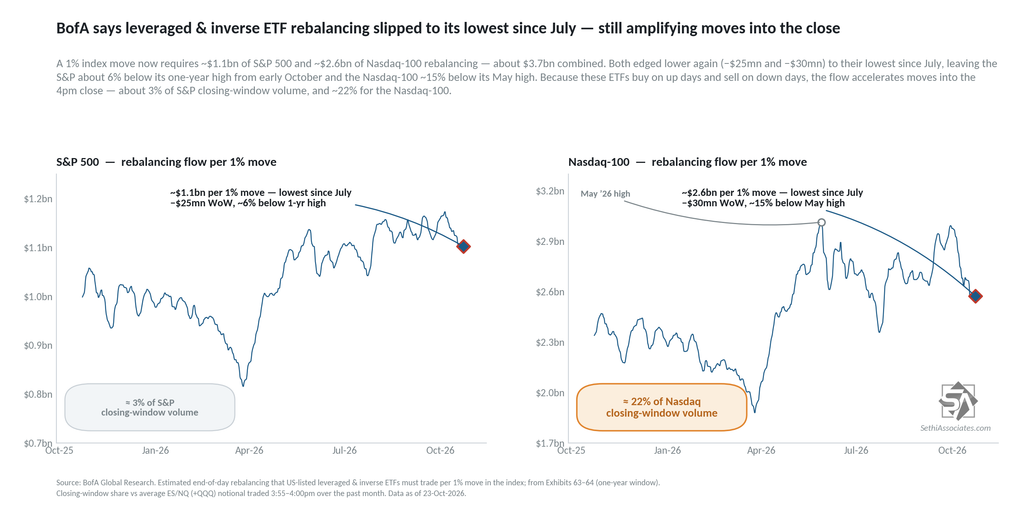
Like call buying, leveraged positioning acts as a “negative gamma source” as Charlie McElligott has put it (meaning that there is added buying/selling pressure from them in the direction of daily flows as they rebalance each day).
BofA estimates that rebalancing flows for SPX and Nasdaq-100 leveraged ETFs fell back again along with the equity declines last week now the least since July.
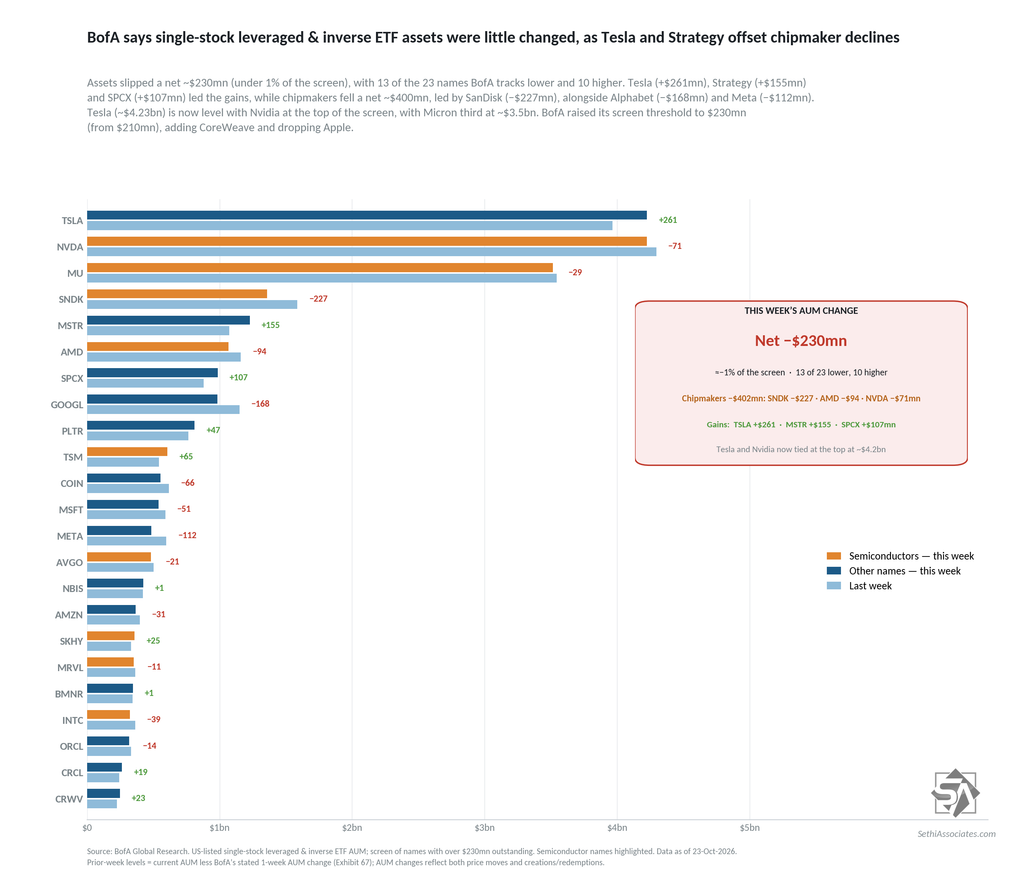
Interestingly, single-stock leveraged ETF AUM was little changed, easing just $230M after the prior week’s $5.2B drop, as gains in Tesla (TSLA) and Strategy (MSTR) offset chipmaker declines.
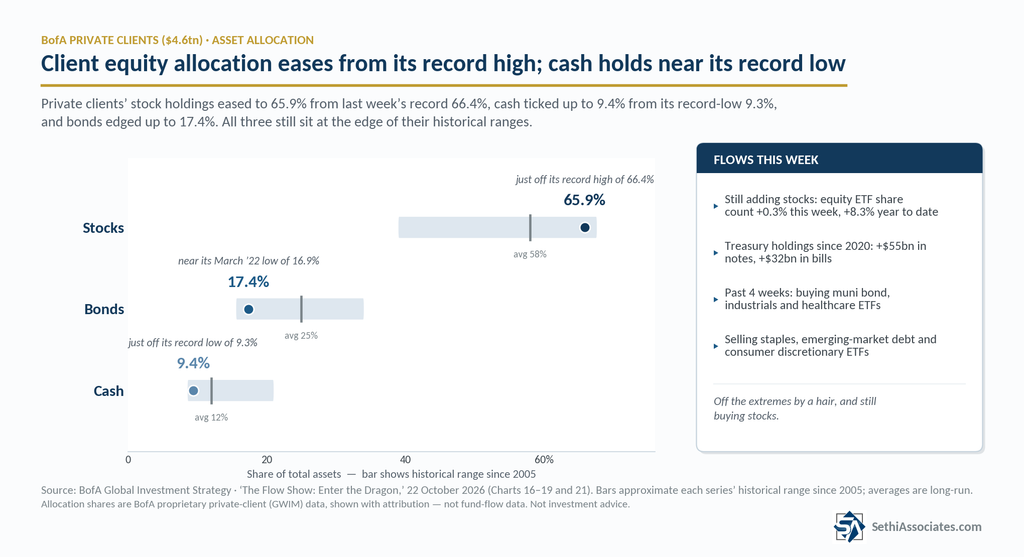
Turning to retail positioning, BofA private clients ($4.6tn AUM) saw their stock allocations drop to 65.9% from last week’s record 66.4%, much of it likely the result of the weakness in equities, while cash ticked up to 9.4% from its record-low 9.3% and bonds edged up to 17.4%.
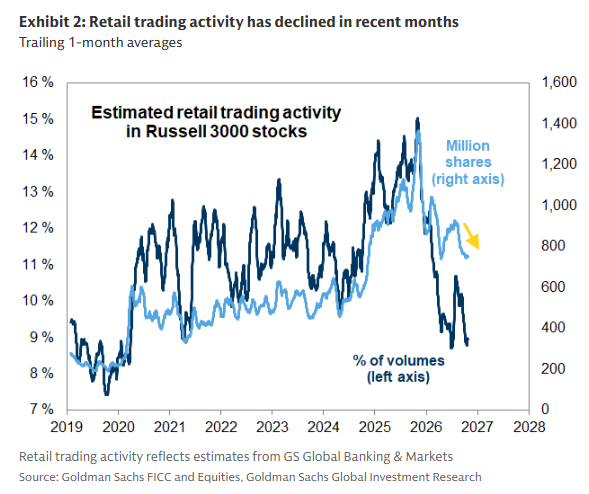
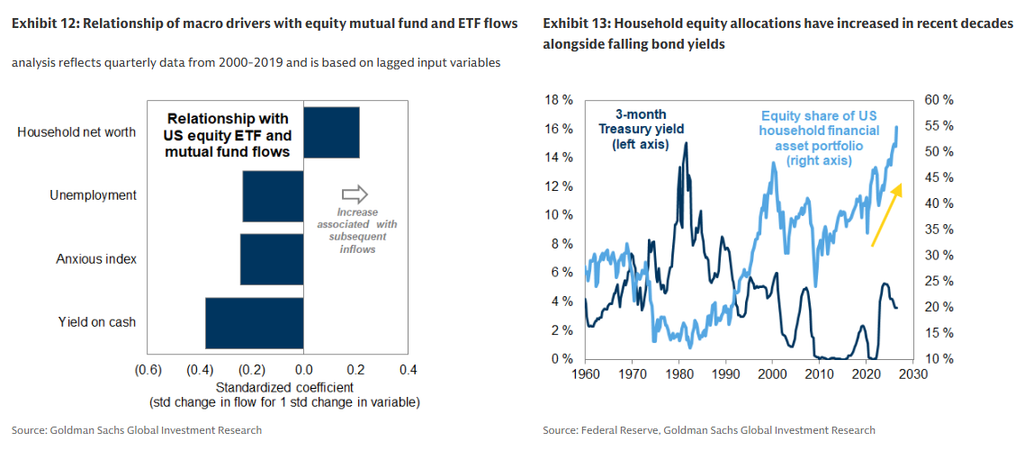
Goldman published a long piece on retail this weekend. Here are its highlights:
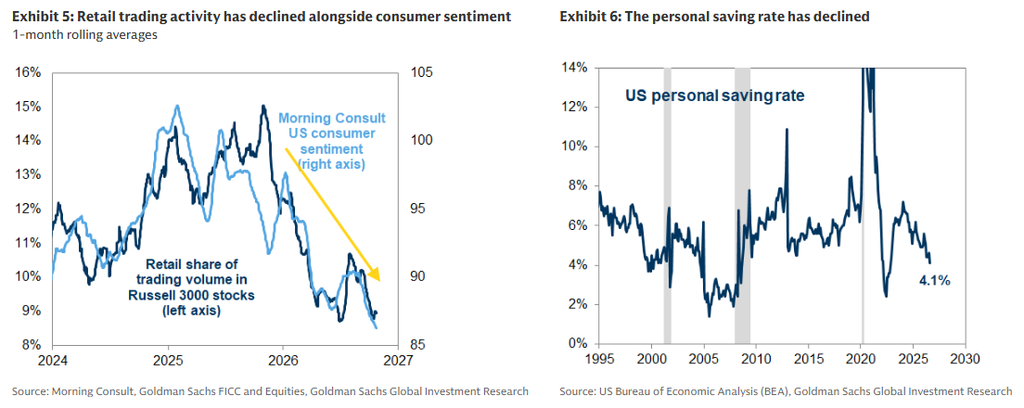
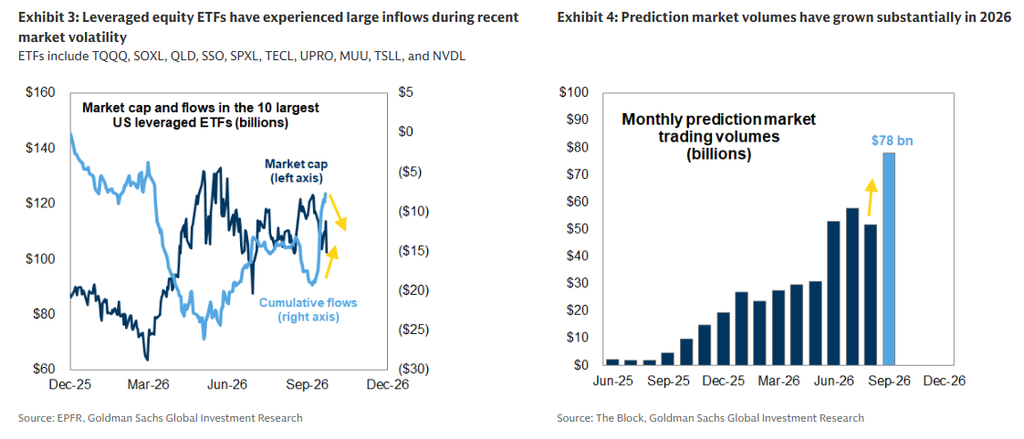
A sharp hedge fund derisking this week and an ongoing increase in equity supply underscore the importance of household demand for US equities. While very recent increases in retail trading activity and leveraged ETF flows have signaled an ongoing “buy the dip” mentality, retail trading volumes in US equities have declined by 20% since the summer and 45% since late 2025. Likewise, after surging in mid-2025, our Speculative Trading Indicator has turned lower in recent months.
Weak consumer sentiment and elevated energy prices likely explain most of the reduction in retail trading activity. In addition to leveraged ETFs, equity options and prediction markets have become fast-growing alternatives for retail traders. Monthly prediction market volumes have grown to $78 billion in September from $5 billion a year ago. However, this increase remains small relative to retail equity volumes, and the decline in trading activity appears broadly consistent with the recent downturns in consumer sentiment and personal saving rates alongside rising energy prices.
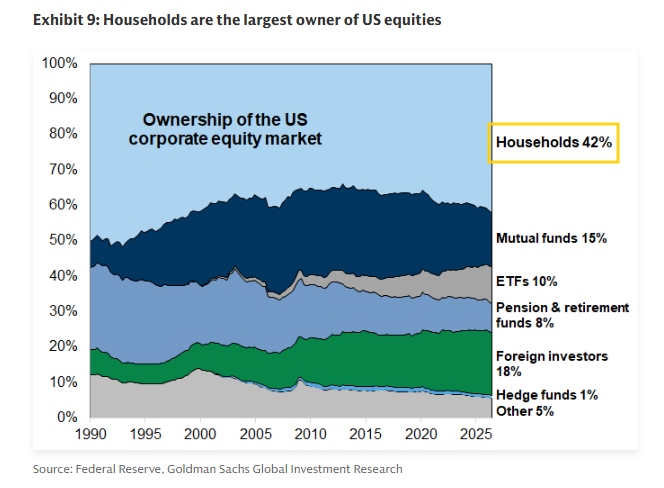
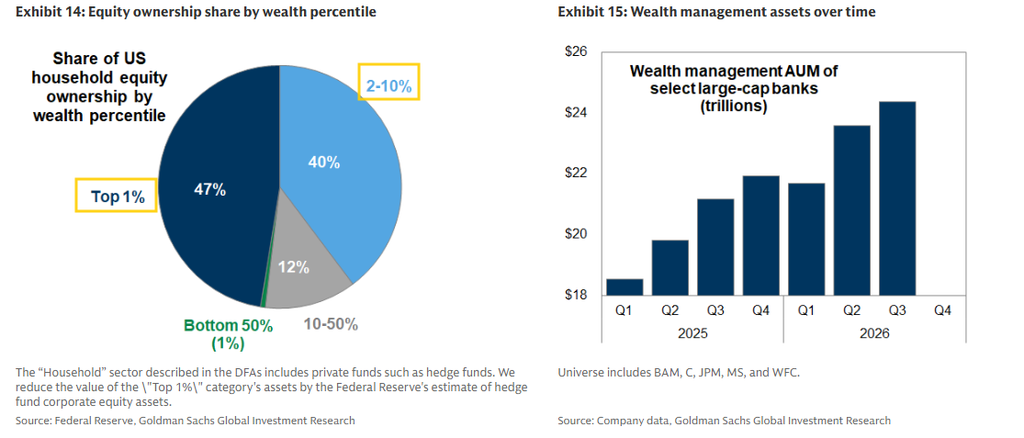
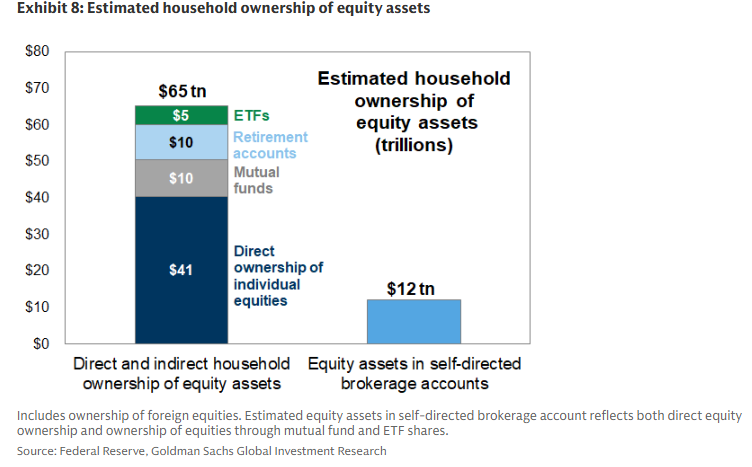
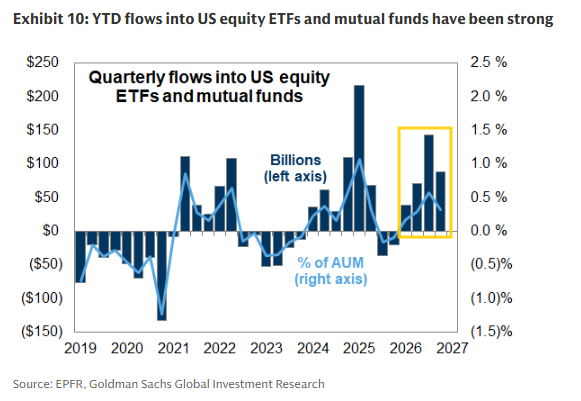
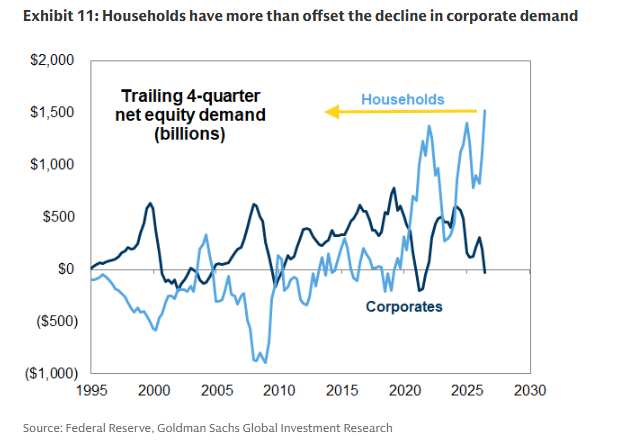
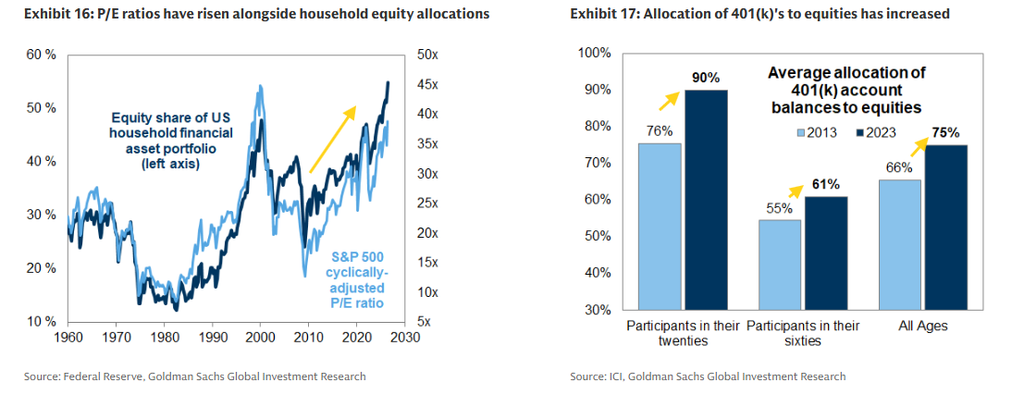
Despite a decline in retail trading, broader household demand for US equities has been extremely strong this year. Households directly own 42% of the US equity market and control the majority including indirect ownership via investment funds. The top 10% of households by wealth own 87% of total household equity assets. We estimate that the $12 trillion of equity assets in self-directed brokerage accounts amount to just 18% of US household equity assets, including both directly- and indirectly-owned equities. Federal Reserve data suggest that households bought $840 billion of US equities in H1 2026, more than offsetting a decline in net equity demand from US corporates. Higher-frequency mutual fund and ETF flows show continued strong demand in recent months.
Going forward, the trajectory of the labor market and interest rates will be key determinants of household equity demand, which in turn will help determine the near- and long-term path of US equities. Household equity demand is sensitive to employment, wealth, and the competition from yields on cash and bonds. Our baseline forecasts suggest household demand will remain solid in 2027, although recent macro volatility is a reminder of the risks around those forecasts. Looking further ahead, a secular shift in retirement asset allocation is a tailwind for equity demand, while interest rates and AI-related disruption are key sources of uncertainty
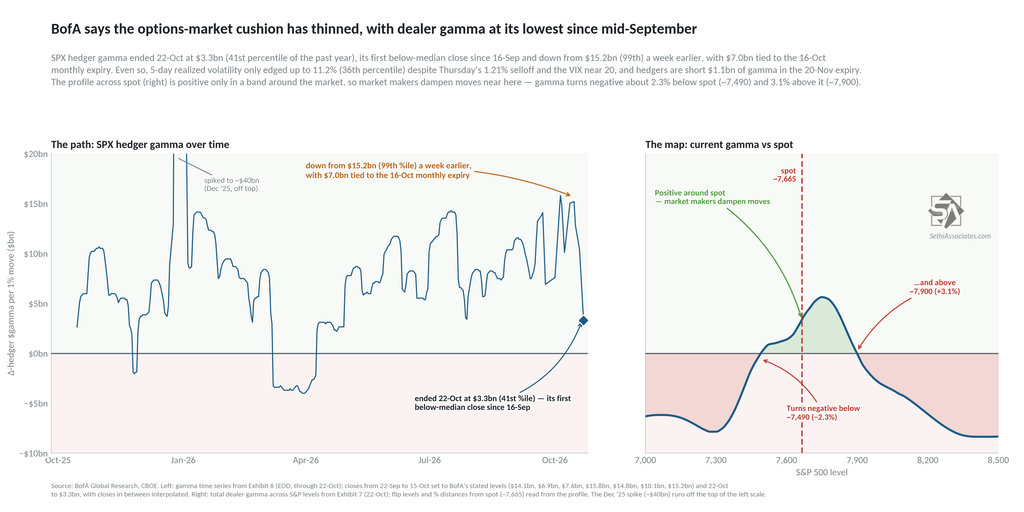
And turning to gamma*, BofA saw SPX gamma drop to $3.3B last Thursday, “the first below-median reading since” September 16th. They said “1DTE selling flow returned this week.”
They still model gamma as positive, but that “mountain” has shrunk like melting snow, with much less of a dampening effect. In their view, it won’t turn negative unless we see another 2.3% drop from Friday’s levels.
*Gamma plays an important, if nebulous, role in market volatility. Positive gamma means options market makers buy and sell against price moves, which dampens volatility. Negative gamma means the reverse: market makers trade with the move, accelerating rallies and selloffs and adding to volatility.
Tier1Alpha though sees “dealers modestly short gamma, which means market makers will have to hedge in the same direction as the underlying momentum, creating the mechanism that drives volatility higher.”
We’ll see what they say Monday morning.
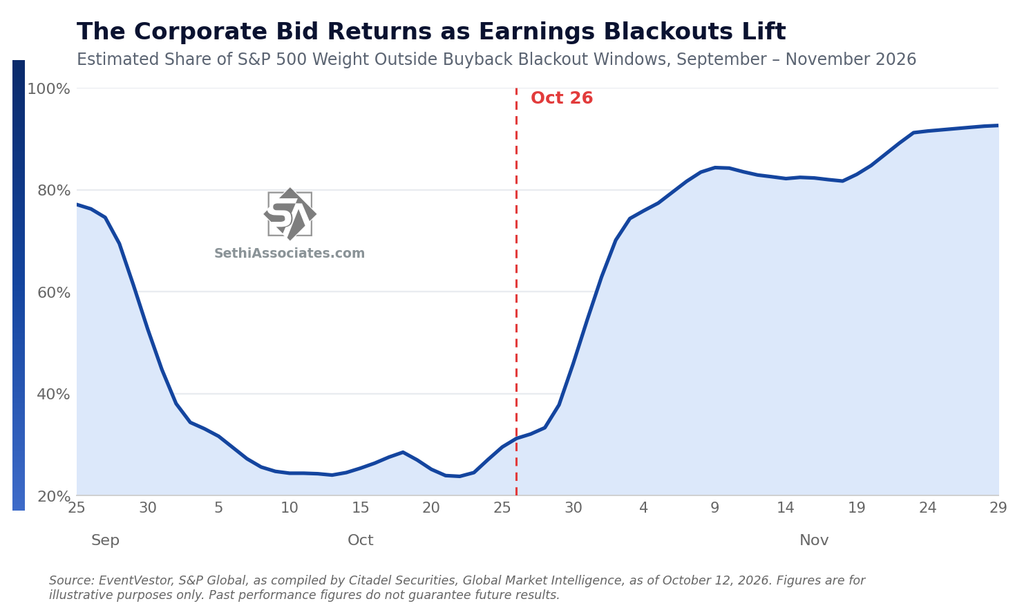
Turning to corporate buybacks (an important source of underlying demand), we remain deeply into the buyback blackout period with just around 30% of discretionary buybacks by index weight for S&P 500 companies active as of Monday (discretionary buybacks represent ~30% of all buybacks), but we are now past the lows and will steadily build higher from here, with this week’s batch of earnings a significant point that will see them sharply accelerate over the following two weeks.
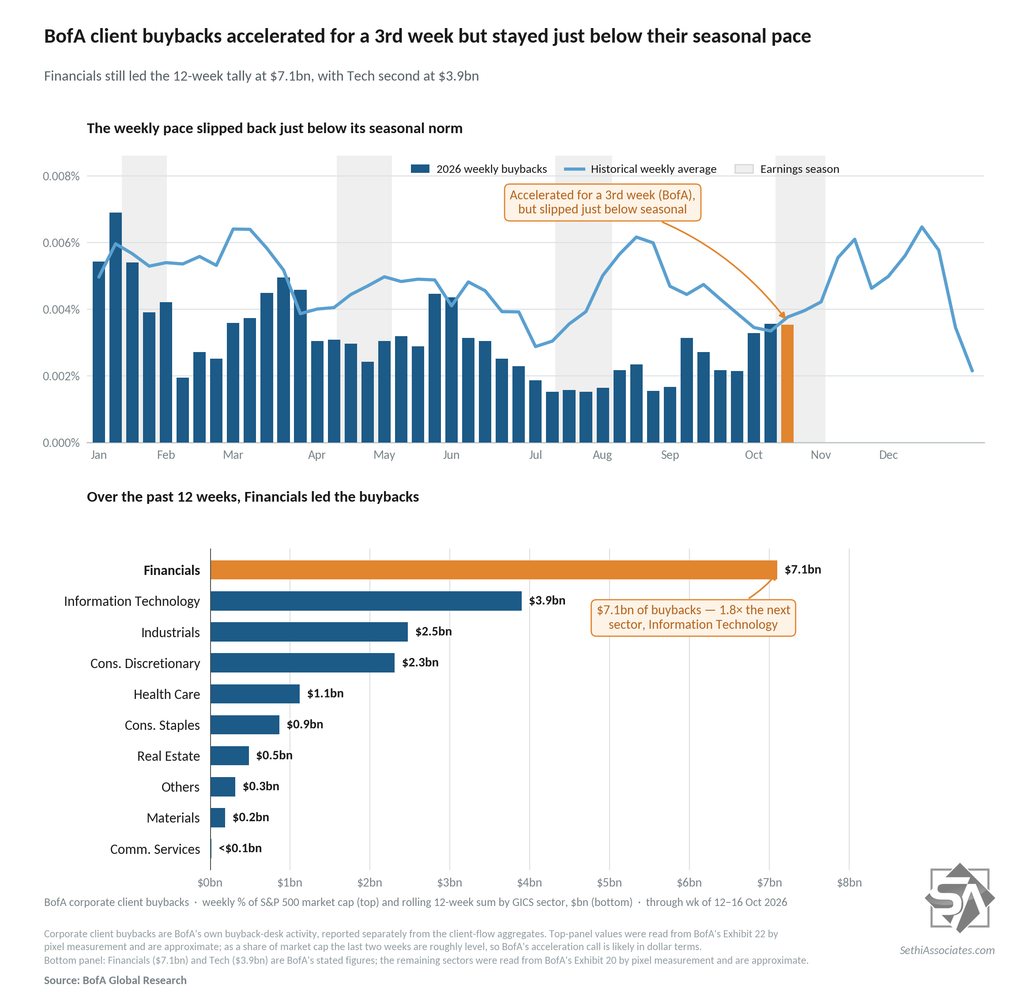
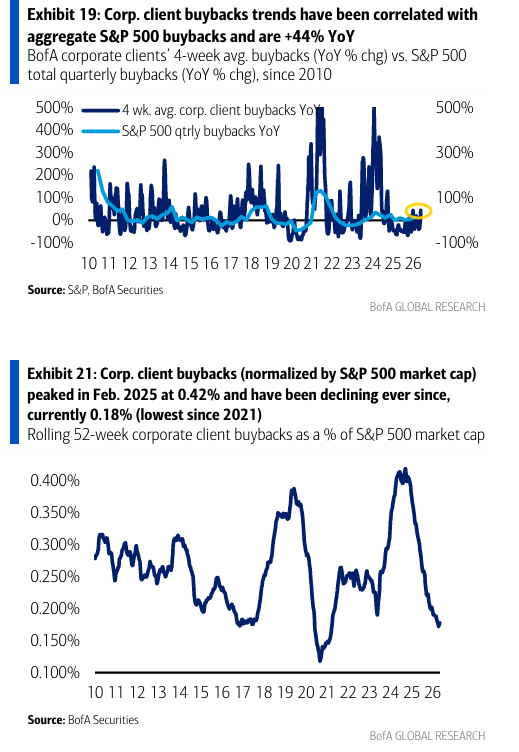
BofA saw corporate client buybacks accelerate for a third week last week, though they slipped just below their seasonal average. On a 4-week average basis they jumped to +44% vs the year earlier, one of the highest readings over the past two years, from +3% the prior week and -22% the week before. Financials still lead the past 12 weeks at $7.1B, nearly twice the next sector, Tech ($3.9B).
“Rolling 52-wk buybacks as a % of S&P 500 market cap are currently the lowest since Aug. 2021.”
Sentiment Eased Further But Still Not Washed Out
Sentiment (which I treat separately from positioning) is one of those things that is generally positive for equities when it’s above average but not extreme (“it takes bulls to have a bull market”, etc.), although it can stay at extreme levels for longer than people think, so really it’s most helpful when it’s at extreme lows (“washed out”).
Sentiment indices were more broadly weak this week, and some are pushing into extreme levels..
American Association of Individual Investors (AAII), a retail focused weekly investor survey,moves more bearish:
AAII Bulls (those who see higher stock prices in 6 mths, blue line) eased to 36.9% from 38.7% the prior week (still though above the 28.8% five weeks ago, which was the least since September 2025), and falling back below the long-term historic average of 37.5% after two weeks above.
Bulls also remained below the level of the Bears (who see lower stock prices in 6 mths, red line), as the Bears rose to 45.8% from 41.6% the prior week (still though below the 53.3% five weeks ago, the highest since May 2025). That leaves Bulls above Bears just twice in the last 14 weeks. Bears also remain above the long-term average of 31.0% for a 36th straight week (and they’ve only been below it 9 weeks since Dec 12, 2024).
The Neutral camp (yellow line) dropped to 17.3%, the least since early April, from 19.7%. It remains under the long-run average of 31.5% and has been over that only twice since July 2024.
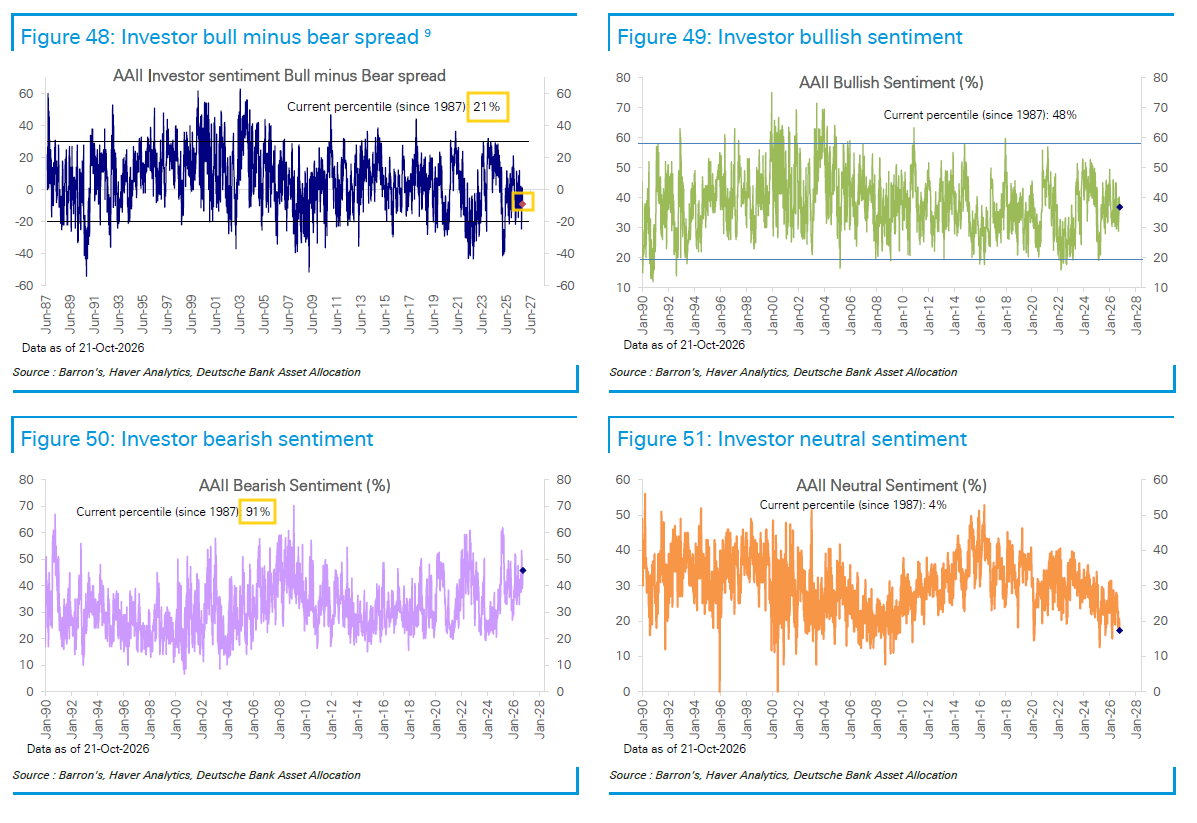
DB notes the bull-bear spread fell back to the 21st percentile to 1987 although still well above the 4th a month ago. Bearish sentiment though rose to the 91st percentile while bullish sentiment dropped to the 48th percentile.
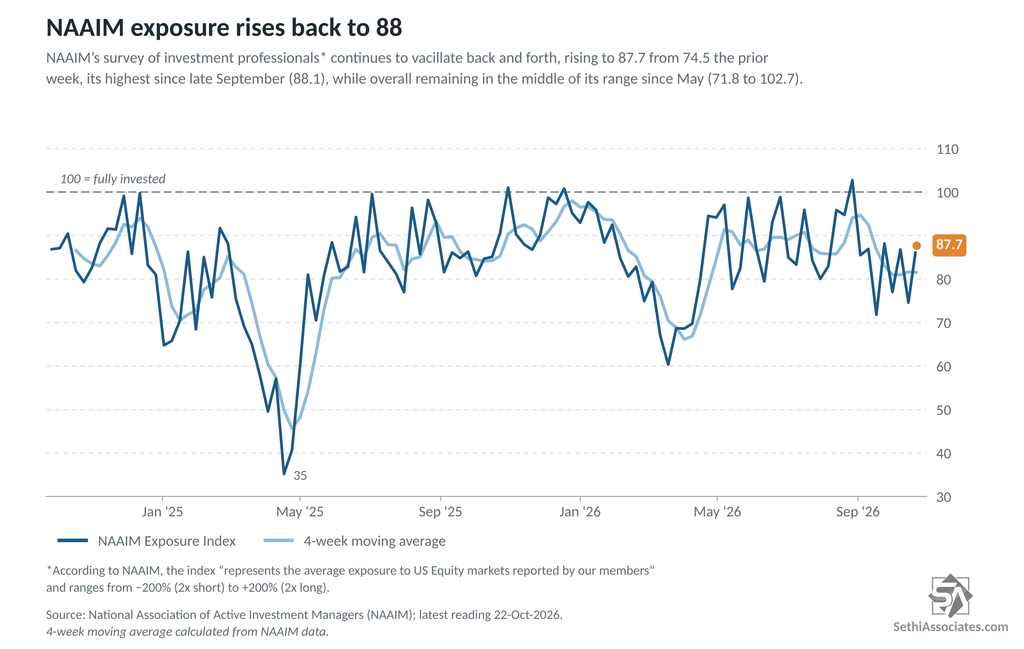
NAAIM’s survey of investment professionals* continues to vacillate back and forth, rising to 87.7 from 74.5 the prior week, its highest since late September (88.1), while overall remaining in the middle of its range since May (71.8 to 102.7).
*The index according to NAAIM “represents the average exposure to US Equity markets reported by our members” and ranges from −200% (2x short) to +200% (2x long).
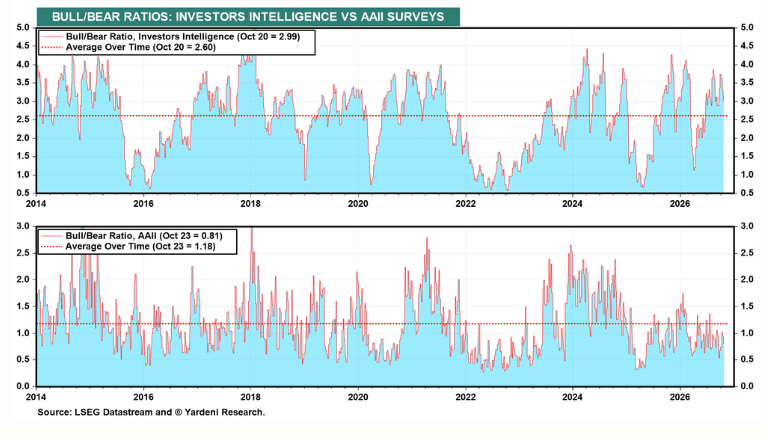
While the Investors Intelligence (independent investment-newsletter writers) survey saw the bull/bear ratio fall for a third week to 2.99 from 3.75 three weeks ago, but still remaining above its average since 2008. Ed Yardeni says “If they fall low enough, that might set the stage for a year-end rally. Then again, there might be a better opportunity to buy the dip when and if bombs start falling again in the Middle East.”
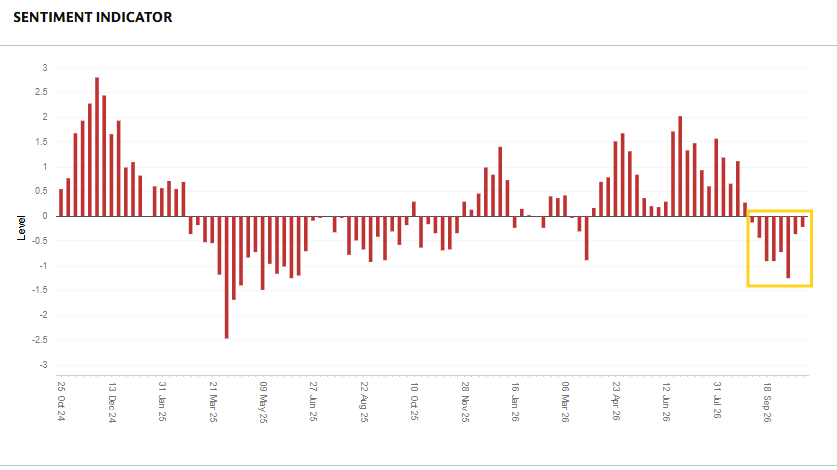
And Goldman’s US Equity Sentiment Indicator* remained negative for a seventh week but at -0.23, the least negative since the first of those weeks.
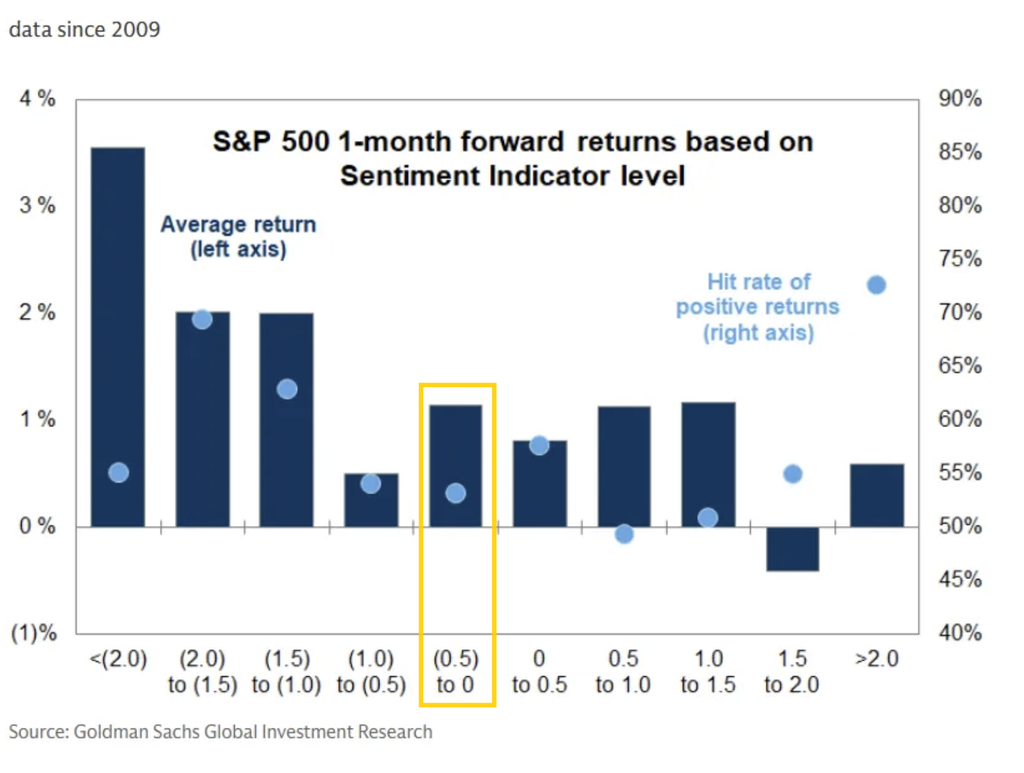
The current reading is associated with a 1-month average return of around 1% since 2009 which is pretty good with a positive rate around 52%.
*The indicator combines “six weekly and three monthly indicators that span [across the more than 80% of the US equity market that is owned by institutional, retail and foreign investors]. Readings of +1.0 or higher have historically signaled stretched equity positioning. Readings of -1.0 or lower have signaled very light positioning and have historically been a statistically significant signal for subsequent S&P 500 performance”.
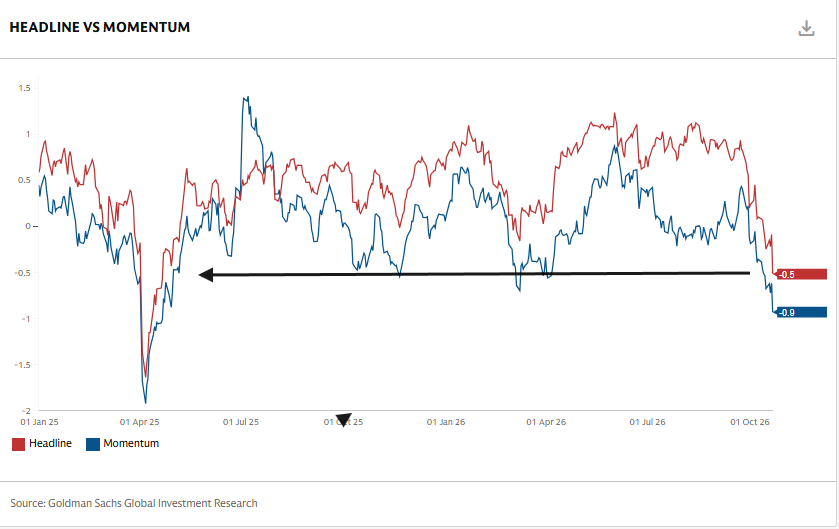
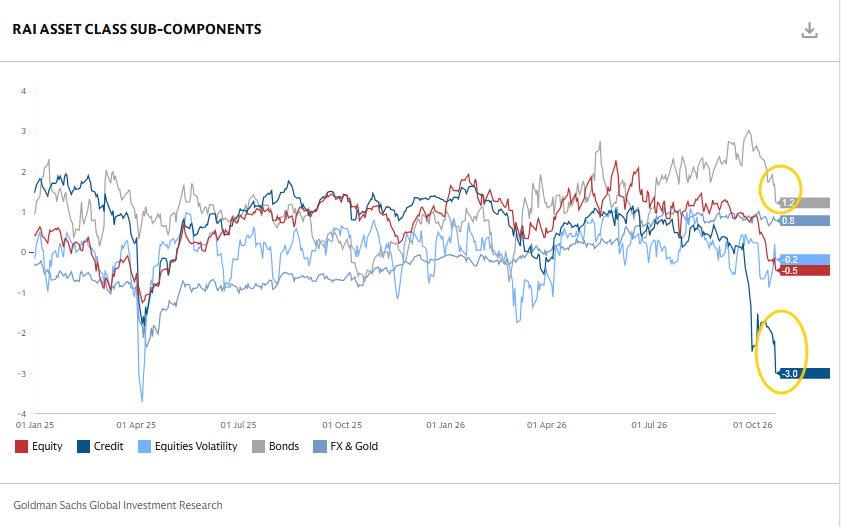
While Goldman’s Risk Appetite Indicator* fell for a fourth week now down to -0.5, the least since April 2025, from 0.8 four weeks ago. The momentum index fell to -0.9, also the least since April 2025.
This week’s decline was led by drops in equities and credit.
*”Goldman Sachs Risk Appetite Indicator (RAI) aims to track the level of global market risk appetite and risk aversion based on various market variables. A sharp rise in the index can send a warning signal that investors have more risk appetite and are potentially exposed to a correction if consensus views are tested. Similarly, a sharp decline indicates a reduction in risk appetite, and at extreme levels it can indicate that markets may have overshot. RAI signals are most powerful when the level of risk appetite is very low below -1.5, with levels closer to -2.0 giving the clearest signal over longer time horizons, as at such levels the asymmetry of subsequent medium term equity return becomes very positively skewed. RAI momentum is designed to track short term shifts of market risk appetite, and subcomponents of the RAI.”
Goldman: “The GS Risk Appetite Indicator saw one of its largest drops on record, now at its lowest level since April of last year. Choppy week overall as we saw a true episode of capitulation and de-grossing on Thursday due to AI financing worries and geopolitical escalation. This led to a notable lack of participation during Friday’s session … -21% vs 5d avg and -33% vs 100d avg – a demonstration of investor fatigue and defensive posturing.”
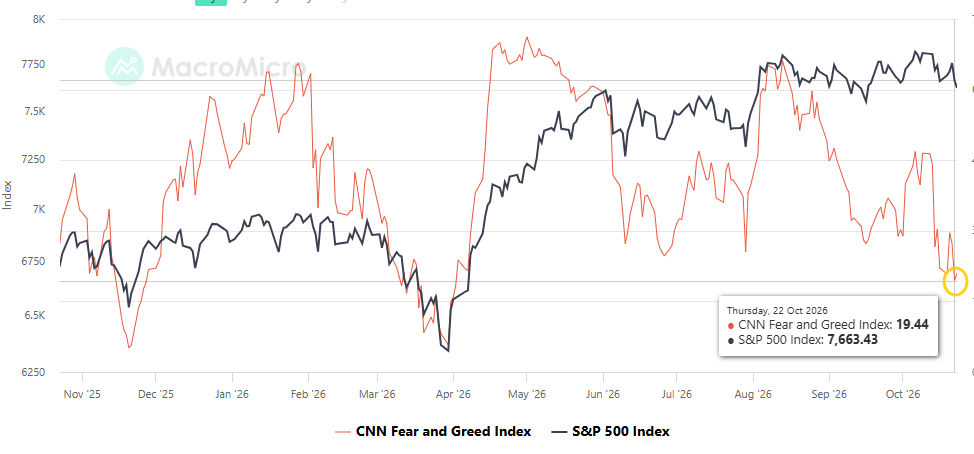
The CNN Fear & Greed Index (blue line) fell to 19.4 on Thursday, the least since April 2nd, down from ~45.0 two weeks ago, falling into “Extreme Fear”. It ended the week at 21.0.
All seven indicators remained below Neutral with six in Extreme Fear.
Extreme Greed = None
Greed = None
Neutral = None
Fear = junk bond demand (vs investment grade)
Extreme Fear = market momentum (SPX vs 125-DMA); stock price strength (net new 52-week highs); stock price breadth (McClellan Volume Summation Index); put/call options (5-day put/call ratio); market volatility (VIX & its 50-DMA); safe haven demand (20-day difference in stock/bond returns)
And I noted in previous weeks if you have any questions on the indicator, TheStreet Pro’s own Jason Meshnick is your guy, as he helped create it.
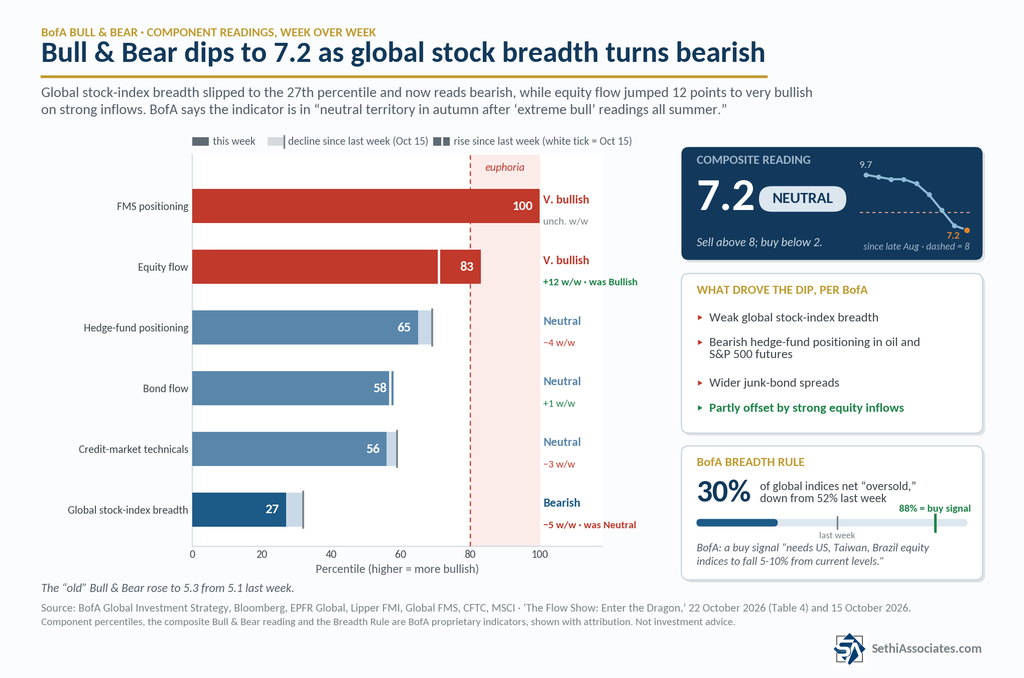
After BofA’s Bull & Bear Indicator dropped below 8.0 last week, ending its sell signal, it eased further to 7.2 from 7.4 “driven by weak global stock index breadth, bearish hedge fund positioning in oil & S&P 500 futures, wider junk bond spreads, partially offset by strong equity inflows.” It’s now in “neutral territory in autumn after ‘extreme bull’ readings all summer.”
Under the hood, global stock breadth now reads bearish at the 27th percentile, while equity flow jumped to very bullish at the 83rd. Fund-manager positioning is still at the 100th percentile.
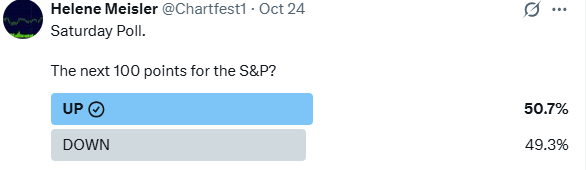
And Helene Meisler‘s followers back to mildly bullish, the third week in four.
You don’t need me to tell you how bad everything looks ex-energy and drugs and staples but everyone hates staples. But there are still no real breaks in the big ones: S&P and Naz. Even IWM hangs tough at 270. Oil and metals are the most interesting.
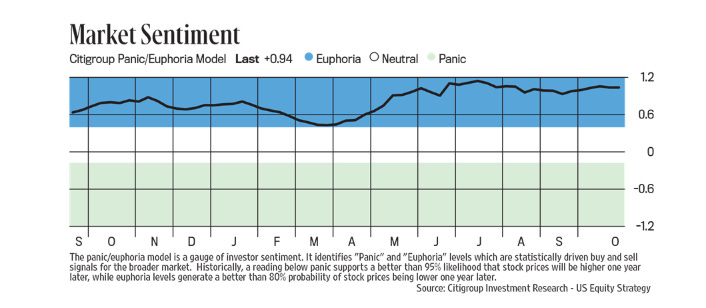
But the Citi panic/euphoria index remains near its 52-week highs.
A Solid Week Seasonally
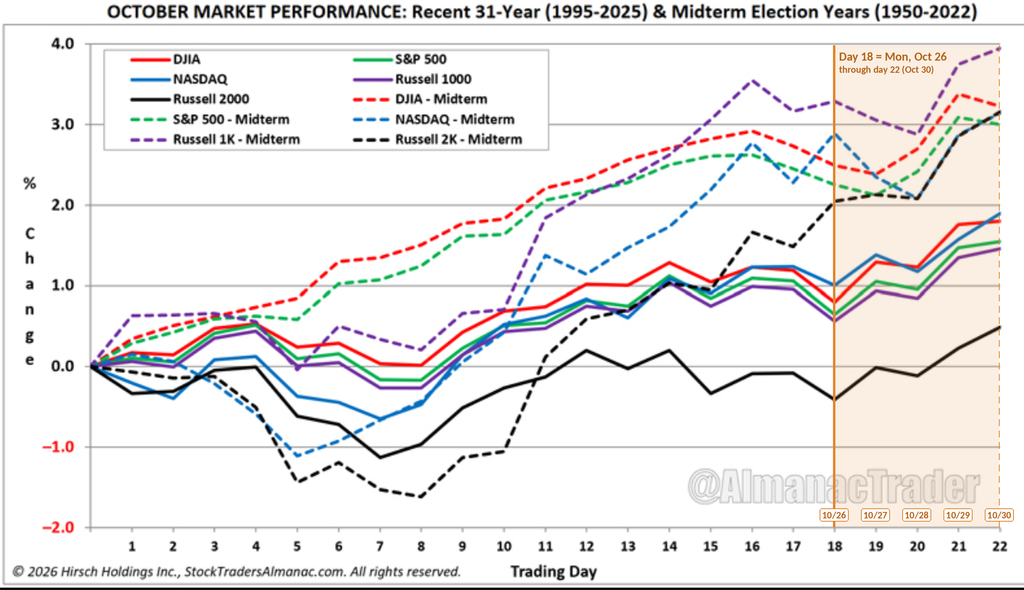
Looking at the seasonality breakdown from Jeff Hirsch, editor of the Stock Trader’s Almanac & Almanac Investor Newsletter, the last week of October has historically closed the month on a firm note, and in midterm years Day 21 (Thursday) has been quite strong.
Monday is trading day 18. Over the past 31 years it has been one of the weaker days of the month, with the major indices down about 0.2–0.4%. Tuesday and Thursday have more than made up for it, each adding roughly 0.3–0.5%, while Wednesday has been about flat. Net, the week has gained about 0.5–0.65% for every major index, including the Russell 2000. That has left October up about 1.5–1.9% on average for the large-cap indices and about 0.5% for the Russell 2000.
Midterm years have been stronger again, led by small caps. The Russell 2000 has gained about 1.6%, the Nasdaq about 0.85%, the Russell 1000 about 0.75%, and the Dow and S&P about 0.5%. Some of that gap reflects which years are averaged: the Russell data only start with the 1982 midterm, while the Dow and S&P go back to 1950. The standout is Thursday, the best day of the week for every midterm line, adding about 0.65–0.85%. For the DJIA, S&P and Russell 1000, that one day has matched or exceeded the entire week’s gain. October has finished up about 3–4% in midterm years, compared with 1.5–1.9% for the large caps across all years.
That hands off to November, the start of what the Almanac calls the “Best Six Months” (November–April), and to the midterm election on Tuesday, November 3rd. Historically, midterms have been followed by strength. The S&P 500 has been higher one year after all 19 midterm elections since 1950, by about 15% on average according to a Motley Fool count, and by 16.6% according to BNY. Even after 1986, with the October 1987 crash in that window, the S&P finished about 1% higher.
Wrap-Up – When Will Tech Bottom?
I said on Friday “I haven’t been this interested to see how all the indicators come out in the Week Ahead for a while, so let’s see where we stand on Sunday.”
I’ll get into those in a minute, but let’s first note that the two forecasters I’ve highlighted the past couple of weeks, Deutsche Bank and Citadel’s Scott Rubner, who looked for a pullback in Tech and a “meaningful test” to equities, respectively, have been spot on (at least as far as Tech and the headline indices go).
And you can add Ed Yardeni to that mix:
On September 15, we advised investors to proceed with caution. We pushed out our 8,400 S&P 500 target from year-end 2026 to mid-2027 and set 7,900 as our new year-end target. On October 14, we reiterated our caution. Sure enough, the stock market has been turbulent since mid-September, with AI-related stocks falling sharply.
We are seeing some buying opportunities, but better ones are likely after the November 3 midterm elections. Our main concern is a likely escalation of the Middle East war. That could push oil prices above their $120 peak earlier this year.
In that regard, DB updated their thoughts this weekend:
Two weeks ago, we tactically downgraded Tech, warning of a potential V-shaped reversal as the risk-reward looked unfavorable following increasingly lopsided relative performance, positioning, and growth perceptions. To say the market has moved quickly since then would be an understatement.
Tech’s relative performance is now well into the lower half of its long-run trend channel, though it has yet to reach the bottom. MCG & Tech underperformed the rest of the S&P 500 by 12 percentage points over the past two weeks, falling 7% while the rest of the index rose 5%.
Relative performance has roughly another 5% to fall before reaching the bottom of the channel, a level from which it has reversed several times previously. In two of the past five rotations, Tech modestly undershot the channel’s lower boundary. In our view, however, those overshoots were driven by exogenous shocks—Liberation Day and the Iran war.
The last two reversals higher in Tech coincided with strong earnings releases. In late July, Tech relative performance bounced off the bottom of the channel, coinciding with blockbuster earnings results. And in April, the unfolding rebound out of the Iran-war selloff also accelerated further through the earnings season.
With another batch of key Tech earnings due next week, we note that, while the prevailing concerns are about medium-term and not near-term growth, Tech positioning is now in line with growth of around 10%, far below the 50% that is expected for Q3 or even the 35% by the end of next year. However, given concerns around the cost of capital and potential shifts in policy and regulations, the market will also be focused on the FOMC next week and the US mid-term elections the week after.
So not quite an “all clear” from Deutsche Bank yet. Getting through the midterms is a recurring theme across most of the equity coverage I follow. Once we’re past them, that risk is cleared, and the October FOMC (which I expect to be a snoozer, but you never know) will be behind us too. We’ll also be past the Oct. 31 tax year-end for most mutual funds. Hedge funds keep score through Dec. 31, though, so their “De-risking and Shut-It-Down” mode, as Charlie McElligott put it, could linger a bit longer.
That said, it looks increasingly likely that we get an escalation in Iran after the midterms, which I’d expect to be risk-off until it’s resolved. So I wouldn’t put in a buy order for November 4th just yet. But I think this will be a “one last push” by the administration to salvage what they can from the Iran situation (many think the regime is in very bad shape and that this is what’s needed to get it to capitulate or risk collapse).
After that, I think a year-end rally is quite likely. Positioning has been cut sharply, with hedge fund net leverage near five-year lows, discretionary positioning underweight, and systematic positioning now back towards neutral levels. Add in strong seasonality, the return of buybacks after this week’s earnings, a still-healthy economy, a plausible move past the current AI buildout concerns (these things run in cycles) and valuations with plenty of room to expand. We might even get some cool inflation prints the second week of November that send yields another leg lower.
Between now and then, though, we have some treacherous waters to navigate, particularly with thin (or negative depending on who you ask) gamma support. CTAs are within 0.5% of sell triggers on the S&P 500, and this week brings the Fed, GDP and PCE, plus earnings from Alphabet, Microsoft and Amazon. As always, let’s see what we get and go from there.
At the time of publication, in terms of securities mentioned, Sethi was long XOM, CVX, BA, SPGI, GOOGL, MSFT, INTC, AMZN, NOW, LIN, TSLA, CIBR, T, SPY, RSP, CPER, IBIT, and numerous Treasury ETFs, and short WDC.