Are You Paying Attention to the Market’s Subtle Warnings?
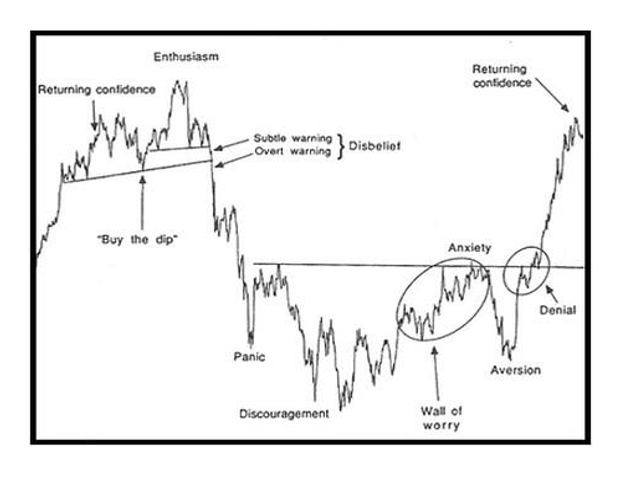
Let’s look at the sentiment cycle chart to see where we are. Hint, while we’re not at “enthusiasm,” we’re also not at “panic.”
You've reached your free article limit
You've read 0 of 1 free Pro articles.

The Market
For weeks now I have been talking about the oversold nature of the market. And I have been talking about sentiment. I have noted how it’s hard to have a good rally just because we’re oversold; we need oversold coupled with bearish sentiment. And that bearish sentiment is just so hard to come by.
And yes, I know everyone wants to cite the Goldman Sachs shorting statistics. Or the CNN Fear and Greed Index. Or that their Uncle Charlie is talking about how bad the AI and semi stocks are. But I continue to see, statistically, complacency.
As I went through the charts this weekend, it struck me that I’ve seen the Nasdaq chart before. Sure, it’s the same chart as the QQQs. But it also has a decent resemblance to the Sentiment Cycle chart. I submit to you that Nasdaq is currently in ‘Disbelief’, likely at Subtle warning. Please note there are several bounces off that line before it breaks.
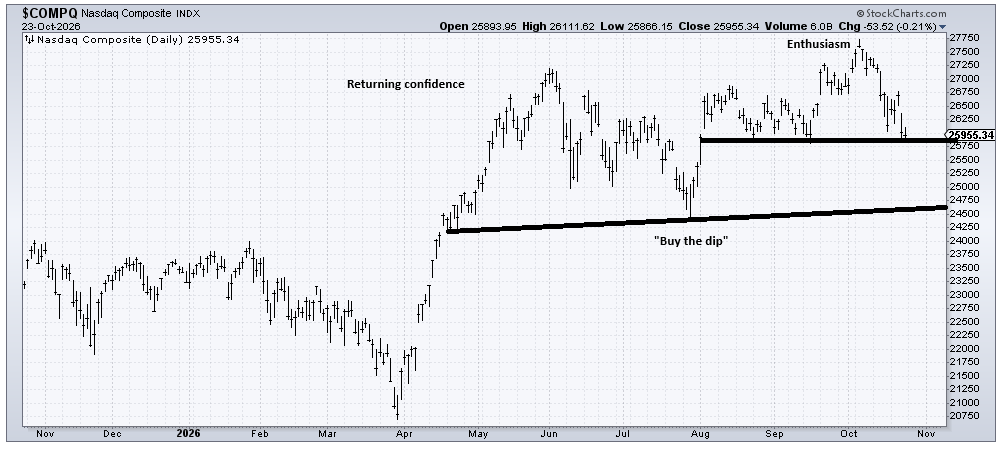
I would very much like to be wrong about this. I mean so many stocks are down so much already. We have fewer stocks making new lows. We are oversold. We have some (very) small movement away from the bullishness.
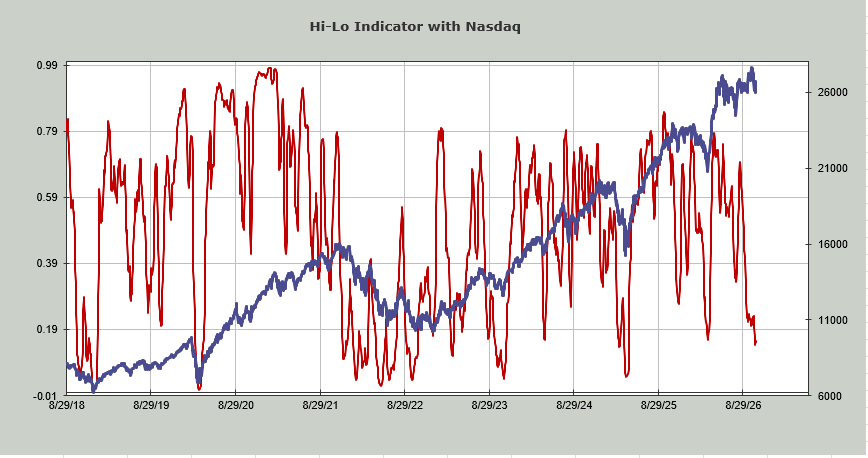
But I went back and looked at some previous times the Hi-Lo Indicator was this low (oversold) with Nasdaq near its high. I did not need to go much further than the fall of 2021. Sure, we got a rally, but it wasn’t great. And we kept getting oversold bounces, but it took almost a year (fall of 2022) for those oversold readings to matter.
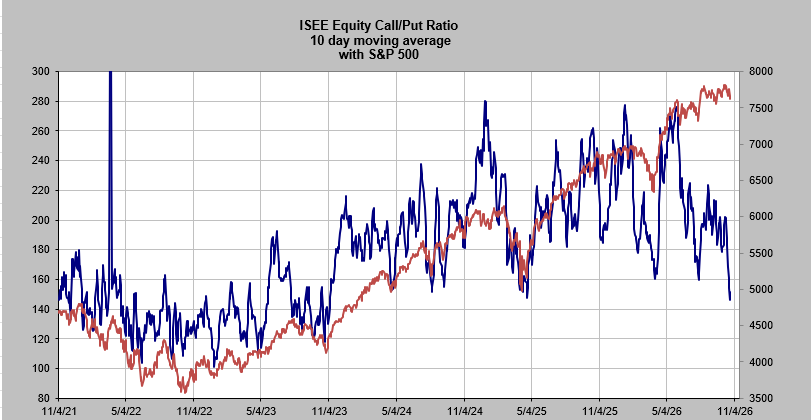
The other day we looked at the 10-day Moving Average of the ISEE equity call/put ratio and how low it had gotten. But when I looked at it back in that 2021–2022-time frame, it struck me that the range for this was so much lower than it is now. Back then I considered a reading of 1.0 to be ‘too bearish’. Today the indicators reside at 1.5.
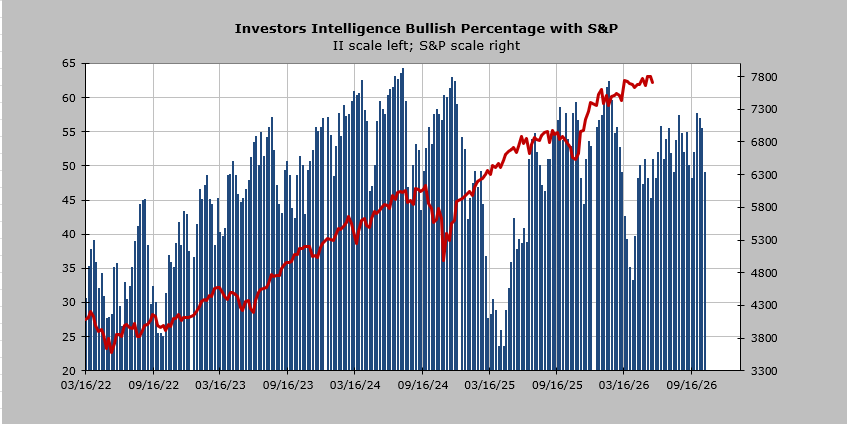
The Investors’ Intelligence bulls got down to 27% that spring of 2022 and 25% in the fall. Now they are still at 49%. Oh, maybe they will go lower this week, but I don’t think we see them in the 30s.
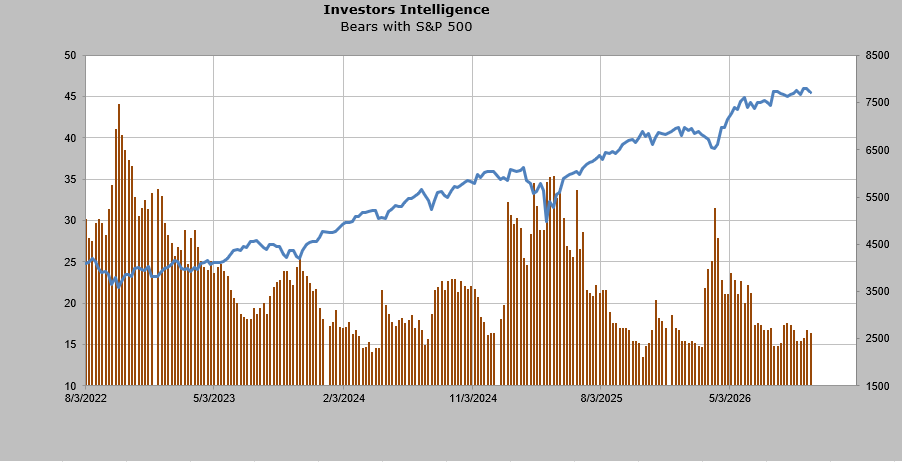
The bears got to nearly 45% in the fall of 2022. Now they are at 16%. Heck, folks were more bearish this past spring at 31% bears.
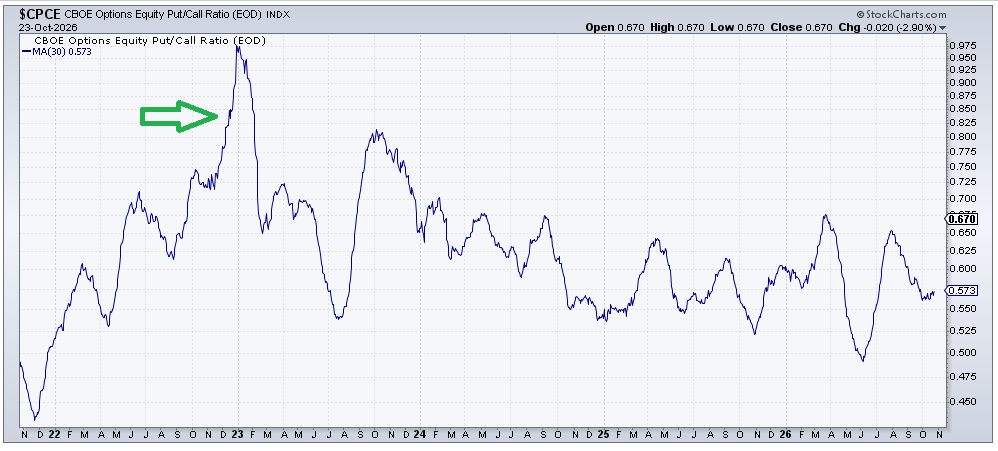
The thirty-day moving average of the equity put/call ratio was on its way to nearly 1.0 in the fall of 2022 (having been ridiculously low at .44 in the fall of 2021). Now it sits at .57. There was more put buying in July when this metric rose to .65 than there is now.
How do I square this with my view that Nasdaq ought to rally short term? Nasdaq has been oversold for a few days now and still can’t rally. It probably lifts itself up off the ground this week with the SOX sitting at the 200-day MA. And I would remind you none of the major indexes have broken support, so their charts still hang in there. But when it comes to sentiment, the complacency is what strikes me. So, if it does break, I expect we will see sentiment follow the pattern on the Sentiment Cycle chart.
New Ideas
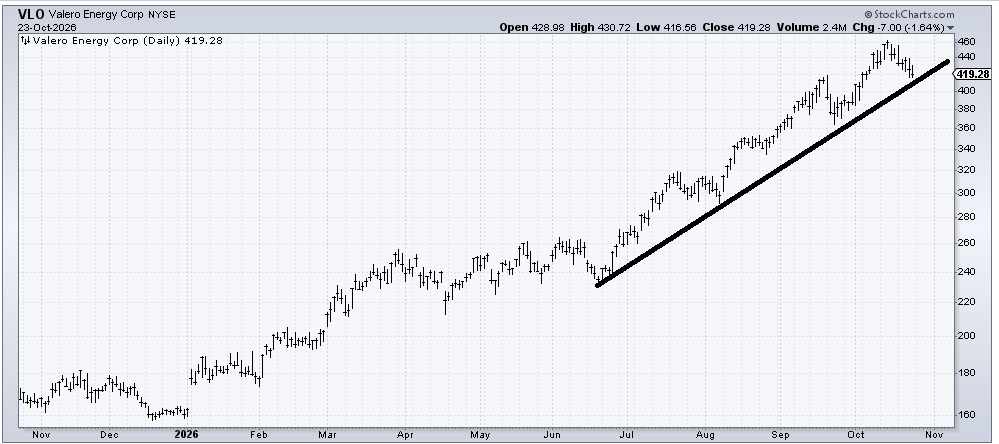
The DSI for oil tagged 90 on Friday. XLE was up, as was OIH, but the refiners have been trending down for a week now. Valero (VLO) is a little oversold as it approaches that uptrend line but with the DSI so high I’m leaning toward selling because I think we will see that line broken in the next few weeks.
Today’s Indicator
The HI-Lo Indicator is discussed above. The chart is also shown there.
Q&A/Reader’s Feedback
Helene welcomes your questions about Top Stocks and her charting strategy and techniques. Please send an email directly to Helene with your questions. However, please remember that TheStreet.com Top Stocks is not intended to provide personalized investment advice. Email Helene here.
Be aware that most of these stocks will report earnings during the first week of November; I prefer not to ‘play’ earnings.
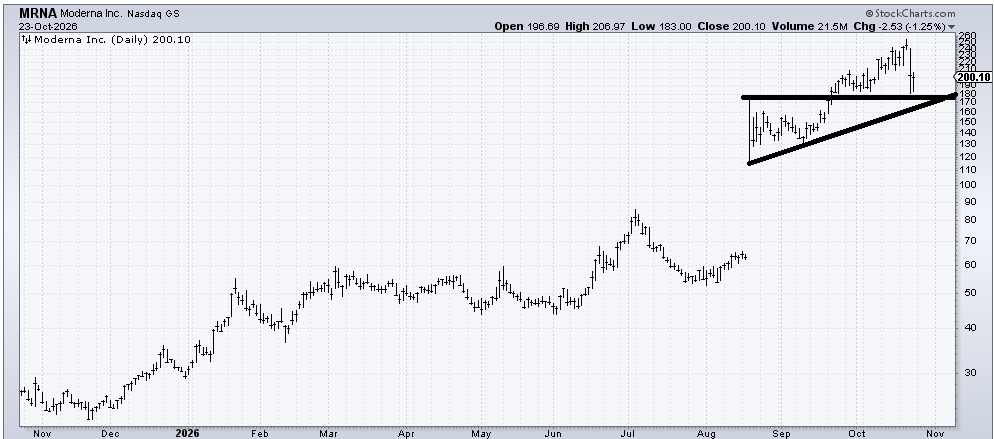
Moderna (MRNA) hasn’t done anything wrong yet. It’s got some decent support at that 170-180 area, so I expect a bounce. What will change my mind is if it rallies and can’t get much over 220-230. A break of that support area would probably mean a trip down to 130-140.
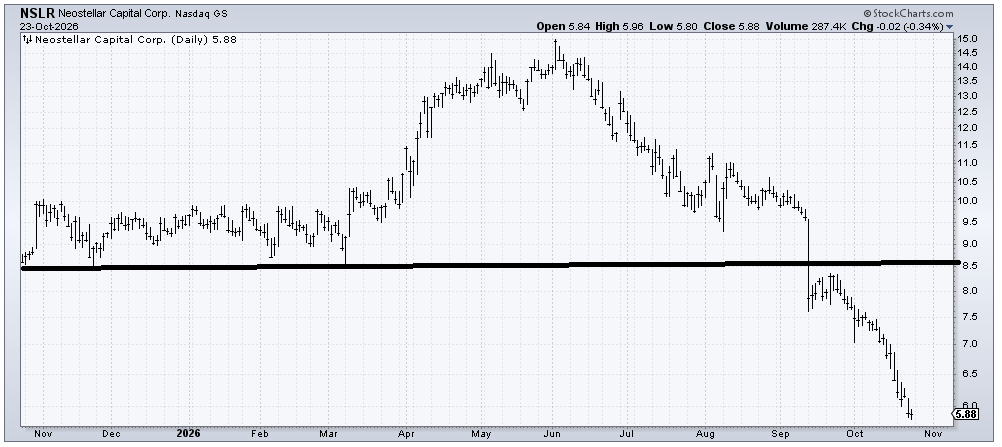
Neostellar Capital (NSLR) is oversold. The stock hasn’t had a rally in two months. But that is the best I can say about it. If it can rally to 7 I’d take it as a gift.
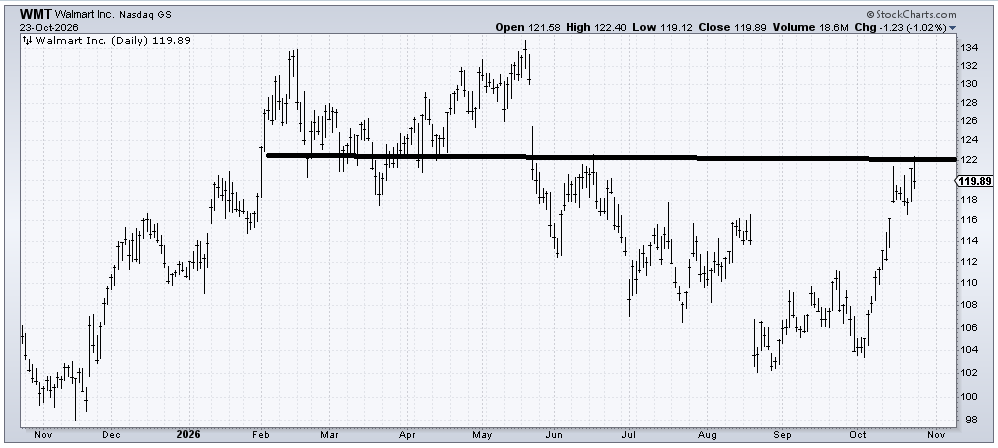
My guess is Walmart (WMT) backs off and tries to rally again. Maybe it even fills that gap above but while I thought it was okay to buy in late August when it made those twin lows up here I would be inclined just to hold it or take some profits. A reminder that the majority of retailers tend to make their highs sometime between Thanksgiving and Christmas.
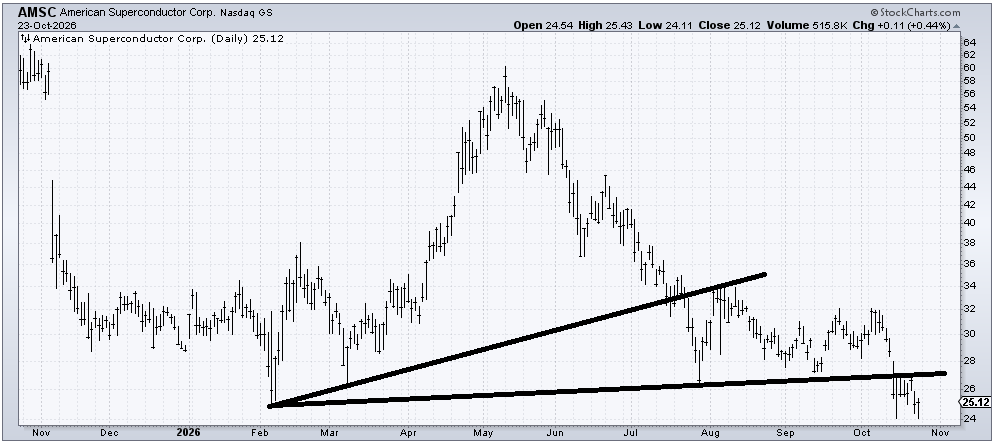
American Superconductor (AMSC) is oversold but if it can’t rally up and over 28 in a hurry to recapture that breakdown then I’d be a seller.
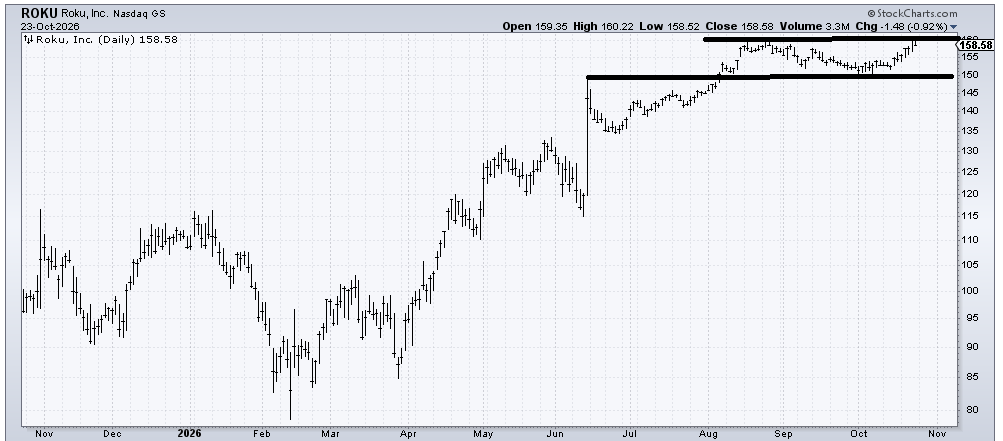
Roku (ROKU) is a little overbought up here so a pullback—a gentle one—would be a plus. Something that pulls back gently into the 155 area, holds and then makes another run would be good. A sharper pullback will look like a failure.
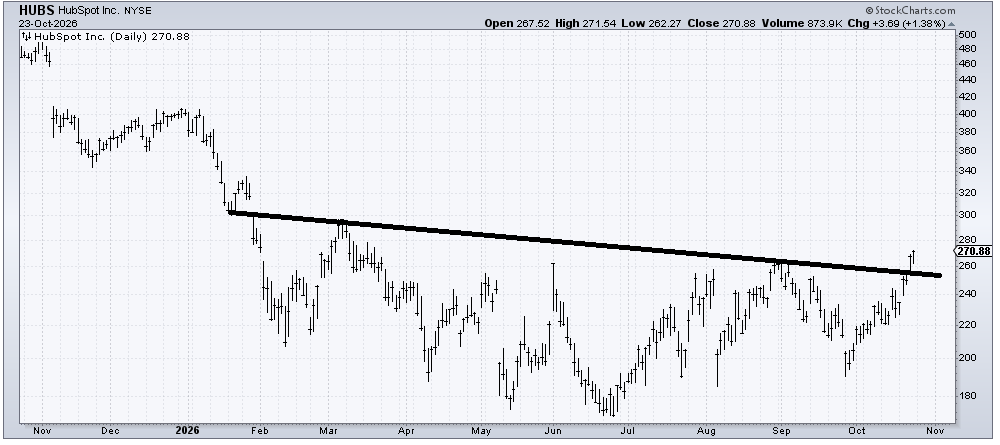
HubSpot (HUBS) is a pretty chart with a nice base. But is it short term overbought. A pullback into that 250-255 area would be good. I just wish I had seen this chart when it was 220 instead of 260 because in this market buying stocks that are up already has been dangerous!
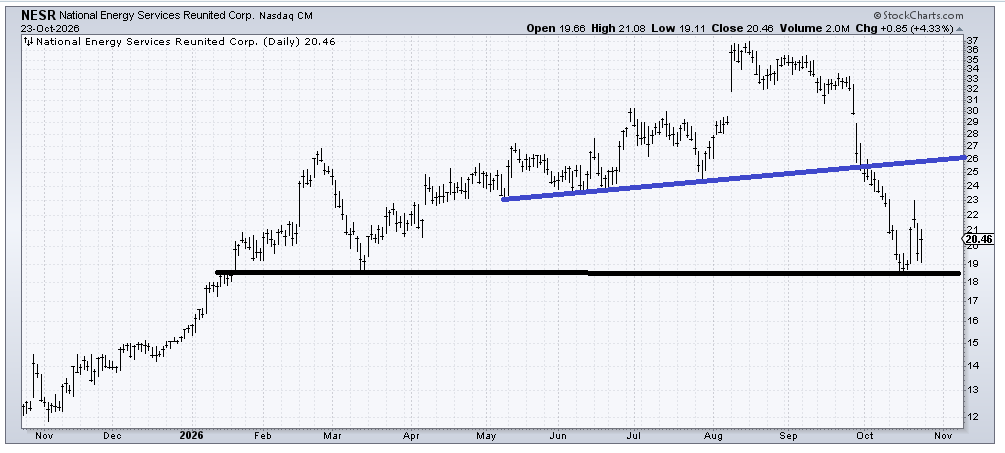
National Energy Services Reunited (NESR) looks oversold enough to bounce, perhaps even to the blue line. If it breaks under the black line I would give up on it.
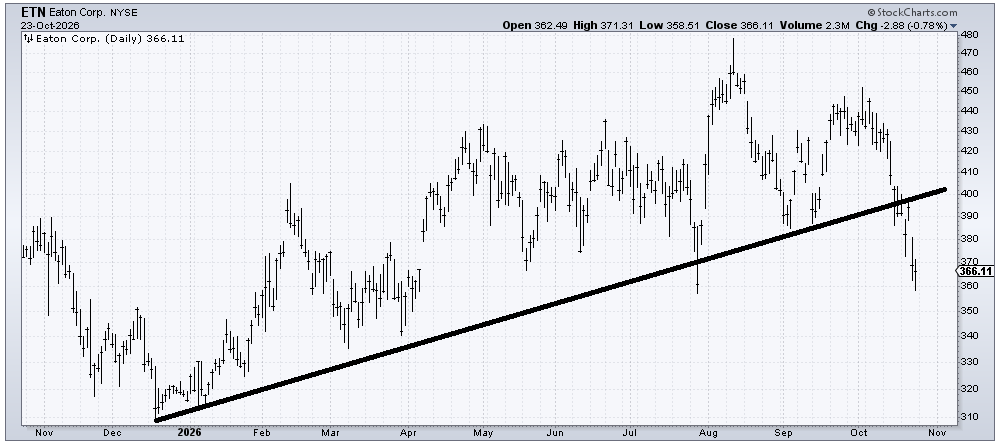
I lean toward being a seller of Eaton (ETN) on a rally back into the 380-390 area.
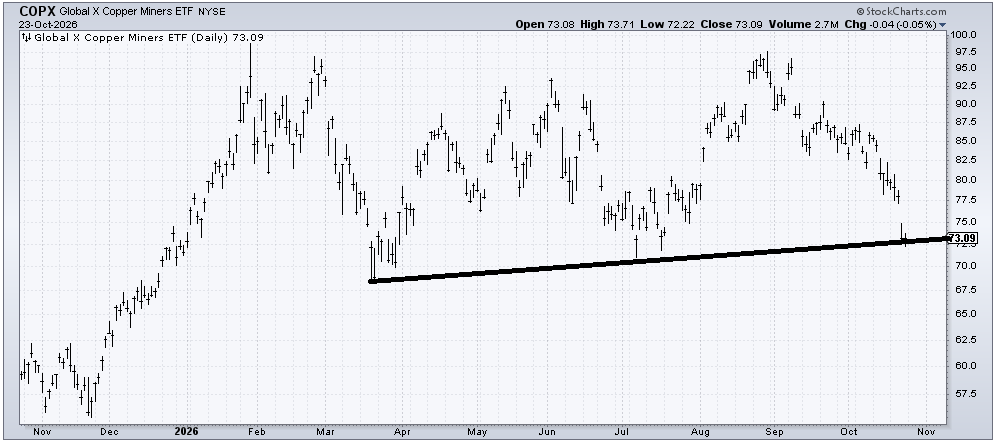
COPX, an etf to be long the copper miners looks toppy. It tends to trade so gappy that a gap up and over 77 would save the chart but I would fret over a tepid rally toward 77-78. The DSI on copper is 49 so there is nothing that tells me folks are bearish on it.
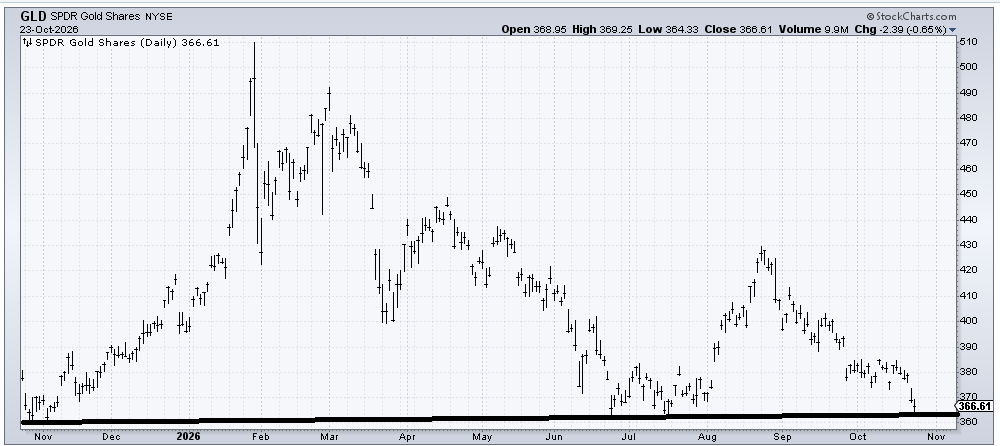
I keep trying to bottom fish $GLD and I have been very wrong to do so. Now 360 seems to be support. Would a break of 360 bring us a little panic? It probably would. And with the DSI at 20 we could get enough panic to matter.
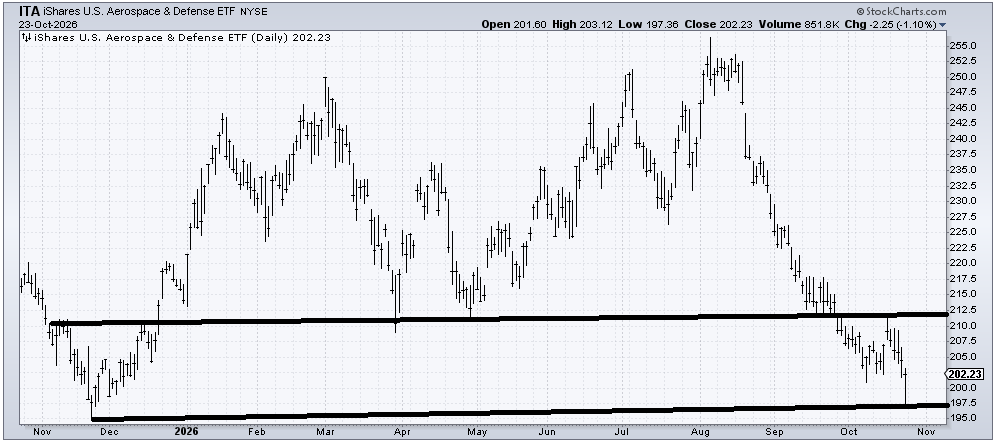
When $ITA, an etf to be long Aerospace & Defense stocks broke under 212 in September that was a serious break of support. Was Friday’s bounce off the prior spike low at 197 a good low? I doubt it but is it enough to get a short term rally? Yes. If it wasn’t for the oversoldness I’d say the chart is more apt to languish.