Iran Concerns Weigh on Stocks as Tech Steadies to End a Volatile Week
Brent topped $116 and stocks pulled back on fears of renewed U.S.-Iran hostilities after the midterm elections. For the week, small caps led with the Russell 2000 up 2% while the S&P 500 and Nasdaq slipped.
You've reached your free article limit
You've read 0 of 1 free Pro articles.
Quick Summary
- A jump in oil prices was the most visible sign of rising fears of renewed U.S.-Iran hostilities, now expected after the U.S. midterm elections. Eight of 11 sectors and both the cap-weighted and equal-weighted S&P 500 fell, even as Tech steadied with a small gain.
- Stocks opened lower but would attempt a morning rally as Tech bounced, with the Nasdaq briefly turning positive. That rally would be sold though, and stocks would drift lower in the afternoon. The Dow Jones Industrial Average (DJIA) ended the Friday session down 1.2%, the S&P 500 lost 0.5%, the Russell 2000 fell 0.3% and the Nasdaq was lower by 0.2%. American Express (AXP) dropped nearly 4%, dragging down the DJIA, as it plans to cut about 5% of its global workforce.
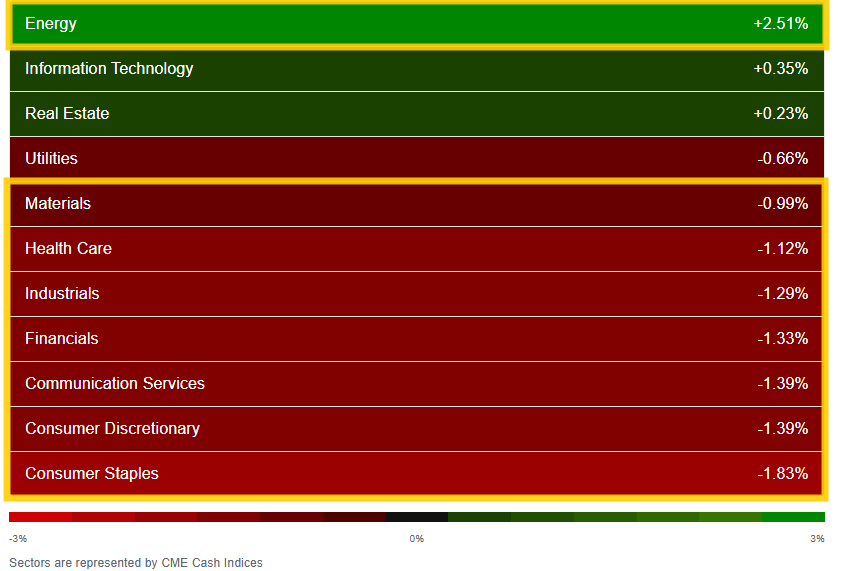
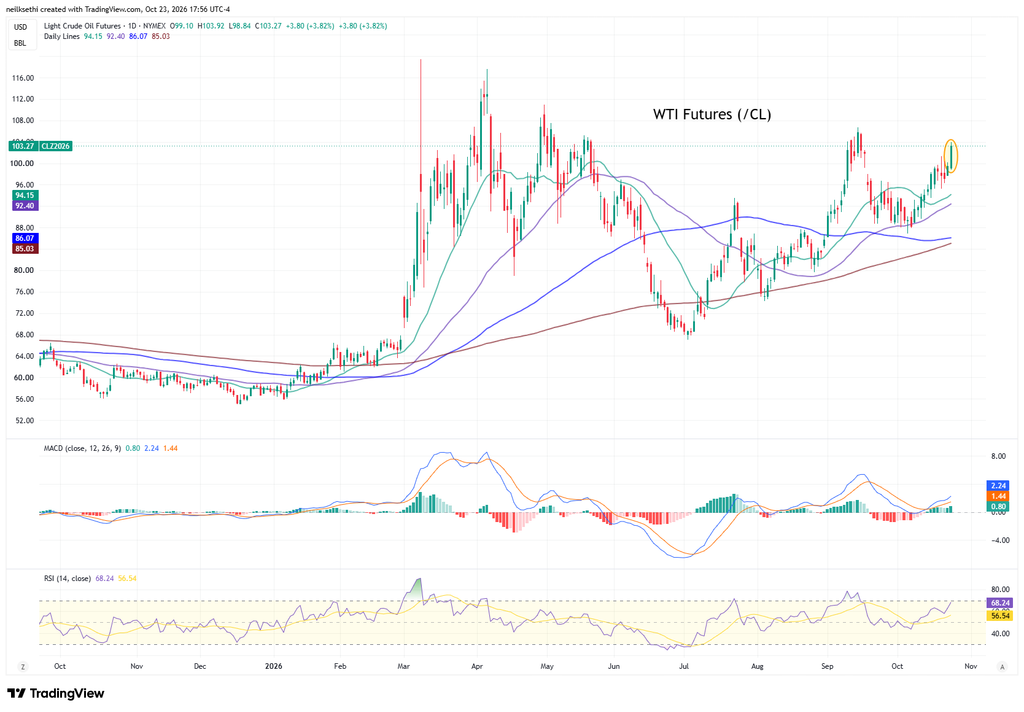
- Energy (+2.5%) led as WTI jumped nearly 4% to settle above $103. Tech (+0.4%) and Real Estate were the only other sectors higher, but Tech’s oversized weighting masked seven sectors down around 1% or more.
- For the week:
- The Russell 2000 gained about 2% and the Dow Jones Industrial Average 0.4%, while the S&P 500 lost 0.5% and the Nasdaq 0.7%.
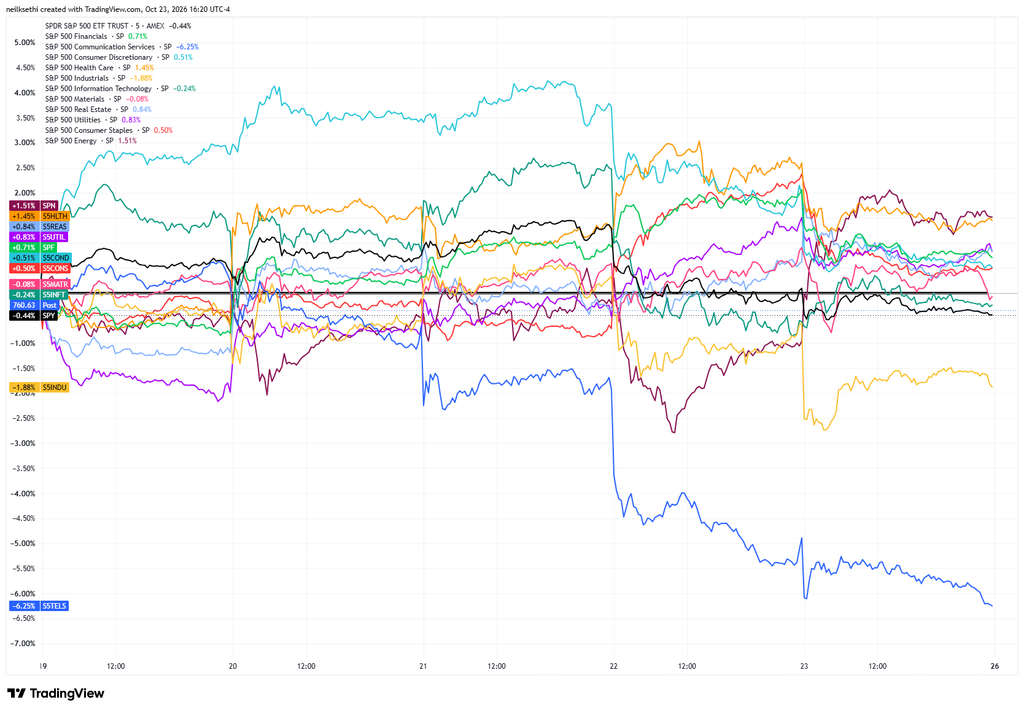
- Tech finished essentially flat, and only four sectors moved more than 1%. Energy (+1.6%, the week’s best) and Health Care were up that much, while Industrials and Communications fell over 1% with Communications’ 6.2% drop its worst week since March.
- Treasuries posted a third straight weekly gain, with the 10-year yield down 11bp and the 2-year down 6bp as of the cash closing.
- The October US flash Composite PMI Output Index eased -0.8pts to 57.6, but still signaled “the second-sharpest increase in activity since March 2022” according to the report with new orders rising the most in 4.5 years. Prices though rose the most since 2022. The final October University of Michigan consumer sentiment reading improved from the preliminary report but remained at a five-month low as buying conditions for durable goods hit a record low and inflation expectations rose to the highest since May with the report warning against them becoming “entrenched.”
- Next week is packed including the October FOMC decision and Chair Warsh press conference, Q3 GDP and September personal income and spending with PCE prices, and results from 35% of the S&P 500 by earnings weight according to Bank of America including Microsoft (MSFT), Alphabet (GOOGL) and Amazon (AMZN) among a host of other events.
Friday:

The week:

Market Commentary
Equities:
- “Four forces explain this week’s yo-yo: a solid earnings season and attractive bond yields on one side, the cost of financing and more selective sovereign stress on the other,” said Florian Ielpo at Lombard Odier Asset Management.
- “The latest moves do not alter our view that robust earnings should continue to support equities,” said Ulrike Hoffmann-Burchardi at UBS Chief Investment Office. “AI demand remains strong, current bond yields provide attractive income, and geopolitical developments alone do not justify a broadly defensive investment stance.”
- “The practical takeaway is not to abandon growth stocks, but to check whether one theme has quietly grown to dominate your portfolio after a long run,” said Brian Jacobsen at Annex Wealth Management.
- Ed Yardeni, president of Yardeni Research, described the AI trade in a note to clients on Thursday as a “bubble” but said that some depressurization wouldn’t be all bad in a note to clients. “Taking some air out of the AI bubble is a good thing. I don’t think it’s going to burst and create problems for the economy,” he said, pointing to the bond market as a source of capital competition for equities.
- “For the last two weeks, investors have been sprinting from tech stocks and data center beneficiary stocks to safe stuff, and eventually, you run out of people willing to do that sprint, and that’s what today looks like and feels like,” Jed Ellerbroek, portfolio manager at Argent Capital Management, told CNBC. Ellerbroek added that tech companies’ earnings have proven strong this season, giving investors a reason to embrace tech stocks and focus less on emotion-based flights to safety. “Emotion and fear play a really big role,” the investor said. But, “we’ve gotten a few tech companies’ [latest quarterly financial reports] and their earnings results have been good.”
- “We had expected light institutional positioning to support strong risk/reward into 3Q earnings. The reaction function the past 2 weeks suggests the bar for sentiment is higher than we anticipated,” Stuart Kaiser, head of U.S. equity trading strategy at Citi said in a note published Thursday evening.
Bonds/Fed:
- “This kind of move is when we usually see more of a panic or a crisis,” said Dustin Reid, chief fixed-income strategist at Mackenzie Investments. His view is that something else has begun to unfold.
- “We are clearly in a theme around concerns of an AI overextension,” Reid said. That’s sparked investors to start “taking chips off the table, given where we are in the year,” and by rotating money out of equities and into Treasurys and fixed income more broadly, he said.
- “The economic adjustments now underway could evolve in several ways, and inflation is elevated but not accelerating,” said Tiffany Wilding at Pacific Investment Management Co. “This likely gives the Fed room to take a measured approach.”
Stock and Sector Breakdown:
Much less bifurcated sector chart Thursday with just Energy (+2.5%) making any significant progress. Tech though managed a mildly green day keeping index losses contained and Real Estate was also up modestly. Seven sectors though down around 1% or more with former favorite Staples at the bottom a day after its best session since April 2025 which took it to a record high.
For the week, for all the drama, Tech was also basically flat (-0.25%) for the week. In fact just four sectors moved more than 1%. Energy and Health Care to the upside, Industrials and Communications to the downside.
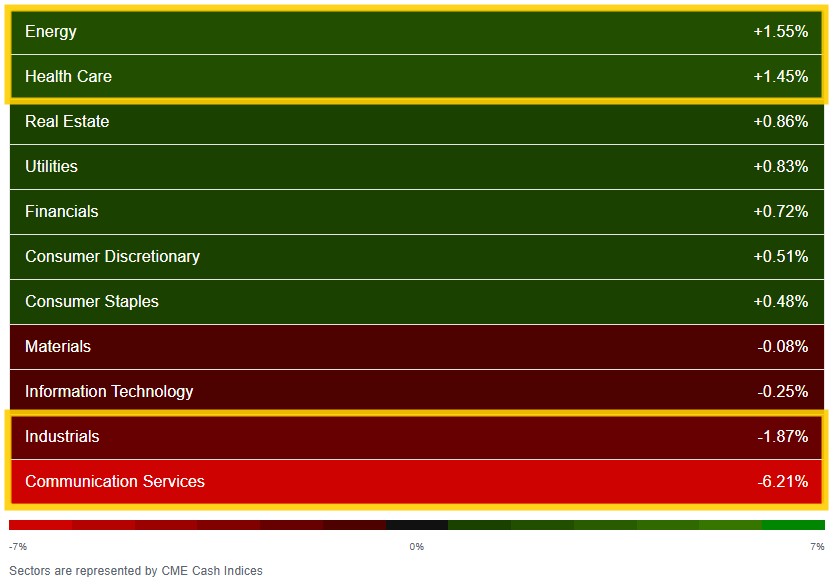
That -6.2% for Communications, though, was the worst week since March and before that the week of liberation day.

With the S&P 500 down around a half percent for the week, only Communications and Industrials underperformed.
AI growth concerns remained top of mind Friday. Bloom Energy (BE) -11.3% was the worst performer on the S&P 500 despite reporting a 138% jump in revenue and sharp improvement in profitability as analysts cut their price targets due to even loftier expectations and concerns about spending as the company used $27.2 million in operating cash during the quarter, while capital expenditures reached $153.5 million. Western Digital (WDC) -3.0% similarly fell despite EPS 20% above expectations but also raising spending plans.
Weighing on the Dow Jones Industrial Average was a weak reaction to American Express (AXP) earnings with the stock falling 3.7% after the credit card company announced layoffs. The company plans to cut 3,500 jobs, or roughly 5% of its 78,000-person workforce. That overshadowed strong earnings with record third-quarter revenue of $20.1 billion, up 9% year-over-year, with net income rising 28% to $3.7 billion and diluted EPS jumping 31% to $5.42. Credit quality remained solid, with provisions for credit losses falling to $1.0 billion from $1.3 billion a year earlier and the net write-off rate edging down to 1.8%.
If you missed it, Chris Versace wrote about American Express today, a Pro Portfolio holding: Sticking With This American Express Price Target
Wireless carriers also came under renewed selling after another SpaceX (SPCX) headline, this time from Bloomberg which reported “SpaceX aims to secure a minimum of 80,000 cell sites across the US, and it’s in talks with at least one major cellular infrastructure company to reach that goal, according to people familiar with the matter.” AT&T (T) -7.9%, Verizon (VZ) -1.3%, and T-Mobile US (TMUS) -7.7% all fell sharply.
If you missed it, Sarge wrote on all of this today in SpaceX Rocks Telecom. Here’s My Play on Tower Stocks and the Big 3.
That same headline saw tower company Crown Castle (CCI) soar 9.1% to lead the S&P 500. Following that were two cybersecurity companies, CrowdStrike (CRWD) +8.3% and Palo Alto Networks (PANW) +7.2% helping the iShares Expanded Tech-Software Sector ETF (IGV) to a 1.7% gain.
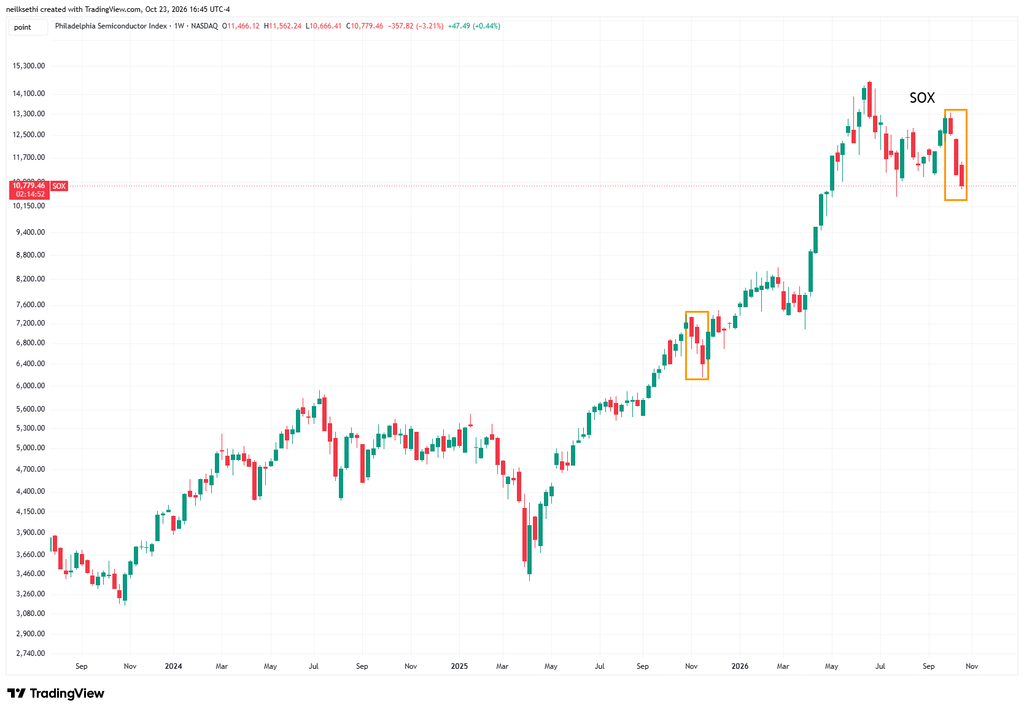
Semiconductors though didn’t get much bounce with the Philadelphia Semiconductor Index (SOX) adding just 0.4% and finishing the week 3.2% lower, its third straight weekly loss for the first time since November.
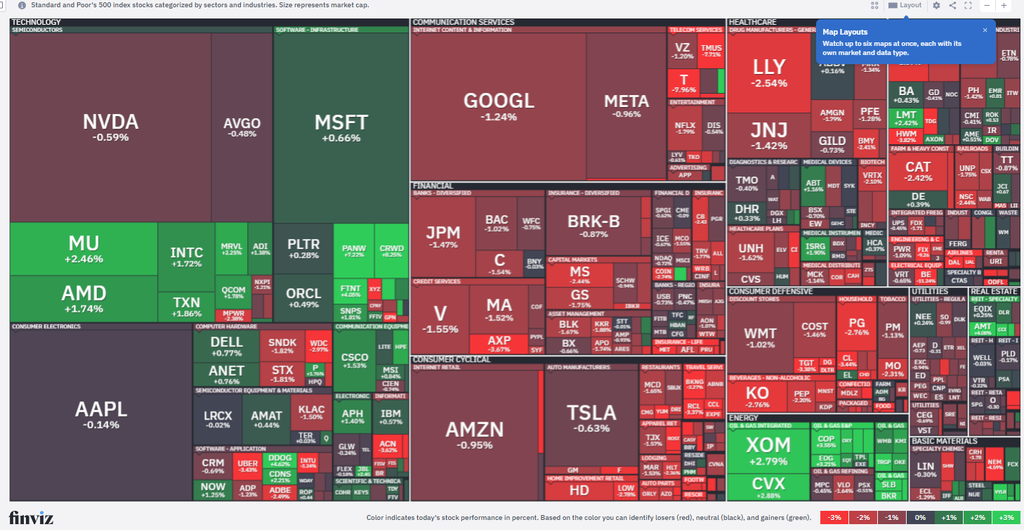
The number of large SPX winners (up over 3%) fell back to ~20 from ~155 Thursday, the most since July. But the number of large losers (down over 3%) also eased but to ~50 from ~85. As mentioned previously, both of these metrics had been very (extremely?) subdued since the start of August, rarely getting above 50 and only twice above 100 before Thursday, so yesterday was very volatile in comparison.
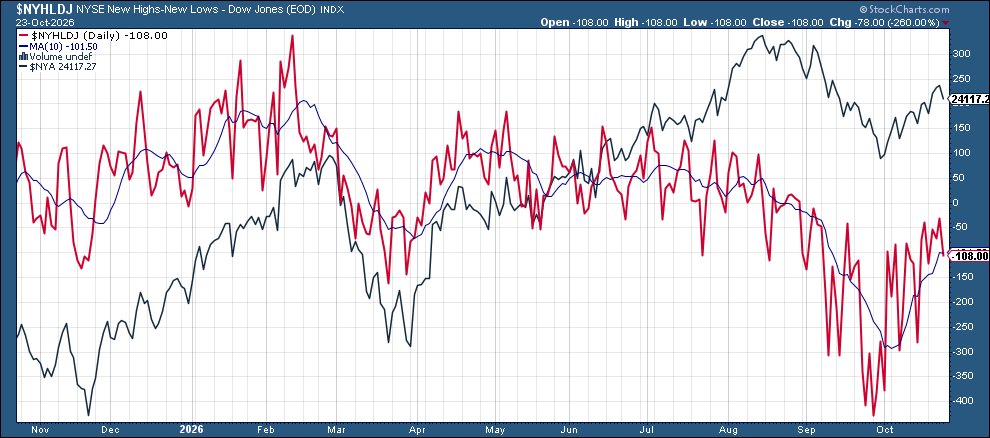
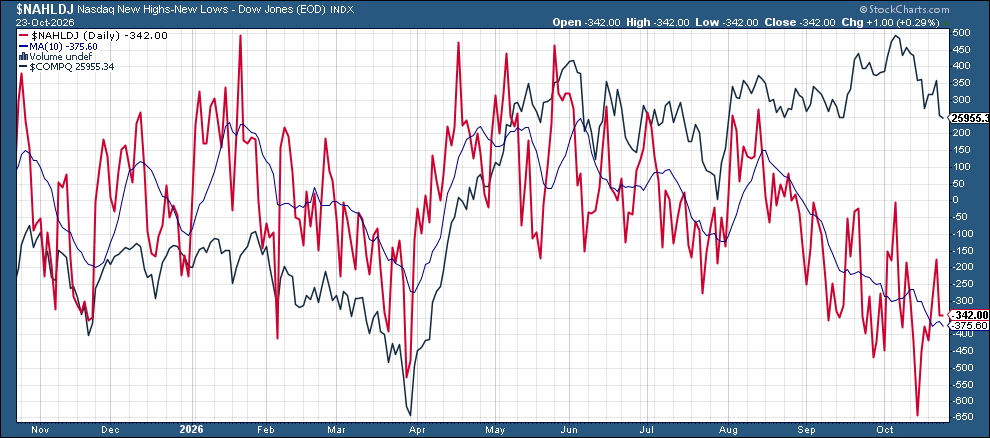
New 52-week highs minus lows fell on the NYSE to -108 from -30 but a positive divergence on the Nasdaq which improved slightly to -342 from -343, still the 40th straight session of new lows outnumbering new highs on the Nasdaq, the longest such streak since the 43-day stretch that ended April 22, 2025.
Lots more on breadth in the Week Ahead Sunday.
Some other stock-specific commentary from TheStreet Pro:
- Chris Versace – Adding to 2 Holdings After Earnings, PMI Updates
- Stephen Guilfoyle – Buying More Peloton as Shares Wake Up
- Bob Lang – Chart of the Day: Broadcom Looks Bearish. A Time to Buy?
- Ed Ponsi – Meta Announces Zuckerberg-Favorable Stock Split: Here’s Our Game Plan
- Bob Byrne – 7 Big-Name Funds Keep Circling the Same AI Stocks
A Look At The Charts
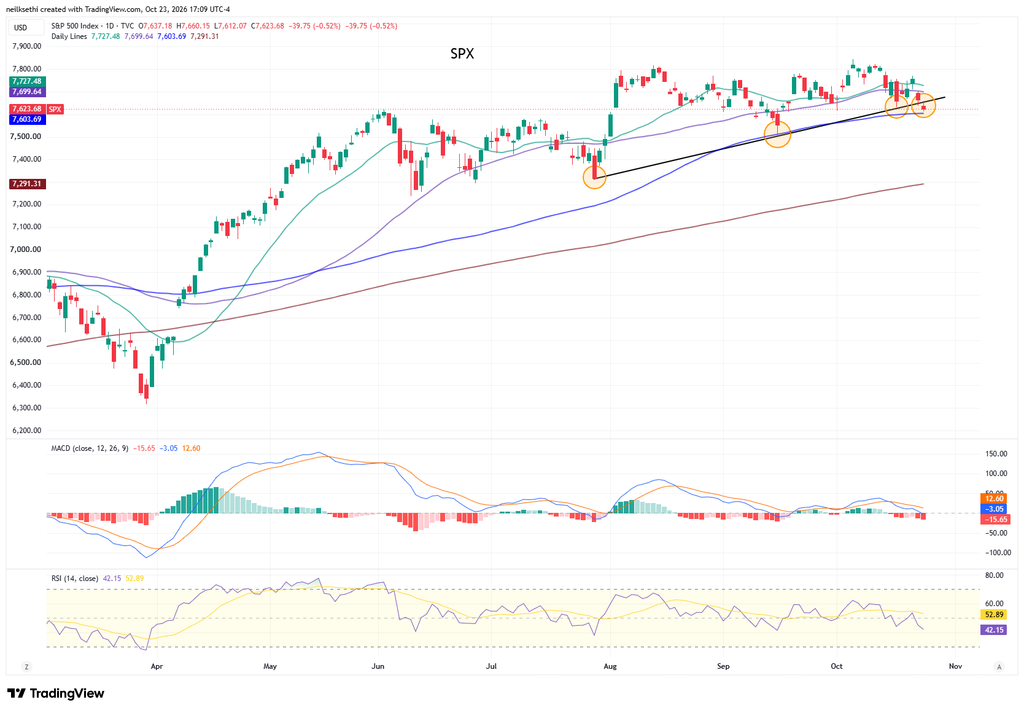
Note on all charts the colored lines are moving averages (the average price over the lookback period — days on the daily charts, weeks on the weekly charts):
20 = green
50 = purple
100 = blue
200 = brownException is monthly charts where blue is 10-month moving average and brown is 20-month moving average.
MACD = Moving average convergence/divergence line, a measure of momentum that compares longer term and shorter term momentum to gauge if a move is strengthening or weakening. This is probably my favorite individual indicator.
RSI = Relative Strength Index (basically what it sounds like) = measures the strength of the move comparing gains to losses over the given lookback window (I use the standard 14 periods).
SPX fell to its 100-DMA which puts it under the trendline from the July low for the first time. I said Thursday “a break would be notable and see me selling my S&P 500 ETF (SPY)” but the fact it held the 100-DMA (which was also the case in September) has me holding off to see if that holds. As noted last week the daily MACD and RSI had slipped negative and remain so.
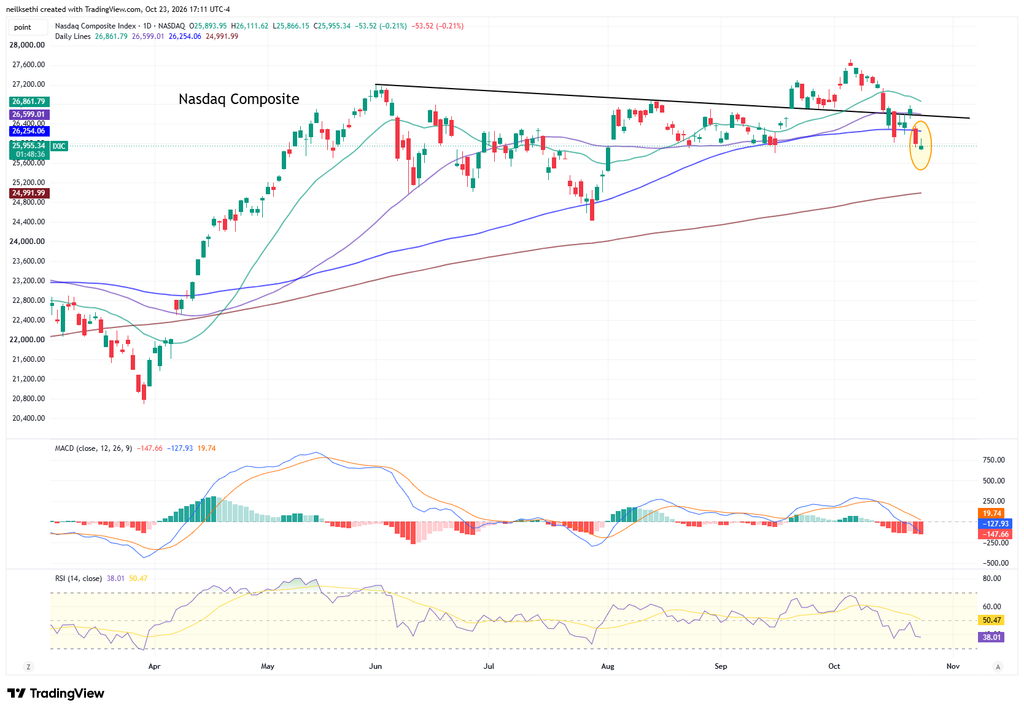
Nasdaq Composite fell a little further, now in “no man’s land” between the 100- and 200-DMAs, not a place I would want to be long with a MACD sell signal (almost a “go short” signal) and the RSI under 40.
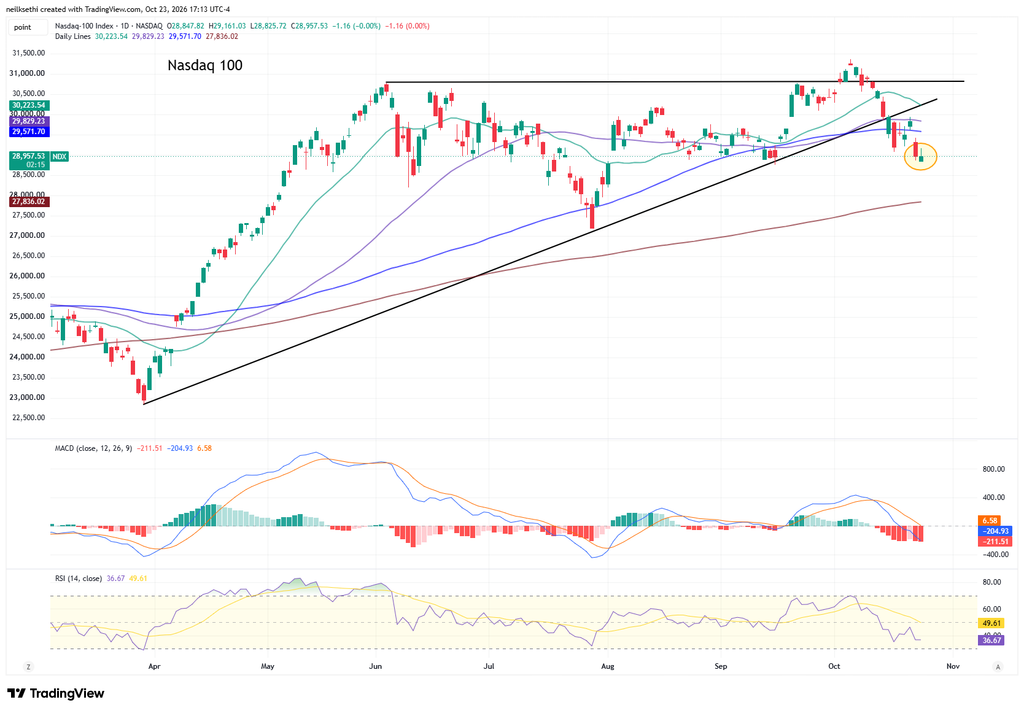
The Nasdaq-100 (QQQ) a similar story. I had said Thursday given the size of the declines “I would expect a bounce, but for me it will be one to sell until it reclaims the 50-DMA or has a deeper correction.” We didn’t even get the bounce so I’ll consider a short Monday if we get further weakness and it breaks the September lows.
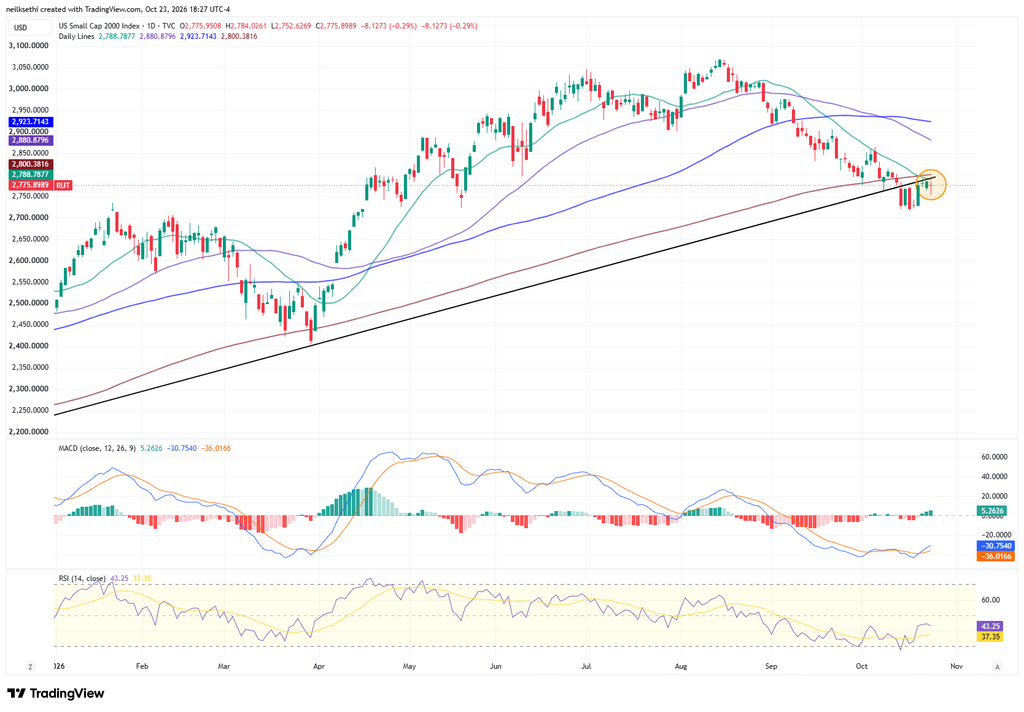
The Russell 2000 (IWM) little changed again. It remains below its 200-DMA and old support line turned resistance. The MACD though as mentioned Wednesday crossed to “cover shorts” positioning and the RSI is moving back towards 50, so as I said then “if it gets over the 200-DMA I’ll get back in.”
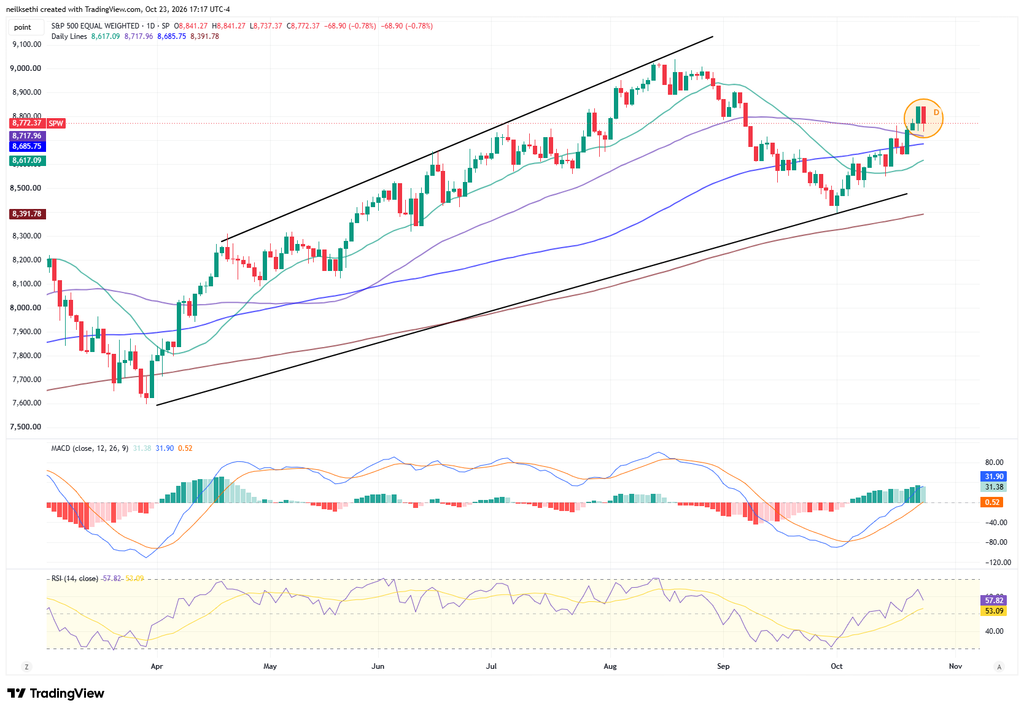
The equal-weighted SPX (RSP) which I have said has been “able to hold up better” the past couple of weeks underperformed the other indices above Friday, but remains above all moving averages I track and continues to have by far the best technical setup.
Treasury yields rose across the curve.
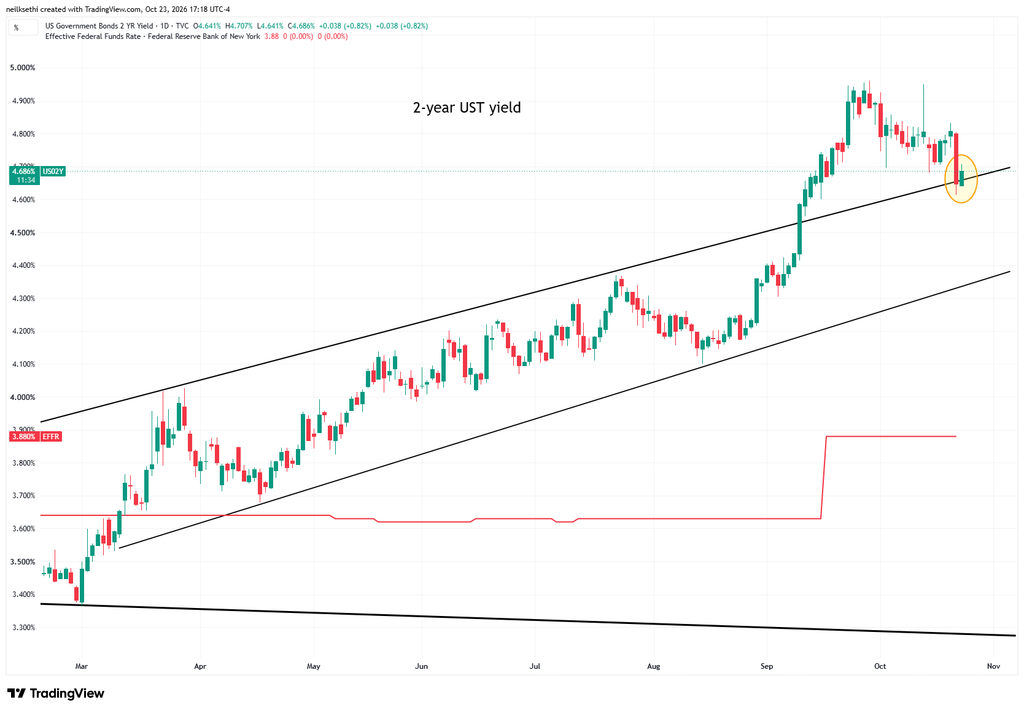
The 2-year Treasury recouped four of Thursday’s 16 basis point decline (including the after-hours), the largest drop since August 2025 (and before that August 2024). That took it back out of its channel from the start of the year.
It is ~80 basis points above the Effective Fed Funds rate, so calling now for just maybe two more rate hikes (it historically has traded 25-50 basis points above the Fed Funds midpoint).
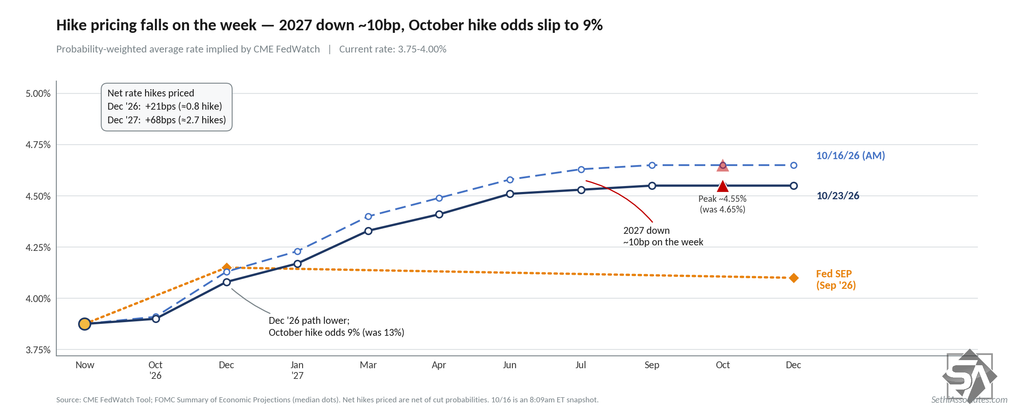
Fed rate hike expectations also firmed slightly. October is now a 91% chance of a hold, and December is 78% chance of a hike. 2027 expectations see 68 basis points of total hikes priced through December next year. Those though are down notably from a week ago.
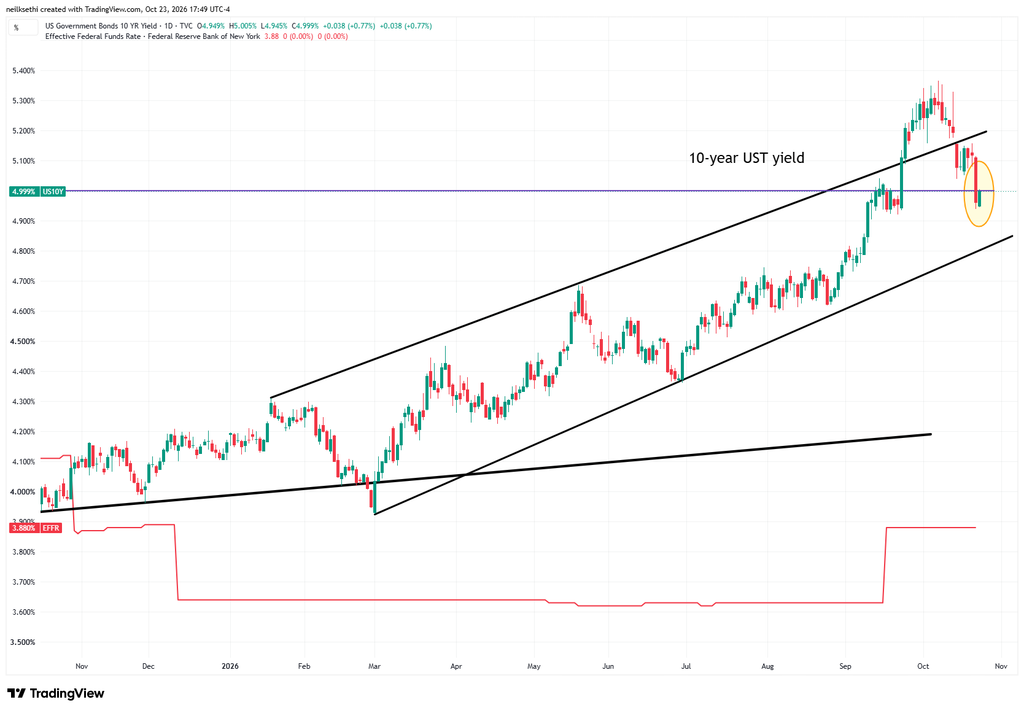
10-year yields up four basis points to just under 5% (4.999%) after Thursday’s nearly 16 basis point decline (including after-hours). As I added later, during the cash session, the drop was over 19 basis points, the most since 2023.
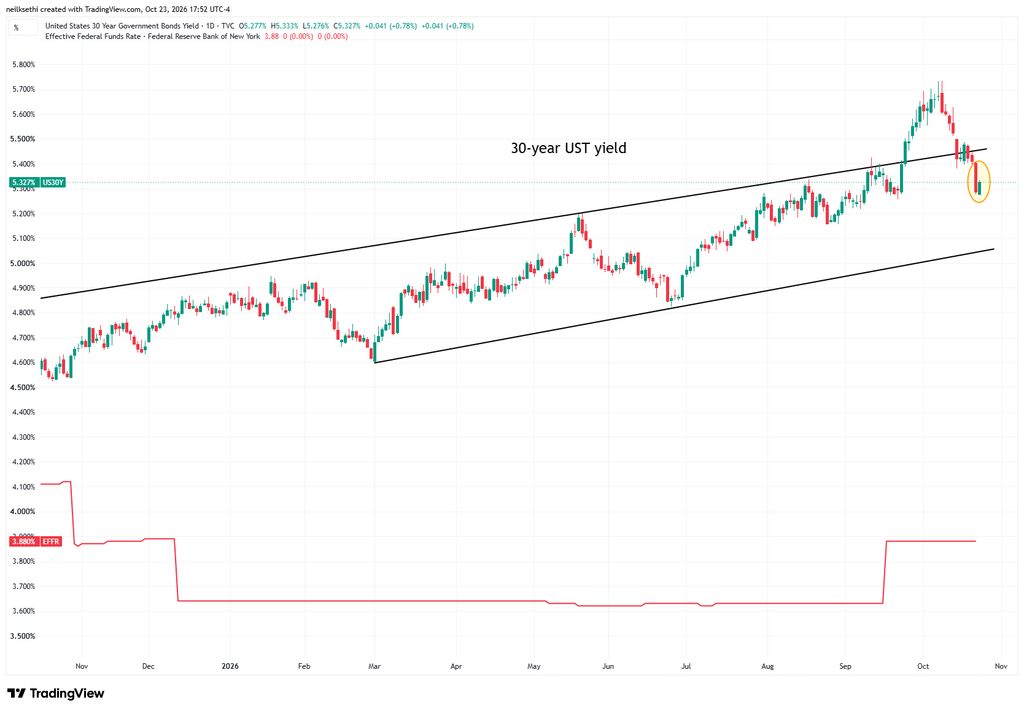
30-year yields also up four basis points to 5.33% after falling 12 basis points Thursday (including after-hours), the largest drop since November 2024.
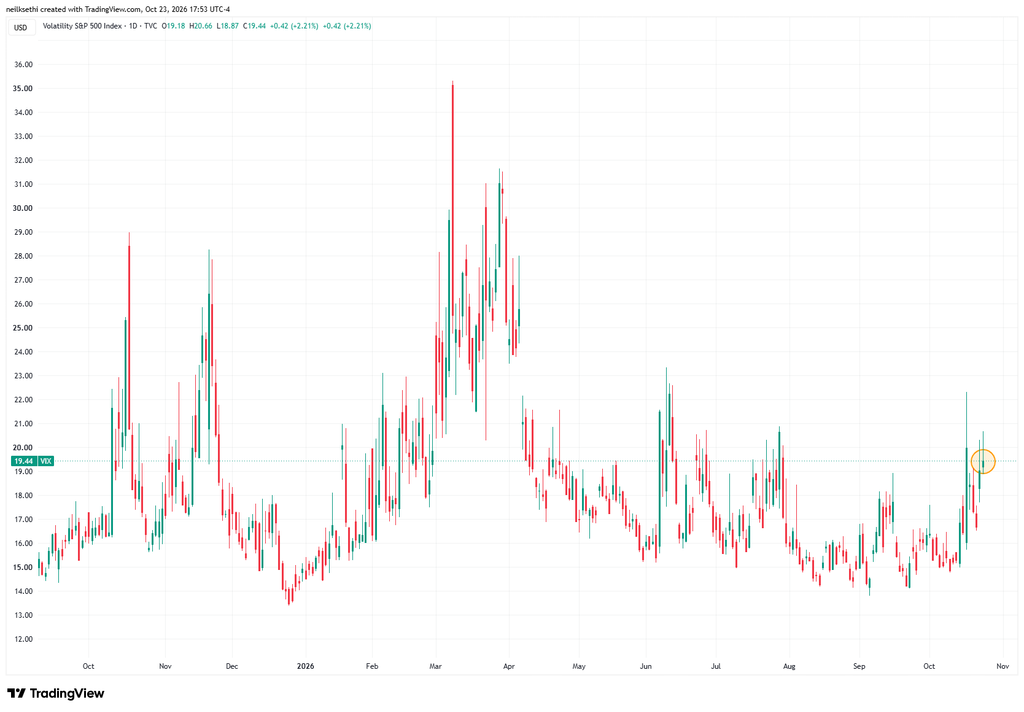
VIX traded over 20 again but ended under at 19.4. The current level is consistent with ~1.21% average daily moves in the SPX over the next 30 days.
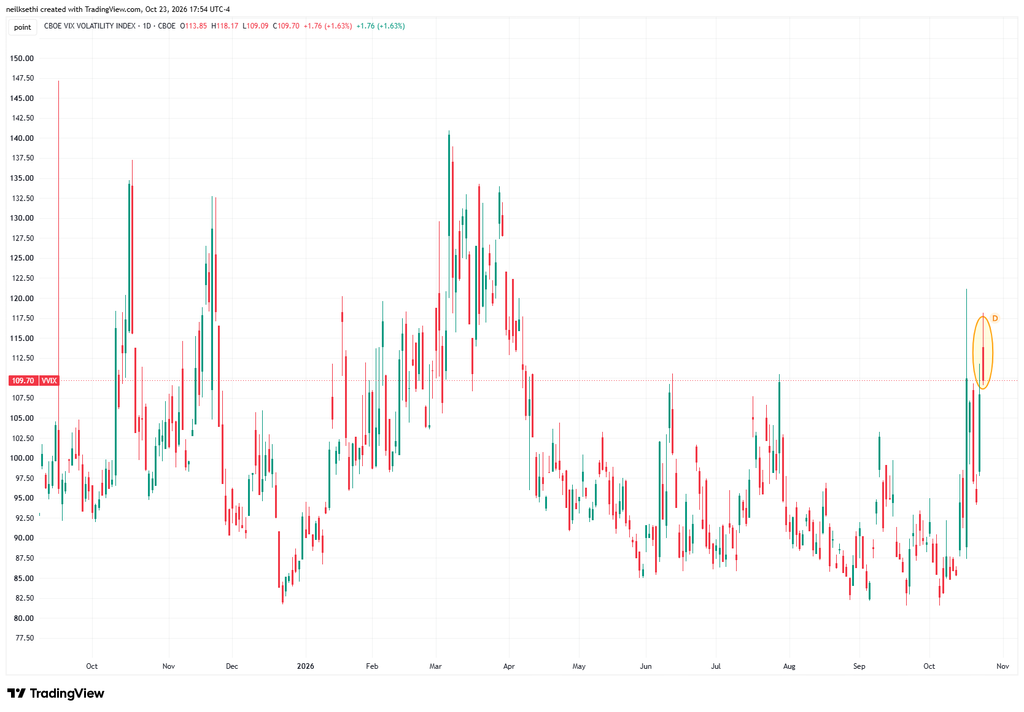
The VVIX (VIX of the VIX) up to 109.7 just below last Friday’s close which was the highest since March. The current level is consistent with “elevated” daily moves in the VIX over the next 30 days (historically, normal is 80-100, although we haven’t been below 80 since July 2024). Above 100 is the level flagged by Charlie McElligott as indicating higher stress.
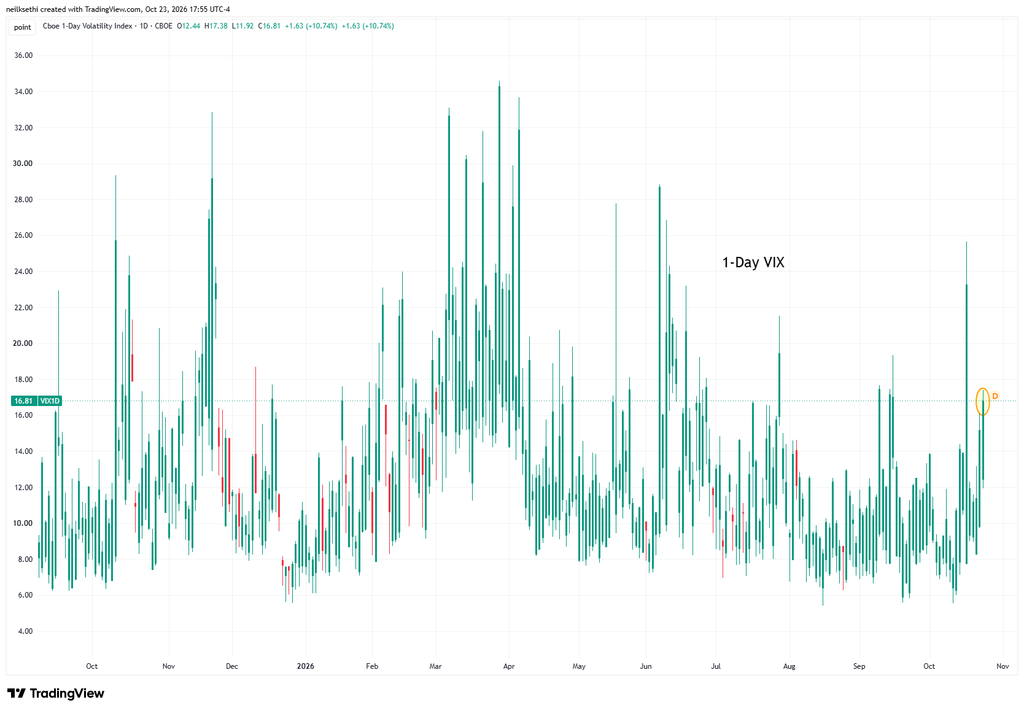
1-day VIX rose to 16.8. The current reading is consistent with a move of 1.06% in the SPX next session.
WTI futures (/CL), which TradingView has at December currently, up to $103.3, a 5-week high (including after-hours).
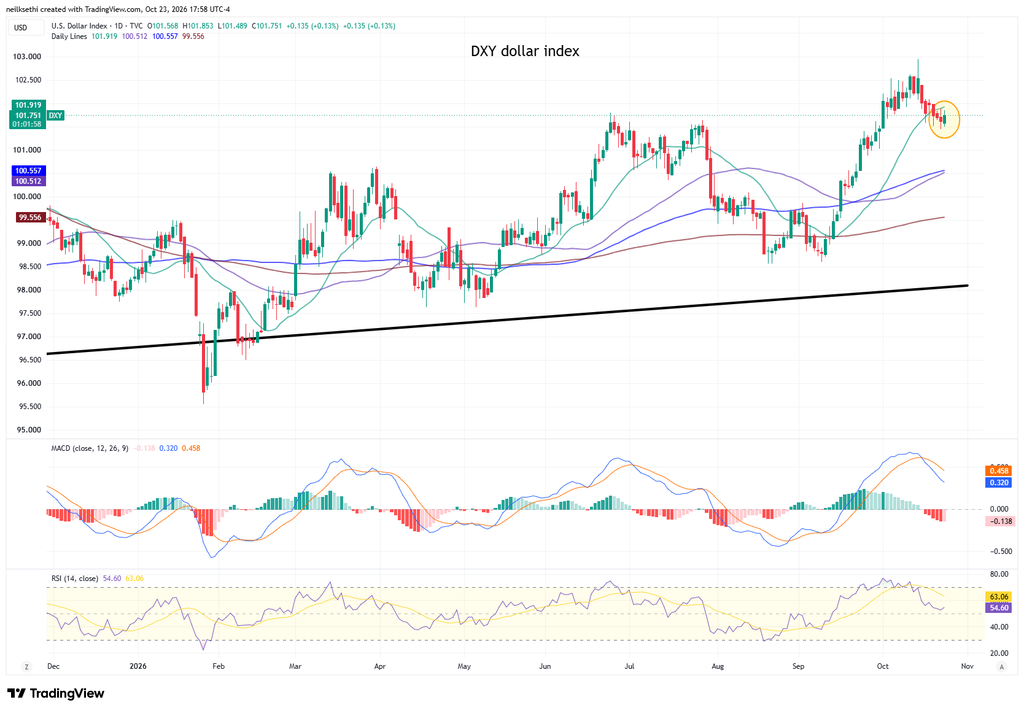
The DXY dollar index (which is fixed weighted with a heavy 57% weighting vs the euro) was up for the first time in four sessions but very modestly and remaining under its 20-DMA. As I mentioned a week ago “The daily MACD flipped to a ‘sell longs’ positioning while the RSI has fallen from over 70 to well under, both of which would argue for a consolidation.”
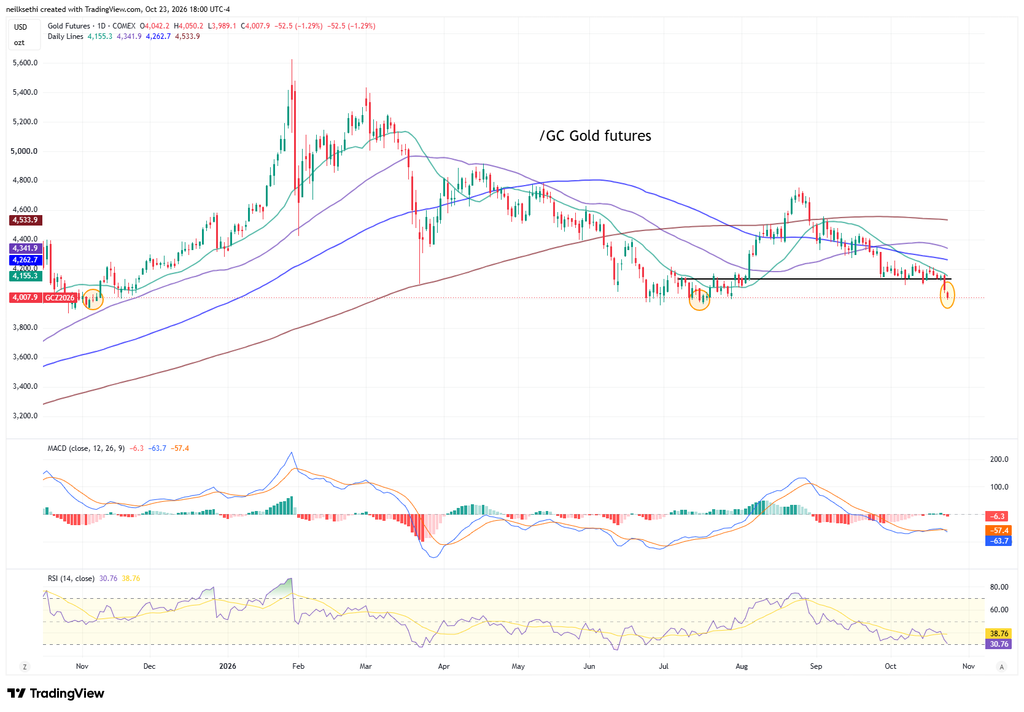
Gold futures (/GC) fell further after breaking through support Thursday now the lowest close since July 15th and before that last November. The daily MACD is tipping negative and the RSI is now at 30. Sort of tempted to buy a little with a stop just below $4,000.
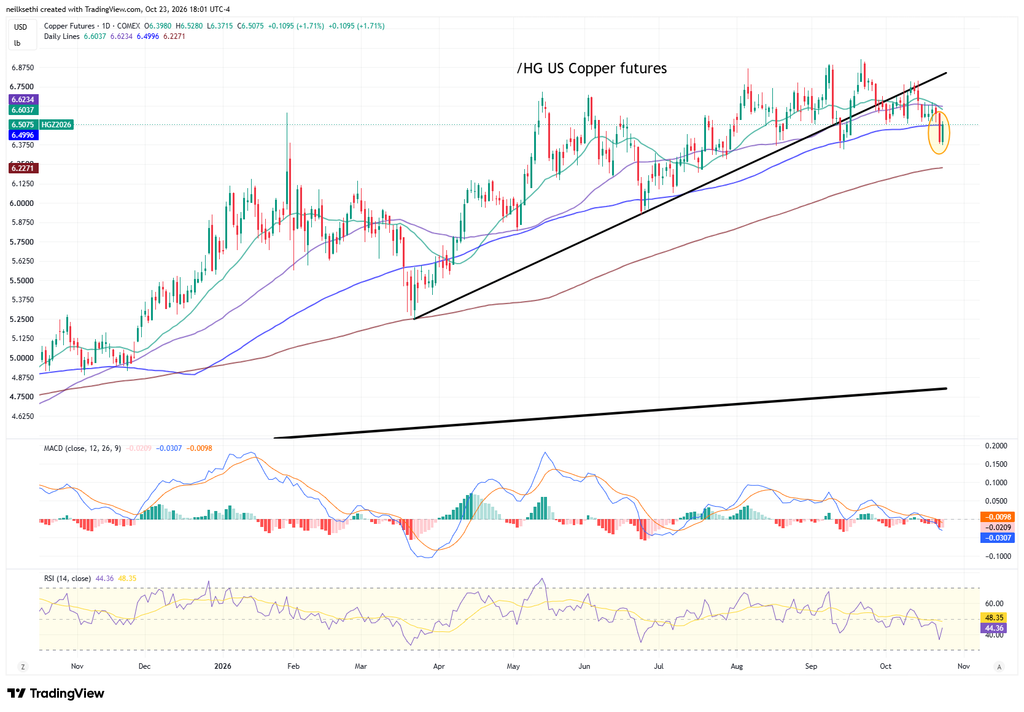
US copper futures (/HG) rebounded from the lowest close since July but stopped at support turned resistance in the 100-DMA. Daily MACD and RSI remain negative.
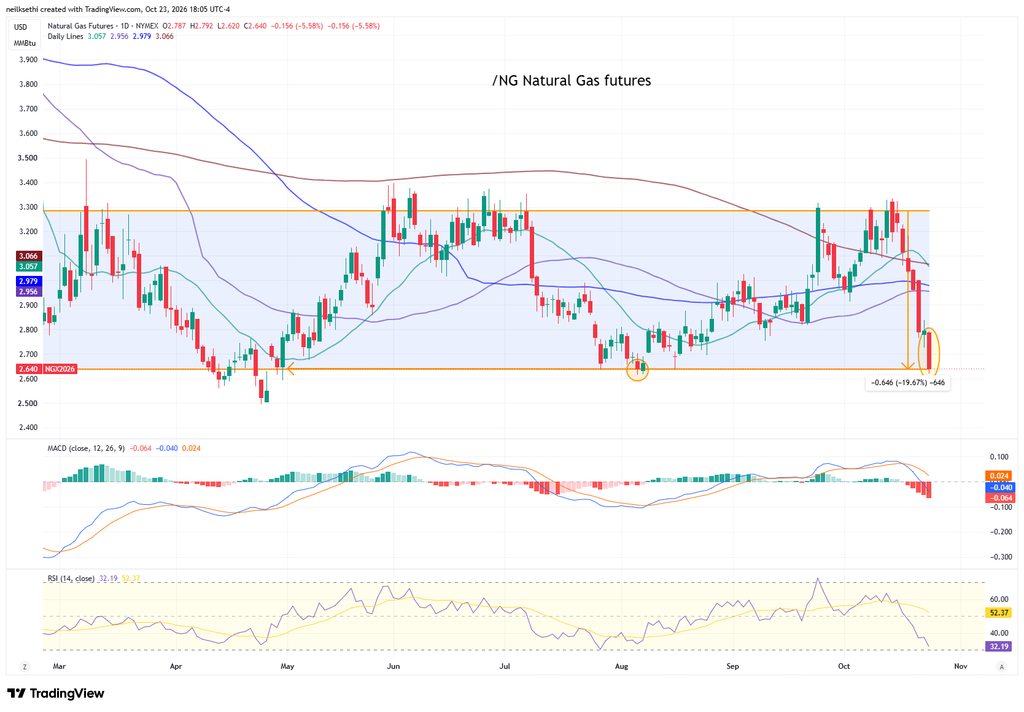
US natural gas futures (/NG) fell another 5.6% (including after hours) now down nearly 20% since October 13th to the joint-lowest close since April.
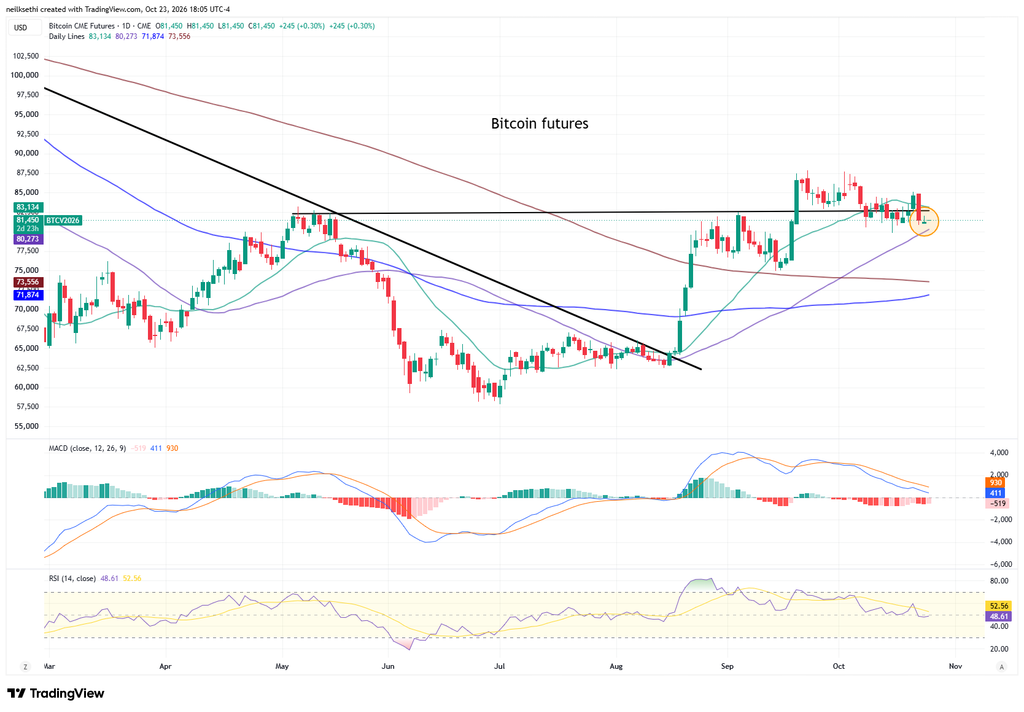
Bitcoin futures little changed hanging on to support. Daily MACD remains weak, and the RSI is under 50.
More From TheStreet Pro:
- Chris Versace –
- James “Rev Shark” DePorre –
- Helene Meisler – Just When They Stop Talking About Broadening Out, We Broaden Out
- Stephen Guilfoyle – Tech’s Capital Problem
- Bret Jensen – Housing Market Feels Like It’s Built on a Sinkhole
- Jason Meshnick –
And From Me If You Missed It:
- Consumer Sentiment Revised Up but Still Second Worst Ever as Inflation
- Flash PMI Holds Near 5-Year High But Prices Jump the Most Since 2022
- Why Has Tech Been So Volatile? (that one is about leveraged ETFs)
- France Puts the ECB in a Bind
- Credit Spreads Are Widening
Wrap-Up – The Rotation Continues
I said Wednesday:
notably today we didn’t see Tech suck the oxygen out of the market with six other sectors green on the day. Also, long bond yields didn’t follow Tech higher. So a number of positive developments. No names on the scale of today’s headliners tomorrow, so we’ll see how markets digest tonight’s batch.
And then followed up Thursday:
the answer is “not well”. As detailed above it was a “sell everything AI” day, so clearly this correction has more to go (which is completely consistent with the Deutsche Bank roadmap I said I should be following which says this should run through at least the end of the month). At this point as far as the AI trade goes the bears are in firm control of both the narrative and the market action, so as I said after Monday’s bounce “it will take more than one or two days to change the trend.” At this point we can’t even string two days together. I exited several more related stocks today and even put on a few shorts as they broke support. That will continue until the AI trade gets back on track.
But as I have also mentioned the past two weeks, the softening in the AI trade has also meant a softening in rates which has freed the rest of the market to make great strides. And now we’re in the midst of the bond short covering I’ve been mentioning almost daily for several weeks. How far all this has to go your guess is as good as mine. But until it stops we have to work with what the market is handing us.
And outside of a few pockets of strength, the market handed us mostly lemons Friday (substitute a fruit you don’t like if you’re a lemon fan). Not helping was another increase in oil prices, this time accompanied by an increase in yields. Does that mean the short covering rally in bonds has run its course? I’ll be interested to see what BofA and Deutsche Bank have to say about that.
As mentioned, though, for now it seems bonds and the non-Tech areas of the market remain tied at the hip. The charts of the equal weight S&P 500 (RSP) and 10-year yields (TNX) have been almost a mirror image the past two months.
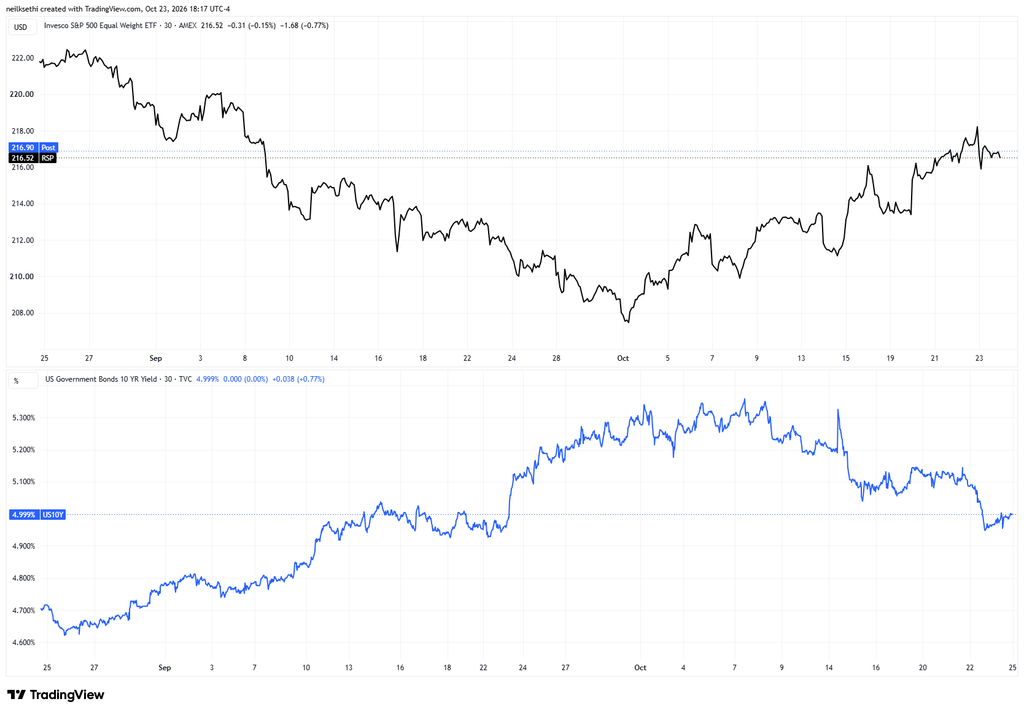
It’s also notable that the softening elsewhere didn’t see a return to Tech so presumably the selling in stocks and bonds today ended up in cash (or maybe oil). I haven’t been this interested to see how all the indicators come out in the Week Ahead for a while, so let’s see where we stand on Sunday.
A Packed Week Ahead
It’s a big week for US economic data, headlined by the advance estimate of Q3 GDP which will also include the September personal income and spending data. Accompanying both those reports will be PCE prices, the Fed’s preferred inflation metric. Other September reports include durable goods orders, new home sales, the advance goods trade balance and the Chicago Fed National Activity Index. October reports include Conference Board consumer confidence, the Chicago PMI, and the Dallas Fed and Richmond Fed manufacturing surveys. For August, we get the S&P Cotality Case-Shiller and FHFA home price indexes. For Q3 we also get the Employment Cost Index (the Fed’s preferred wage inflation index). We’ll also get the usual weekly reports (ADP, mortgage applications, unemployment claims, etc.).
The FOMC meets October 27–28, with the decision Wednesday at 2pm ET followed by Chair Warsh’s press conference at 2.30pm. The blackout period ends after Thursday, with San Francisco Fed President Daly and St. Louis Fed President Musalem already on the schedule for Friday. Abroad, the Bank of Canada (Wednesday), ECB (Thursday) and Bank of Japan (Friday in Tokyo) also announce decisions.
Non-Bill (>1yr in maturity) US Treasury auctions include $69bn of 2-year notes Monday, $70bn of 5-year notes Tuesday and $44bn of 7-year notes Thursday.
Q3 earnings season hits its peak with 168 S&P 500 components reporting (35% of index earnings according to BofA), 33 of them with market caps over $100bn:
- Monday: Verizon (VZ) and Welltower (WELL)
- Tuesday: Visa (V), Coca-Cola (KO), Seagate (STX), Boeing (BA), S&P Global (SPGI) and HCA Healthcare (HCA)
- Wednesday: Alphabet (GOOGL), Microsoft (MSFT), GE Vernova (GEV), KLA (KLAC), Amphenol (APH), T-Mobile (TMUS), ServiceNow (NOW), ADP (ADP) and Phillips 66 (PSX)
- Thursday: Amazon (AMZN), Mastercard (MA), Intel (INTC), Merck (MRK), Caterpillar (CAT), Linde (LIN), SanDisk (SNDK), Gilead (GILD), Bristol Myers Squibb (BMY), Altria (MO), Stryker (SYK), Starbucks (SBUX) and Trane Technologies (TT)
- Friday: Exxon Mobil (XOM), AbbVie (ABBV) and Chevron (CVX)
At the time of publication, in terms of equities mentioned, Sethi was long XOM, CVX, BA, SPGI, GOOGL, MSFT, INTC, AMZN, NOW, LIN, CIBR, T, SPY, RSP, CPER, IBIT, and numerous Treasury ETFs, and short WDC.
As a reminder comments are encouraged. If they are directed at me, please put @NeilSethi in front.