Housing Starts Slide to Second-Least Since May 2020 and Single-Family Permits Weakest Since March 2023
Starts fell more than every Bloomberg estimate with single-family the least in a year, while single-family permits dropped to the lowest since March 2023.
You've reached your free article limit
You've read 0 of 1 free Pro articles.
Executive Summary:
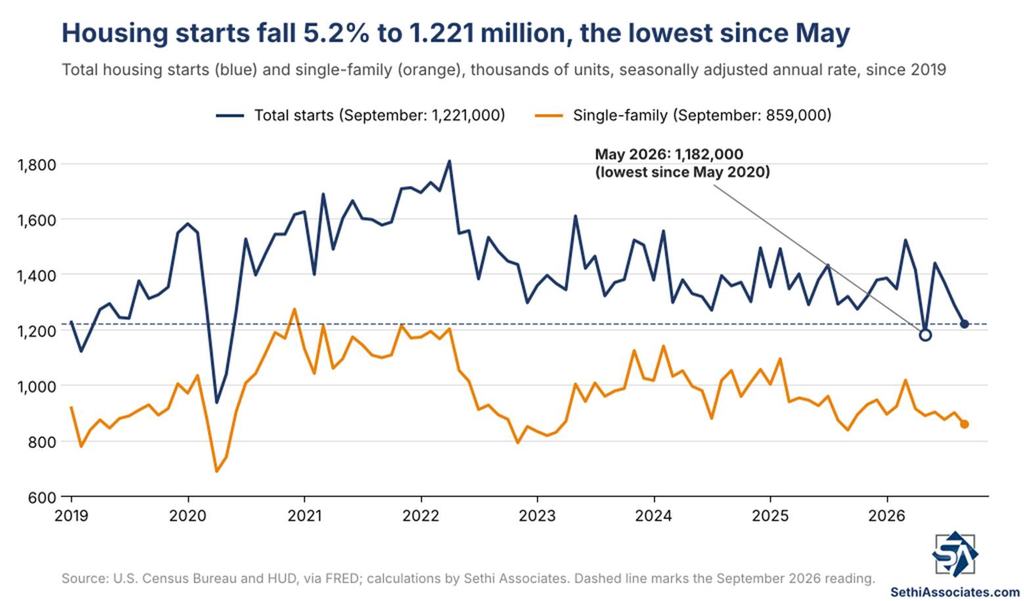
- Housing starts fell 5.2% in September to 1.221 million, the lowest since May (which was the lowest since May 2020), below all estimates in a Bloomberg survey, after August’s decline was revised deeper to 5.9%. Single-family starts fell 4.6%, the most since April, to 859,000, the lowest since September 2025, and multifamily fell 7.2% to 349,000.
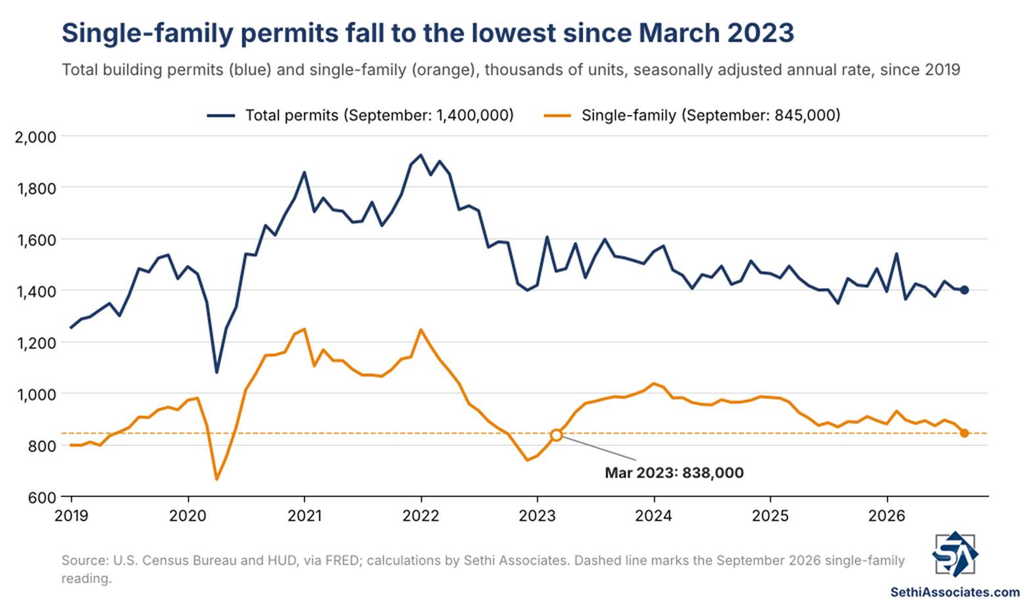
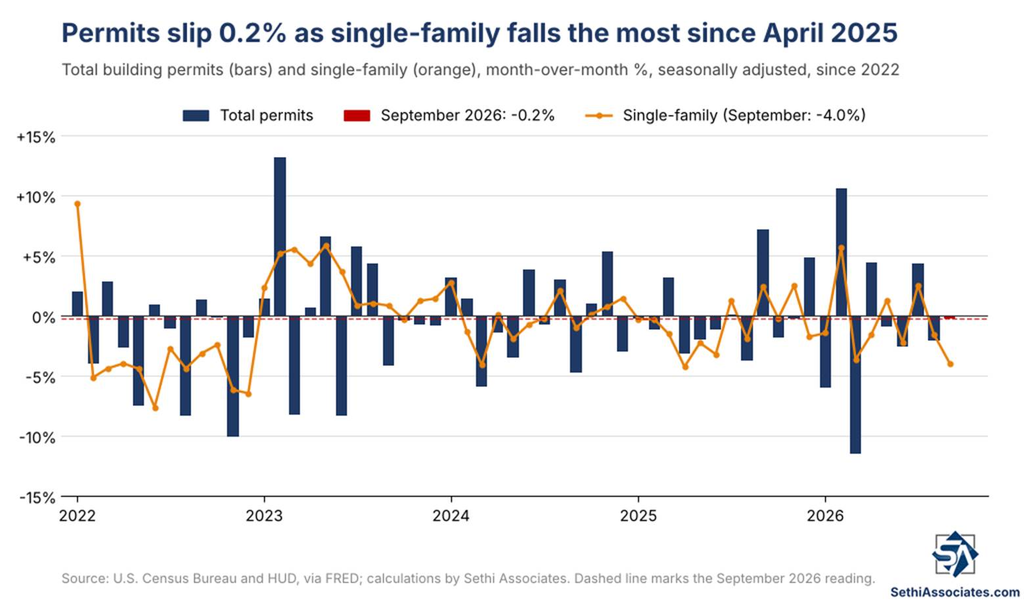
- Building permits slipped 0.2% to 1.400 million, better than expected, but single-family permits fell 4.0%, the most since April 2025, to 845,000, the lowest since March 2023.
- Completions rose 2.2% to 1.192 million, but single-family completions fell to 840,000, the lowest since May 2020, while units under construction held at 1.280 million.
This post will go through housing starts, then permits, then completions and finally units under construction. All figures are month-over-month and seasonally adjusted annual rates unless noted. Single-family refers to one-unit buildings and multifamily to buildings with five or more units. Note this report is subject to significant revision — the 90% confidence interval for housing starts month-over-month, for example, is ±11.8%.
For reference, the Freddie Mac 30-year fixed mortgage rate averaged 6.86% in September, the highest monthly average since January 2025, up from 6.67% in August. The weekly reading climbed from 6.71% at the start of the month to 7.03% on Sept. 24, the highest since January 2025.
Starts
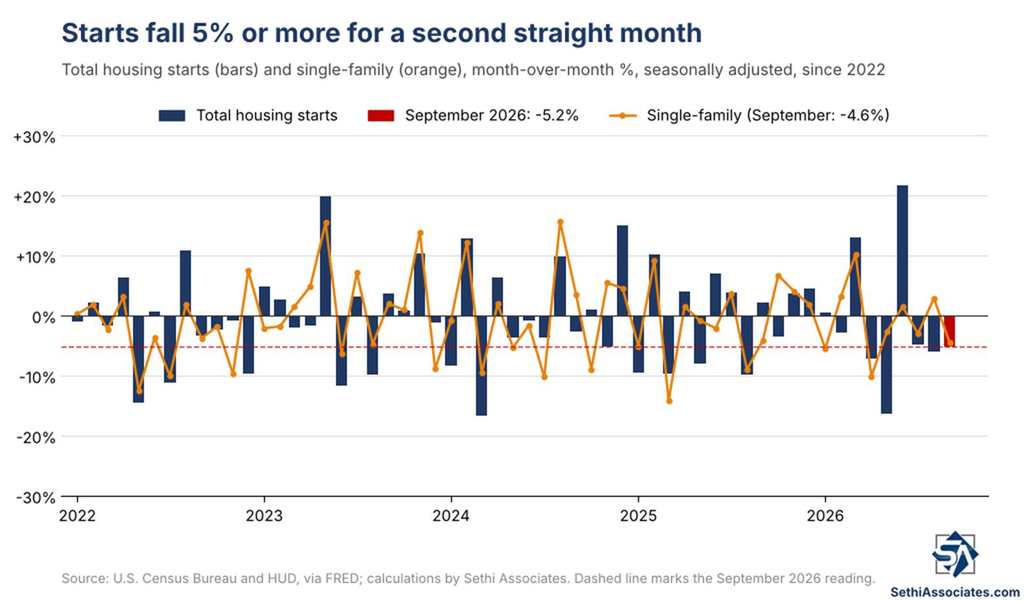
Housing starts fell 5.2% month-over-month in September to a 1.221 million annual pace, the lowest since May (which was the lowest since May 2020), and below all estimates in a Bloomberg survey of economists (1.305 million median). It’s a second straight decline of 5% or more, as August’s drop was revised deeper to 5.9% from 2.6%: August was revised up to 1.288 million (from 1.275 million), and July was revised up even more, to 1.369 million (from 1.309 million).
The decline was broad-based. Single-family starts fell 4.6%, the most since April, to 859,000, the lowest since September 2025, while multifamily starts fell 7.2% to 349,000, the lowest since May. August single-family starts were revised down to 900,000 (from 918,000) and July up to 875,000 (from 853,000), leaving single-family starts averaging 878,000 in the third quarter, down 2.6% from 902,000 in the second quarter.
Single-family starts are the more economically impactful component, though Goldman Sachs left its third-quarter GDP tracking estimate unchanged at +3.3% (quarter-over-quarter annualized).
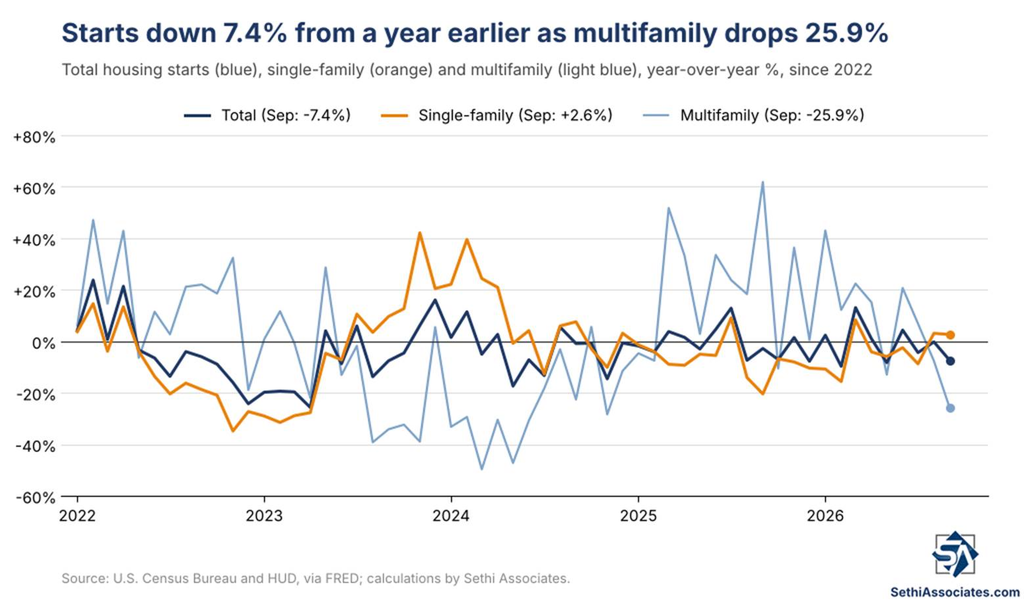
Total starts are down 7.4% year-over-year, with single-family up 2.6% but multifamily down 25.9%, the most since November 2024. Through the first nine months of the year, starts are down 1.1% from the same period of 2025 (not seasonally adjusted), with single-family down 4.0%. Per the Census Bureau, neither the monthly nor the annual change in total starts was statistically significant (the 90% confidence interval for the monthly change ran from -17.0% to +6.6%).
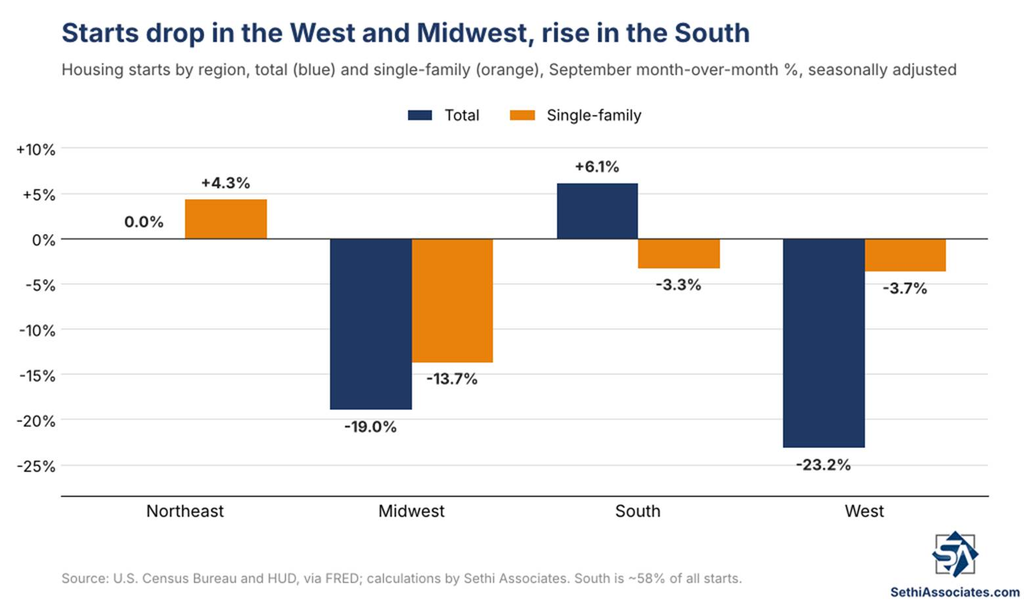
Regionally, starts in the West fell 23.2%, the most since March 2025, to 235,000, matching the lowest since March 2023 (single-family -3.7%), and the Midwest fell 19.0%, the most since February 2025, to 158,000, also the lowest since February 2025 (single-family -13.7%). The South, roughly 58% of all starts, rose 6.1%, but single-family starts there fell 3.3% to 506,000, the lowest since January, leaving single-family starts down in three of four regions. The Northeast was unchanged (single-family +4.3%).
Permits
Building permits slipped just 0.2% to a 1.400 million annual pace, the lowest since June, a smaller decline than the 1.3% expected. August’s drop was revised to 2.1% (initially -2.7%), with August revised up to 1.403 million from 1.394 million.
The headline was held up by multifamily permits, which rose 5.9% to 503,000, the highest since February. Single-family permits, though, fell 4.0%, the most since April 2025, to 845,000, the lowest since March 2023.
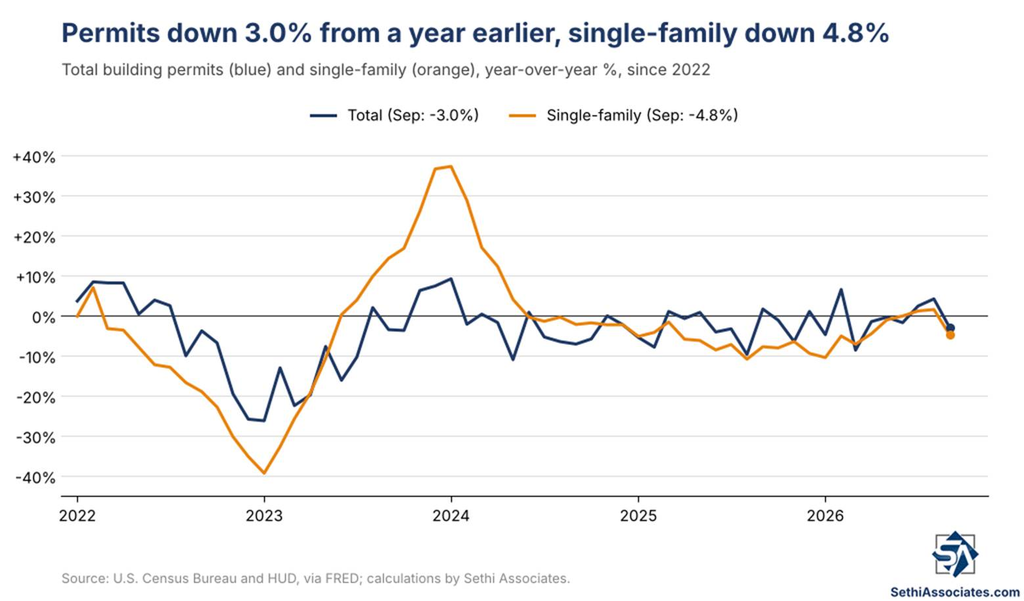
Total permits are down 3.0% year-over-year, with single-family down 4.8% and multifamily up 1.0%.
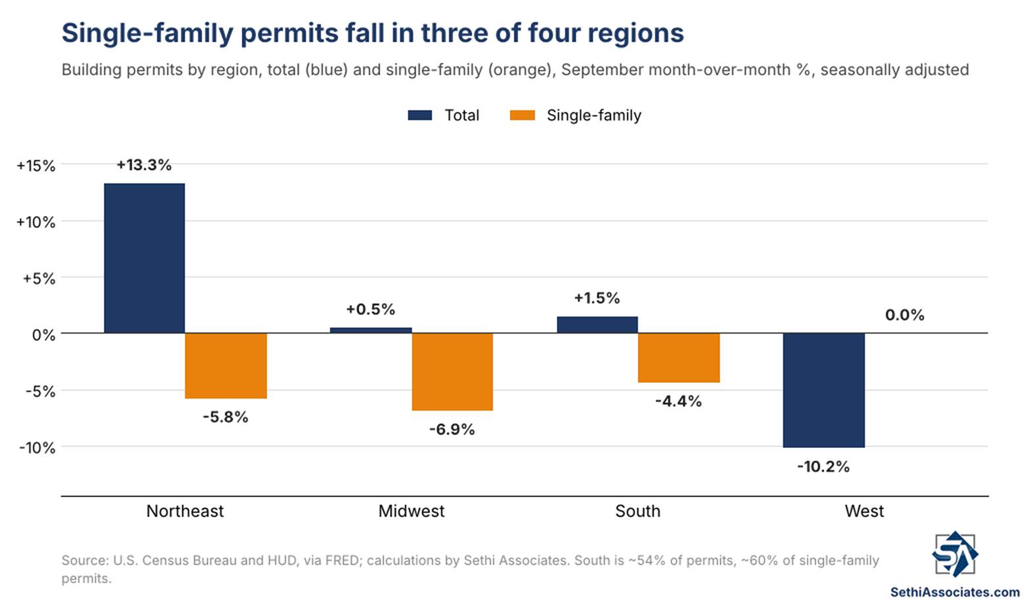
Regionally, single-family permits fell in three of four regions: the Northeast fell 5.8% to 49,000, the lowest since May 2020; the Midwest fell 6.9%, the most since April 2024; and the South, roughly 60% of single-family permits, fell 4.4% to 505,000, the lowest since February 2023. The West was unchanged. Total permits rose in the Northeast (+13.3%), Midwest (+0.5%) and South (+1.5%), but the West fell 10.2% to 283,000, the lowest since April 2020.
Completions
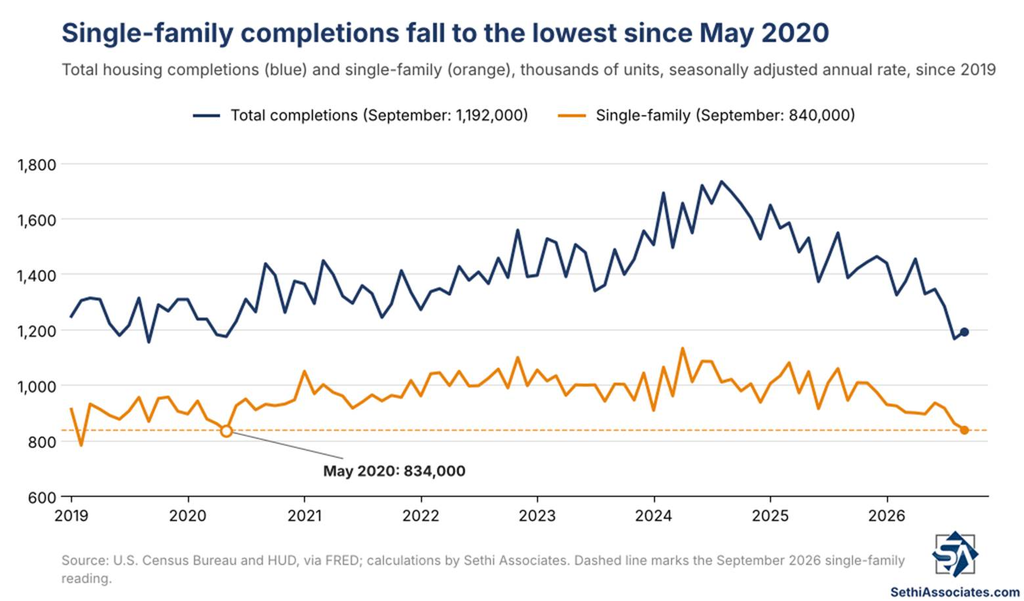
In terms of new supply coming online, completions rose 2.2% to a 1.192 million annual pace, still the second-slowest since May 2020, behind only August, which was revised up to 1.166 million (from 1.128 million) but remains the slowest since September 2019.
The gain was all multifamily, which rose 14.9%, the most since April, to 339,000. Single-family completions fell 2.4% to 840,000, the lowest since May 2020.
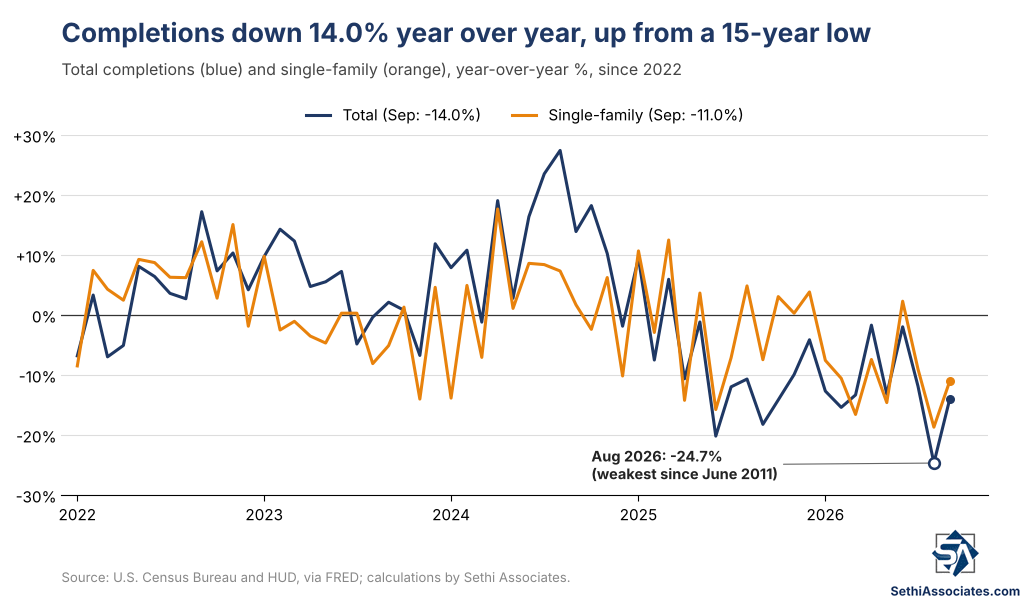
Completions are down 14.0% year-over-year, a statistically significant decline per the Census Bureau, although up from -24.7% in August (revised from -27.1%), the weakest since June 2011. Single-family completions are down 11.0% and multifamily down 20.4%.
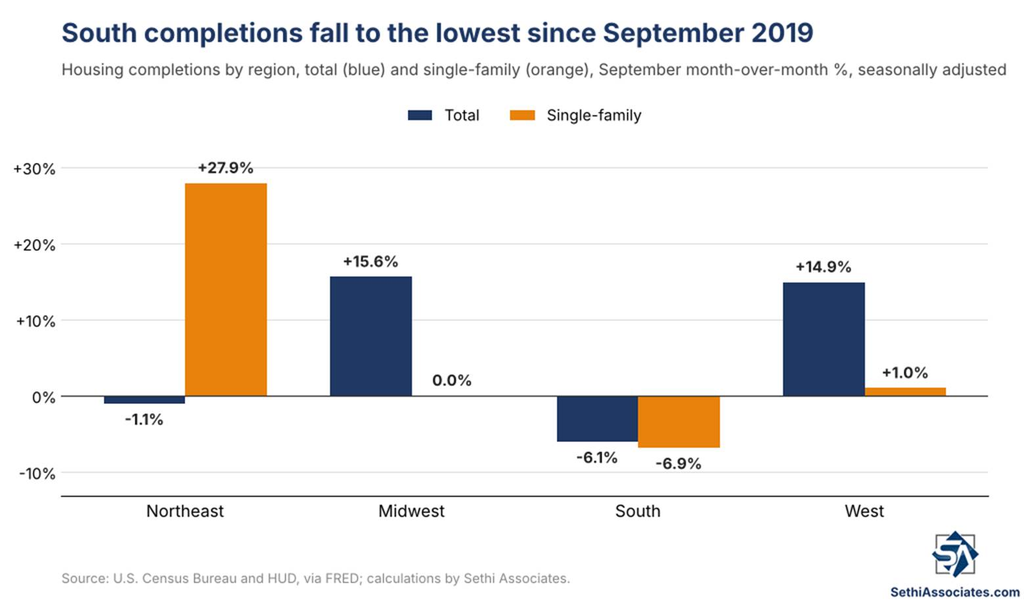
Regionally, completions in the South, the largest region, fell 6.1% to 604,000, the lowest since September 2019, with single-family down 6.9% to 472,000, the lowest since January 2020. The Midwest rose 15.6% (single-family unchanged) and the West 14.9% (single-family +1.0%), while the Northeast slipped 1.1% (single-family +27.9%).
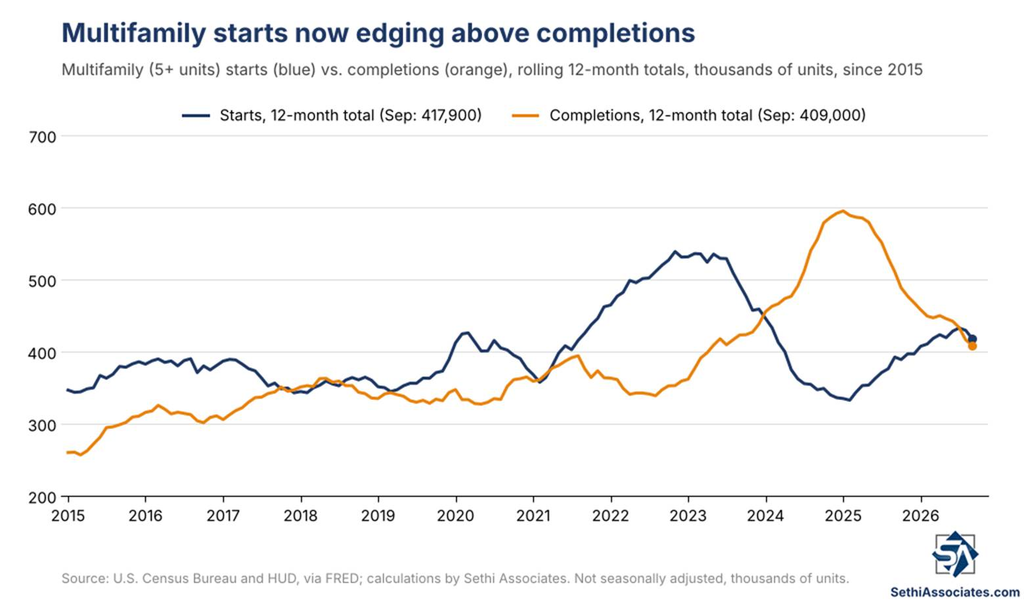
On a rolling 12-month basis (not seasonally adjusted), multifamily starts (417,900) have edged above multifamily completions (409,000) for a second month, the first time since December 2023, after completions ran well ahead of starts through 2024 and 2025.
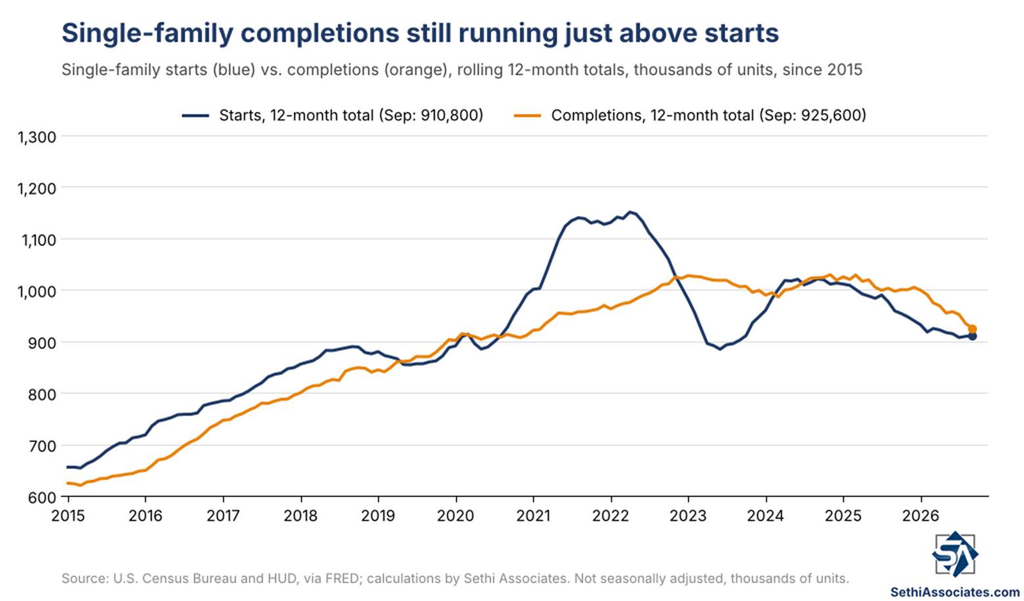
Single-family completions (925,600) remain slightly above starts (910,800), as they have since July 2024, though the gap is the narrowest since July 2025.
Under Construction
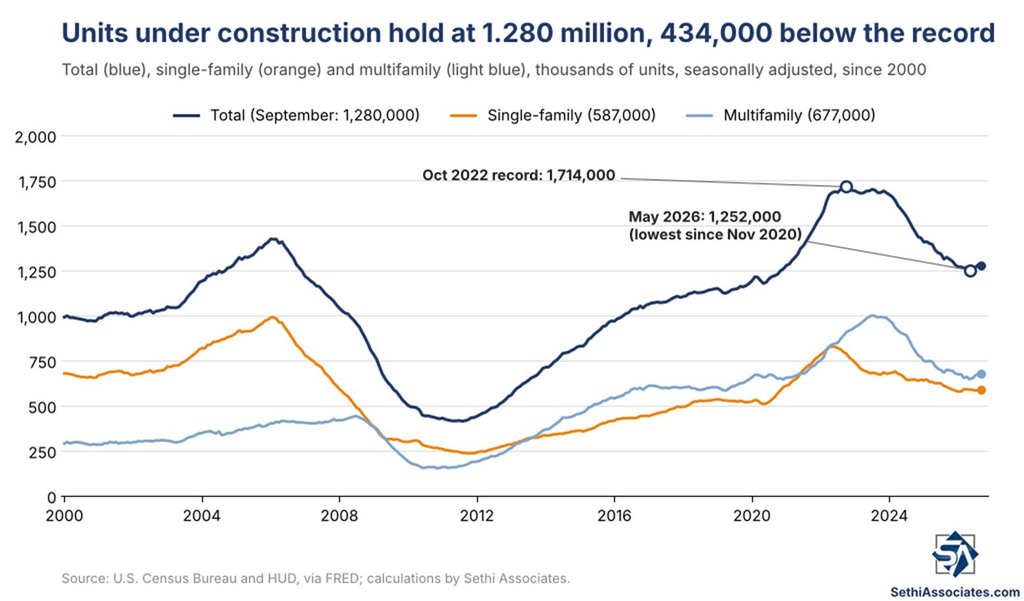
Looking at what’s “in the pipeline,” units under construction held at 1.280 million, unchanged from an upwardly revised August (initially 1.271 million) and down 3.3% year-over-year. That’s 434,000 below the October 2022 record of 1.714 million, but above May’s 1.252 million, which was the lowest since November 2020.
Single-family under construction was unchanged at 587,000 (-2.8% year-over-year), 240,000 below the 2022 peak of 827,000, and multifamily was also unchanged at 677,000 (-3.1% year-over-year), 324,000 below its July 2023 record of 1,001,000.
As Bill McBride of Calculated Risk notes, in the three years before the pandemic there were about 1.1 million to 1.2 million units under construction, “so the current level is still a little elevated.”
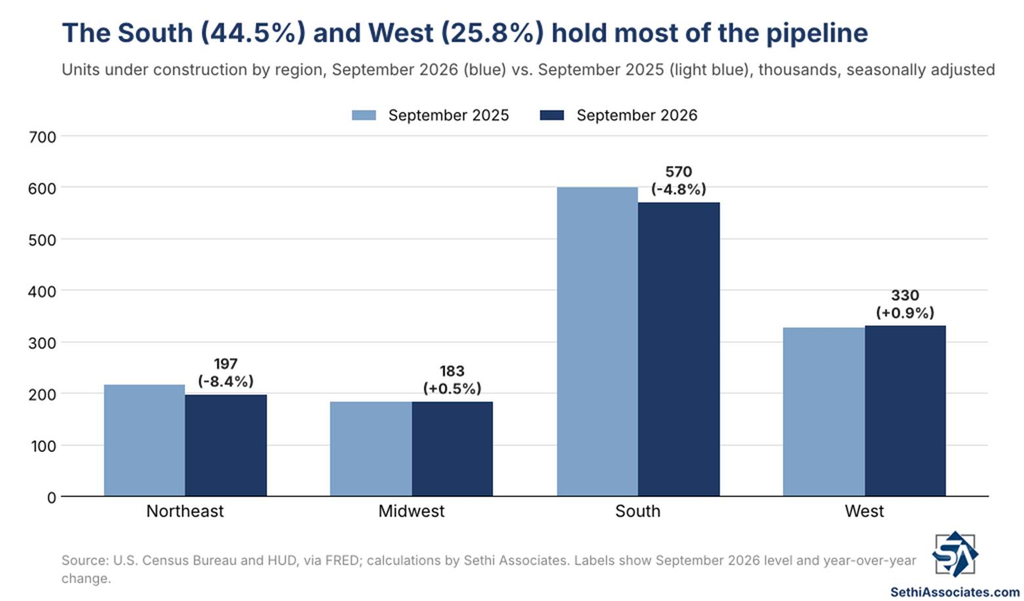
The bulk of the pipeline is in the South (44.5%) and West (25.8%).
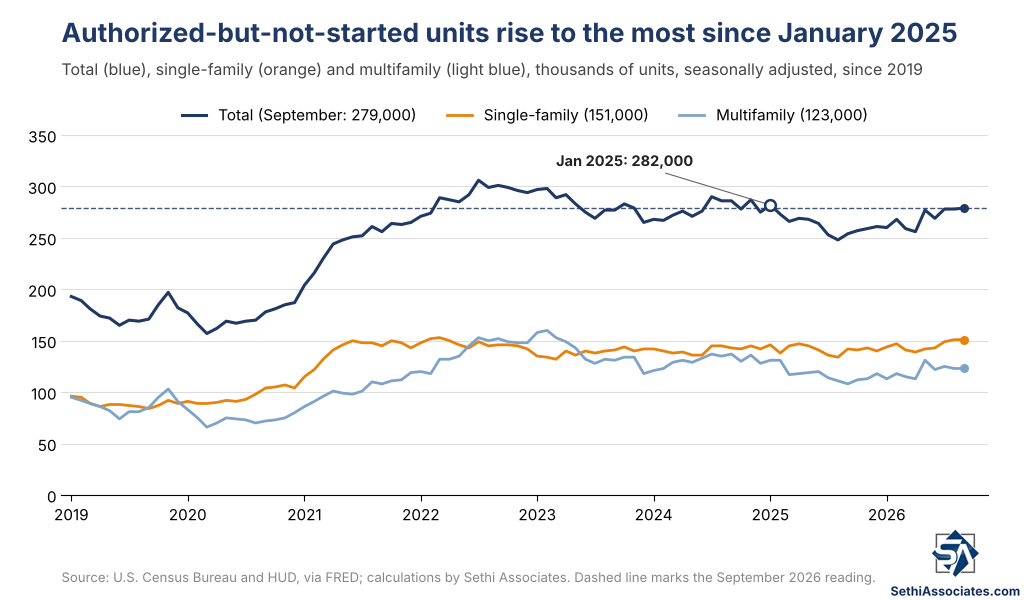
Further back in the pipeline, units authorized but not yet started rose 0.4% to 279,000, the most since January 2025, and are up 9.8% year-over-year, with multifamily up 13.9%, the biggest annual gain since March 2023.
Analyst Reaction
- As Bloomberg noted, “The residential real estate market is being constrained by affordability challenges now further compounded by higher mortgage rates. Homebuilders, whose confidence has slumped to a 14-year low, may also be reluctant to begin construction on new homes before making more progress on inventories.”
- Eliza Winger of Bloomberg Economics: “Housing construction — one of the economic sectors most sensitive to interest rates — is facing intensifying headwinds as mortgage rates have moved significantly higher…With inventories already elevated and builders increasingly pessimistic about future sales, residential construction is likely to remain a drag on interest-rate-sensitive activity in coming months.”
- On growth, Bloomberg pointed out that sluggish home construction has weighed on GDP in five of the last six quarters, and that before today’s report the Atlanta Fed’s GDPNow had residential investment declining at a 1.3% annualized rate in the third quarter.
- Goldman Sachs noted starts “have been particularly volatile this year, with starts increasing or declining by an average of 11.2% month-over-month over the past six months,” and said the decline “is consistent with our view that the recent increase in the available supply of housing, the compression of homebuilder margins back to pre-pandemic levels, and weaker demand due to higher mortgage rates will weigh on single-family starts over the next year.”
- Bill McBride called it “another generally weak report,” noting starts “were below expectations, however starts in the previous months were revised up.”