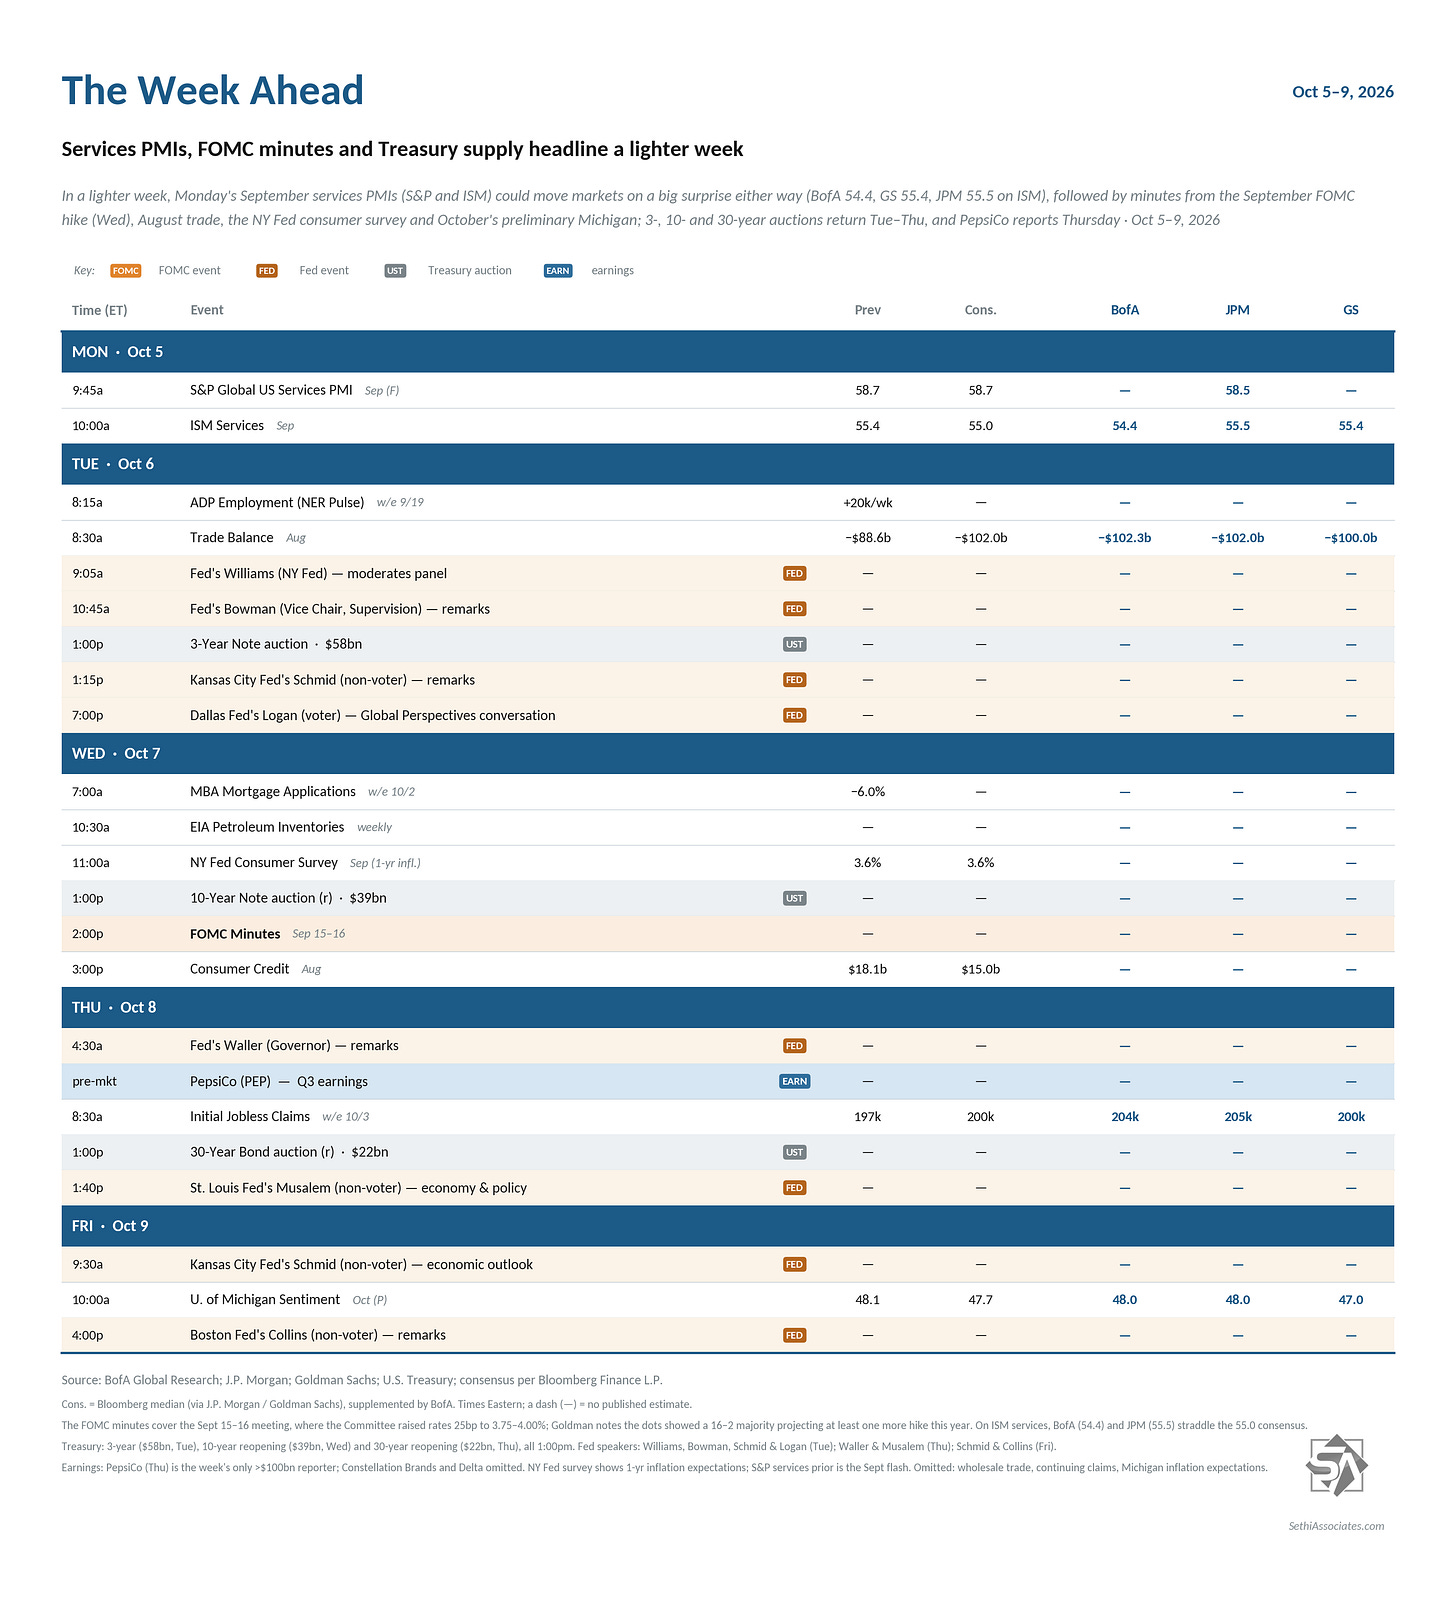
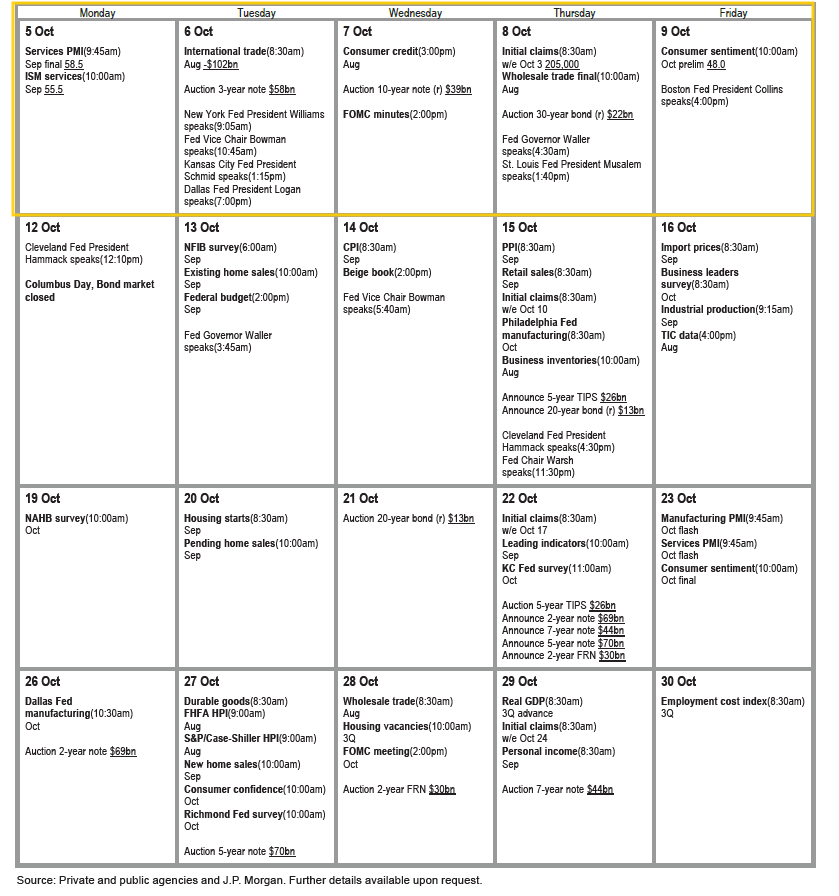
US economic data next week is light before picking back up the following week. The headline is I guess the final services PMIs Monday. We’ll also get August trade balance, consumer credit, wholesale trade, October preliminary UMich consumer sentiment, and the normal weekly reports (ADP, weekly unemployment claims, etc.).
Fed speakers lighter but still plenty with currently Governors Bowman and Waller and regional Fed presidents Williams, Logan, Collins, Schmid and Musalem on the calendar, all of whom we heard from last week, although neither Waller nor Bowman spoke about monetary policy, so hopefully they will this week. More importantly Wednesday we’ll get the minutes from the September meeting. While a bit stale, they always give good color on where the Fed’s collective head was at.
Non-Bill (>1yr in maturity) USTreasury auctions pick back up with 3, 10, and 30-year auctions Tues, Wed, and Thurs respectively.
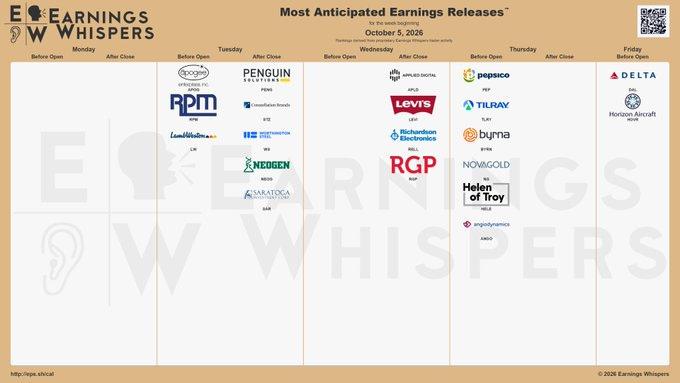
As we await the unofficial start to Q3 earnings October 13th with JPMorgan (JPM), we’ll get just three SPX components reporting next weekConstellation Brands ($STZ), PepsiCo ($PEP), and Luxury Brands Are Selling You More than Just Physical Goods ($DAL). In other corporate events, Microsoft (MSFT) will hold a Windows and Surface event Wednesday and the Paramount Skydance (PSKY) acquisition of Warner Bros. Discovery (WBD) is expected to close Tuesday, with the combined company set to operate under the Skydance name and SKYD ticker.
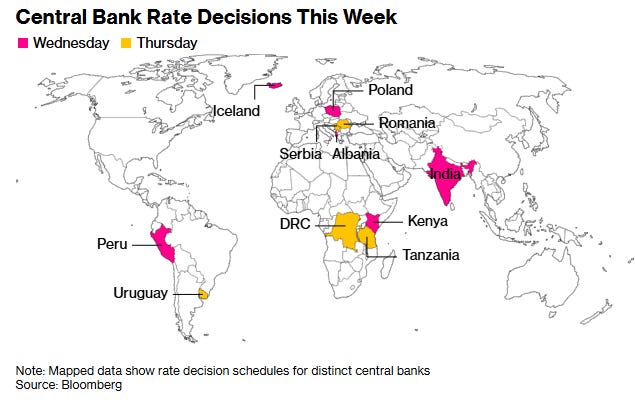
Ex-US highlights from Deutsche Bank:
Moving on to Europe, the ECB will publish the account of its September meeting on Thursday. In economic data, Germany has a busy week ahead, with August factory orders due Tuesday, industrial production on Wednesday, and the trade balance on Thursday. Industrial production will also be released for France on Tuesday and Italy on Friday. Sweden will publish its September inflation report on Wednesday, followed by Norway on Friday.
In the UK, the BoE will publish its Bank Liabilities and Credit Conditions surveys on Thursday, when Governor Bailey is also scheduled to speak.
In Asia, several indicators are due for Japan, including August labor cash earnings on Wednesday, the September Economy Watchers survey on Thursday, and August household spending on Friday. Our Chief Japan Economist expects total cash-earnings growth, on a same-sample basis, to pick up to 3.6% year over year from 2.9% in July.
And a link to Christophe Barraud’s international Week Ahead rundown.
This post will go through in order (in case you want to skip around): the economy, the Fed and interest rates, earnings, valuations, breadth, positioning, sentiment, seasonality, and then my Wrap-Up.
Has Economic Growth Peaked?
Looking first at the economy, my intro has remained the same since the start of the Iran conflict (and longer term, more or less all of the past five years): “we continue to see it weathering the various storms remarkably well due in large part to resilient consumption (boosted by huge increases in wealth over the past few years despite slowing incomes) and AI-spending… with data of late showing a stable (and perhaps accelerating) economy, but one that is also boosting inflation.”
As noted previously, while things tailed off in July into the start of August, the past eight weeks have seeneconomic momentum rebound outside of the housing sector.
Economic data remained fairly strong last week although not as strong as what we saw a month ago:
Factory orders confirmed the strength in core capital goods orders (proxy for business capex) we saw in the durable goods report.
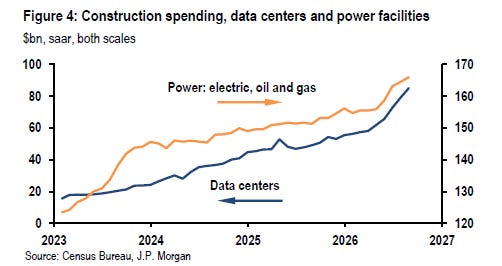
Construction spending surprised to the upside on data center and power spending although manufacturing was the least negative in around two years and remodeling construction was strong (report coming on Monday).
While the trade balance was a negative for GDP growth, the reason was imports coming in much stronger than expected, something which is evidence of a strong, not weak, economy.
On the less positive side though:
Nonfarm payroll growth missed every estimate, wage growth on a year-over-year basis was the weakest since 2021, pulling down the total private-sector take-home pay metric.
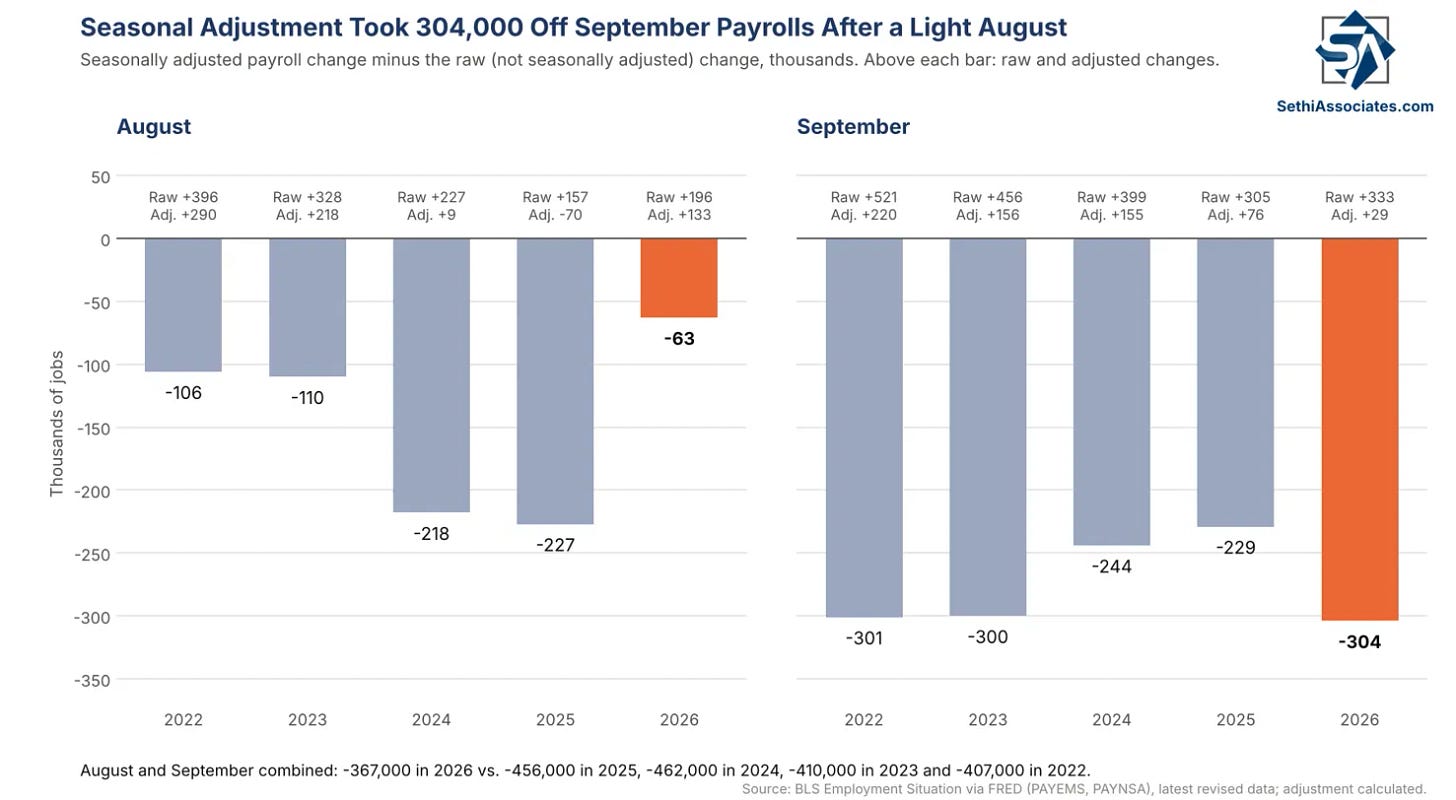
But on the payroll number, note that it was in large part according to BofA due to “a more punitive seasonal adjustment than in ‘25 and ‘24… NSA job growth was stronger than in Sep’25, but the seasonal adjustment subtracted 304k jobs vs 229k a year earlier… Underlying job growth remains steady.”
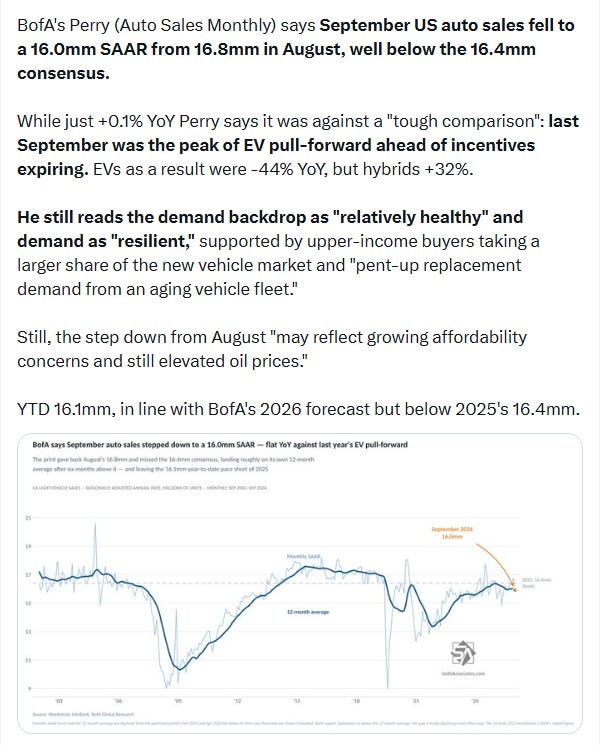
And BofA says auto sales fell to 16.0 million on a seasonally adjusted annualized basis from 16.8 million in August and well below the 16.4 million consensus:
Of course some moderation in growth at the edges is far from a reason to change my outlook. The most concerning at this point is wage growth, but so far that hasn’t dented consumer spending with the large gains in wealth from stock and home prices.
As I mentioned five weeks ago “with the recent strength it seems that we’re back in green light territory, and one or two rate hikes (or 5% Treasury yields) won’t change that.”
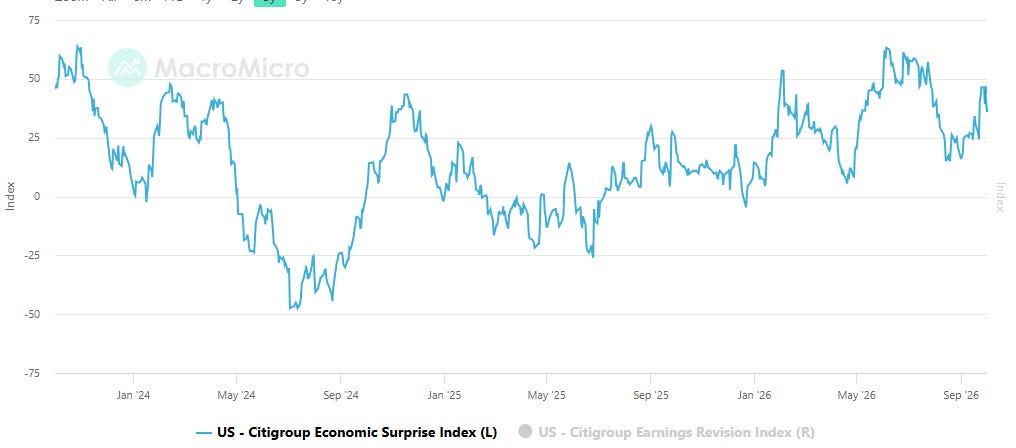
But the Citi economic surprise index did ease back to 37.7 from 46.5 the prior week which was the best since the end of July (when it was falling from 57.1 on July 24th).
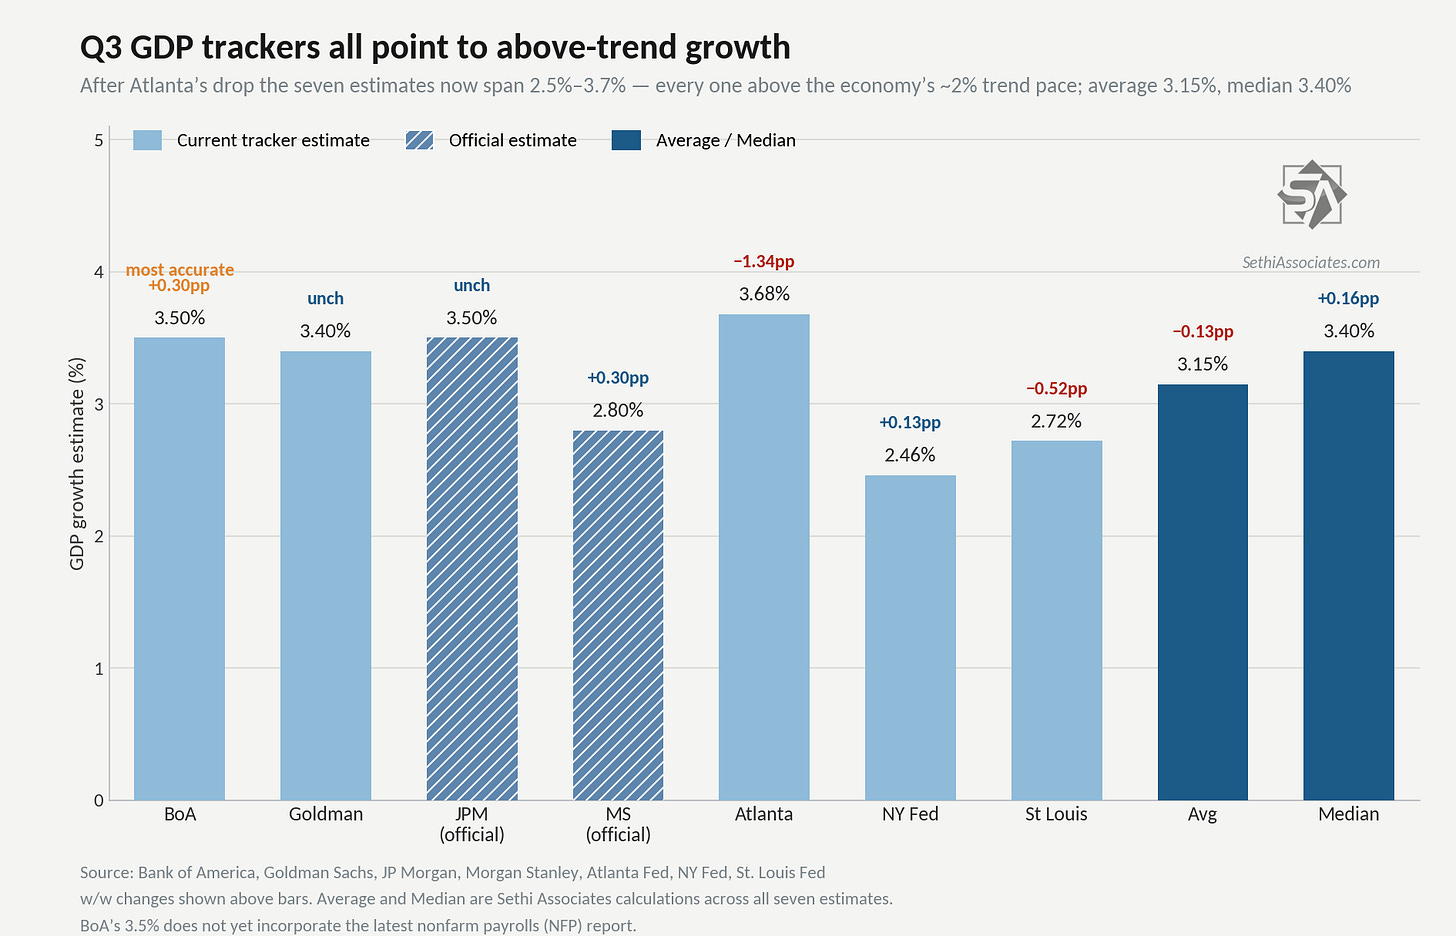
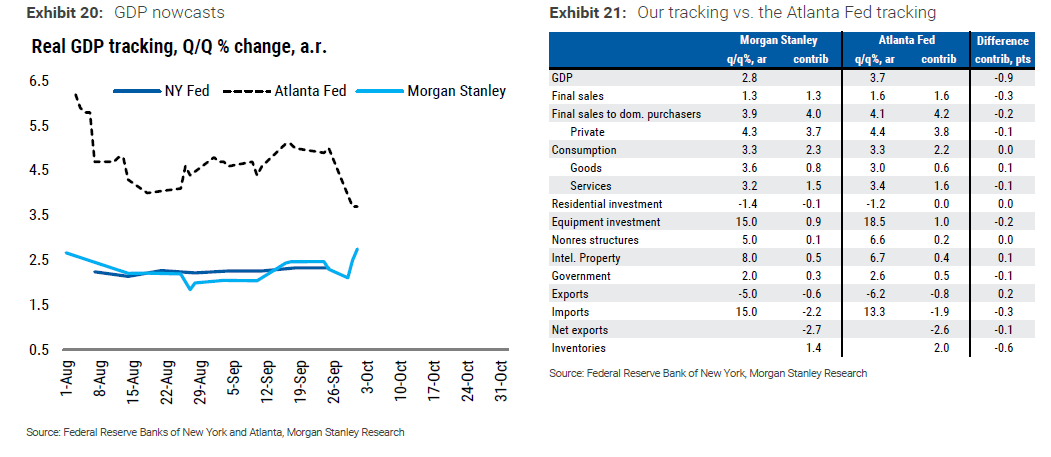
But interestingly Q3 GDP estimates were often held or raised (the Atlanta and St. Louis Fed trackers the exceptions), and while the average fell to +3.15%, the median rose to a very strong +3.40%.
BofA (who has been the most accurate over the past year) +3.5% (+3.0% the prior week) but doesn’t include NFP. Goldman +3.4% (from +3.4%) JPM +3.5% (+3.5%) Morgan Stanley +2.8% (+2.5%) Atlanta Fed +3.68% (from +5.02%) NY Fed +2.46% (+2.33%) St Louis Fed +2.72% (+3.24%) Avg = +3.15% (from +3.28%) Median = +3.40% (from +3.24%)
Here was JPM’s Feroli on his 3.5% estimate:
Last week, we warned that the risks to our 3.5% third-quarter GDP forecast were tilted to the upside. Consumption appeared likely to come in stronger than our 3.5% forecast, while a very strong flash PMI also suggested firmer growth. After this week’s data, however, we are more comfortable maintaining our 3.5% GDP forecast.
The key development was the substantial widening in the August trade deficit. We now estimate that net trade subtracted roughly 2.5 percentage points from third-quarter growth, compared with our prior estimate of a 1.7 percentage-point drag. August inventory data suggest that the larger trade drag will be offset by stronger inventory accumulation. Meanwhile, August consumer-spending data, the decline in September vehicle sales, and soft readings in our Chase card data indicate that there may now be slight downside risk to our 3.5% quarterly consumption forecast.
Even with diminished upside risks, a 3.5% gain would remain very solid, particularly because it would be accompanied by robust domestic final sales. That would follow an upwardly revised first half of the year, when GDP growth was revised from 1.8% to 2.4%, including a revision to second-quarter growth from 1.5% to 2.2%.
We have expected consumer spending, equipment investment, and intellectual-property-products investment to be strong in the third quarter. A more recent positive surprise has been nonresidential structures investment, which we now expect to rise 7% at a quarterly seasonally adjusted annual rate after 10 consecutive quarterly declines. Previously, we had assumed that this category would not begin to grow until next year.
This improvement follows a resurgence in data-center construction growth, alongside repeated upward revisions to prior months. In addition, the decline in spending on technology-manufacturing facilities—which had been rolling off a CHIPS Act–supported peak—has abruptly abated in recent months. Power-related construction, especially electric-facility investment, has also surged. Excluding these three segments, nominal private nonresidential construction spending has been essentially flat since the start of the year, after having dropped steadily since 2023.
And MS (Gapen) on theirs:
Our third-quarter GDP tracking estimate increased to 2.8%…. A wider-than-expected [August] trade deficit subtracted 0.1 percentage point from growth, reflecting much faster import growth, but this was more than offset by stronger equipment investment and inventory accumulation. Revisions to the monthly consumption path and prices lifted our third-quarter consumption estimate to 3.3% from 2.9%. August construction data, together with revisions to July, also raised our estimates for nonresidential structures investment and government spending.
Through the third quarter, consumption is rising at a 2.6% annual rate—0.5 percentage point faster than last year. GDP revisions provided some support for the recent pace, as gross domestic income, personal asset income, and the saving rate were all revised higher. Business fixed investment continues to boom, and inventory investment appears to have risen in the third quarter for the first time in a year and a half.
The Atlanta Fed’s GDPNow estimate fell sharply to 3.7% from 5.1%. The main difference between its forecast and ours is inventory investment: GDPNow estimates that inventories will add 2.0 percentage points to third-quarter growth, versus our estimate of a 1.4 percentage-point contribution.
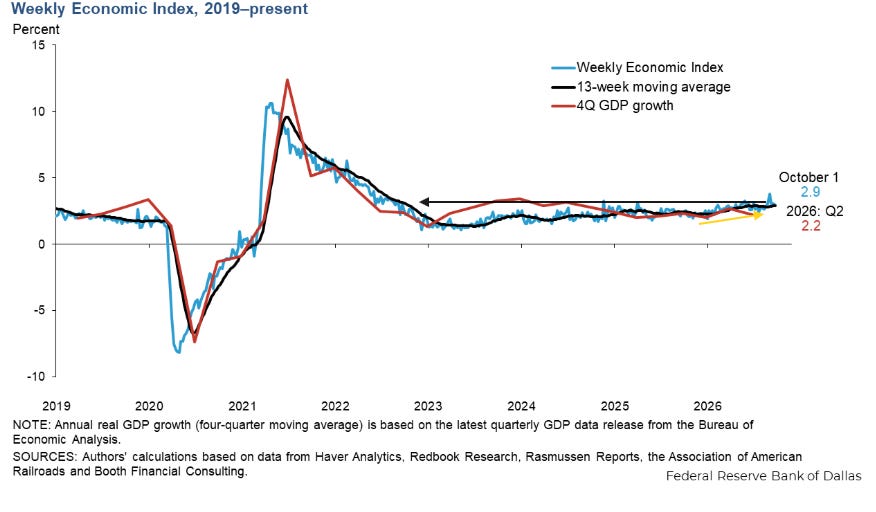
And as you know if you’re a regular reader, one of my favorite GDP trackers is theWeekly Economic Indexfrom the Dallas Fed.*
In the week through September 26th (so doesn’t have last week’s data) it eased back to +2.93%, from +3.02% the prior week, ending a four-week run above 3%, its longest since 2022.
The 13-week average accelerated to 2.91%, also the best since 2022, continuing to evidence economic momentum that is above trend.
*The WEI is scaled as a y/y rise for real GDP(so different than most GDP trackers which are Q/Q SAAR) and uses 10 daily and weekly economic series but runs a week behind other GDP trackers.
It has over time had one of the highest correlations with actual GDP of any tracker(see chart)although for Q2 it came in highpredicting +2.80% y/y GDP growth vs the actual first estimate of +2.10%, while for Q1 it predicted +2.48% vs 2.66%. More importantly, it has consistently indicated no recession and relatively healthy growth since the pandemic (which is what we’ve experienced).
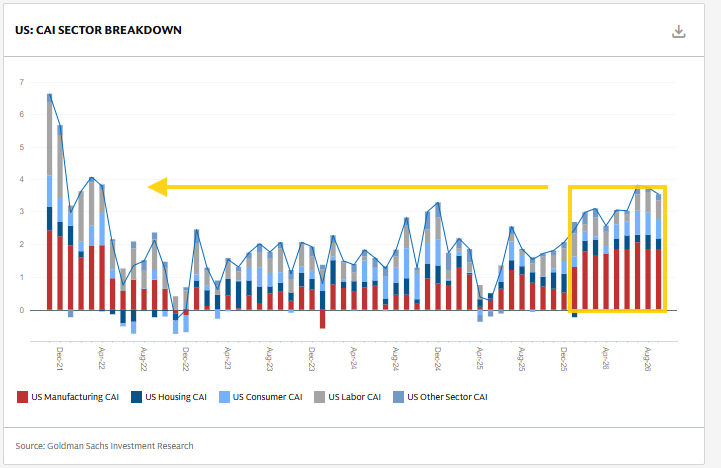
And Goldman downgraded their September US Current Activity Indicator* two tenths to +3.5%, but July was revised up to +3.8% making that the best since April 2022 (August was +3.6%). That continues the strongest 9-month period since then as well.
*The CAI is their “real-time measure of inflation-adjusted economic momentum using 37 inputs.”
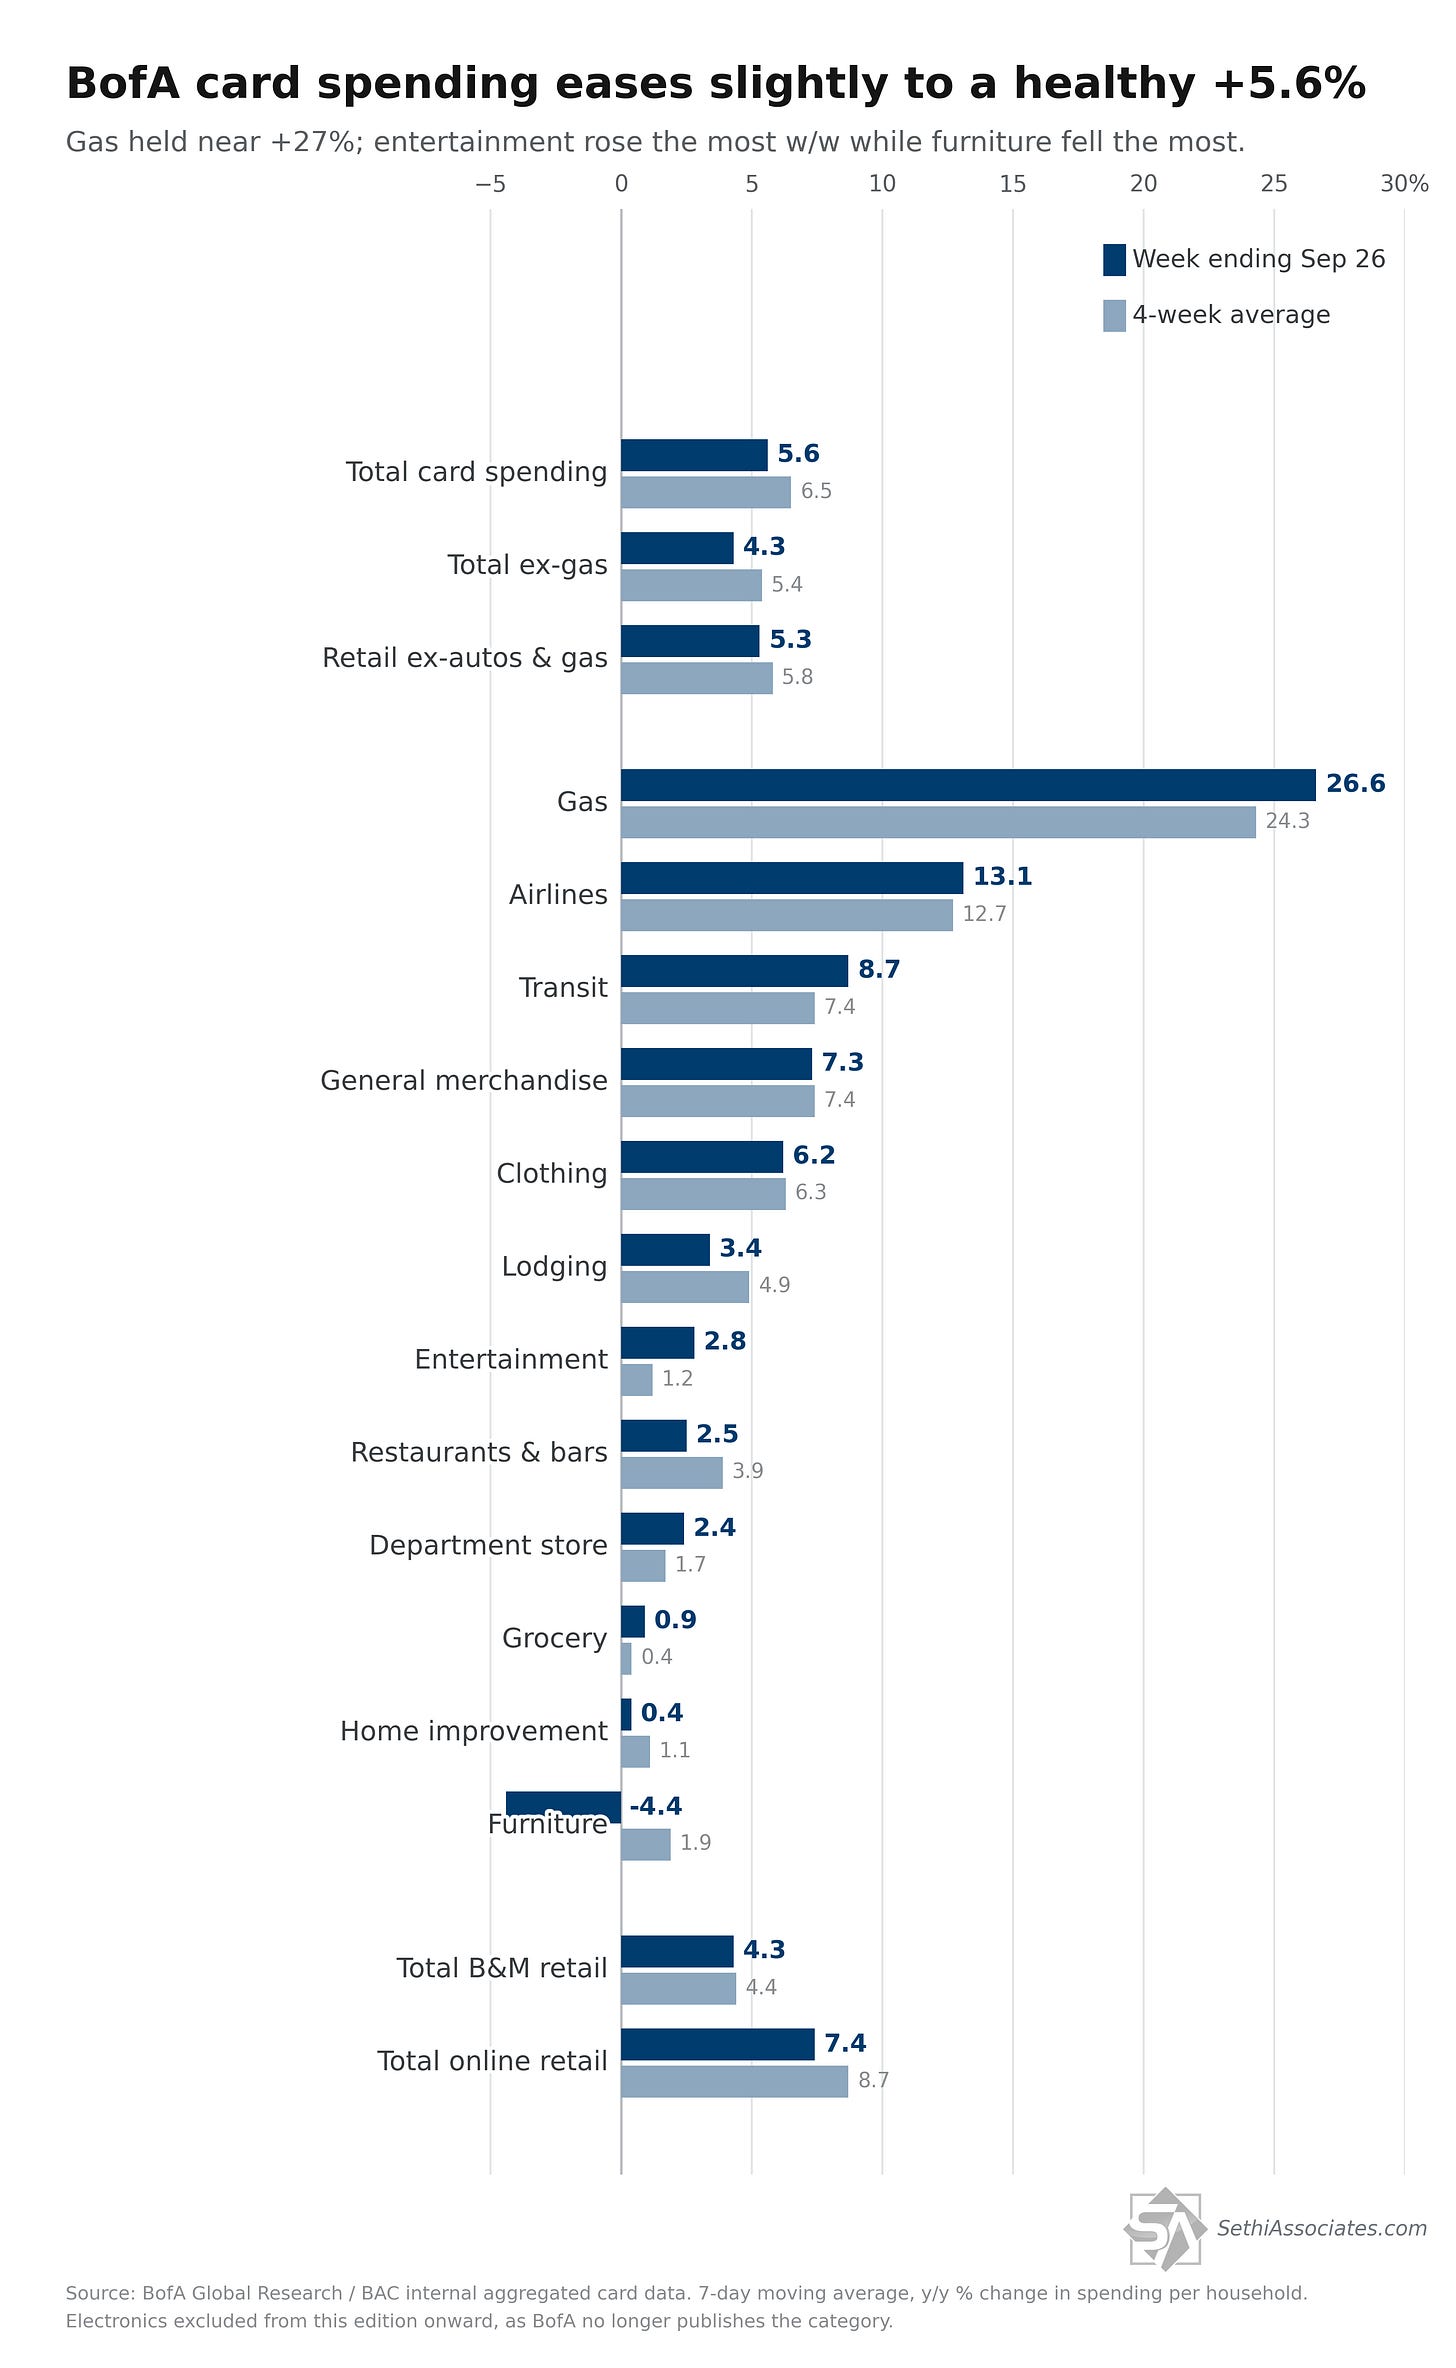
BofA card spending (credit+debit) slowed slightly but remained healthy at +5.6% versus the year-ago period (y/y) in the week ending September 26th, down from +6.9% the prior week.
Ex-autos and gasoline +5.3% (+5.8% four-week moving average)
Gasoline edged to +26.6% y/y (from +26.5%), the highest in their tracking, with pump prices remaining elevated.
On the income split, BofA noted that after a brief reversal last week, lower-income spending growth again outpaced higher-income. That’s notable given gas prices remain near their highs, since last week BofA had blamed surging gas for reopening the gap.
Among categories, beyond gas, airlines stayed strong at +13.1% (from +15.4%), transit firmed to +8.7% (from +7.5%), and general merchandise (+7.3%) and clothing (+6.2%, from +4.0%) were solidly positive. Entertainment saw the largest week-over-week increase, rising to +2.8% from +0.2%. Online retail eased to +7.4% from +9.1%, possibly as the lift from new electronics releases faded.
Lodging (+3.4%), restaurants & bars (+2.5%), department stores (+2.4%), grocery (+0.9%, back positive from −1.0%) and home improvement (+0.4%) were also up from the year earlier. Furniture saw the largest decline, falling to −4.4% from −1.9%, and was the only category negative y/y.
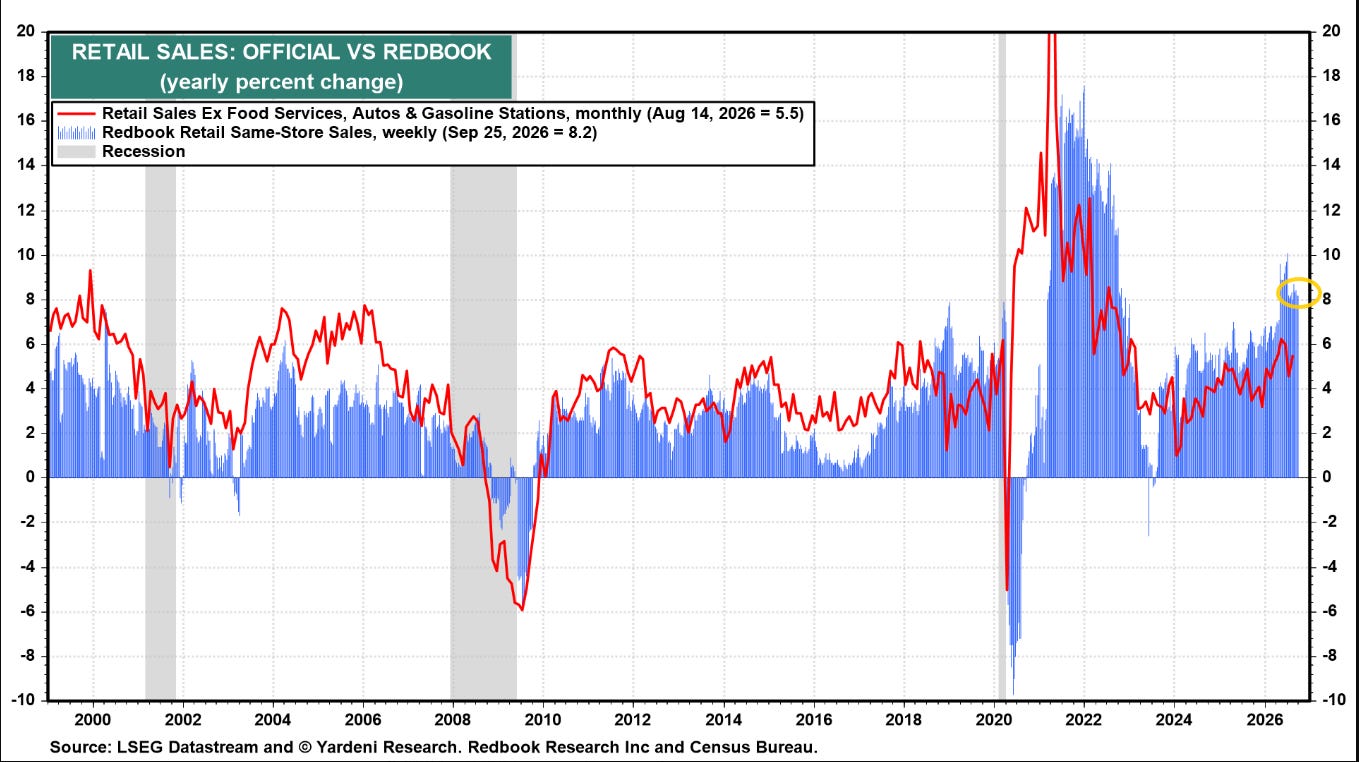
Redbook sales*in the week of September 25th remained at +8.2% y/y growth, continuing to sit well above the 2025 average of +5.8% y/y.
*Redbook sales are same-store sales across a panel of large general-merchandise retailers, such as department stores, discount chains, apparel retailers, drugstores, and warehouse clubs.
Fed Rate Hike Expectations Ease Back But Bond Yields Remain Near Their Highs
Turning to interest rates and the Fed, I had mentioned two weeks ago that
I don’t have a strong feeling at this point as to whether they go in October. A lot probably depends on how the September data (NFP, CPI, PPI) come out (even as the Chair says the committee doesn’t pay much attention to any one data point). We’ll also get a lot of Fed speakers this week, so we’ll see what they say.
And so far, as discussed in the economic section above, the data has continued to come in very solid although perhaps showing some softening. More importantly, though perhaps were the inflation metrics in the personal income and spending report. As I wrote in my post on the report, “August core PCE prices rose 0.247% month-over-month rounding down to a tenth below expectations with the year-over-year at 3.01%, three tenths below the 3.3% consensus on benchmark revisions.”
While there was much to quibble about under the hood, Goldman pushed its expected October hike to December, noting: “Today’s inflation report, especially the downward revisions resulting from the methodological changes, imply that core PCE inflation is likely to substantially undershoot the median FOMC participant’s forecast of 3.4% for 2026 on a Q4/Q4 basis. We now expect a 3.0% increase for core PCE in 2026 on a Q4/Q4 basis.”
And while it was certainly not just due to that report, we saw two key Fed members come out Tuesday (NY Fed President Williams) and Thursday (Vice-Chair Jefferson) making it clear that the core of the Fed (which is comprised of typically the Chair, Vice-Chair and NY Fed President and also almost certainly includes Powell, so a third of the FOMC) sees “no need for urgency” for a rate hike.
For more on Williams’ speech:
And from Jefferson:
It would be highly unusual for two such high profile Fed members to give such a speech without having cleared it with the Chair. In fact, I think it is not unlikely that they did it in close coordination to try to bring down the market probabilities on an October hike which had exceeded 70%.
As a side note, we also got a speech from the hawkish wing as well that was more constructive with Minneapolis Fed President Kashkari (a dissenter at the July FOMC wanting a rate hike then) saying Thursday that while he expects rate hikes will be needed to restrain the economy, he is “open minded” about the pace and said “I don’t have a strong view” when asked about an October hike.
As MS Gapen wrote:
We read the comments from Williams and Jefferson as indicating that the center of the Committee is increasingly inclined to raise rates at a slower pace—potentially at every other meeting—rather than at consecutive meetings.
That interpretation aligns with our forecast that the Fed will leave policy unchanged at its October meeting, raise the federal funds target range by 25 basis points in December, and deliver a third 25-basis-point increase in March.
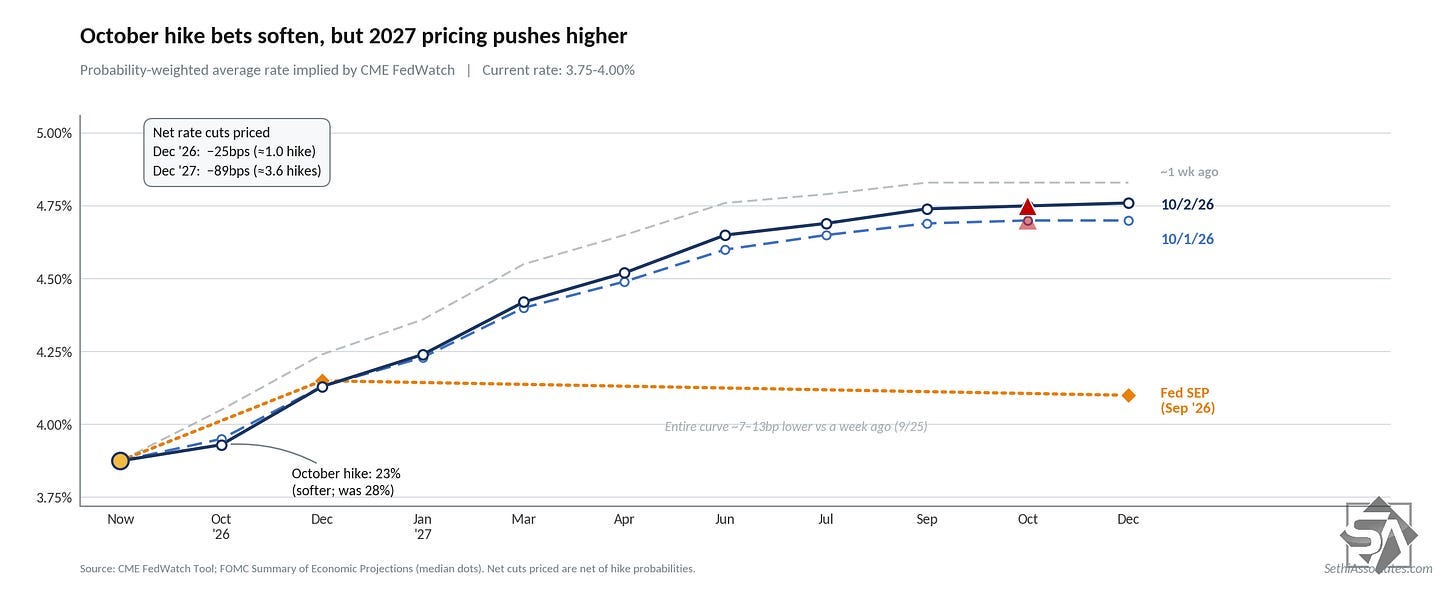
But while I thought 70% was a bit high for pricing an October hike, I similarly think 23% may be a bit low with September CPI and PPI still ahead. Hot prints on those may very well swing the committee. That is also the view of MS’ Gapen:
While we read this week’s incoming data and Fed speak as pointing toward a measured pace of policy re-calibration, things can still change. The upcoming September CPI report is more important in our eyes than the revisions to PCE inflation and September employment. A hot reading could change the calculus for the Fed.
As well as JPM’s Feroli:
We continue to look for the next hike in December, though it’s still possible that a firm set of September inflation reports could tilt the risks back toward an October hike.
And that was confirmed by the Chicago Fed’s Austan Goolsbee, who tends to drift between very dovish and mildly hawkish. He said he didn’t see much signal from the payrolls number, reiterating that he’s focused on inflation, although after the jobs report he sounded less hawkish, in keeping with that drift.
And it should also be noted that while near-term rate hike odds have softened quite a bit, those for 2027 have seen much less easing, with still around 90 basis points (so 3.5 hikes) priced from here through December 2027.
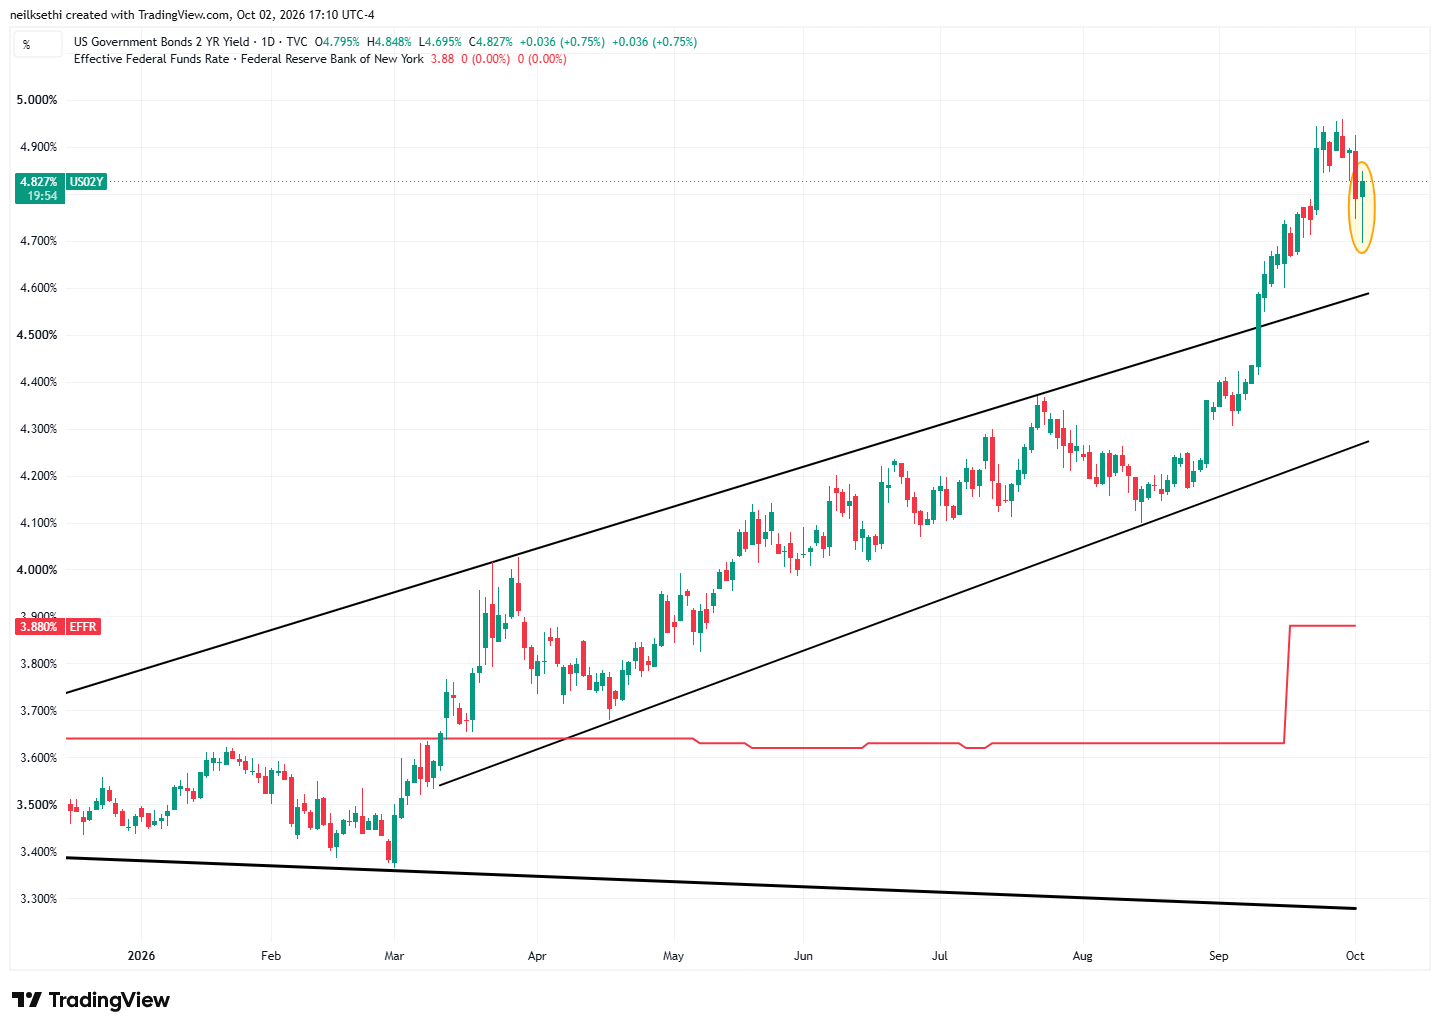
Which has kept the 2-year near its since-2024 highs. It remains ~95 basis points above the Effective Fed Funds rate, well above the 25-50 basis point historic average.
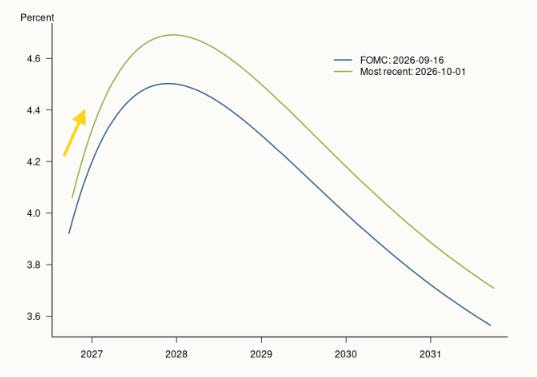
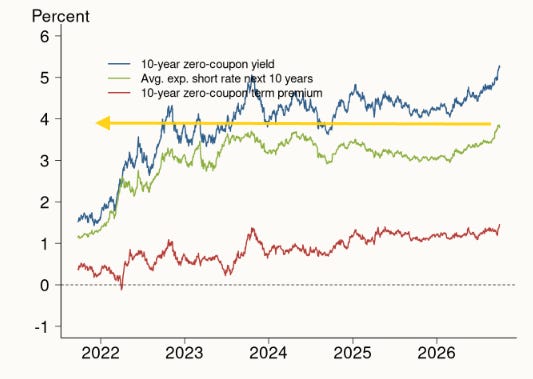
It should be noted that as with bonds, we’ve come a very long way in terms of Fed rate hike expectations over the past year. Looking at the San Francisco Fed’s Treasury yield premium model, a year ago expectations were that the Fed policy rate would be around 3% by the end of next year and average that level over the next 10 years. That is now up to around 4.7% at the end of next year, and averaging 3.8% over the next 10 years. That’s higher than during the Fed’s historic tightening cycle in 2022.
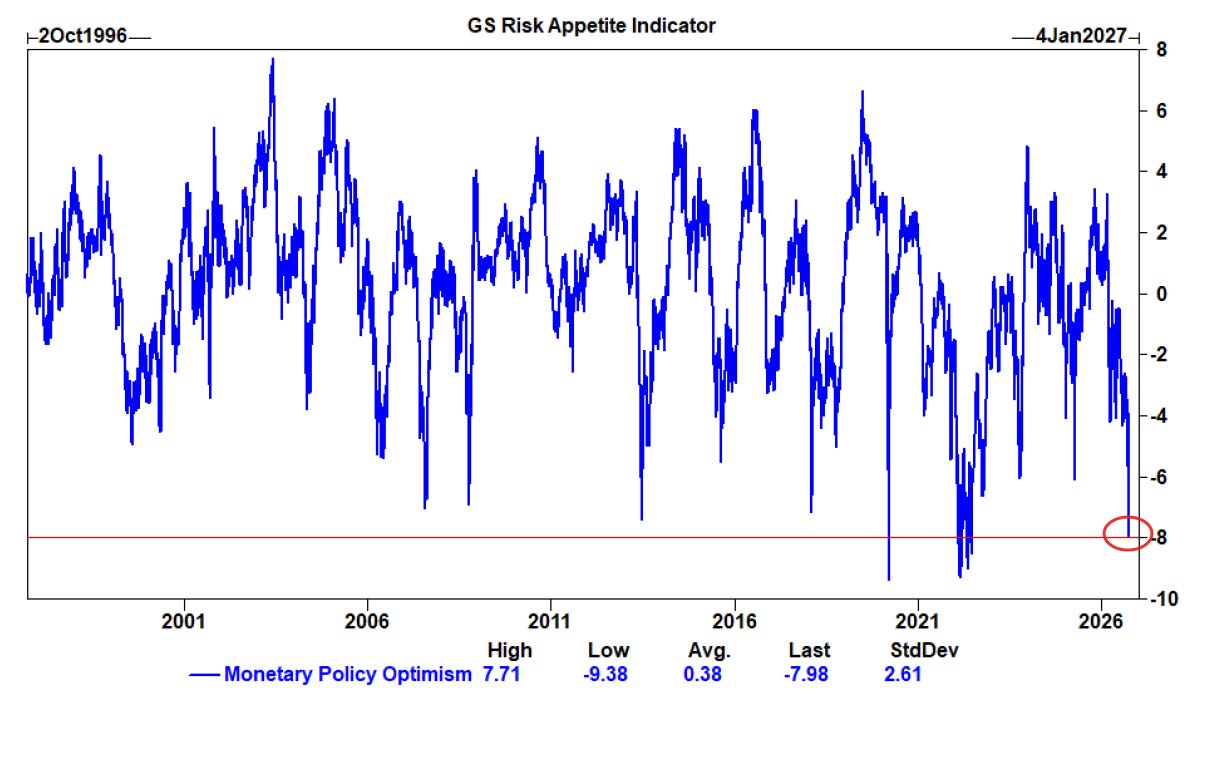
And Goldman’s “Monetary Policy Factor” in their Risk Appetite Indicator is at -8, neat the lows in 2022 and 2018, both which were in the midst of much more aggressive tightening cycles (and both of which saw 20% drawdowns in the SPX).
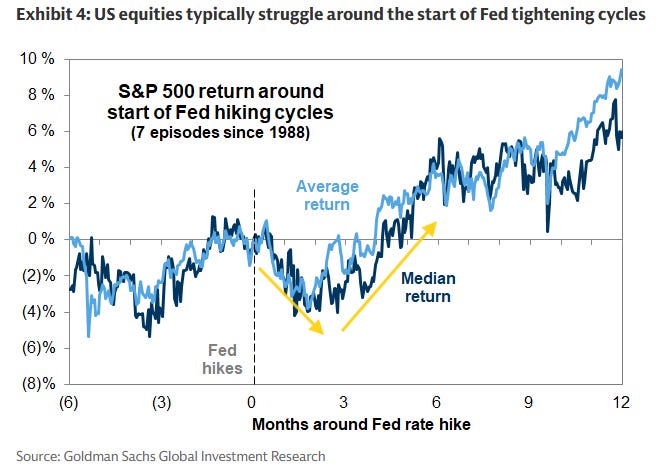
And just another reminder the equity weakness we’ve seen since the September rate hike is not unusual:
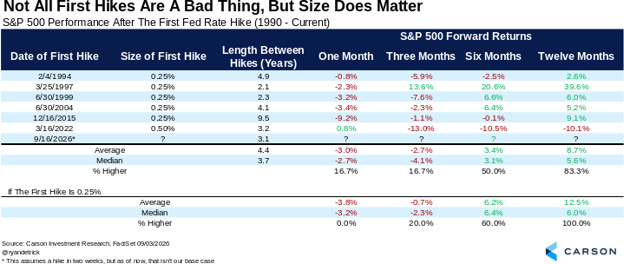
Goldman:The S&P 500 has generated an average 3-month return of -2% at the start of seven hiking cycles during the last few decades. However, the S&P 500 then generated an average 12-month return of +9%, with positive returns in every episode but 2022. In 1997, for example, the S&P 500 declined by 10% alongside the Fed’s 25 bp hiking “cycle.”
And from Carson Research:
Five recent hiking cycles started with 0.25%. Stocks were lower a month later all five times. A year later, they were higher all five times, up 12.5% on average.
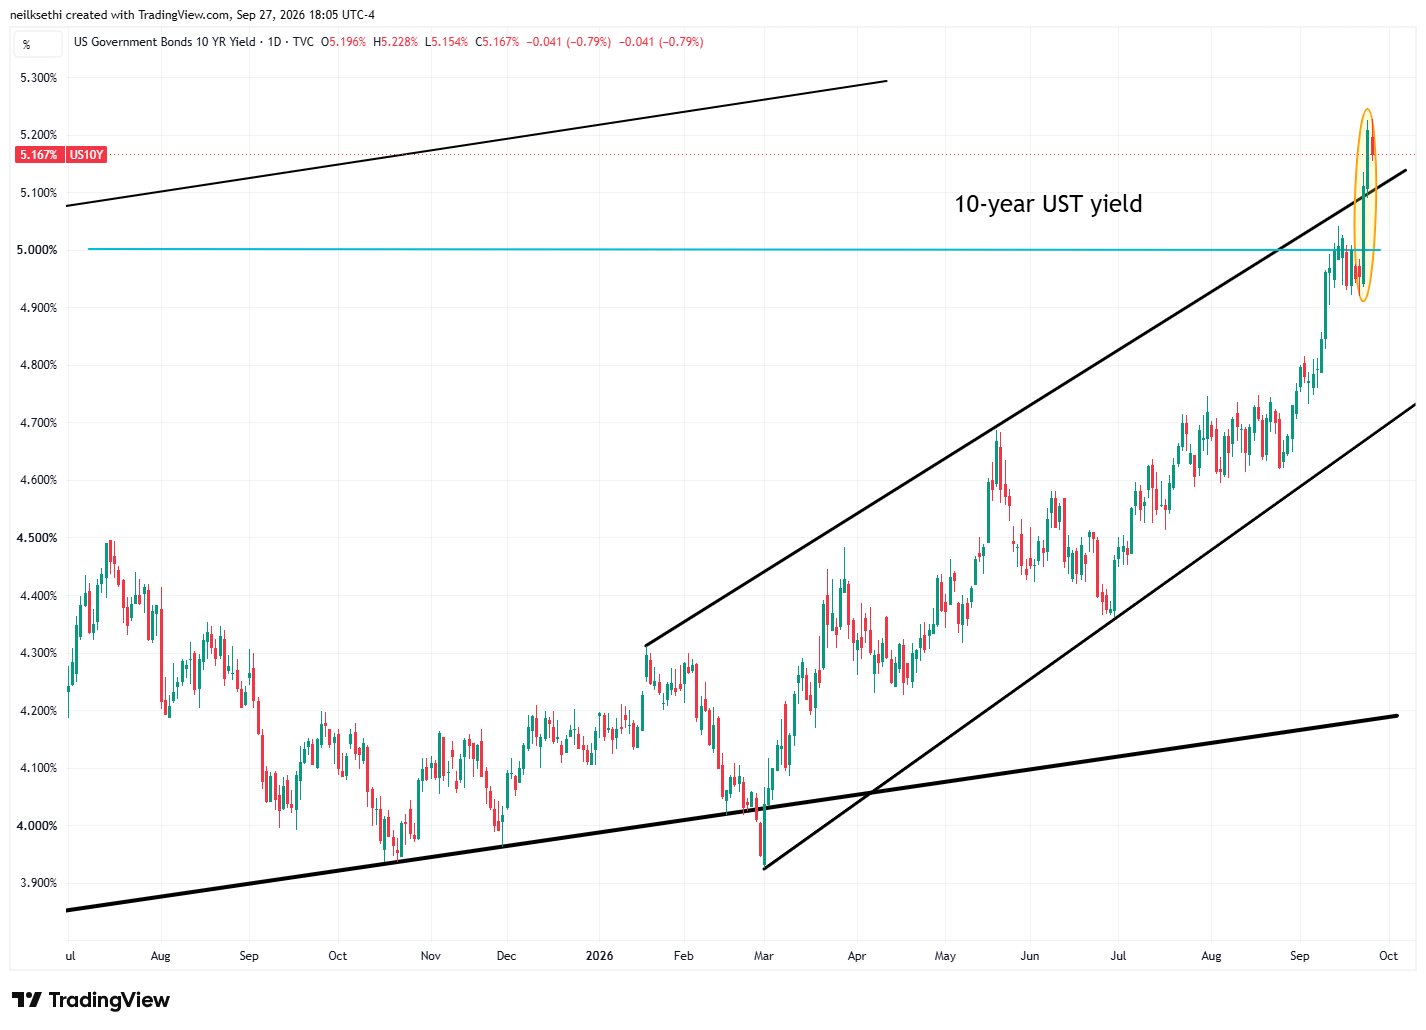
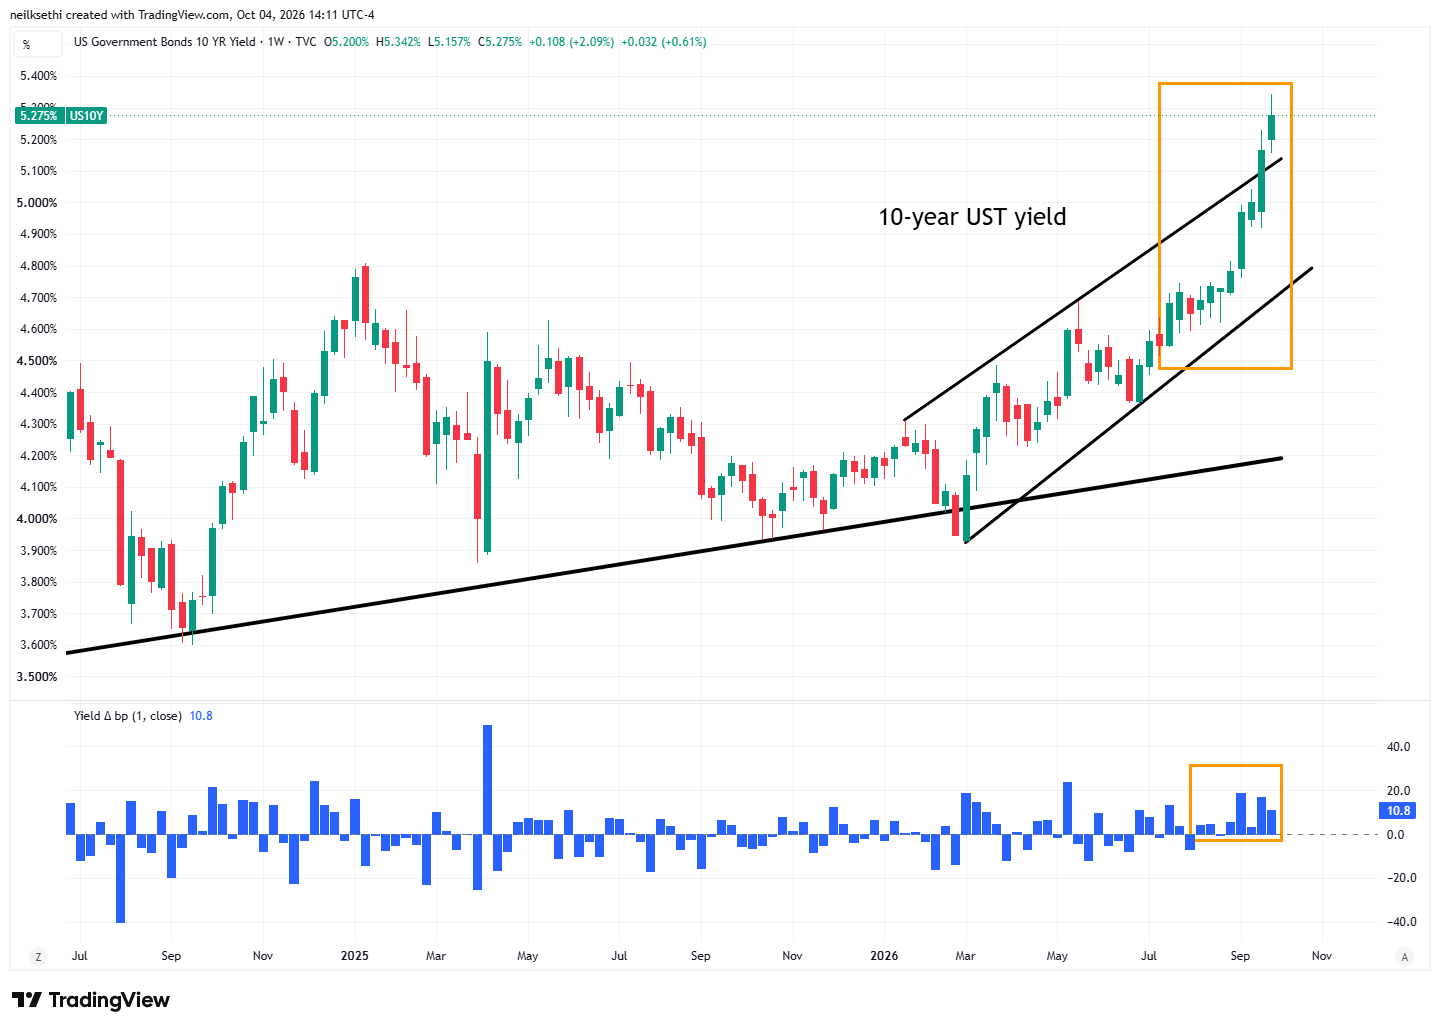
And as noted Friday, longer maturity yields (10-year and 30-year) are just a couple of basis points from their since-2002 highs.
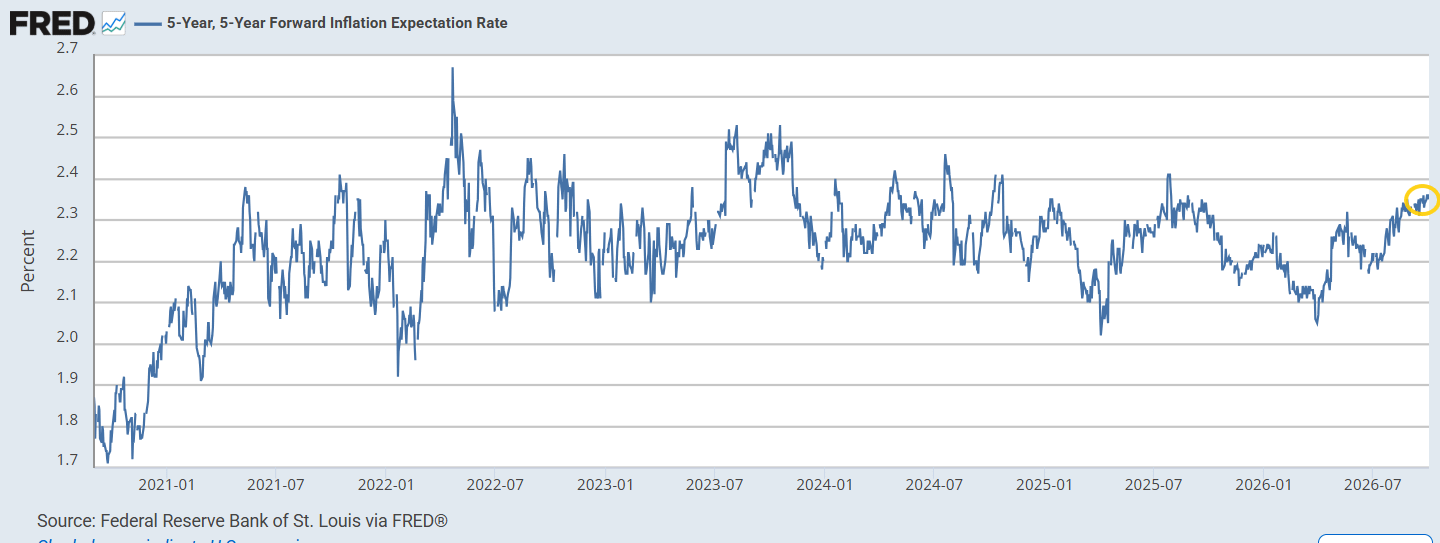
That’s as inflation expectations remain well below their highs with the Fed favorite5-year, 5-year forward rate(expected inflation starting in 5 years over the following 5 years) Friday at 2.35%. While around the highest in a year it’s well below the peaks in 2022 and 2023.
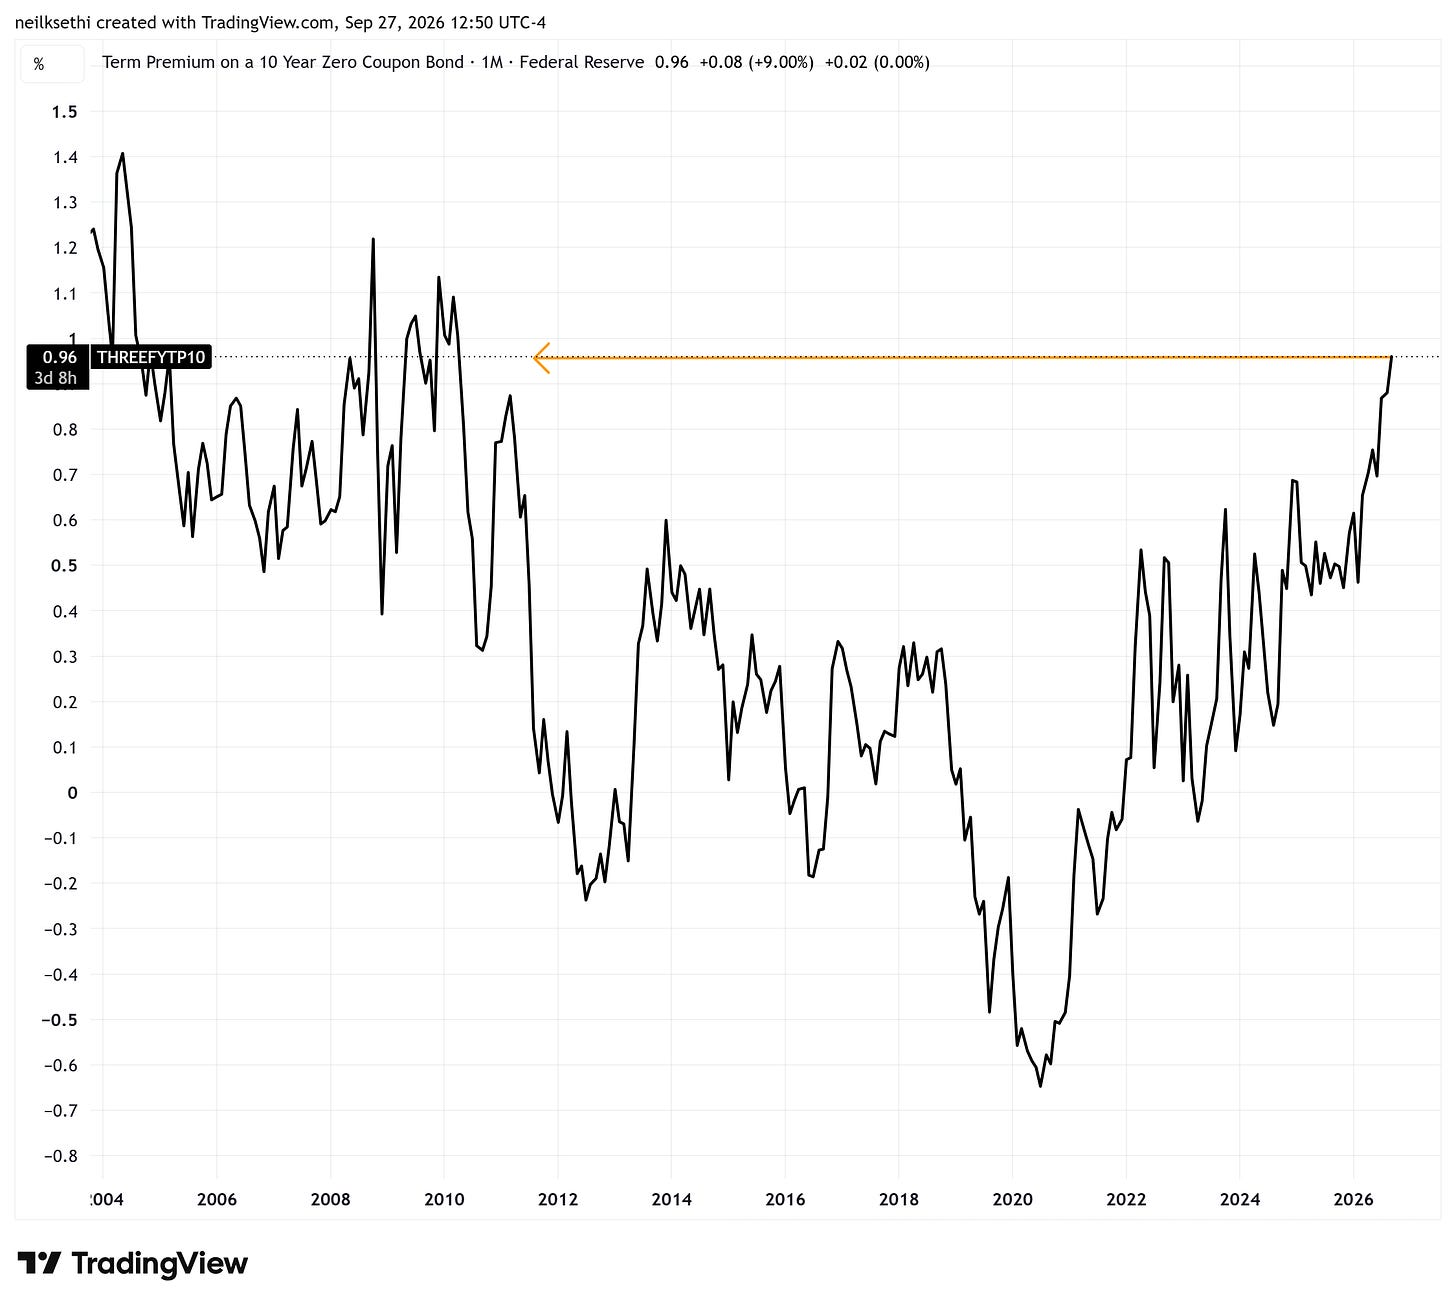
Which leaves term premium (extra yield investors demand to hold a longer-term bond instead of continually rolling over short-term bonds for the same period) the main source of pressure on the long-end with the Kim-Wright model for the 10-year pushing to another weekly high, the highest since March 2010.
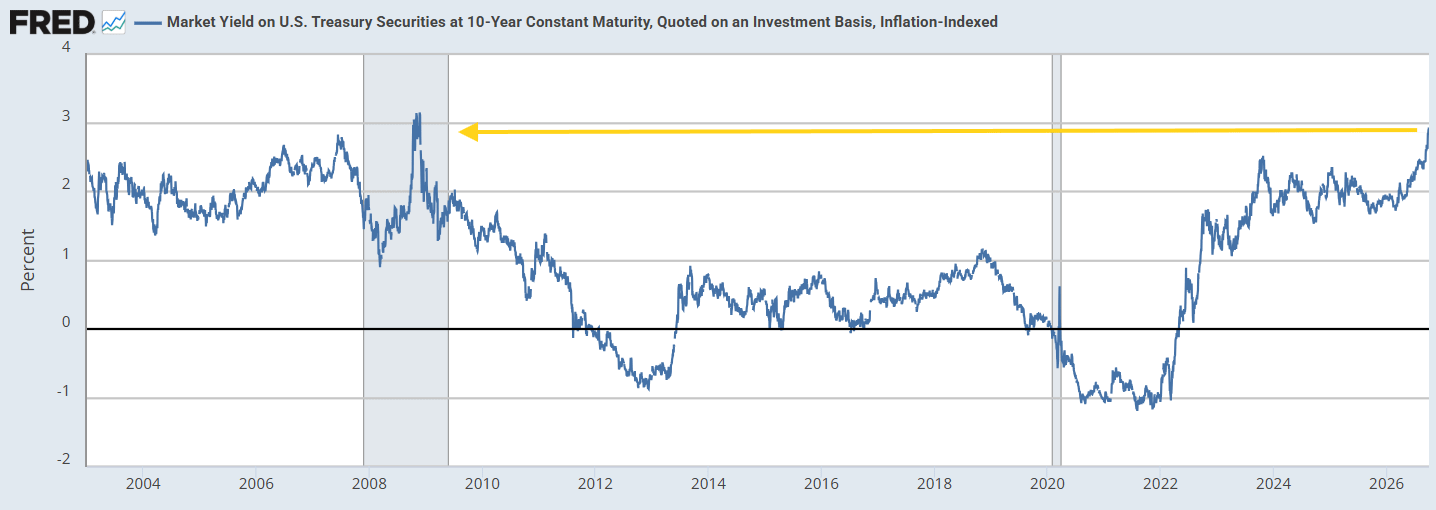
Pushing the 10-year real rate (via the hypothetical constant-maturity, 10-year Treasury Inflation-Protected Security) to another post-2008 high of 2.88%. As I mentioned two weeks ago “While this doesn’t mean much to the hyperscalers of the world, it does mean Main Street is facing the most restrictive rates in nearly two decades.”
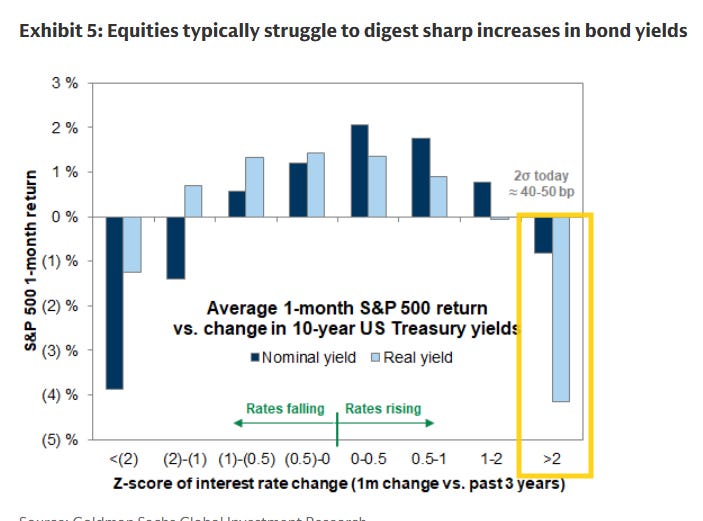
As noted last week, this is another explanation for why we’ve seen weakness in equities:
The real 10-year US Treasury yield has risen by 53 bp during the past month, crossing the two standard deviation speed limit that has historically been associated with negative equity market returns.
1-month average S&P 500 returns are ~-4% following such a move.
Equities can typically digest rising yields when the changes in interest rates are gradual, especially if those changes are driven by improving economic growth expectations. But this has not been the case in recent weeks.
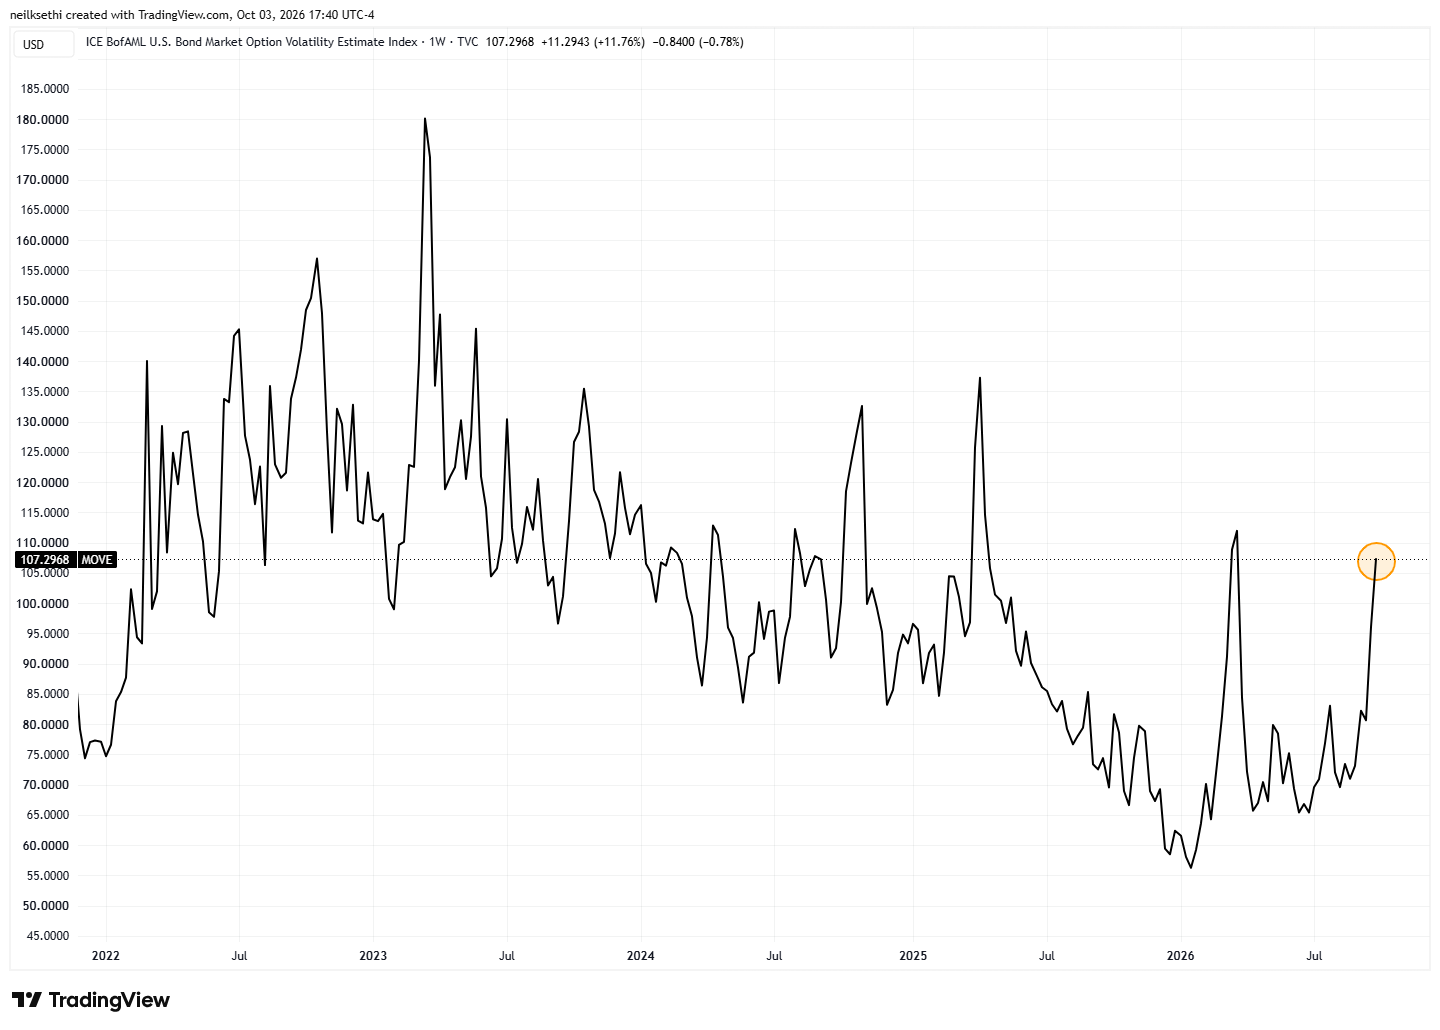
And while it remains just off the highs of the year, the MOVE index of expected 30-day Treasury volatility now the highest since March.
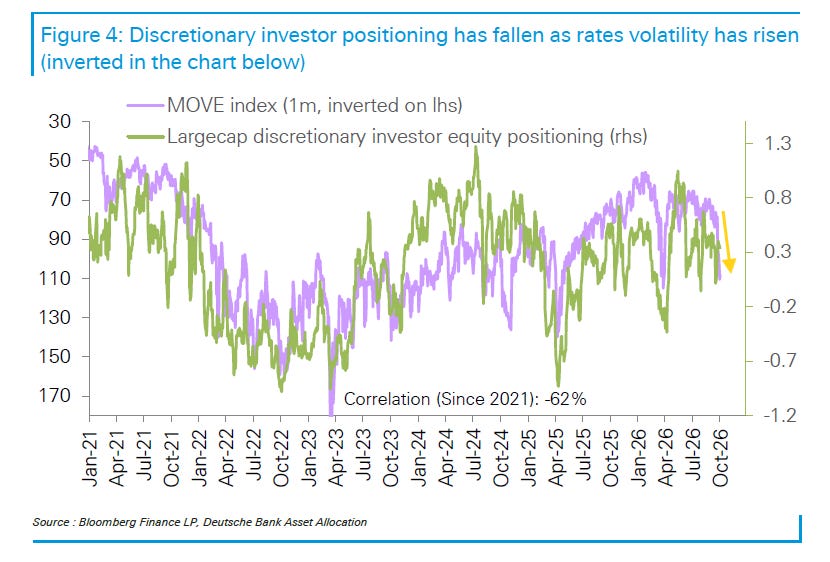
Which DB says is the “key for equities,” as opposed to the level of rates.
Overall, on yields, as I said last week, we remain above my new ranges established at the start of August for the 2-year and 10-year: “I still think that 5% on the 10-year and 5.75% on the 30-year represent areas where we will see very strong buying. On the 2-year I think a lot depends on whether the Fed hikes. If they do, there’s potentially another ~30 basis points to the upside (~4.75%). If they don’t, I think we’re going lower from here.”
I still for now think we’ll end the year back in those ranges although I’m close to raising the 10-year range.
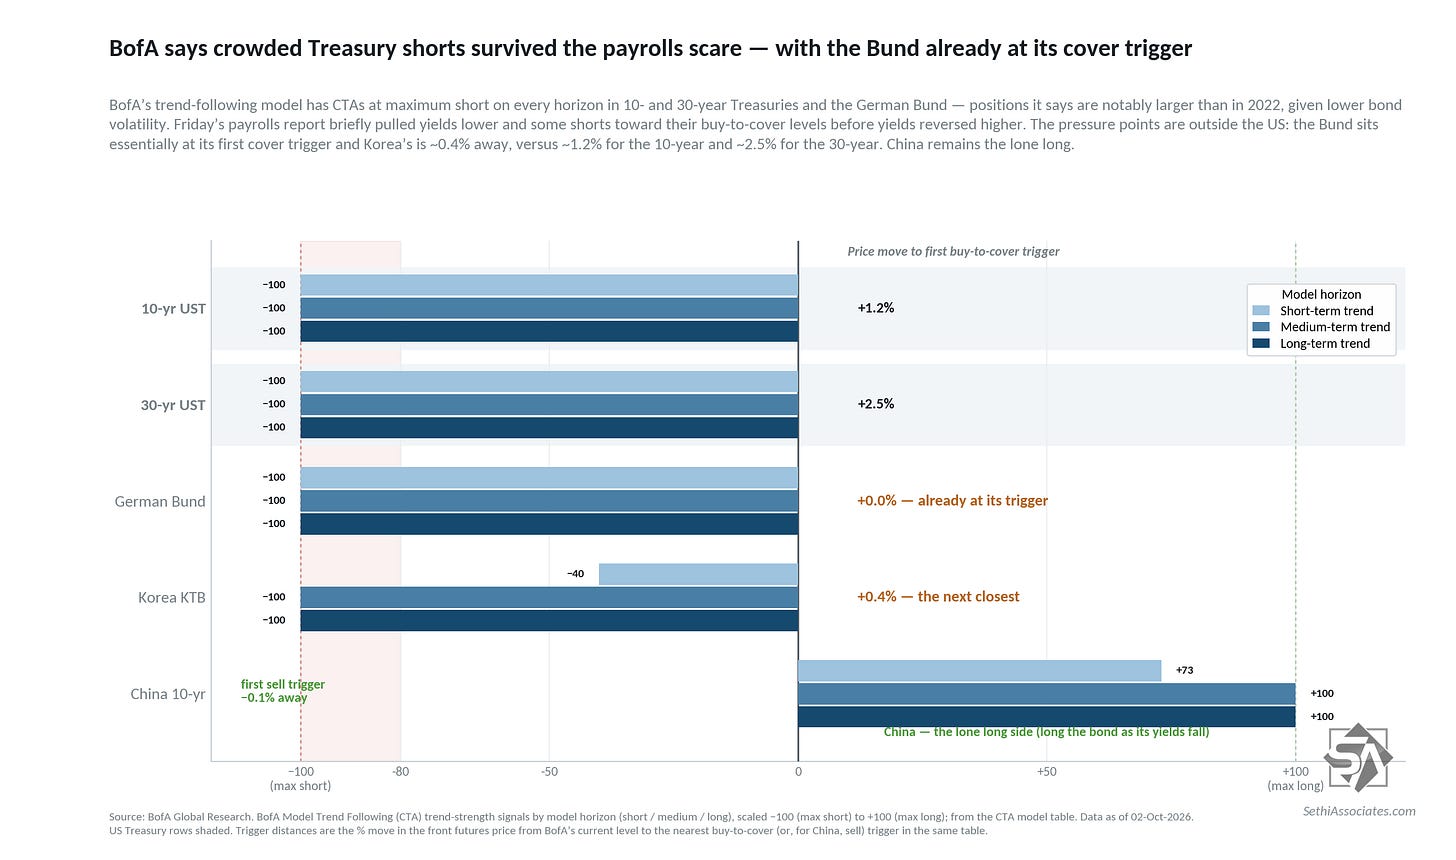
In that regard, we continue to remain extended in short positioning in bonds (bets on higher yields). Per BofA:
The biggest CTA story remains the persistent short Treasury position. Following Friday’s September employment report, yields initially declined as markets further priced out an October rate hike, bringing some CTA bond shorts close to buy to cover trigger levels.
However, yields reversed higher, leaving trend follower positioning largely intact. The move higher likely reflected growing confidence that softer payroll growth was driven more by seasonal distortions than a meaningful deterioration in labor market conditions, alongside overseas rate market pressures. CTA Treasury shorts remain near maximum levels and are notably larger than they were during 2022, due to lower bond vol today.
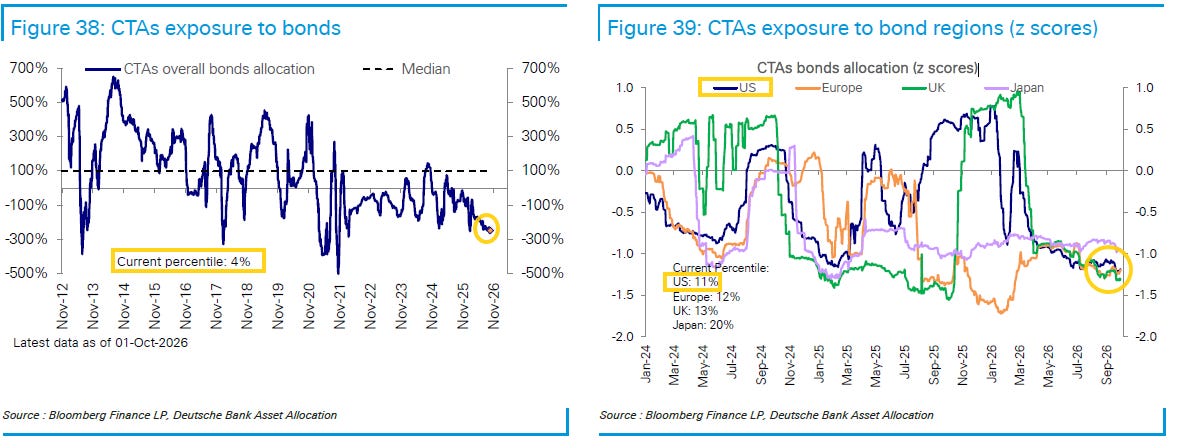
DB similarly says CTA “bond shorts remain extreme” at just the 11th percentile to 2012 for the US. Globally they’re at the 4th percentile.
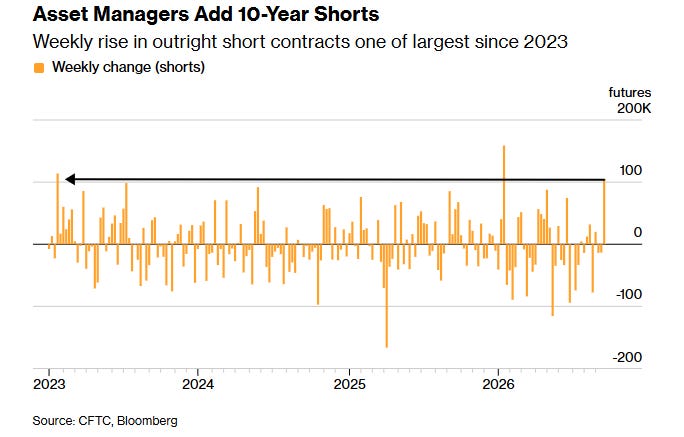
And BBG noted this week that in the week through September 22nd, asset managers added over 100,000 10-year note futures short positions, outside of January, the largest weekly increase since 2023.
That’s though even as there has been aggressive buying on the retail side. From
:
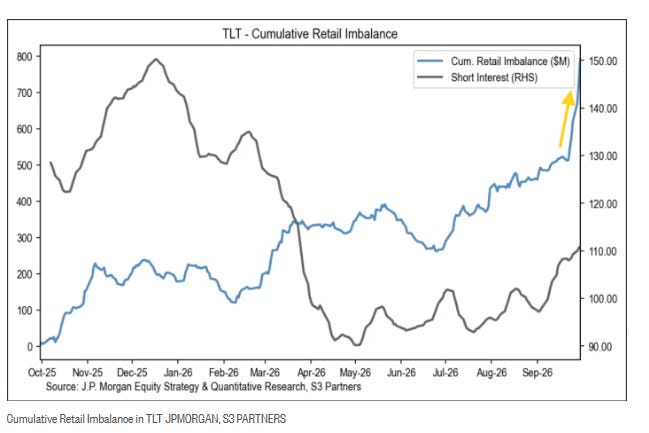
JPM says that their flows data shows retail investor trading activity came in at the 12th percentile, the least since December 2024 showing increasing investor caution.
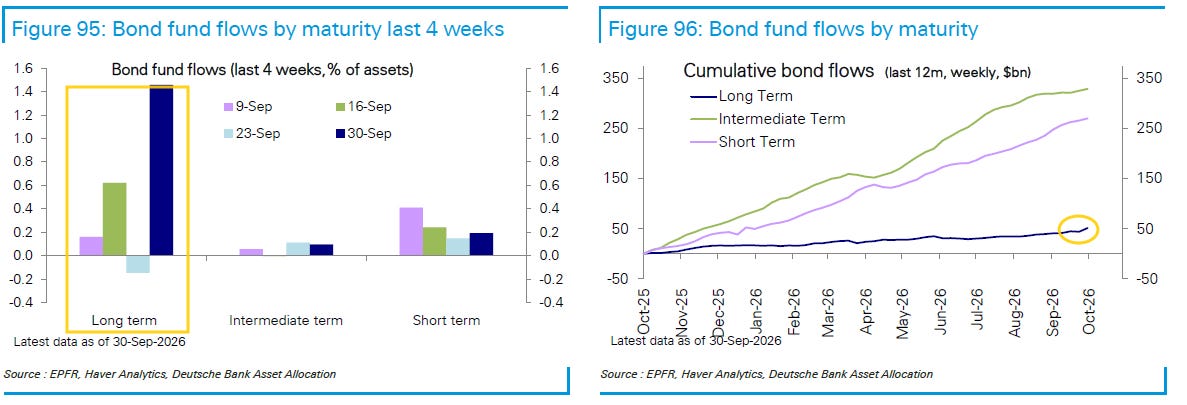
But one place investors were placing bets was in long-duration bonds with the iShares 20+year Treasury bond ETF (TLT) where retail net positioning shot higher even as short bets also continue to climb. The rotation into long-dated Treasury ETFs is more than five standard deviations away from its historical average according to the report.
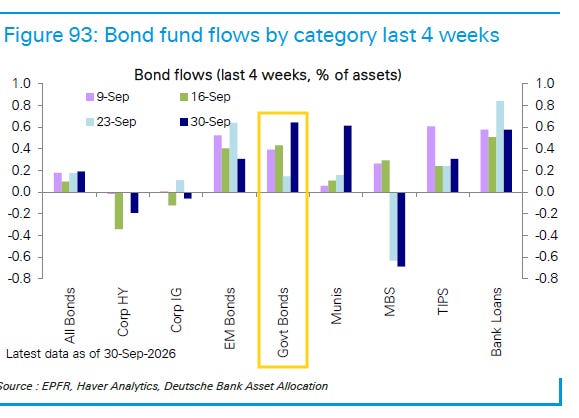
And DB says “Inflows to bond funds ($18.8bn) strengthened further from last week. Government bonds ($10.8bn) saw a sharp acceleration in inflows, their highest level in four months.”
With the buying concentrated on the long end, a departure from what we’ve seen over the past year.
And the run is fairly extended. Last week was the 5th straight weekly gain for 10-year Treasury yields (and 7th in 8 weeks).
So we remain in a precarious place for bond shorts. There will be that huge short covering rally that will see yields plummet, at least briefly. I had thought a weak NFP number would do the trick but as I mentioned Friday “the momentum behind the short bonds trade (or perhaps the lack of momentum behind the long bonds trade with Goldman characterizing bonds as “bidless” today) is more powerful than even a notable miss on what has traditionally been the most important economic report we get.”
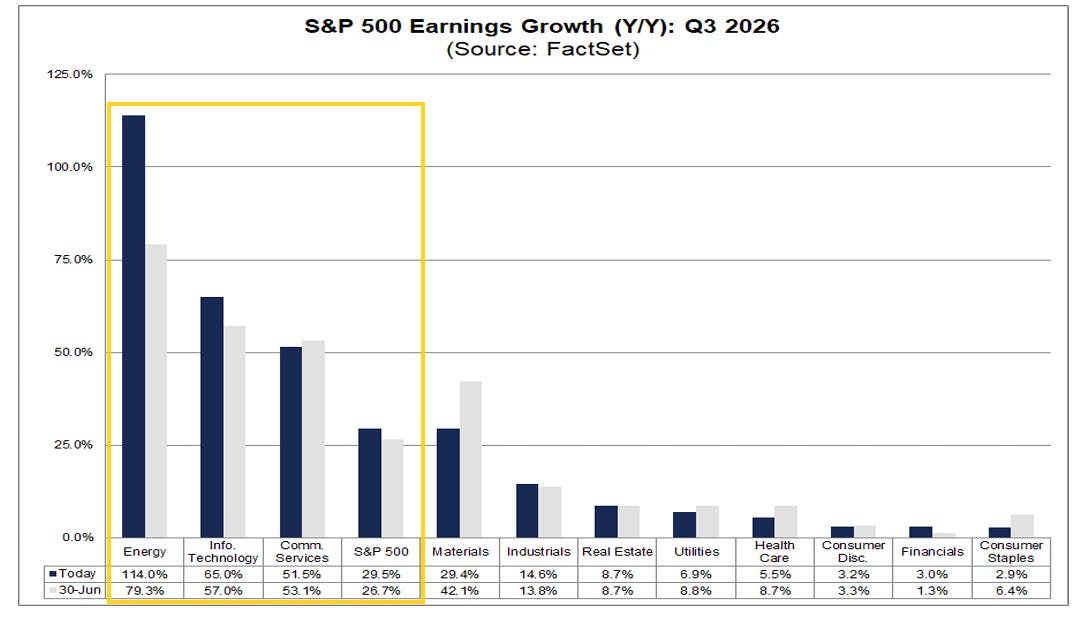
Looking at Q3, at this point analysts are still expecting a third consecutive quarter of 25%+ y/y earnings growth (in fact nearly a second quarter of +30%) with the Q3 estimate at +29.5%. As in Q2, Energy is expected to lead at +114.0% y/y growth (up from +79.3% at the start of the quarter — July 1st), followed by Tech +65.0% and Comm Services +51.5%.
Unlike Q2 no sector is expected to have negative y/y growth with Staples the least at +2.9% (down from +6.4% at the start of the quarter).
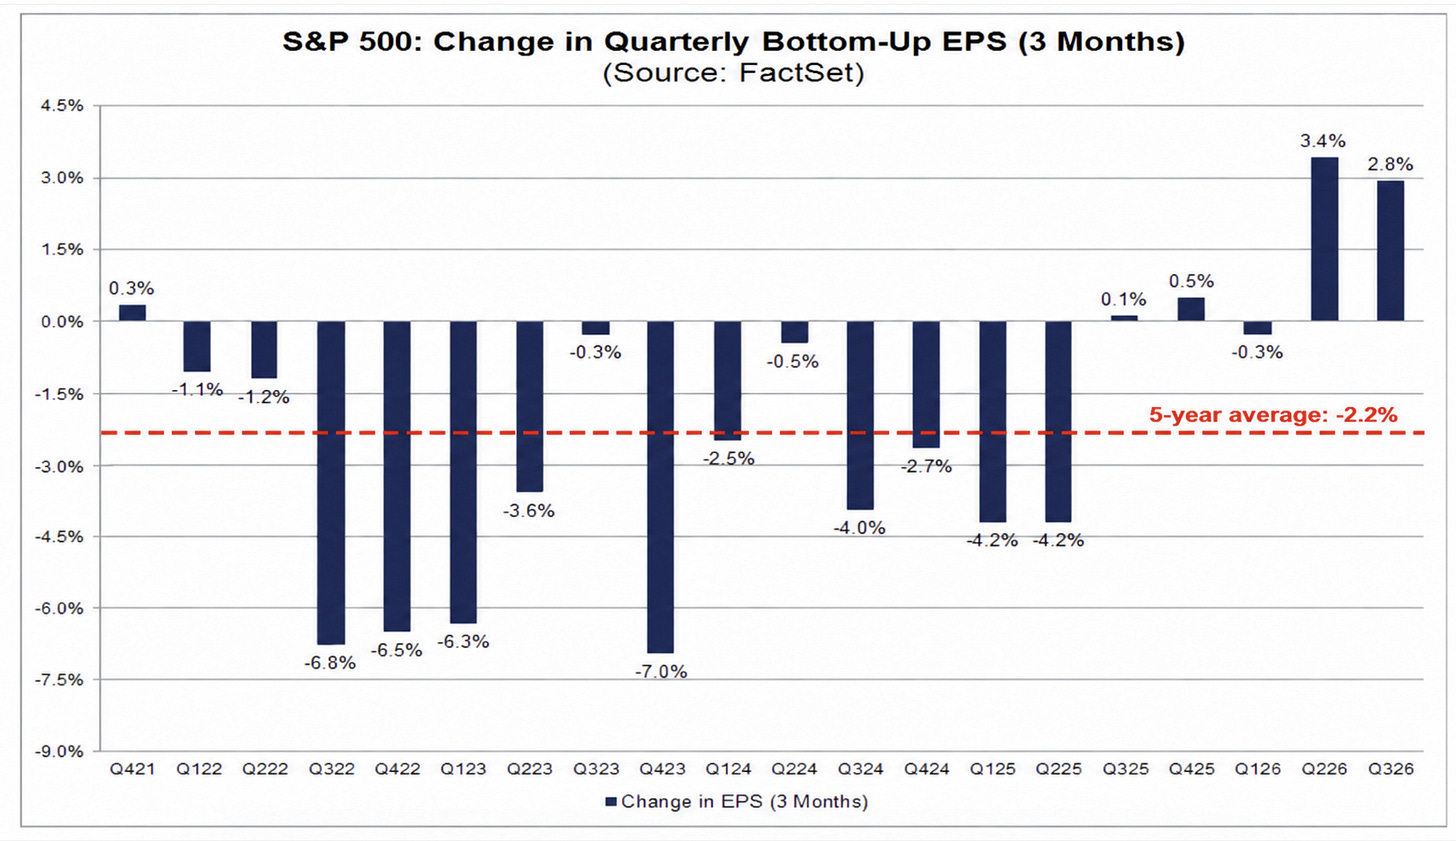
FactSet updated their stats on the rise in earnings expectations for Q3 since the start of the quarter (July 1st) which is now +2.8%. While not as large as we saw for Q2, (+3.4%), it is otherwise the most in over five years and compares to a 5-year average of -2.2% and 10-year average of -2.5%.
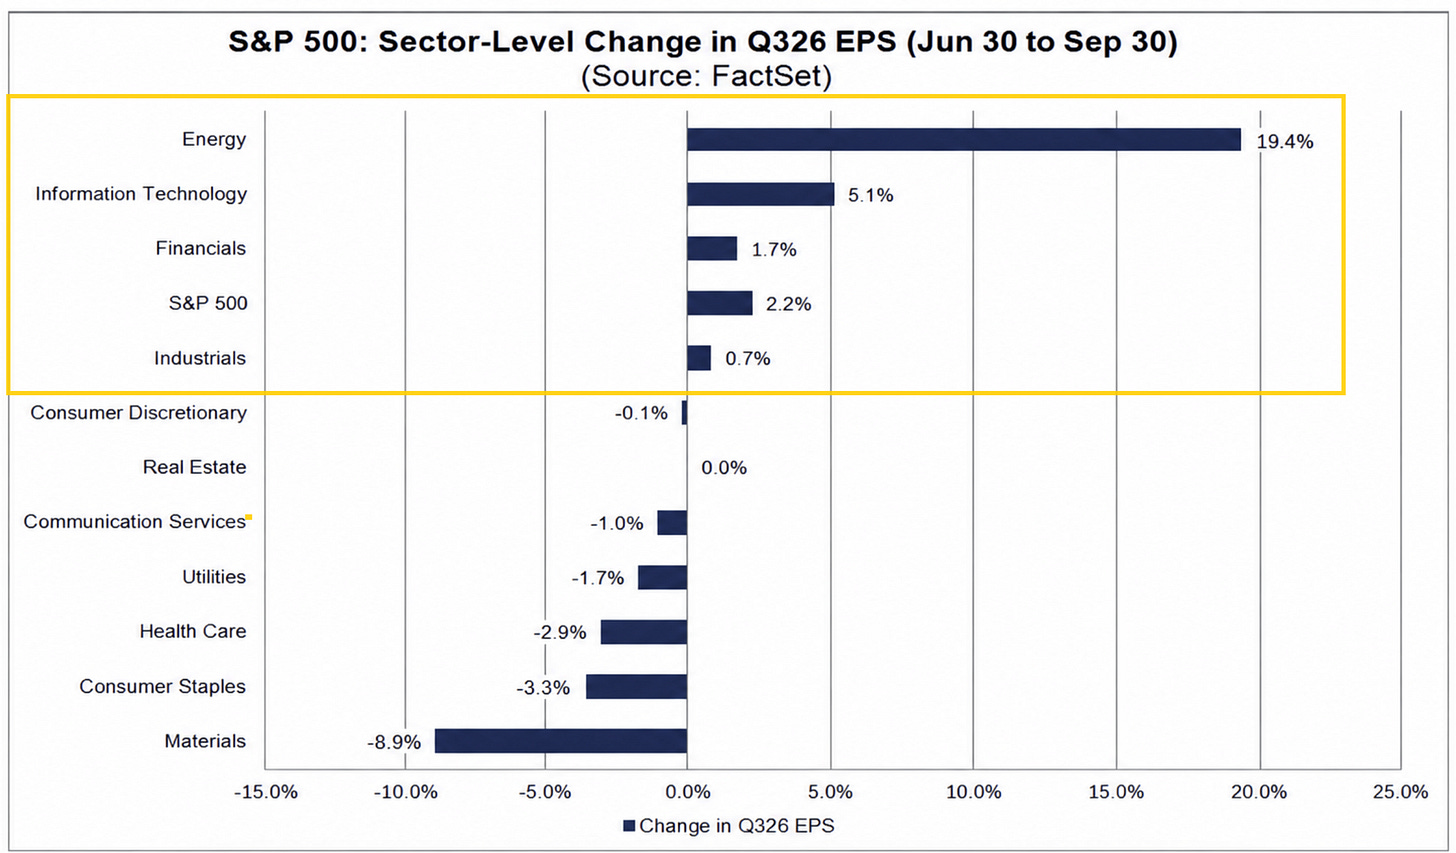
That said, all of that lift was generated by just four sectors: Energy (+19.4%), Information Technology (+5.1%), Financials (+1.7%) and Industrials (+0.7%).
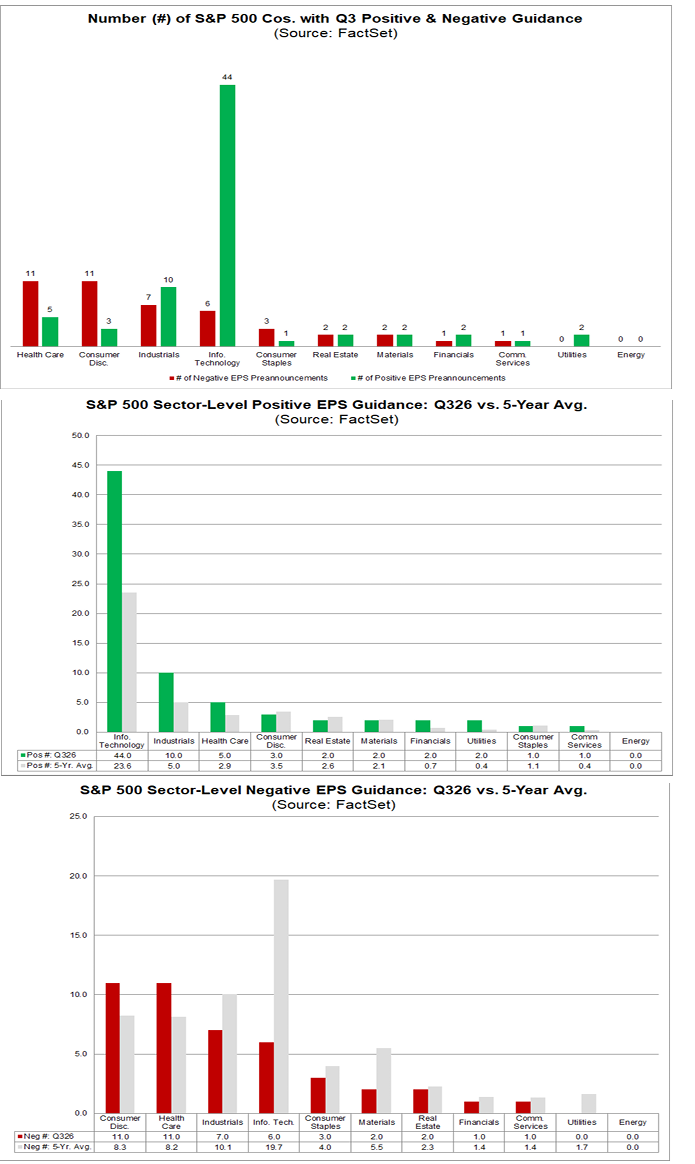
FactSet notes that the elevated Q3 earnings expectations for S&P 500 companies flow out of the largest number of companies (72) issuing positive earnings guidance on record (to 2006). The previous record was 64 in Q2 2021. In terms of percentage, positive guidance is the best since Q2 2021 at 62% (72 out of 116).
Over half (44) of the positive guidance comes from Tech, well above the 5-year average of 23.6 and well above the 10-year average of 20.4 for the sector and tying the prior high hit last quarter since 2006. The Information Technology sector is expected to report the second-highest earnings growth rate of all eleven sectors for Q3 2026 at 65.0%.
Along with that, the number of S&P 500 companies issuing negative earnings guidance (44) is the lowest since Q2 2021 (39).
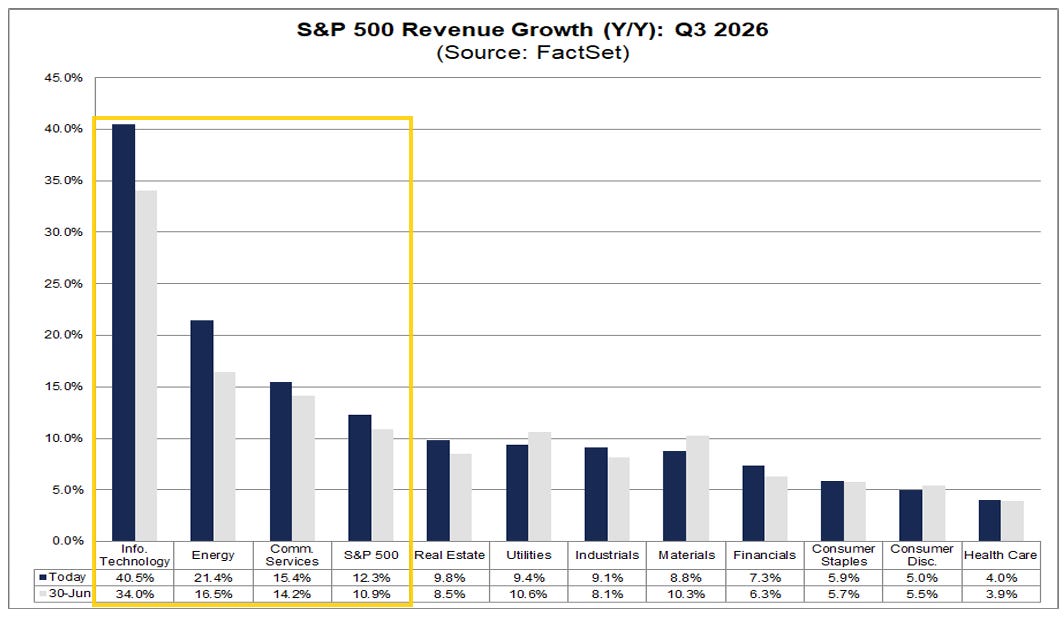
Q3 revenue growth is expected at a likewise stellar +12.3%, down from +15.5% in Q2 which though was the best since Q4 2021 (16.1%). It would mark the third consecutive quarter of double-digit revenue growth for the index.
Expectations are led by Tech (+40.5%), Energy (+21.4%), and Communications (+15.4%).
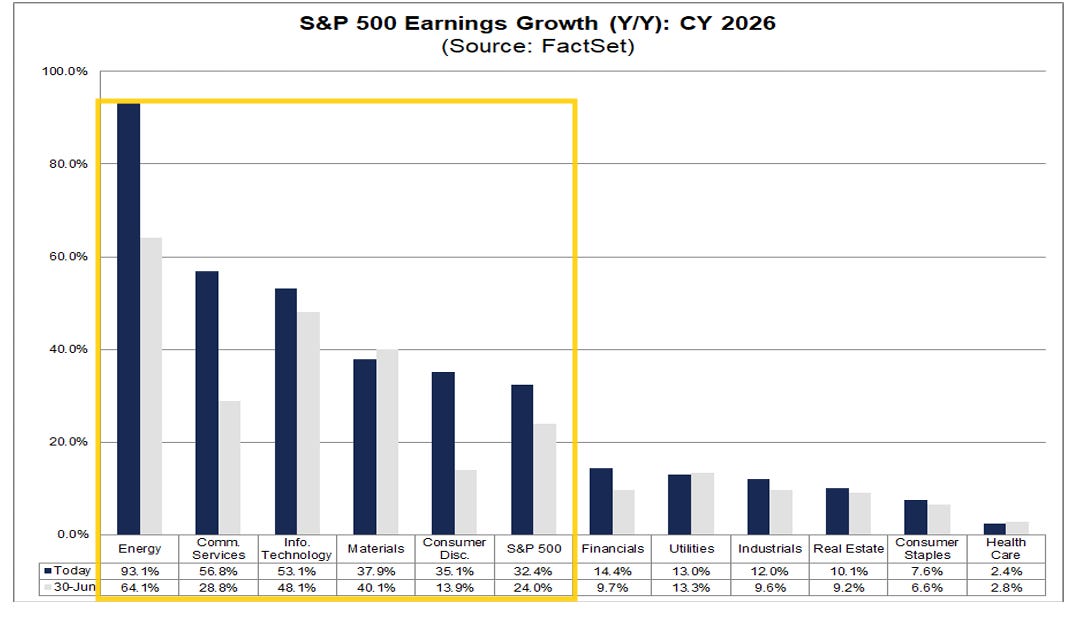
2026 SPX earnings growth expectations also continue to march higher now at +32.4%, up from +24.0% on June 30th, +17.1% on March 31st, and over double the +14.8% at the start of the year.
As in 2025, Tech is a leader with y/y earnings growth of +53.1% (up from +28.6% at the start of the year) but Energy will exceed that (on a percentage basis) at +93.1% (up from +6.4% at the start of the year) along with Communications +58.8%. Those sectors along with Materials (+37.9%) and Consumer Discretionary (+35.1%) represent the five sectors expected to come in above the SPX average.
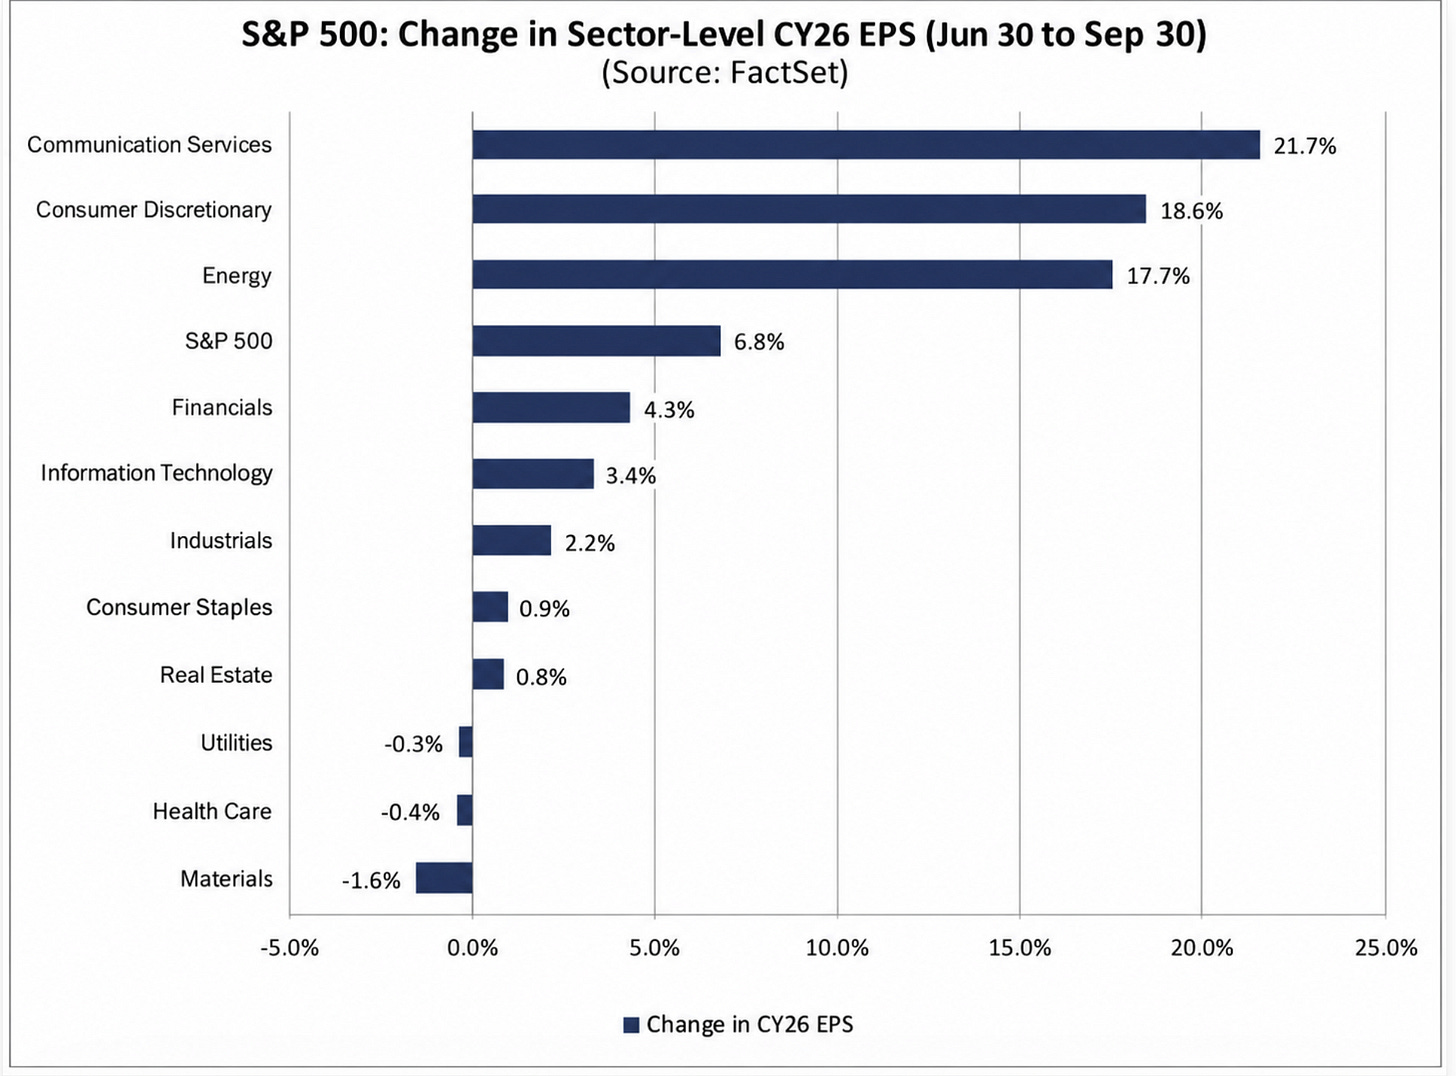
As with Q3 earnings expectations since the start of the quarter, 2026 earnings expectations have been unusual at +6.8%, in this case led by the two sectors boosted by “other income” gains from investments in AI companies — Communications (up +21.7%) and Consumer Discretionary (+18.6%) — along with Energy (+17.7%).
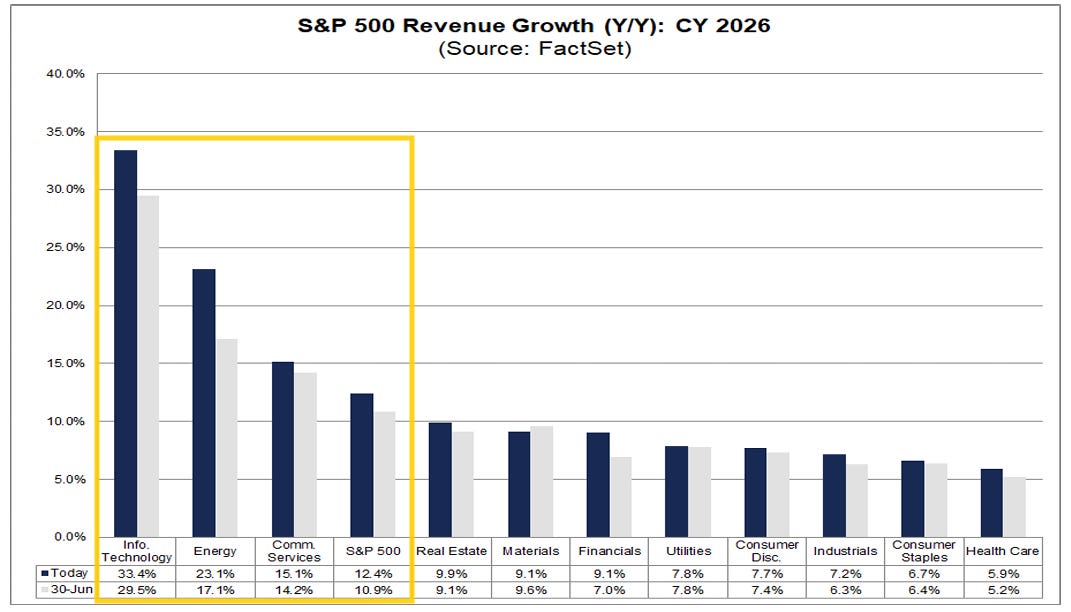
2026 revenues are now expected at +12.4% growth up from +7.3% at the start of the year and +10.9% June 30th, led by Tech (+33.4%), Energy (+23.1%) and Communications (+15.1%).
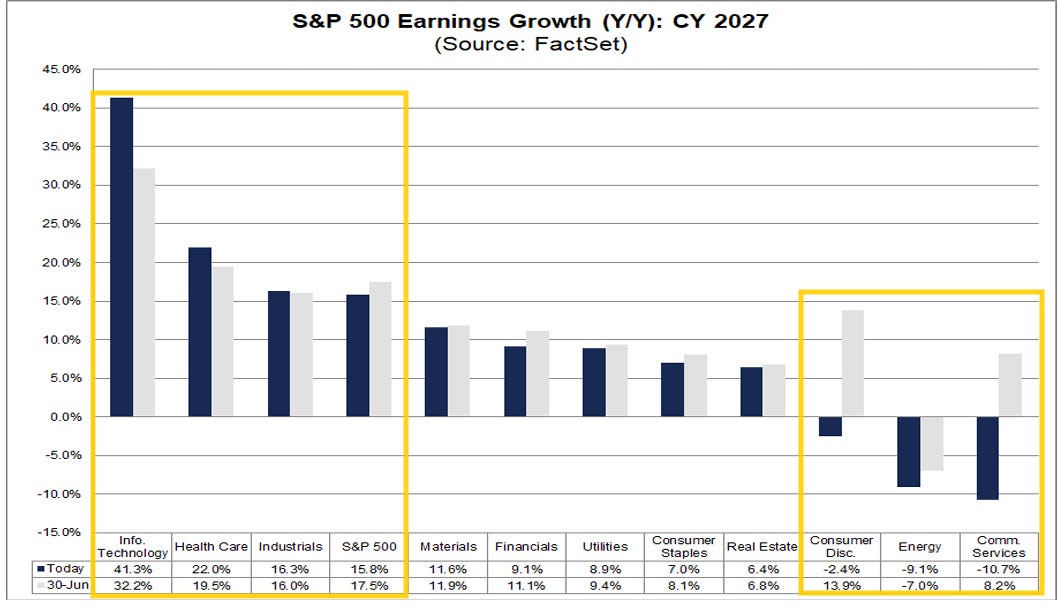
And 2027 earnings are expected to be up another +15.8% on top of the elevated 2026 results, which is down though from +17.5% as of June 30th as analysts are not carrying over all (but still most of) the boosts in 2026 earnings to next year. Still it’s a double digit advance on top of what is expected to be a 30%+ gain in 2026. That would also represent a fourth straight year of double-digit earnings growth for the S&P 500, something we’ve rarely seen.
2027 is expected to be led again by Tech (+41.3%, up from 24.6% at the start of the second quarter on April 1st, despite the huge increase in 2026 estimates since then) followed by Health Care (+22.0%) which is expected to see a big turnaround after lagging in 2026. Industrials (+16.3%) is also above the SPX average.
With hyperscaler investment gains (in Anthropic, OpenAI, etc.) expected to slow, the sectors that have seen the biggest boosts from that are now expected to see negative y/y growth (Comm Services (-10.7% from +8.2% at the start of the third quarter) and Consumer Discretionary (-2.4% from +13.9%)) along with Energy (-9.1%).
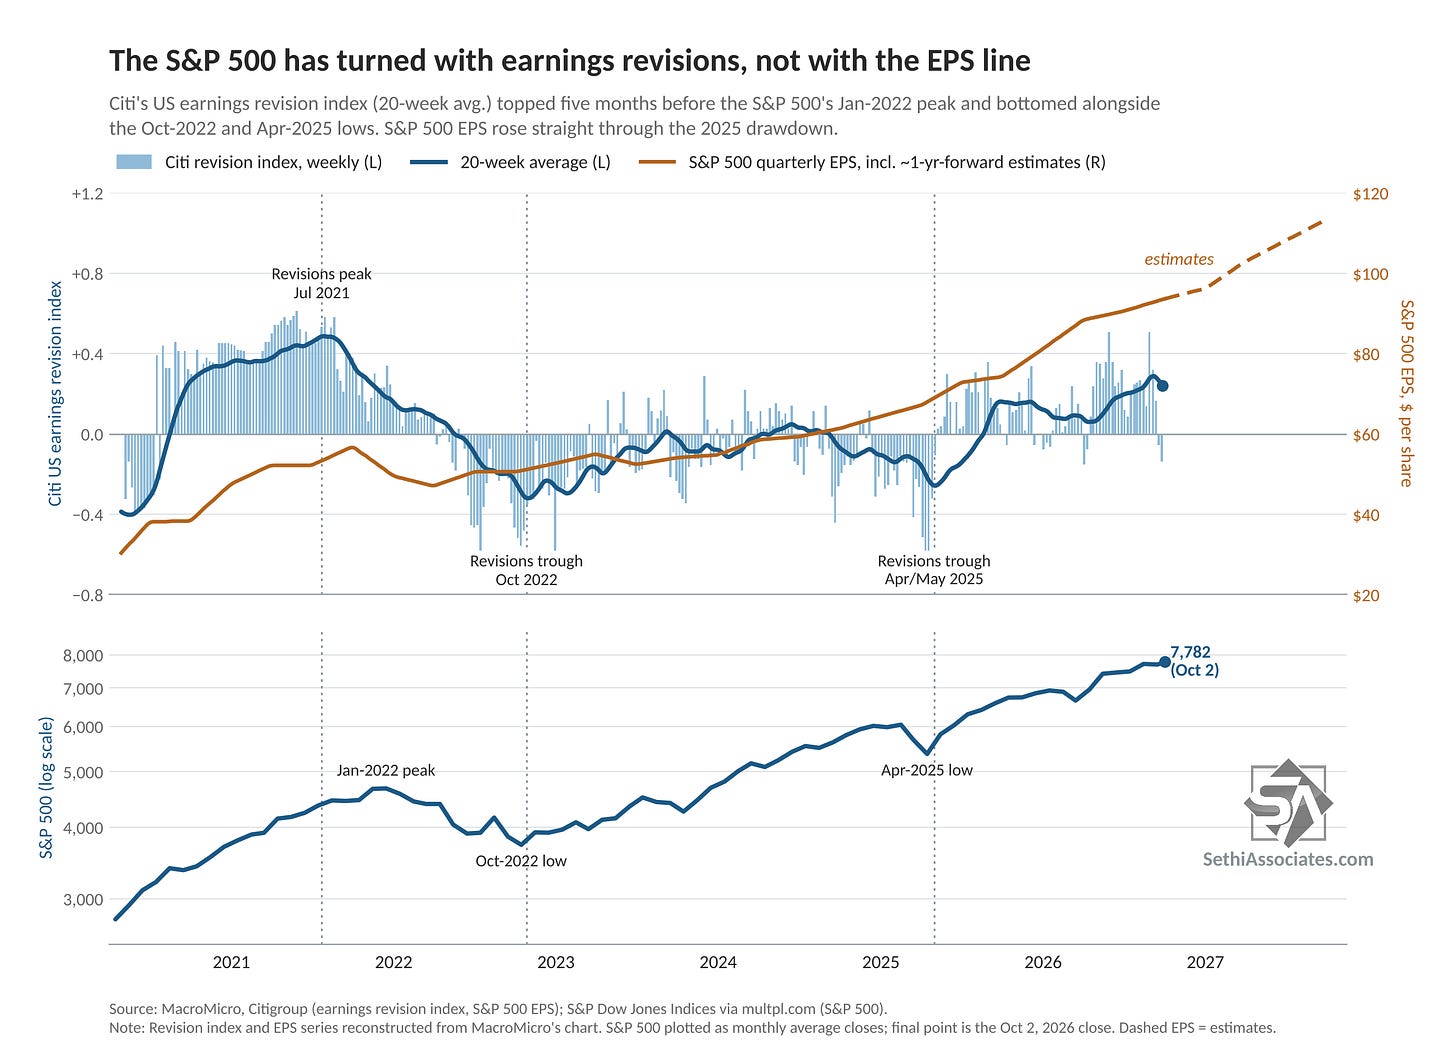
And I noted last week we saw our first week of negative earnings revisions according to Citigroupsince the week of April 10th breaking a 21-week streak, and that deepened in the week of September 25th. I said last week “I’m not too concerned about a few weeks of that,” and while there is a very loose correlation between earnings revisions and actual earnings since the pandemic, there is a stronger tie to the SPX.
So it pays to keep an eye on the 20-week moving average (black line) which for now remains near the best since October 2021, but has seen some softening.
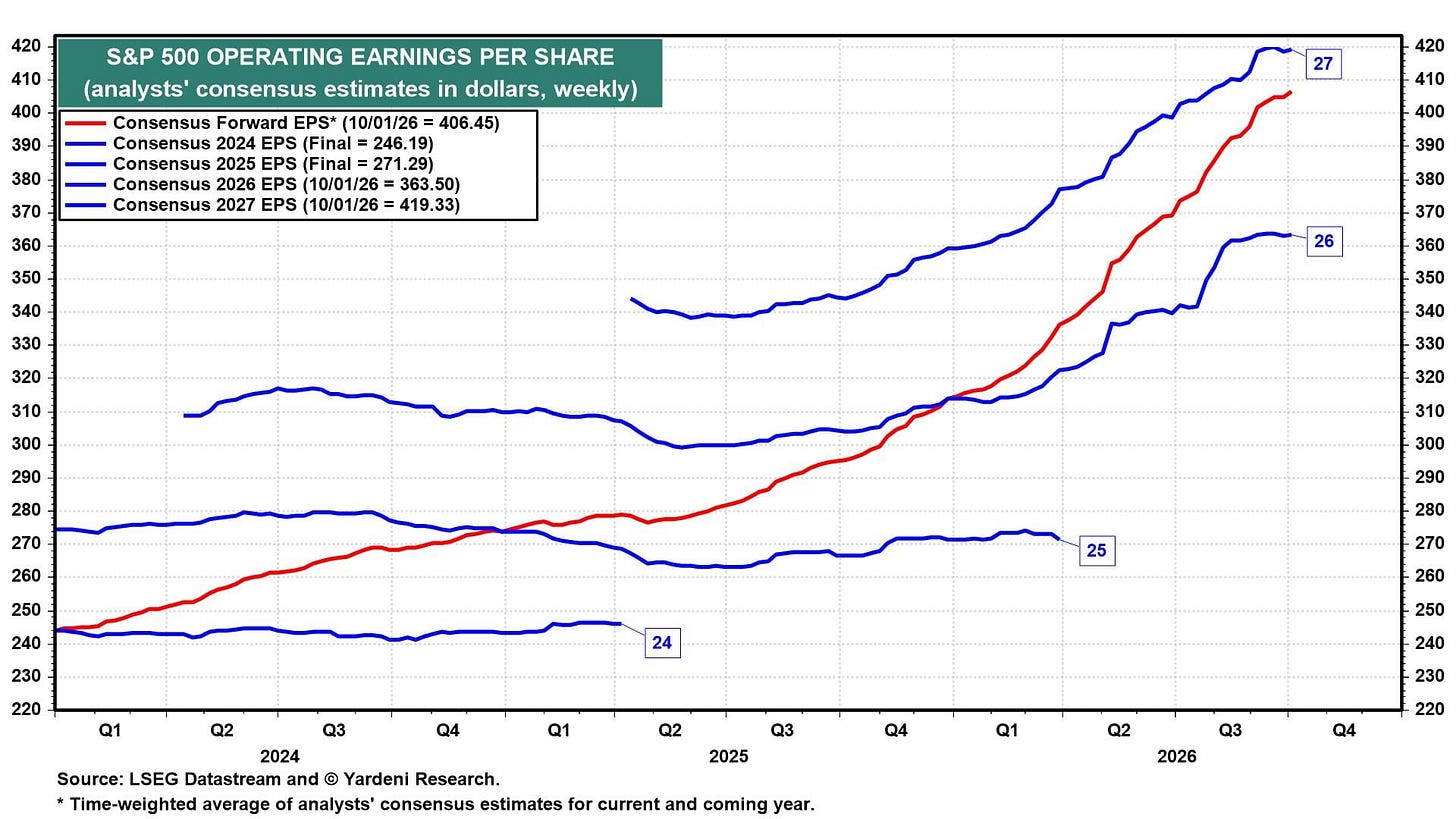
The fabulous earnings momentum (FEMO) story remains intact. S&P 500 forward earnings rose to a record $406.45 per share last week. The 2027 consensus estimate has flattened over the past few weeks around $419 (chart). We still expect both to climb to $425 by year-end on better-than-expected Q3 and Q4 earnings. JPMorgan kicks off the Q3 earnings reporting season on October 13.
And here is part of Goldman’s Q3 earnings preview:
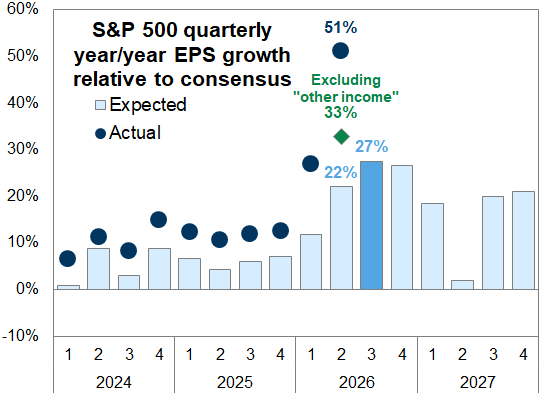
The consensus estimate for Q3 growth is the highest heading into any reporting season since 2021. However, consensus estimates imply a deceleration in Q3 from the 33% growth rate realized in Q2, even excluding the “other income” generated from appreciating equity investment stakes last quarter. Neither recent macroeconomic data nor signals relating to the AI investment boom point to a slowdown in Q3, setting the stage for another quarter of above-consensus results.
Exhibit 3: Bottom-up consensus estimates show S&P 500 EPS growth of 27% year/year in Q3 2026
Source: FactSet, Goldman Sachs Global Investment Research
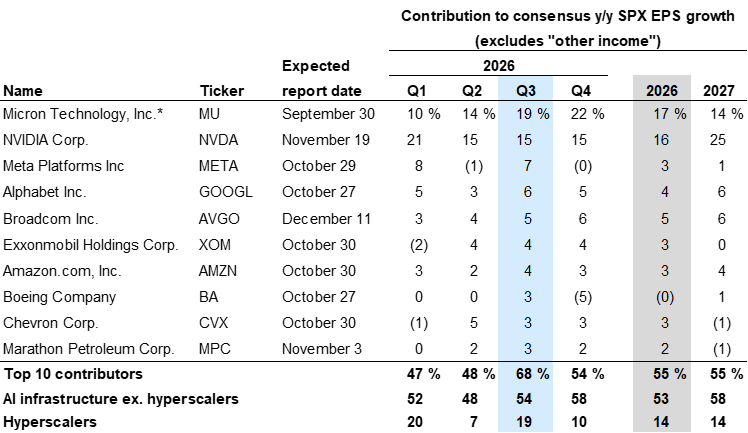
At the stock level, AI infrastructure stocks are expected to drive more than half of S&P 500 EPS growth in Q3. The top 10 contributing stocks are expected to account for over two-thirds of aggregate S&P 500 earnings growth this quarter, with Micron (MU) and Nvidia (NVDA) together accounting for more than 1/3 of index growth. Micron’s results this week were a strong start to the quarter, with the company reporting year/year earnings growth of 1,003%, beating consensus EPS estimates and providing strong forward guidance.
Exhibit 5: Top 10 contributors to S&P 500 Q3 earnings growth
* indicates company has reported Q3 results
Source: FactSet, Goldman Sachs Global Investment Research
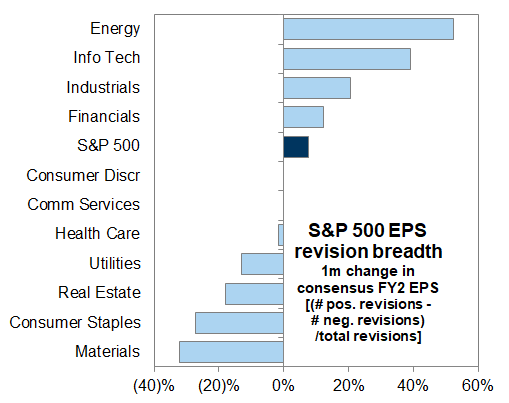
Exhibit 7: Earnings revision breadth has recently been strongest in the Energy and Info Tech sectors
Source: FactSet, Goldman Sachs Global Investment Research
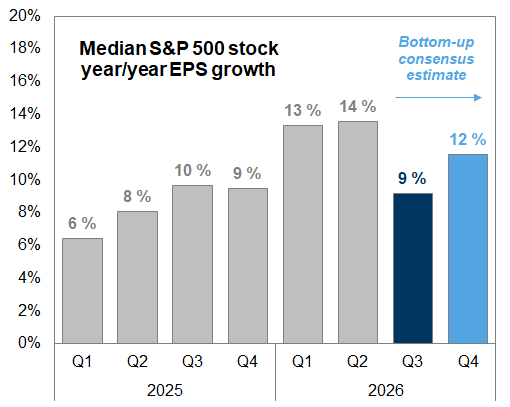
For the median S&P 500 stock, consensus expects EPS grew by 9% year/year in Q3 compared with 14% in Q2. Analyst estimates indicate a sequential deceleration in year/year EPS growth in every sector except for Info Tech and Comm Services.
Exhibit 8: Consensus expects the median S&P 500 stock to report 9% EPS growth in Q3 2026
Source: FactSet, Goldman Sachs Global Investment Research
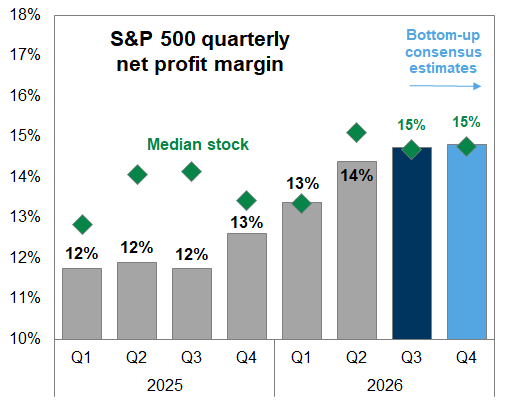
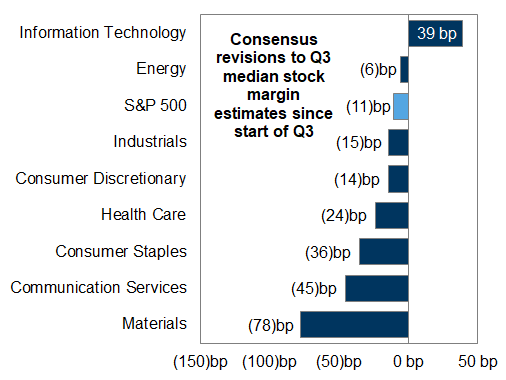
We expect most S&P 500 companies will report continued profit margin strength in Q3, but input cost pressures likely limited substantial sequential margin expansion. Consensus estimates show the median S&P 500 stock generating a net profit margin of 14.7% in Q3, compared with 15.1% during Q2. Despite contained wage growth, companies continue to face input cost pressures. Analysts have cut estimates for the median S&P 500 stock’s Q3 profit margin by 11 bp since the start of the quarter, with estimates trimmed in every sector except Info Tech.
Exhibit 10: S&P 500 quarterly net profit margin
excludes Financials and Utilities; aggregate excludes “other income”
Source: FactSet, Goldman Sachs Global Investment Research
Exhibit 11: Consensus Q3 margin estimates have recently been revised lower in every sector but Info Tech
Source: FactSet, Goldman Sachs Global Investment Research
Across the market, investors will continue to scrutinize both reported results and management commentary this quarter to gauge the progress of AI adoption and productivity. Roughly 50% of S&P 500 firms discussed AI in the context of productivity or efficiency on last quarter’s earnings calls, but only 2% of S&P 500 companies quantified the earnings impact of those gains. We expect these shares to gradually increase in coming quarters.
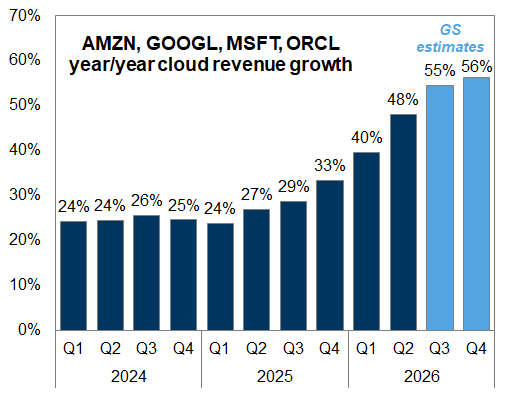
Exhibit 14: Hyperscaler cloud revenue growth has recently accelerated
Source: Goldman Sachs Global Investment Research
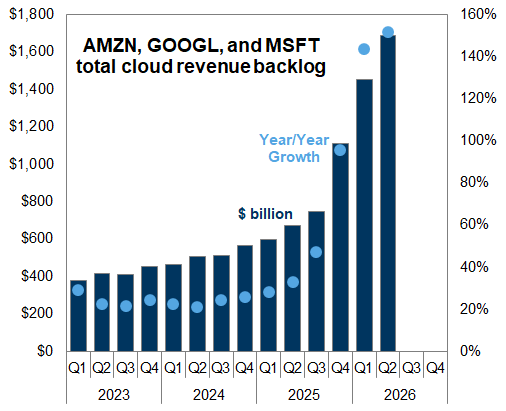
Exhibit 15: The hyperscalers have reported large and growing cloud revenue backlogs
Source: Goldman Sachs Global Investment Research
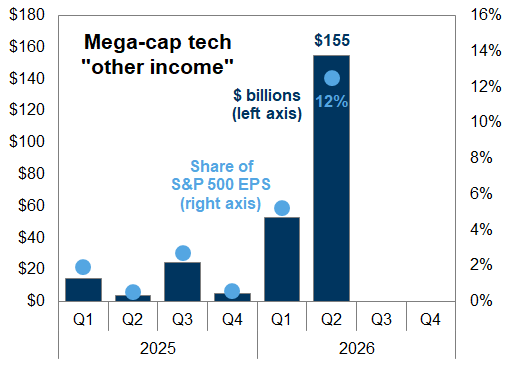
While gains from private investment stakes have distorted S&P 500 earnings results during the last two quarters, we expect this distortion to fade in Q3 results. The mega-cap tech companies generated roughly $150 billion of accounting profit last quarter from appreciating equity investment stakes, translating into 12% of S&P 500 EPS. We do not expect a meaningful impact from similar “other-income” this quarter because it does not appear that the largest equity investments appreciated in Q3 as much as they did earlier in 2026.
Exhibit 16: “Other income” from appreciating investment stakes has boosted S&P 500 earnings in recent quarters
Source: Goldman Sachs Global Investment Research
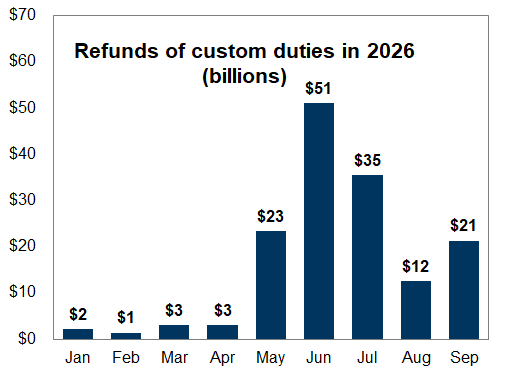
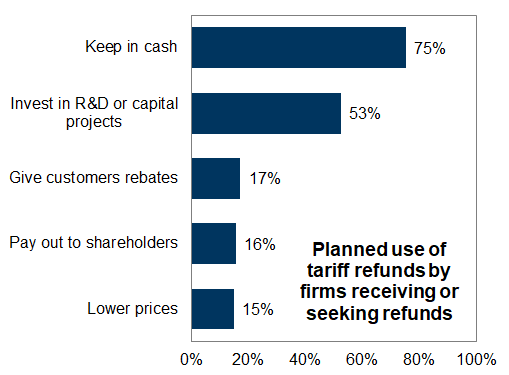
However, tariff refunds should provide another modest boost to earnings this quarter. According to the US Treasury, roughly $69 billion of tariff refunds have been issued in Q3, following $77 billion in Q2. This equates to roughly 6% of total US corporate pre-tax profits in each quarter. A recent Atlanta Fed survey indicated that most firms expect to keep the tariff refunds in cash and use the funds to invest in R&D or capital projects.
Exhibit 17: Companies have received large tariff refunds in recent months
Source: US Treasury, Goldman Sachs Global Investment Research
Exhibit 18: Planned use of tariff refunds
Survey of Business Uncertainty as of August 2026; N = 220
Source: Federal Reserve Bank of Atlanta, Goldman Sachs Global Investment Research
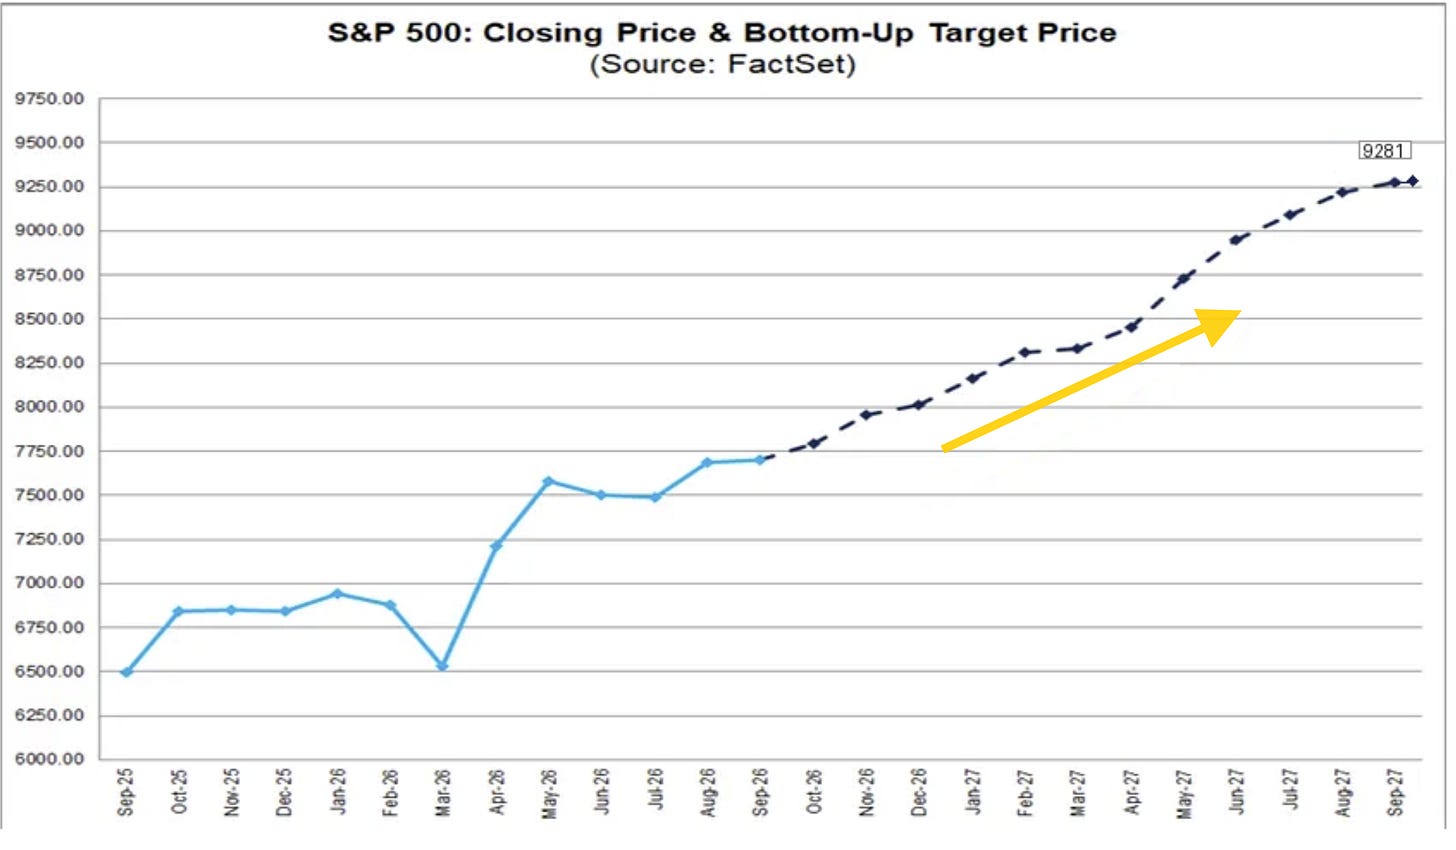
Analysts meanwhile collectively continue to think that the S&P 500 has a lot of upsidewith FactSet’s compilation of analyst bottom-up SPX 12-month price targets up to 9,281 (+6pts w/w, ~985 pts since March 31st, ~+2,160 pts since Thanksgiving, and ~+3,110 pts since July 1, 2025) although that’s slowed as is typical in between earnings seasons. That would be +21.3% from Thursday’s close.
Consumer Discretionary (+27.6%) has now overtaken Utilities (+26.8% down from +28.0% the prior week) as the sector expected to see the largest 12-month price increase followed by Industrials (+26.5%). On the other side Health Care (+13.1%) and Energy (+13.3%) are the sectors with the least upside but even they are expected to see double digit gains over the next year.
As a reminder we started the year with a 12-month bottom-up price target of 8,000 and according to FactSet the last 20 yrs (through 2024) analysts have been on avg +5.9% too high from where they start the year, but they have underestimated it five of the past six years (including 2025 when they saw 6,755 at the start of the year and we ended at 6,845). Currently we’re about 3.5% away.
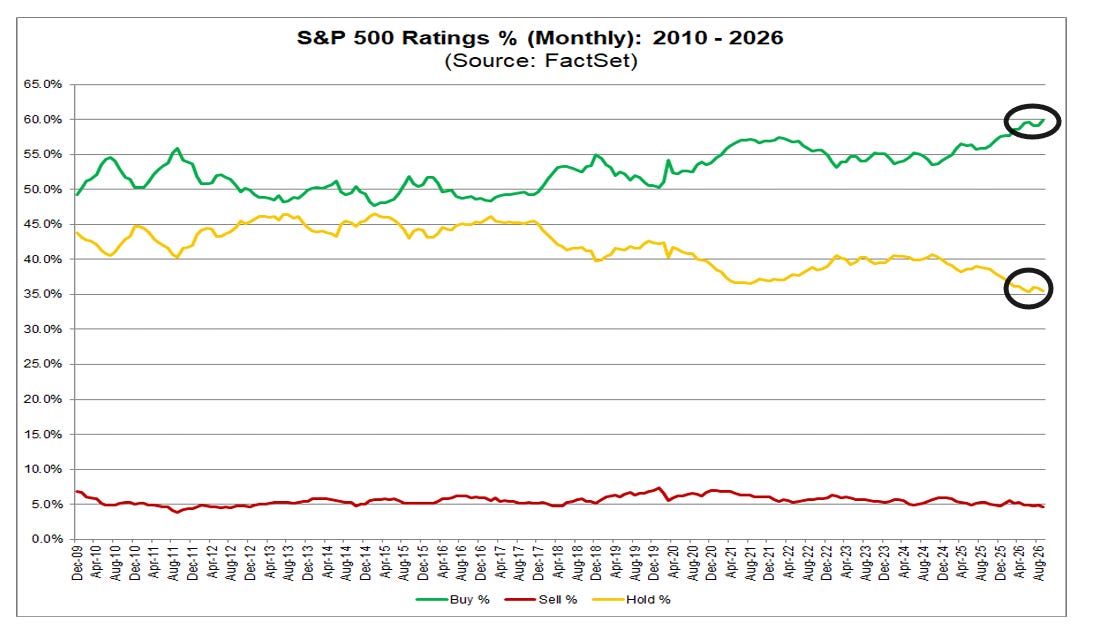
In terms of analyst ratings, buy and hold ratings continue to dominate with buy ratings at 59.9%. That makesit a new month-end record to 2010. The 5-year month-end average is 55.8%.
Hold ratings are at 35.4%, tying the record low (to 2010) and vs the 5-year month-end average of 38.7%, with sell ratings at 4.7%, remaining in their narrow range since 2009 but below the 5-year month end average of 5.6%.
Valuations Remain Relatively Attractive But Still Pressured By Rising Rates
Here’s Ed Yardeni again:
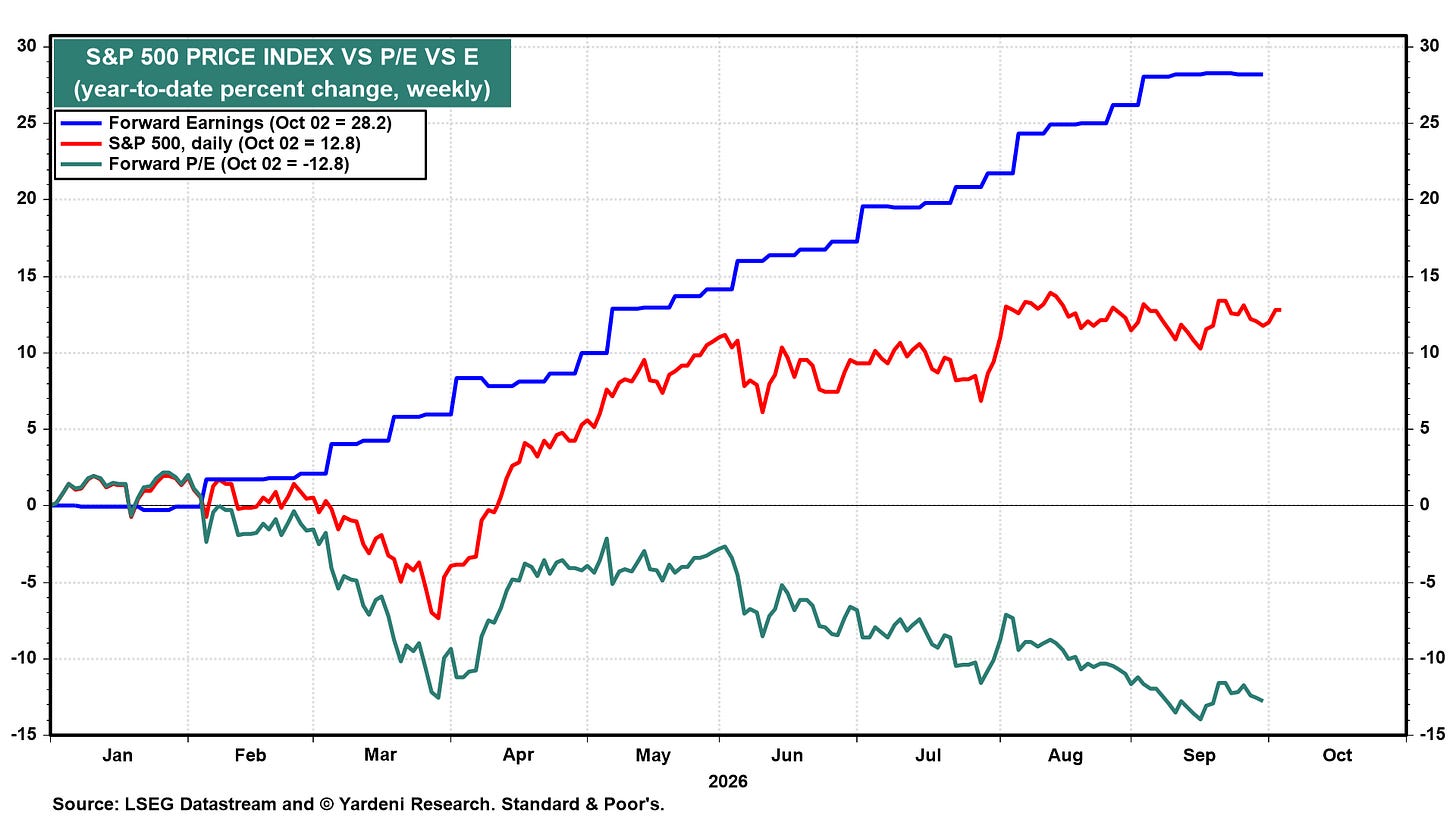
Since mid-August, the stock market’s slippage has come entirely from a lower multiple. S&P 500 forward earnings is up 28.2% ytd, compared with 12.8% for the price index, while the forward P/E is down 12.8% (chart).
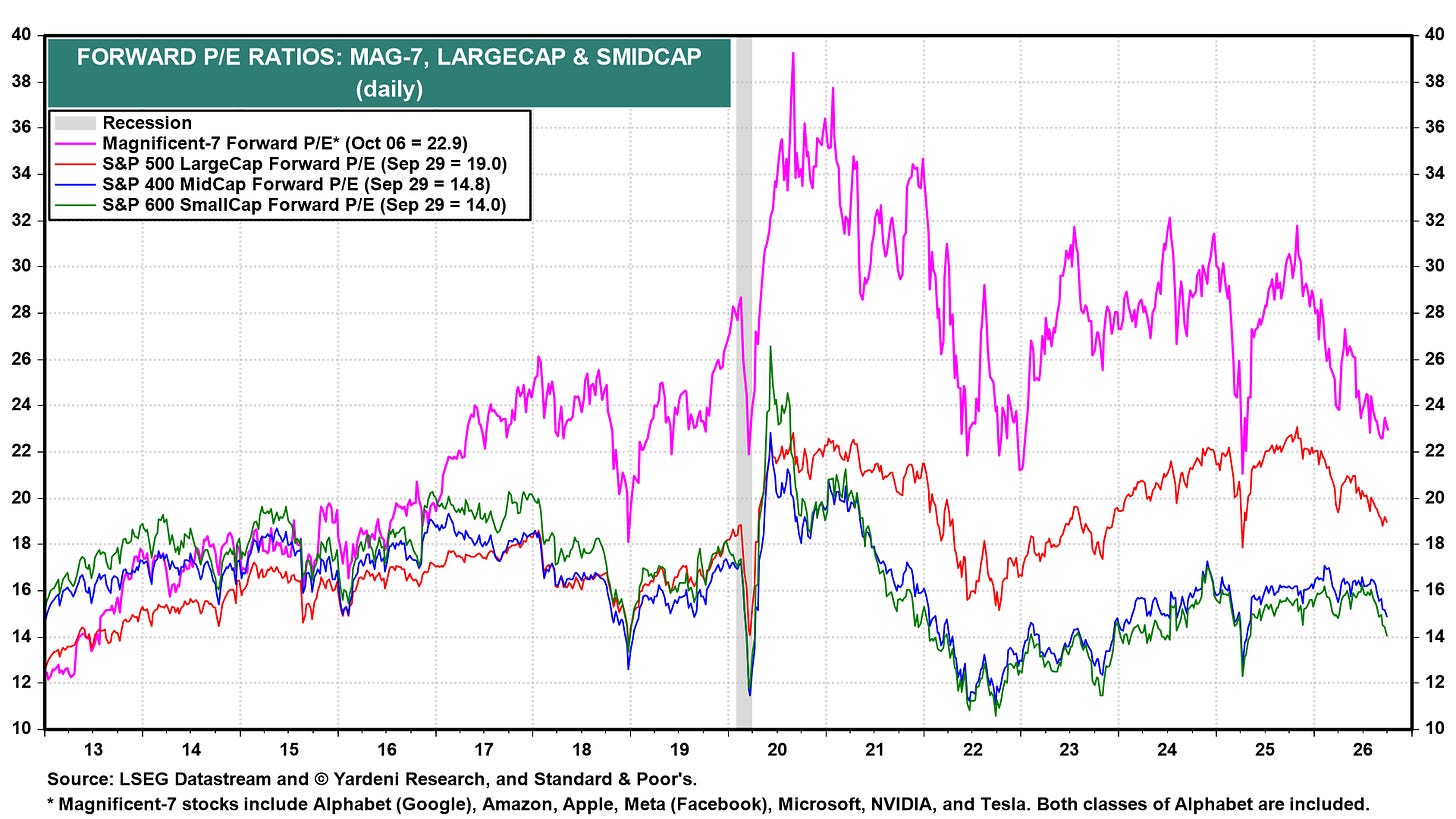
The S&P 500’s forward P/E is 19.0, the Mag-7’s is 22.9, and the SMidCaps’ (i.e., SmallCaps and MidCaps collectively) is below 15 (chart). Our 7,900 S&P 500 target assumes an 18.6 multiple. With the 10-year yield above 5.00%, we see more downside than upside for valuations through year-end.
And a reminder from Goldman last week. Presumably if we do see yields softening we’ll also see a rerating in stocks:
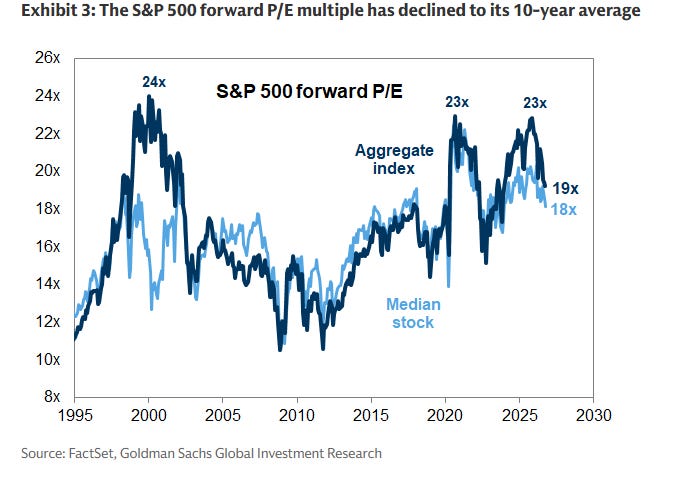
As investor positioning has declined, the S&P 500 P/E multiple has contracted to 19x, and now matches its 10-year average.Year to date, the S&P 500 has risen by 13% but the consensus forward 12-month EPS estimate has risen by 29%. The result is a 13% decline in the forward P/E multiple, which has declined from 23x a year ago to 19x today.
While they note that the derating is in part due to higher rates, they note another part is due to investors seeing current earnings trends as unsustainable, a topic I’ve discussed in most previous weeks:
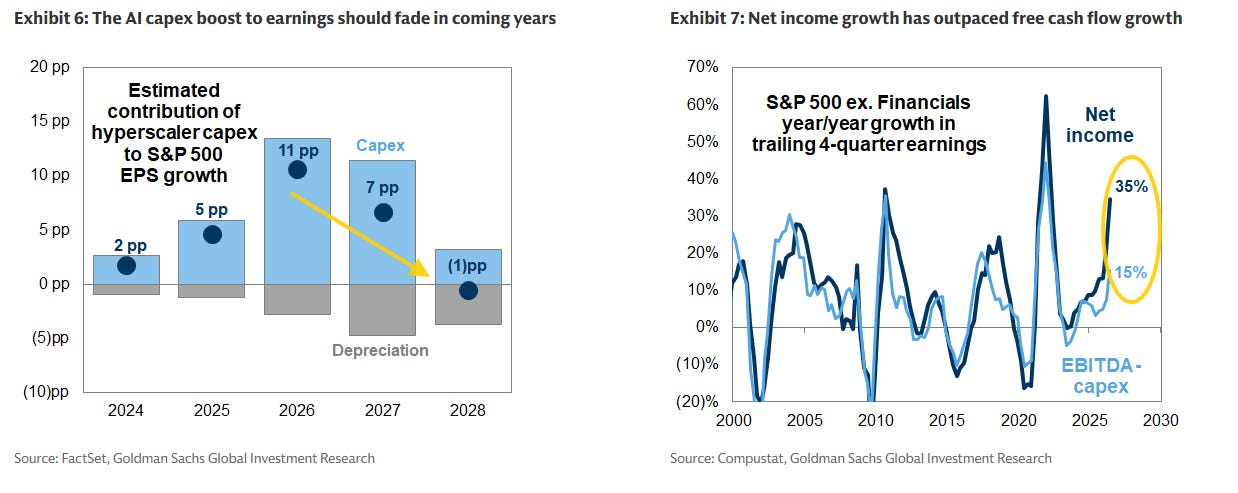
The decline in P/E multiples also reflects the investor view that companies are currently “over-earning” relative to both cash flows and a sustainable level of profits.The hyperscalers are on track to spend $800 billion on capex this year, which is flowing through to the earnings of semiconductors and other AI infrastructure stocks. We estimate that hyperscaler capex is driving roughly half of S&P 500 earnings growth this year. As hyperscaler capex growth slows and depreciation expenses rise, the impact of AI investment spending on S&P 500 earnings growth will begin to fade and eventually become a drag. Supply constraints that have boosted semiconductor profit margins and accounting gains from appreciating private equity stakes have also lifted recent earnings growth but will likely contribute less to profits going forward.
And they estimate that the rapid rise in interest rates and fears of “over earning” have resulted in an approximately 10% discount to multiples:
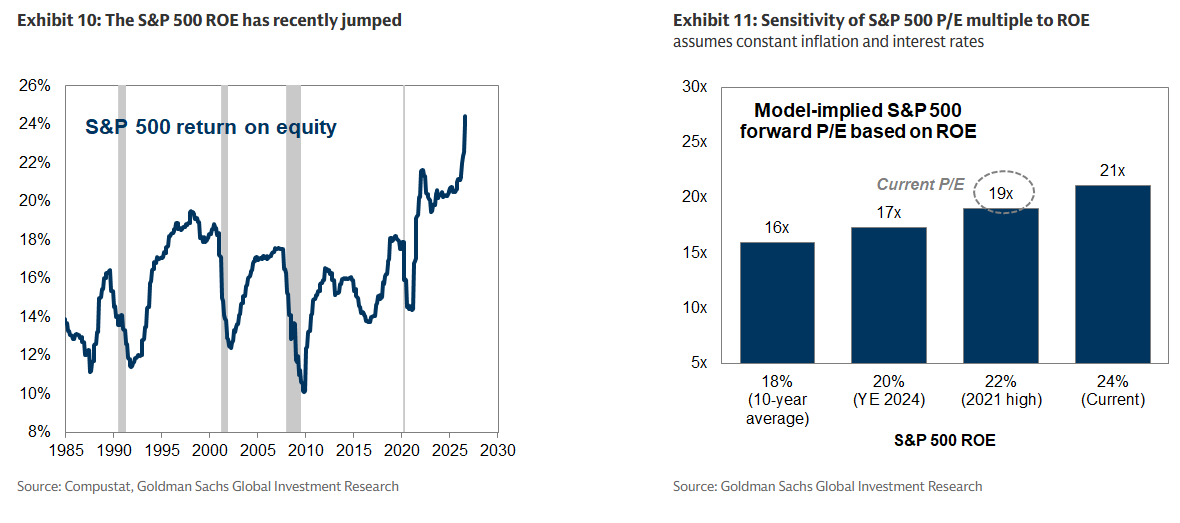
Our macro model for S&P 500 P/E valuation incorporates Treasury yields, inflation, and return on equity (“ROE”) as a measure of corporate profitability. Today’s P/E of 19x is about 10% lower than the multiple those macro and fundamental variables would imply today. We think this reflects justifiable market skepticism regarding the sustainability of current profitability but not an overly pessimistic earnings outlook. Given current inflation and interest rates, today’s S&P 500 multiple of 19x would be consistent with an ROE of roughly 22%, more than 200 bp below the current level but otherwise matching 2021 as the highest on record.
Breadth – Is There A Bottom?
This week we did see some positive end-of-week action for the broader market which put a temporary bottom in some of the index declines, but overall breadth metrics continued their deterioration.
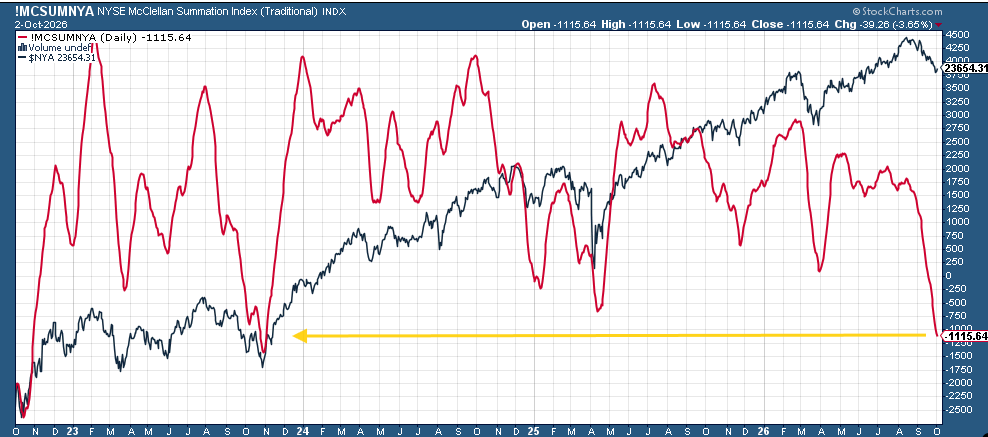
The McClellan Summation Index (red line, broadly whether the typical stock is doing relatively better or worse than the index) continues falling now the least since November 2023. As I mentioned last week “you can see, though, when it does rebound, rallies are generally fairly powerful.”
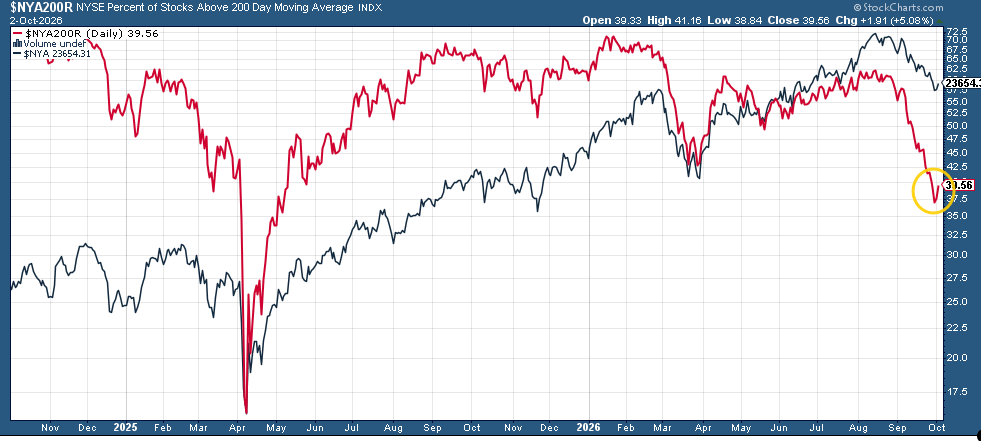
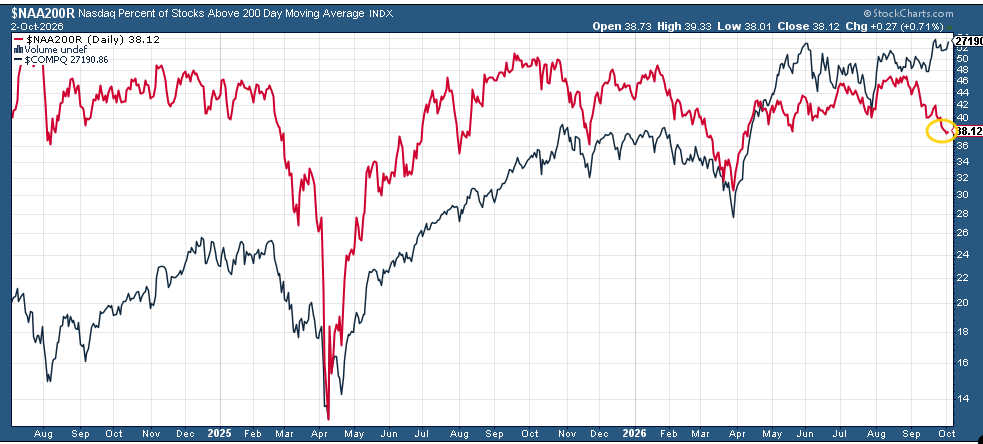
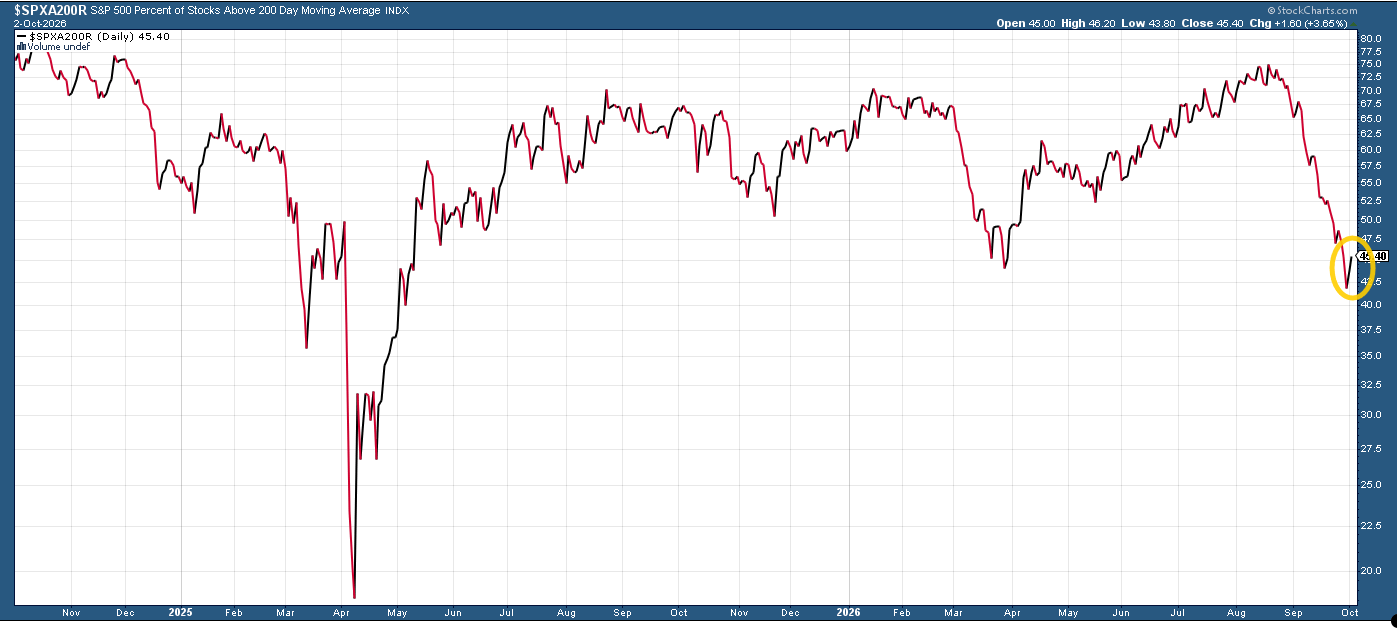
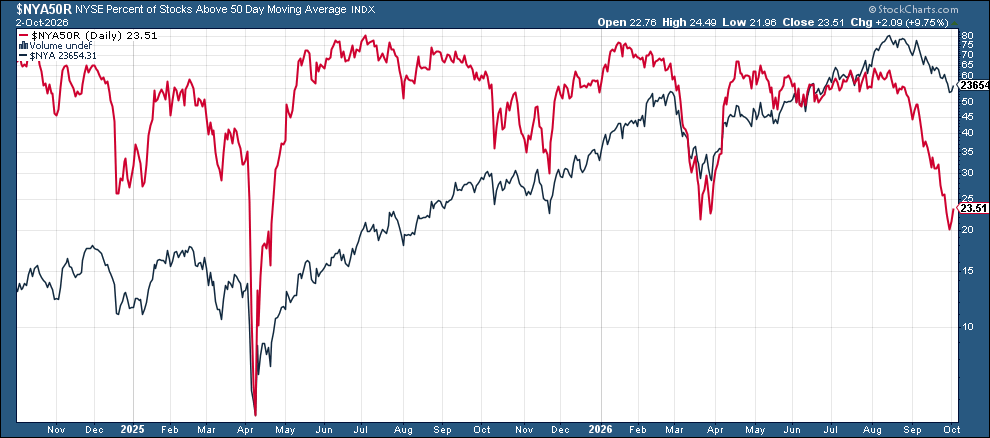
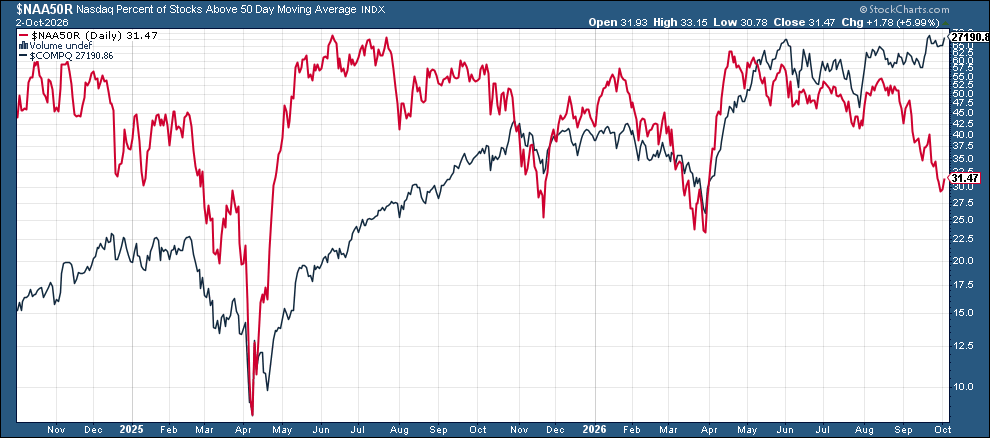
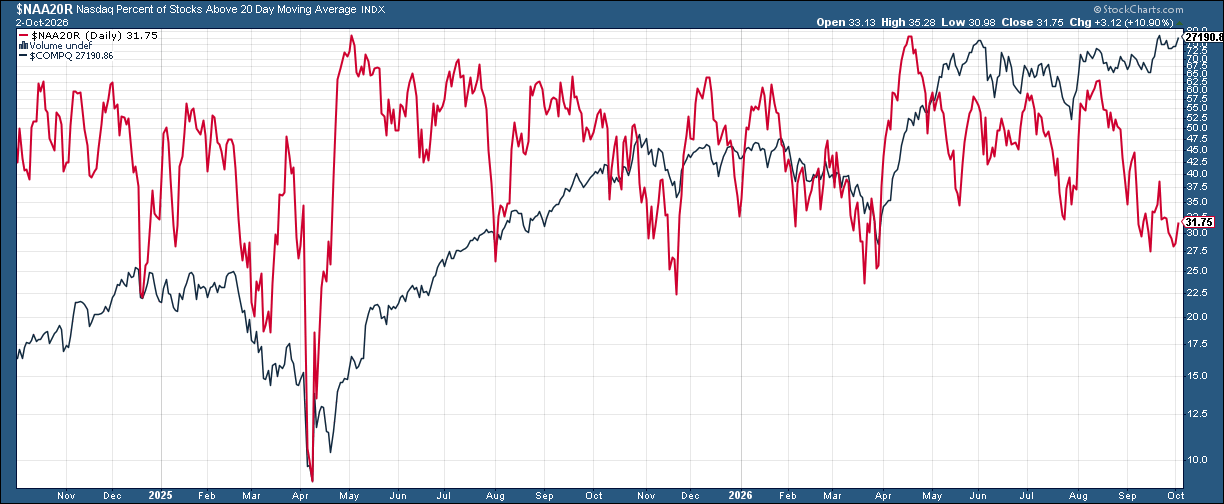
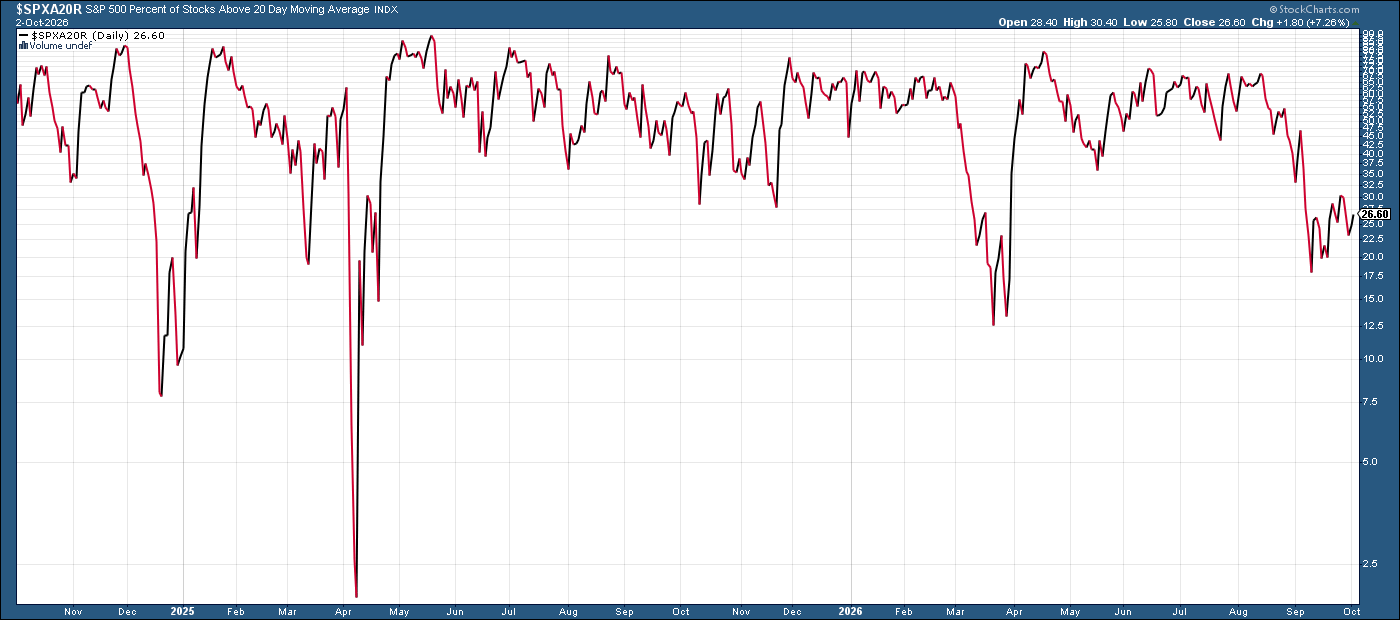
Percentage of stocks over 200-DMAs (red lines), saw the start of a rebound last week (less so on the Nasdaq).
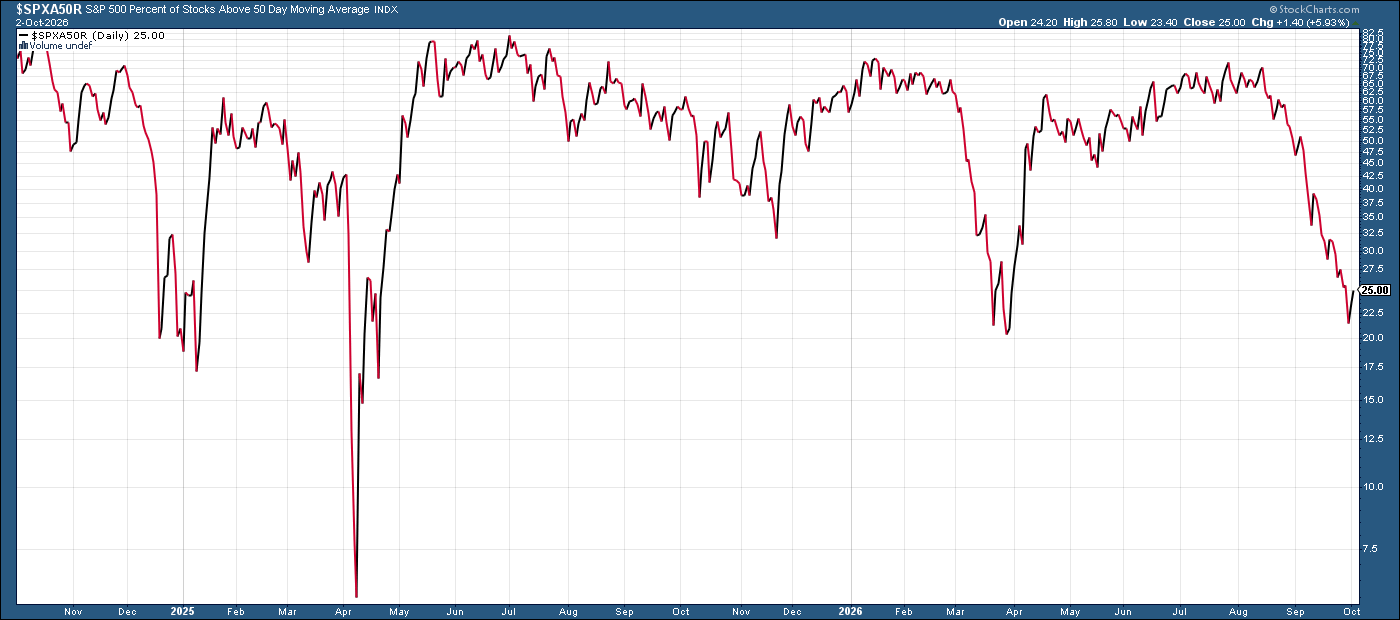
SPX remains well below 50%.
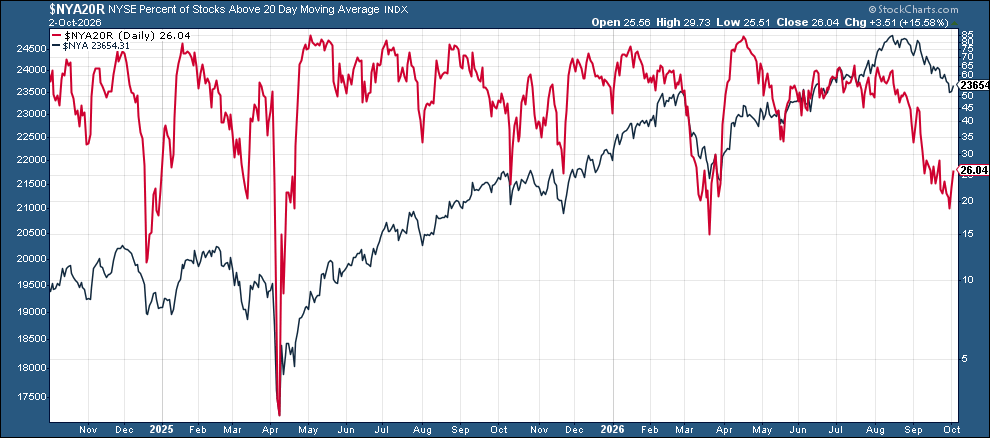
And a similar story for shorter-term 50 & 20-DMAs although here the Nasdaq did see a small bounce as well.
50-DMAs
20-DMAs
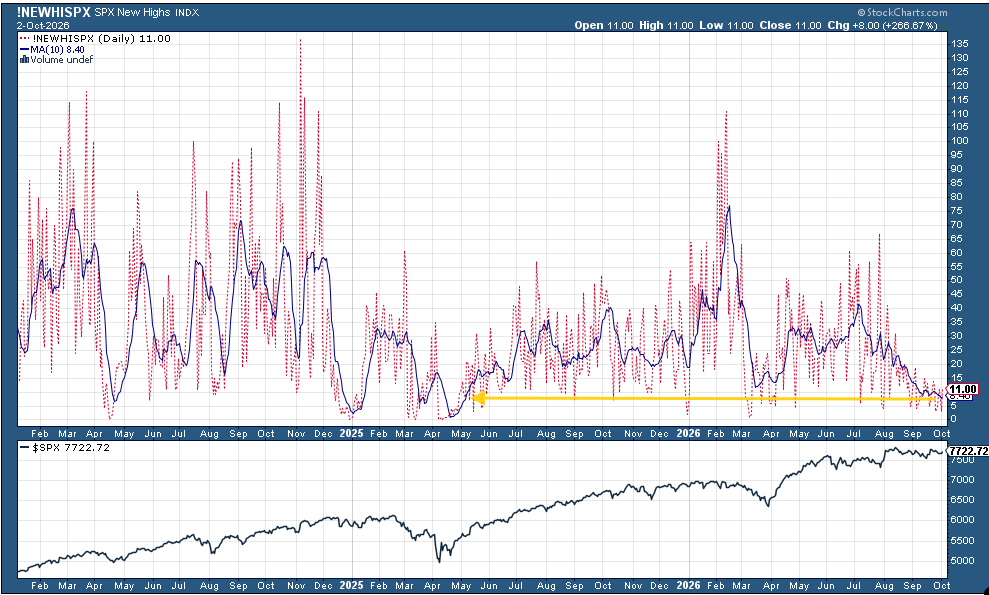
SPX new 52-week new highs continued its trend lower with the 10-DMA (blue line) the least since May 2025 at just 8.5.
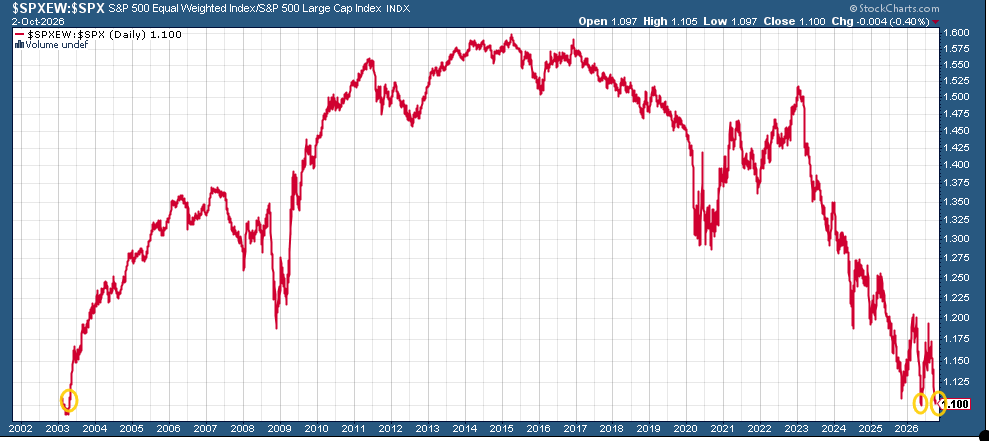
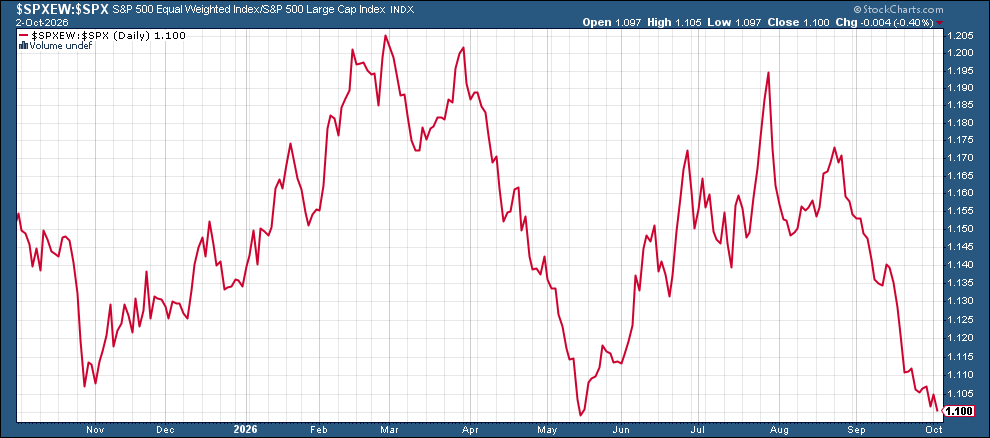
And the ratio of the equal-weight SPX to the cap-weighted continues to drop, now just above the May low which was the lowest since 2003.
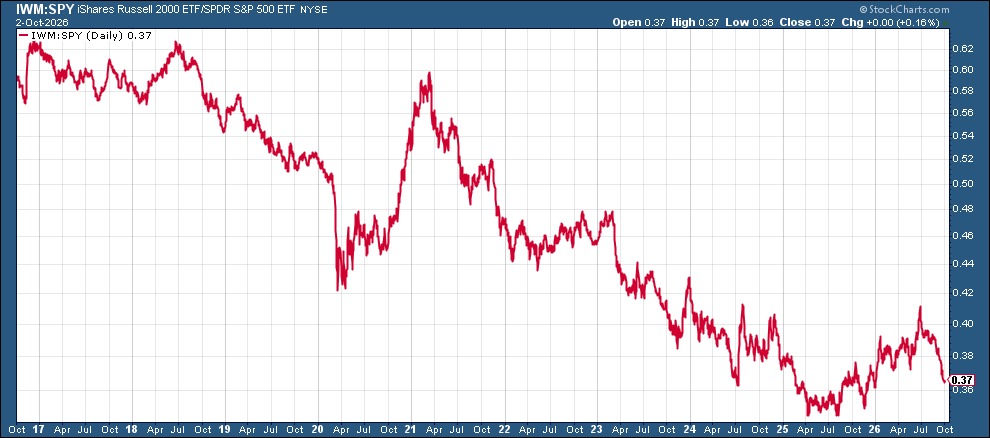
While the ratio of small caps to large caps (Russell 2000 to SPX) is the least since January.
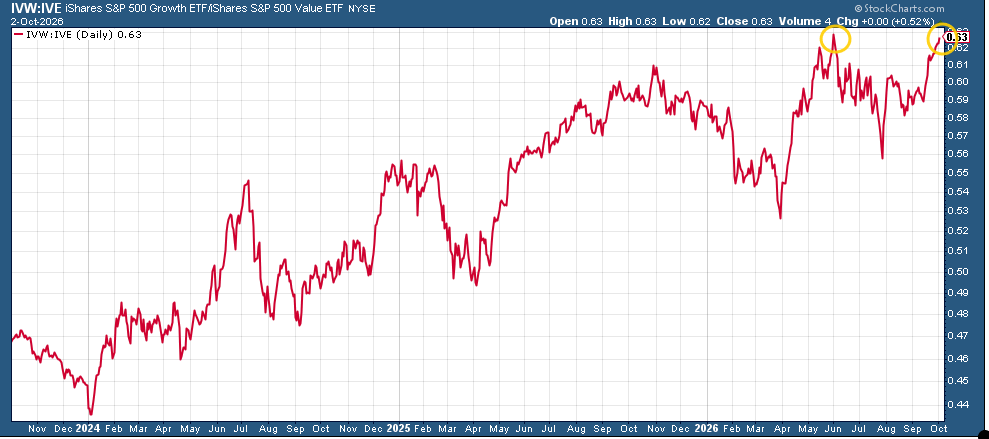
While S&P 500 growth/value is just off its all-time high from May.
Goldman:
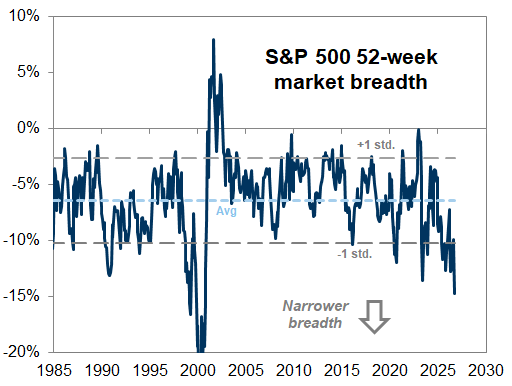
Mirroring the concentration of earnings growth, the composition of recent returns has also been narrow. While the market is only 2% from its all-time high, the median stock is 17% below its all-time high, pushing S&P 500 market breadth to its lowest level since the Dot Com Bubble. Both earnings and returns for the index are primarily being supported by the Info Tech sector.
Exhibit 6: Market breadth has recently plunged
market breadth calculated as the difference between the aggregate index and median stock respective distances from 52-week highs
Source: Goldman Sachs Global Investment Research
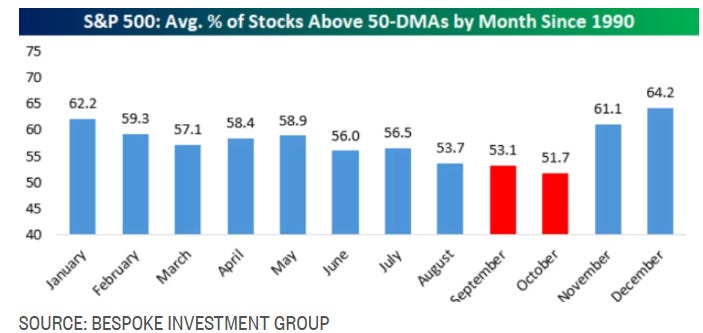
MarketWatch: Bespoke notes if history is any guide, the weak market breadth may extend into October where breadth seasonally hits its low point for the year. But looking on the bright side, the three months from November to January have typically had the strongest monthly performance readings.
Positioning Remains Bifurcated
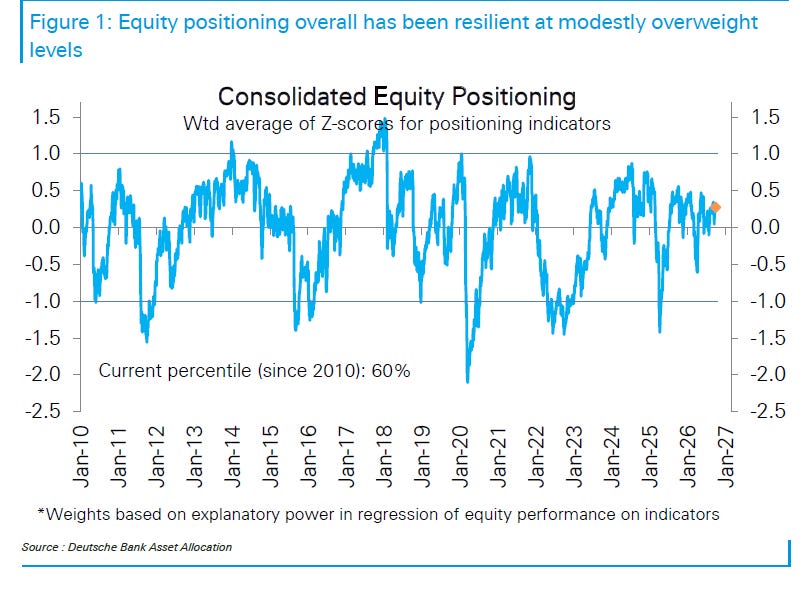
Turning to equity market positioning, as DB notes below “overall equity positioning has remained notably resilient…. Beneath the surface, however, the effects are more apparent.”
Deutsche Bank:
Despite the surge in rate volatility, overall equity positioning has remained notably resilient, at a modest overweight level in the 60th percentile. Beneath the surface, however, the effects are more apparent.
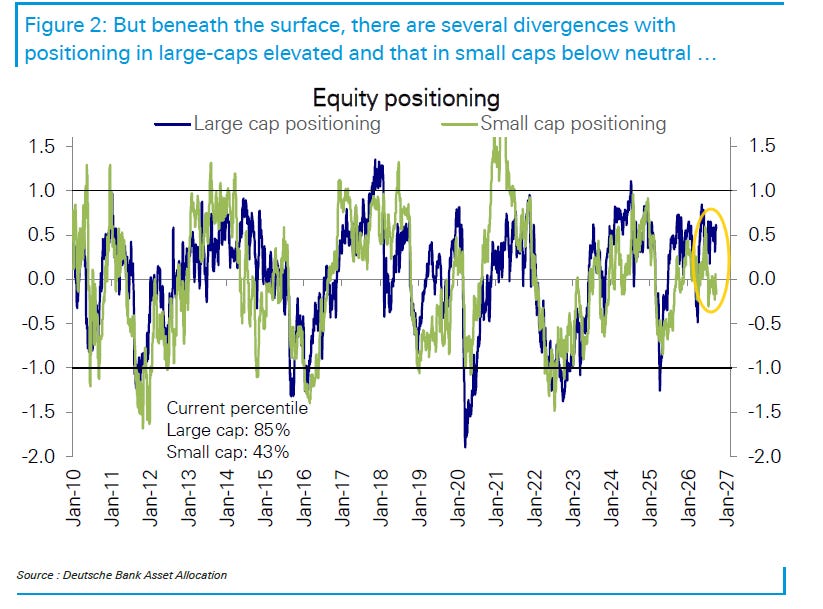
Large-cap positioning is clearly overweight (85th percentile), but it is not extreme and is well below levels implied by the boom in earnings. Small cap positioning meanwhile has slipped back into modestly underweight territory (43rd percentile).
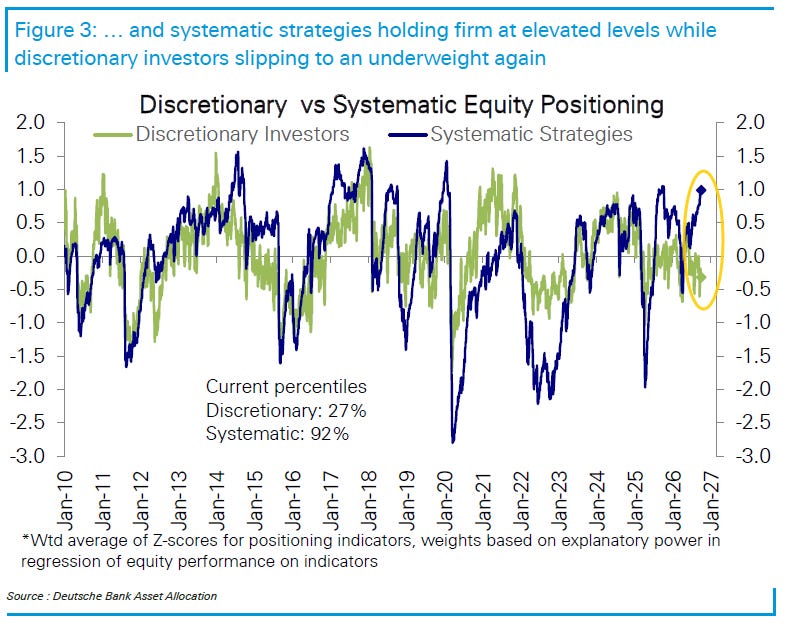
Systematic strategies have continued to support equity positioning, while discretionary investors have grown more cautious. Across the investor base, systematic-strategy positioning remains elevated at the 92nd percentile and is therefore vulnerable to an increase in equity volatility.
By contrast, overall discretionary-investor positioning has declined and is again below neutral, at the 27th percentile. Even among large-cap equities, discretionary positioning has fallen over the past several weeks, though it remains relatively elevated at the 68th percentile.
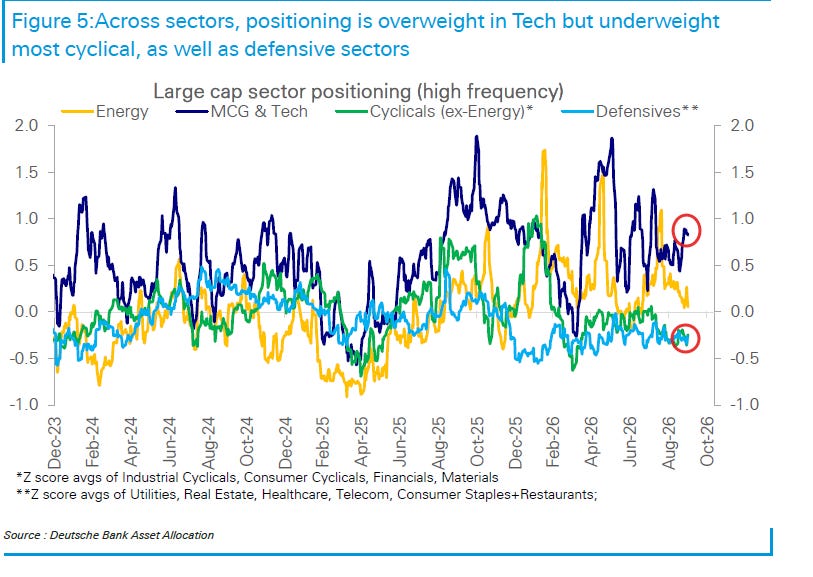
Sector positioning is narrow. Media, communications, gaming, and technology are the only sectors with overweight investor positioning, while Energy is around neutral. Outside of these, positioning remains broadly subdued, both for cyclical and defensive sectors.
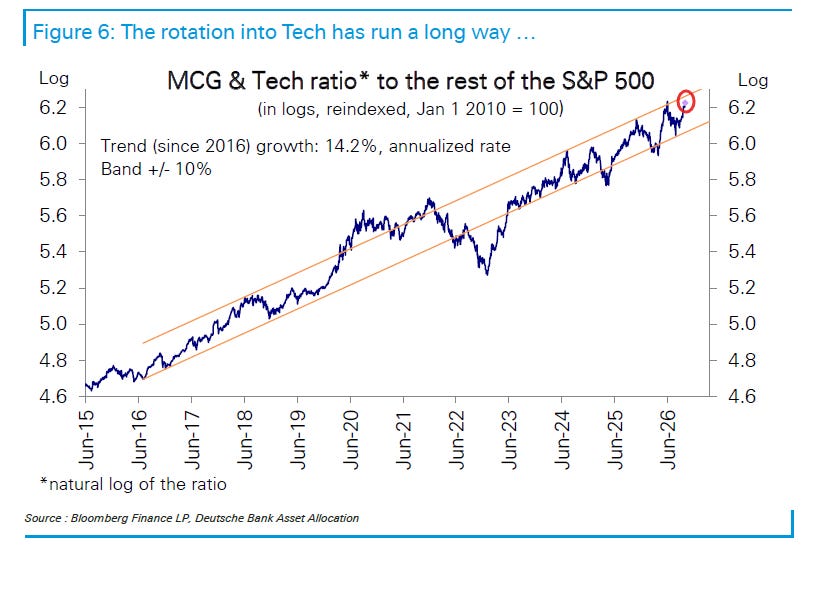
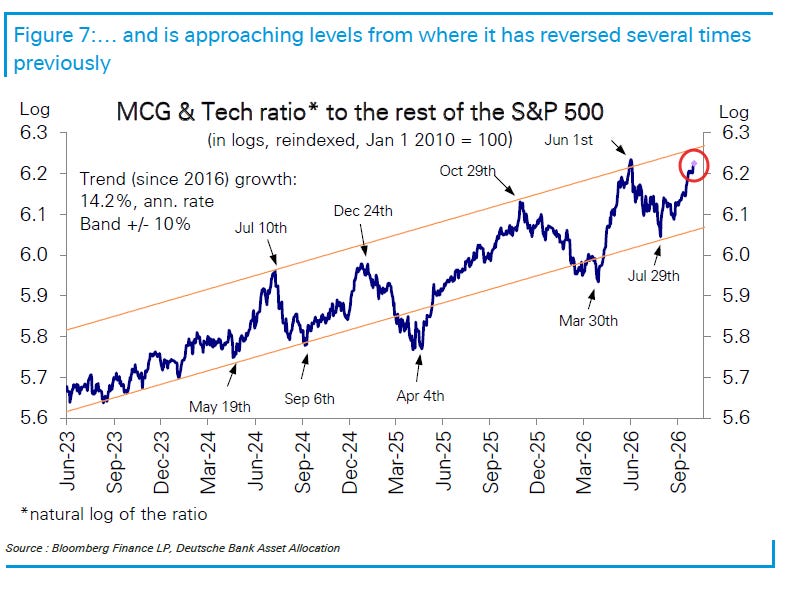
Last week, we noted that the rotation into Tech was well advanced but still had room to run. With another 2pp of outperformance this week, it has gone even further and while not at the tippy-top of its long-run trend channel, it is getting close to levels from which it has reversed several times previously.
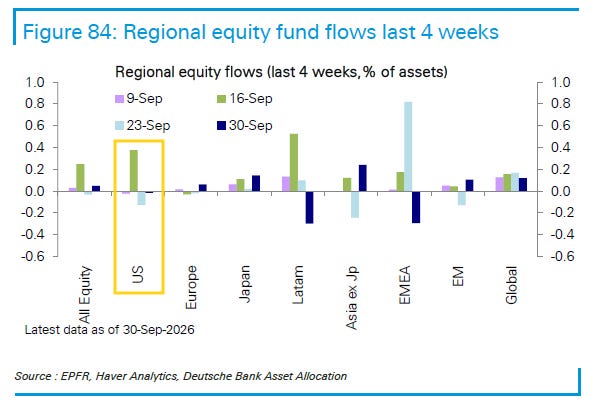
In terms of last week’s flows they note that equity funds returned to inflows after their first outflow in three months although with “US funds (-$2.7bn) extending outflows for a second consecutive week.”
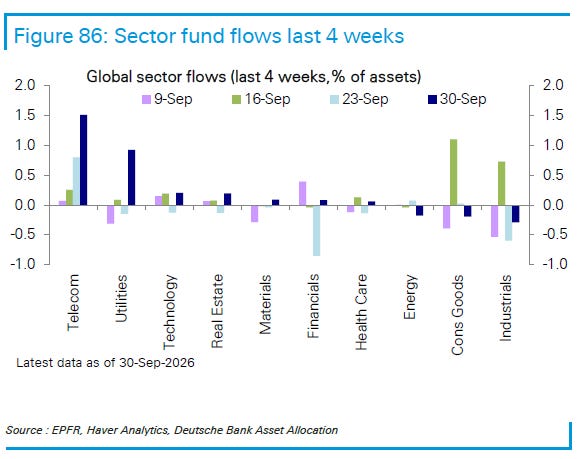
Among dedicated sector funds, Technology attracted $3.3 billion—the largest weekly inflow in a month—reversing the prior week’s outflow. Utilities received $1.0 billion, its largest year-to-date inflow, while real estate and telecommunications each recorded notable $0.8 billion inflows.
Materials saw its first inflow in a month. Financials and health care each received modest inflows of $0.2 billion.
By contrast, industrials recorded $0.5 billion of outflows for a second consecutive week. Energy and consumer goods also saw modest redemptions of $0.3 billion and $0.2 billion, respectively.
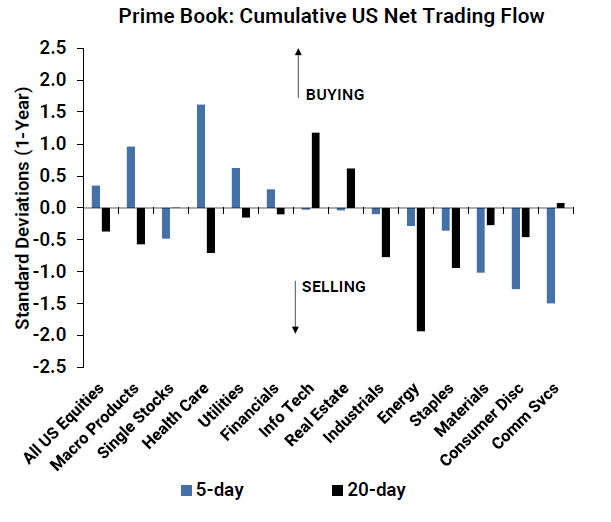
Goldman’s prime desk (mostly hedge funds) also saw buying in equities emphasizing different sectors:
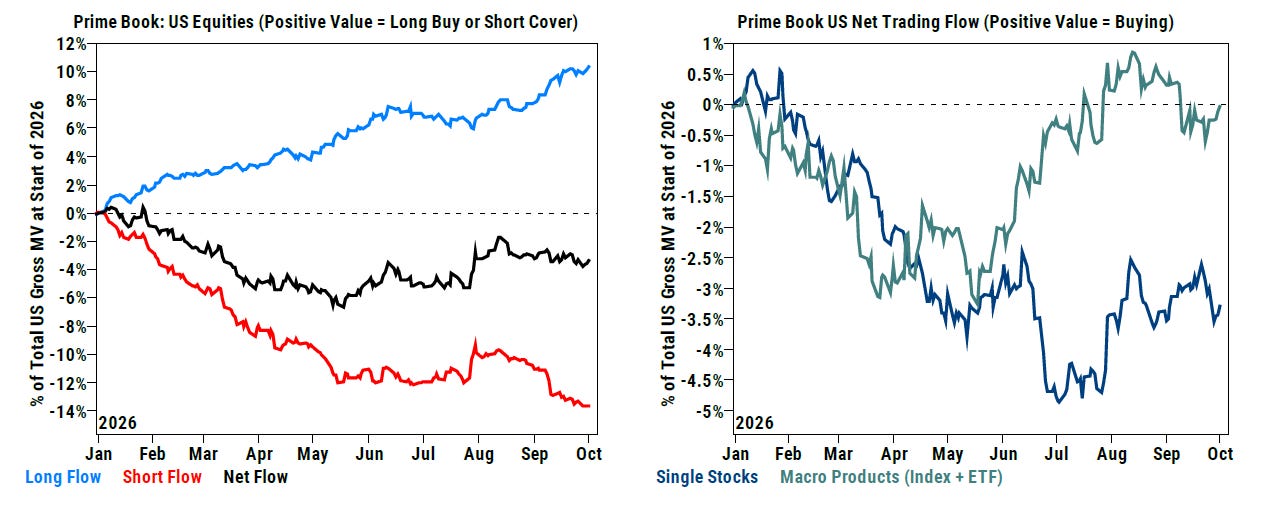
US equities were modestly net bought on the week (+0.4 SDs 1-year), driven by short covering in Macro Products partially offset by continued shorting in Single Stocks.
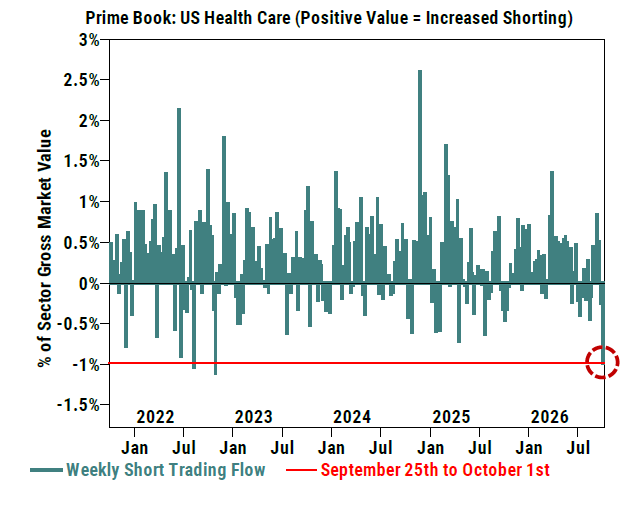
After selling the sector for six straight weeks, hedge funds net bought US Health Care stocks at the fastest pace in more than six months (+1.6 SDs 1-year), driven almost entirely by short covers – this week’s short covering was the largest since Oct’ 22 and ranks in the 99th percentile on a 5-year lookback. Nearly all subsectors were net bought this week, led by Biotech, Pharmaceuticals, and Life Sciences Tools & Svcs, all of which were driven by short covers. Aggregate US Health long/short ratio now stands at 2.29, near 1-year lows in the 2nd percentile and in the 21st percentile vs. the past five years.
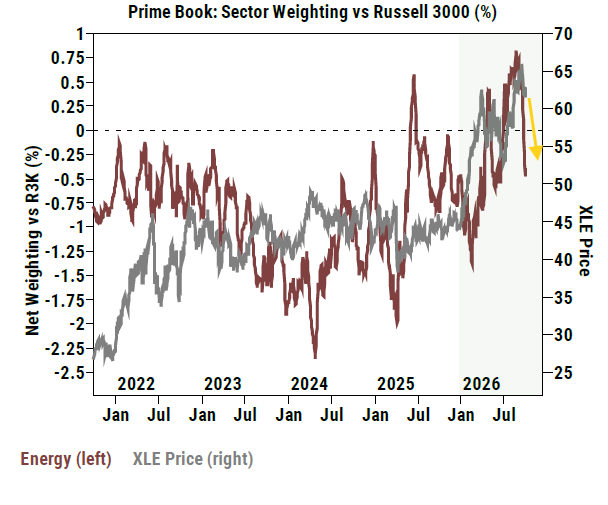
US Energy stocks collectively were net sold for a sixth straight week (8 of last 9), driven by short sales outpacing long buys (2 to 1). While oil prices remain near multi-year highs, on a month/month basis Energy is the most net sold US sector on the Prime book in both $ and SD terms (-1.9 SDs 1-year), driven almost entirely by short sales – Oil & Gas Refining & Marketing, and to a lesser extent Oil & Gas Equip & Svcs and Integrated Oil & Gas have been the most net sold subsectors. Hedge funds are now U/W Energy stocks by -0.4% relative to the Russell 3000 (vs. 5-year high of +1% O/W seen in July), in the 57th percentile vs. the past year and 82nd percentile vs. the past five years.
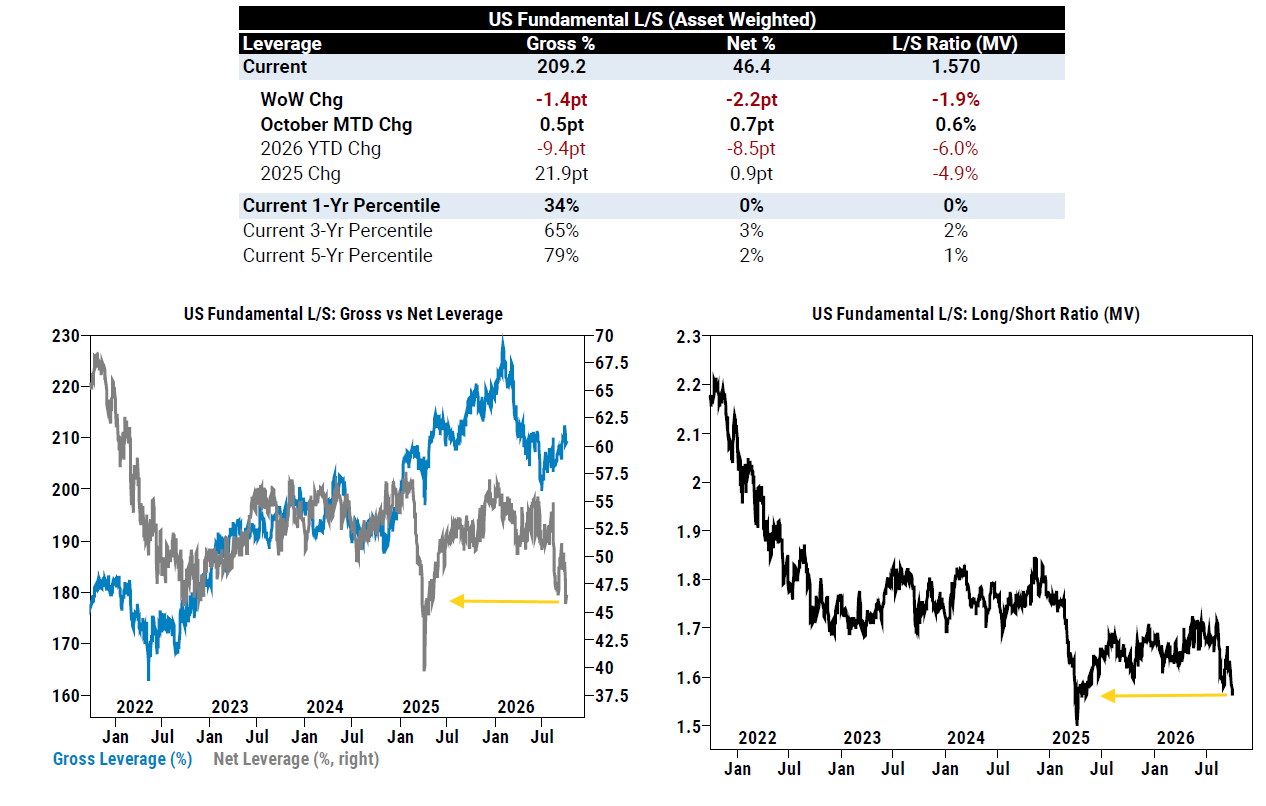
Overall positioning remains light with US Long/Short Fund gross leverage at the 34th percentile one-year (but 79th five-year percentile), while US net leverage is “the lowest level since Apr ’25 (around “Liberation Day”) and approaching five-year lows in the 2nd percentile”. The US Fundamental long/short ratio (MV) decreased to the 0 percentile one-year (1st five-year).
So there’s quite a bit of room for hedge funds to reengage with the market.
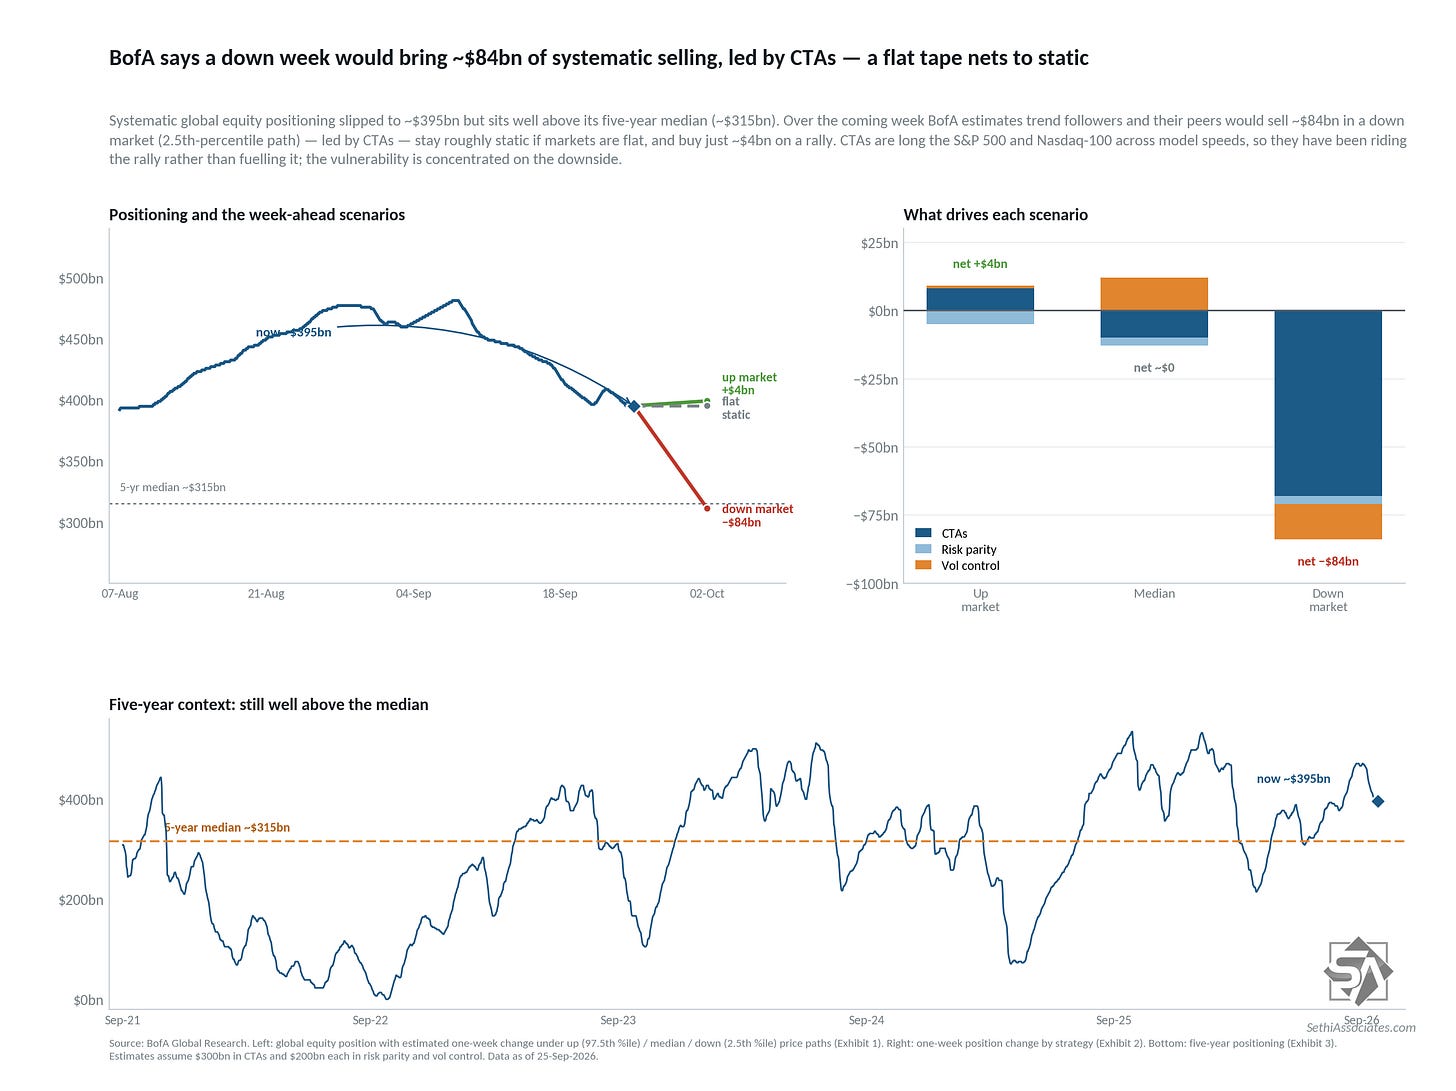
Turning to systematic positions, BofA saw more selling from CTAs last week, and they again say further selling remains the predominant risk in their models, although less so for large cap equities, particularly the Nasdaq-100, which are further from sell triggers:
Trend followers continue to hold their strongest and most consensus long positions in US large cap equities, while positioning remains mixed across model speeds in the Russell 2000, Euro Stoxx 50, and Nikkei. The most notable development this week was the Nikkei rally, where enthusiasm surrounding Micron’s earnings and the broader AI theme spilled over into Japanese equities. CTA flow risks remain skewed toward selling on the downside, while most upside scenarios would generate only modest buying.
The sell trigger for the S&P 500 now sits around −2.4%. No sell triggers were listed for the Nasdaq-100 (which last week was ~−5.4%) or Russell 2000 but they see a buy trigger for the latter at +2.0%.
Specifically they see:
−$3B of selling in a flat market (from static last week);
no buying (static) in an “up” market (from +$4B; “up market” defined as the 97.5th percentile price path or ~+3.5%, similar to Goldman); and
−$84B of selling in a “down” market (unchanged from last week, and down from −$157B the prior week; “down market” defined as the 2.5th percentile price path or ~−2.9%, different than Goldman who uses −4.5%).
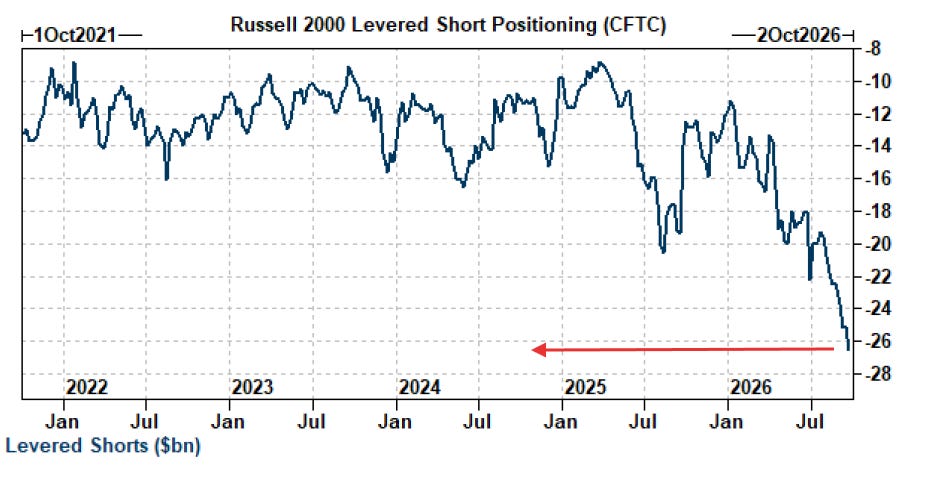
Goldman notes on the Russell 2000 that
Positioning is deeply depressed, with GS systematic exposure in the 7th percentile and leveraged funds carrying record short exposure, according to CFTC data as of September 22… CTA positioning remains relatively short, leaving less momentum supply on continued weakness.
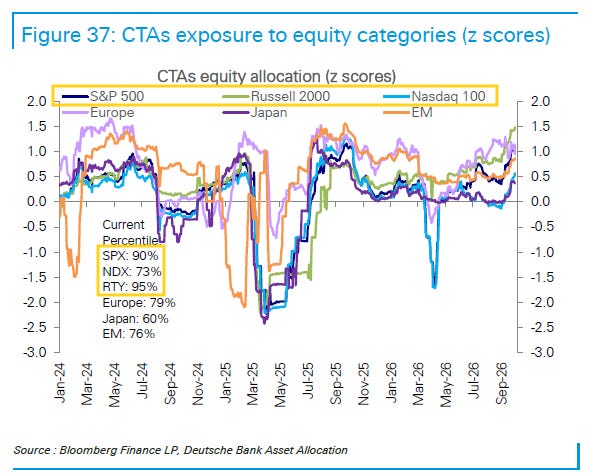
DB also says they see global CTA positioning as having “declined this week but remains elevated” at the 77th percentile to 2010 (from the 82nd the prior week and down from the 89th three weeks ago) but they say US positioning rose to the 91st percentile (from the 79th two weeks ago), on the back of continued rebuilding in the Nasdaq-100 which is now up to the 73rd percentile (from the 47th two weeks ago), while SPX and RUT have been little changed the past few weeks remaining elevated at the 90th and 95th (the latter clearly conflicting with data from BofA and Goldman).
“Further increases in equity exposure are still likely to depend more on declining volatility than on stronger trend signals.”
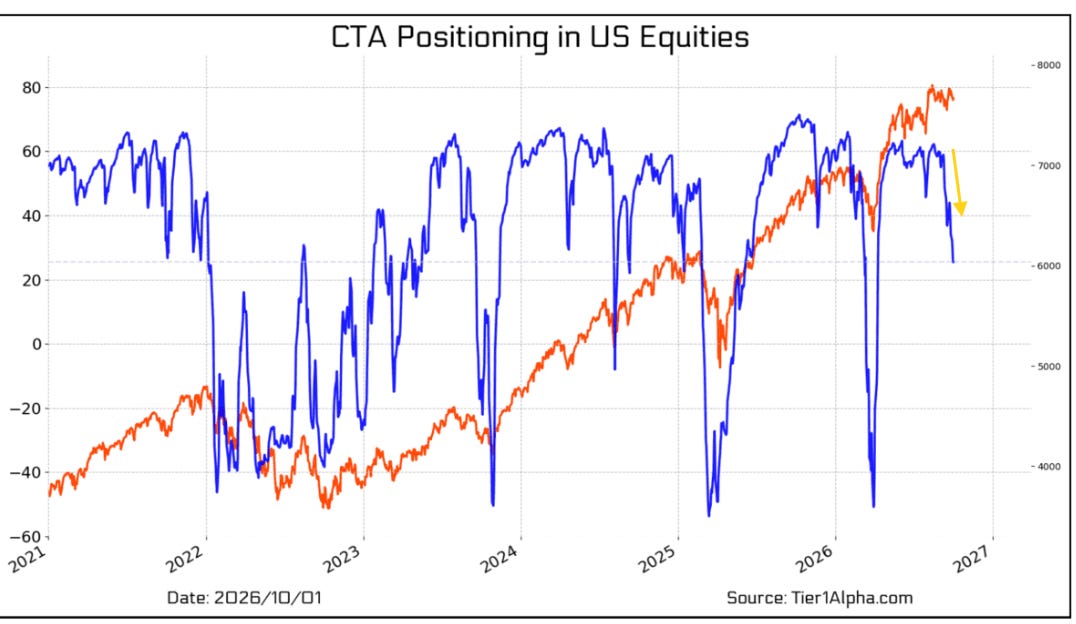
Here was Tier1Alpha’s take from Friday morning:
What is becoming more concerning is the continued decline in CTA positioning. After several months of largely sideways exposure, the trend has once again turned lower, marking the strongest selling we have seen from this cohort since the Iran conflict began back in March.
Interestingly, the setup bears a fairly close resemblance to that period as well, with realized volatility remaining subdued and much of the pressure stemming from deteriorating momentum rather than a broader volatility shock.
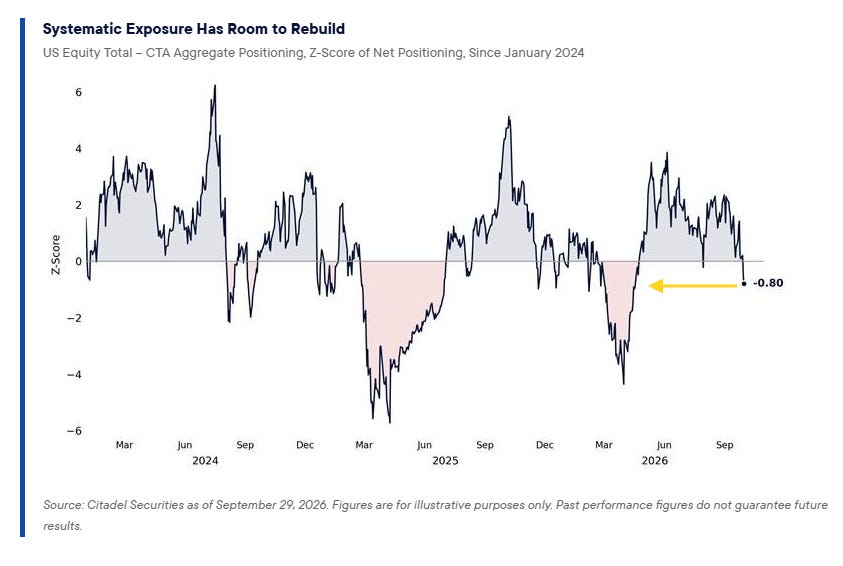
And Citadel’s Rubner noted this week:
Systematics:They have already sold. US equity CTA positioning moved from +2.35 standard deviations at the end of August to -0.80 today, a more than 3-sigma swing in one month. Positioning is now in the bottom fifth of its range since 2024 and below neutral for the first time since the April rebuild.
The flow asymmetry has flipped.
Corporates have record authorized capital waiting for open windows. Retail has reset from the summer highs. CTAs have moved from crowded long to below neutral.
Several of the equity market’s largest buyers enter Q4 with significant capacity to add exposure. If equities stabilize and trends improve, the marginal buyer increasingly lives higher into year-end.
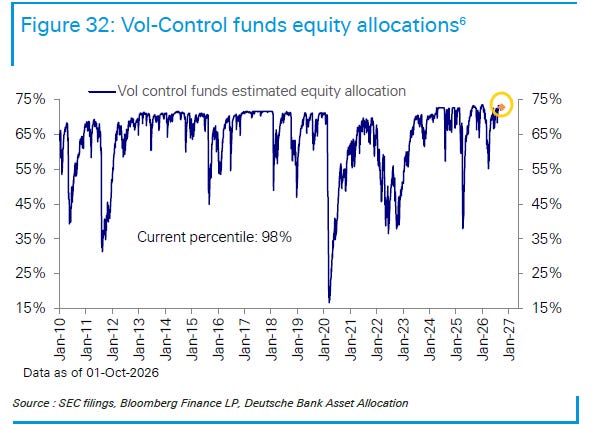
Looking at vol control* positioning, DB finds that also “remains elevated” at the 98th percentile and remaining a risk if volatility were to spike:
Sell-off sensitivity also increased, although it eased from levels seen earlier in the week. With positioning still stretched, capacity for further equity additions remains limited, while the flow backdrop has become increasingly asymmetric and could become less supportive if volatility rises.
*vol control strategies enter and exit based on changes in volatility over past windows (mostly 1-month and 3-month).
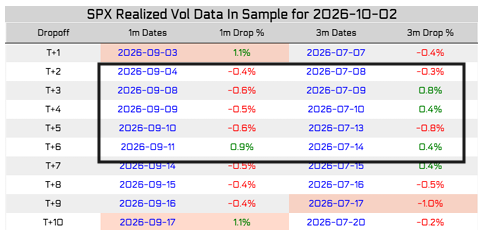
Looking at the upcoming week, it’s more tilted towards vol control selling than buying. Not a single 1%+ day dropping off in either the 1-month or 3-month lookbacks, although also just one sub-0.3% day..
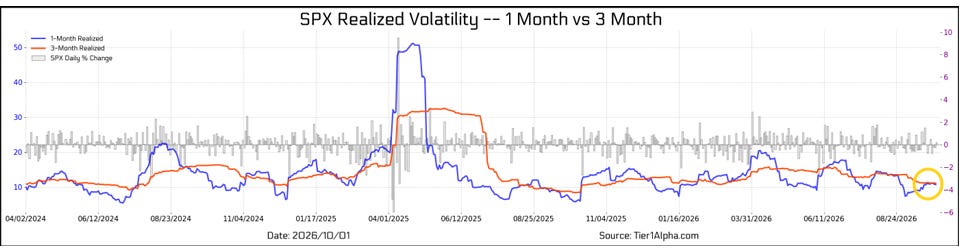
In that regard Tier1Alpha noted this week that “Vol control funds are also sitting at an increasingly sensitive position, with essentially no meaningful buying opportunities showing up over the next two weeks. In fact, most of the returns scheduled to roll out of the trailing sample are relatively low volatility, which means any higher-vol data coming into the sample could trigger some meaningful selling requirements. 1-month and 3-month realized volatility remain near parity. The key signal from here would be 1-month realized volatility breaking decisively above the 3-month measure, which would accelerate the pace at which these funds would have to rebalance.”
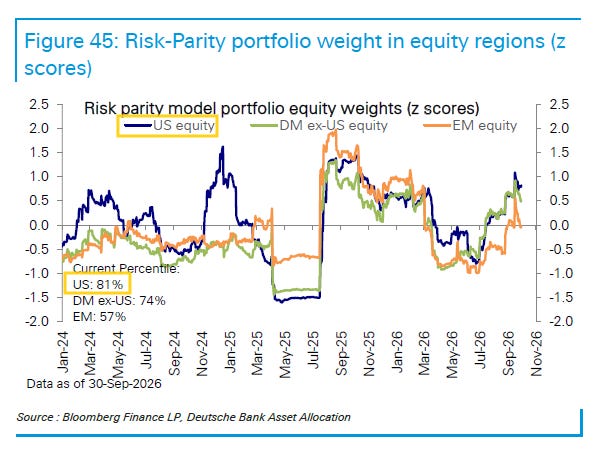
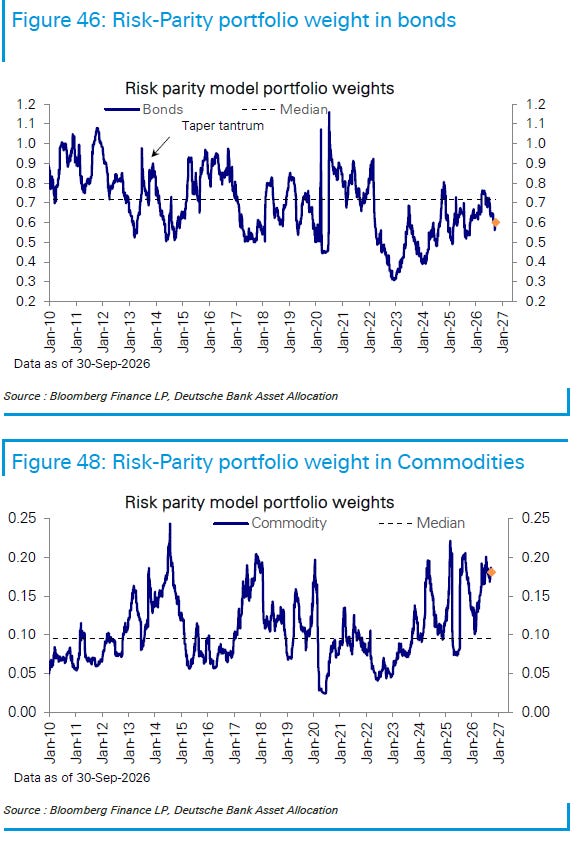
While for risk parity DB says “equity allocations declined modestly this week,” the second week of outflows with the US though still at the 81st percentile (from the 82nd the prior week). Bond exposure saw a second week of increase to the 33rd percentile (from the 26th two weeks ago) while commodities remain elevated at the 93rd (from the 95th).
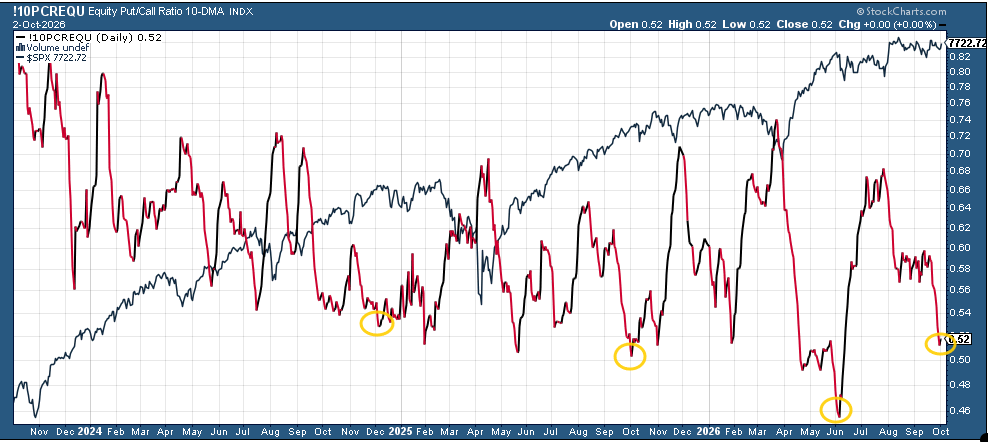
While put/call buying (which adds incremental downside/upside pressure) continued to drop sharply last week after breaking out of its seven-week sideways chop the prior week, although perhaps stabilizing on Friday. It’s above the lows of the year, but around the lows of 2025 and beneath those in 2024.
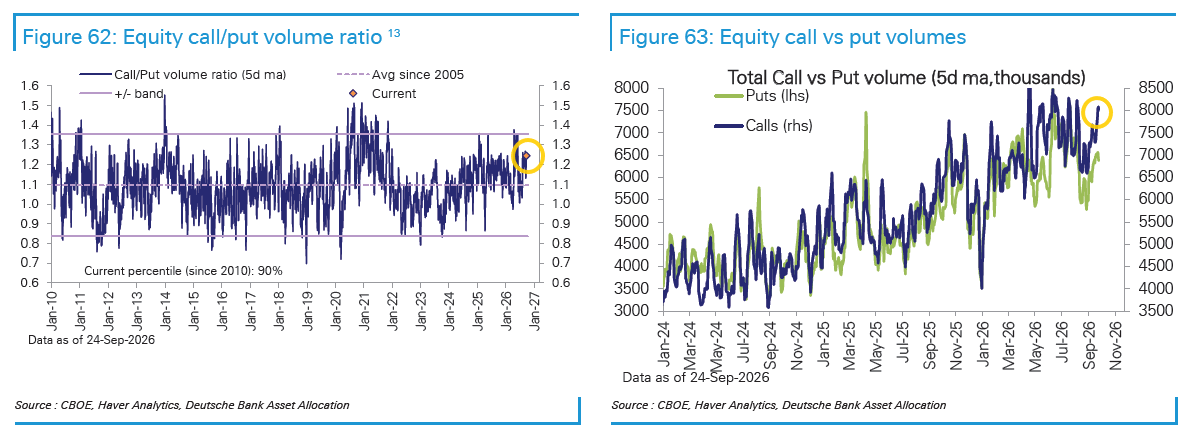
And DB said the 5-DMA of call/put volume decreased to the still elevated 82nd percentile from the 90th the prior week, “driven by a decline in net call volume across single-stock and index options. Within single-stock options, volume declined across most sector groups, led by MCG & Tech and followed by Consumer Cyclicals, defensives and Industrial Cyclicals.”
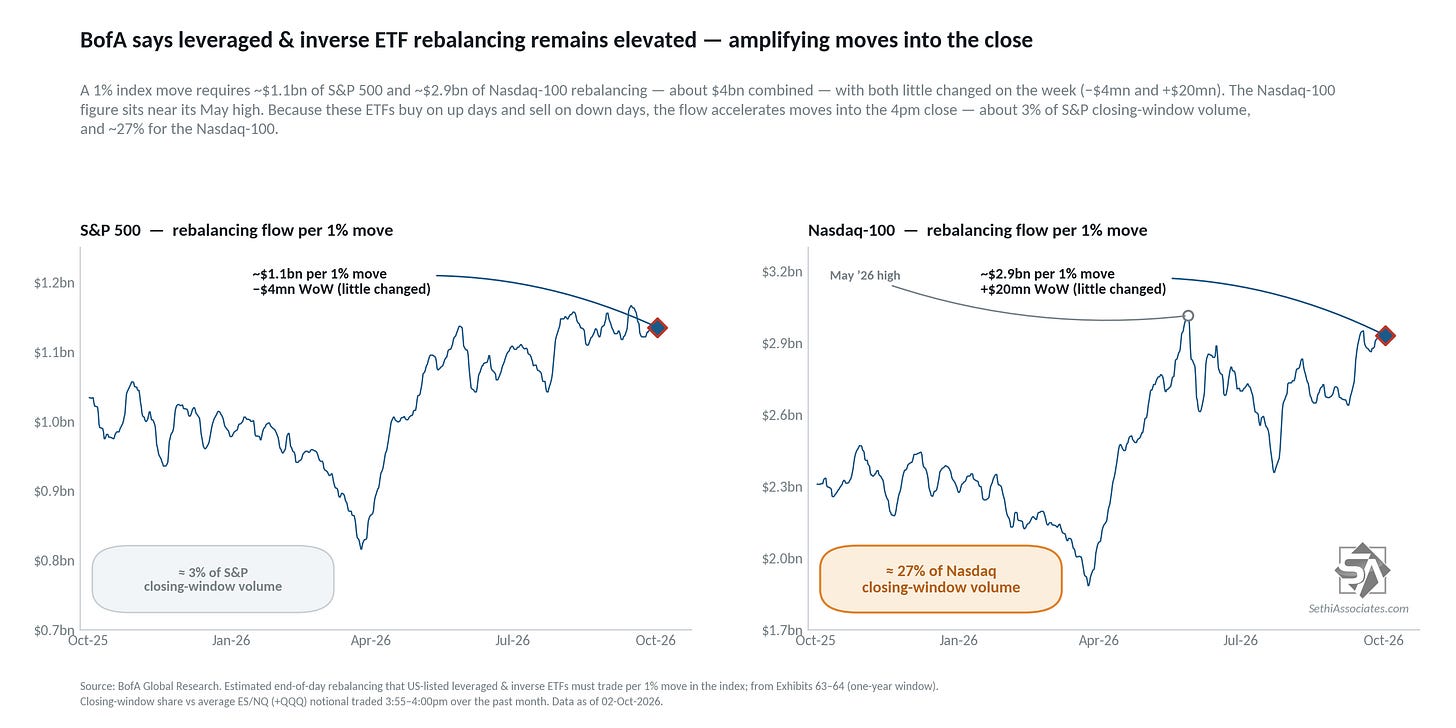
Like call buying, leveraged positioning acts as a “negative gamma source” as Charlie McElligott has put it (meaning that there is added buying/selling pressure from them in the direction of daily flows as they rebalance each day).
Rebalancing flows for Nasdaq-100 and SPX leveraged ETFs were little changed last week remaining at historically elevated levels.
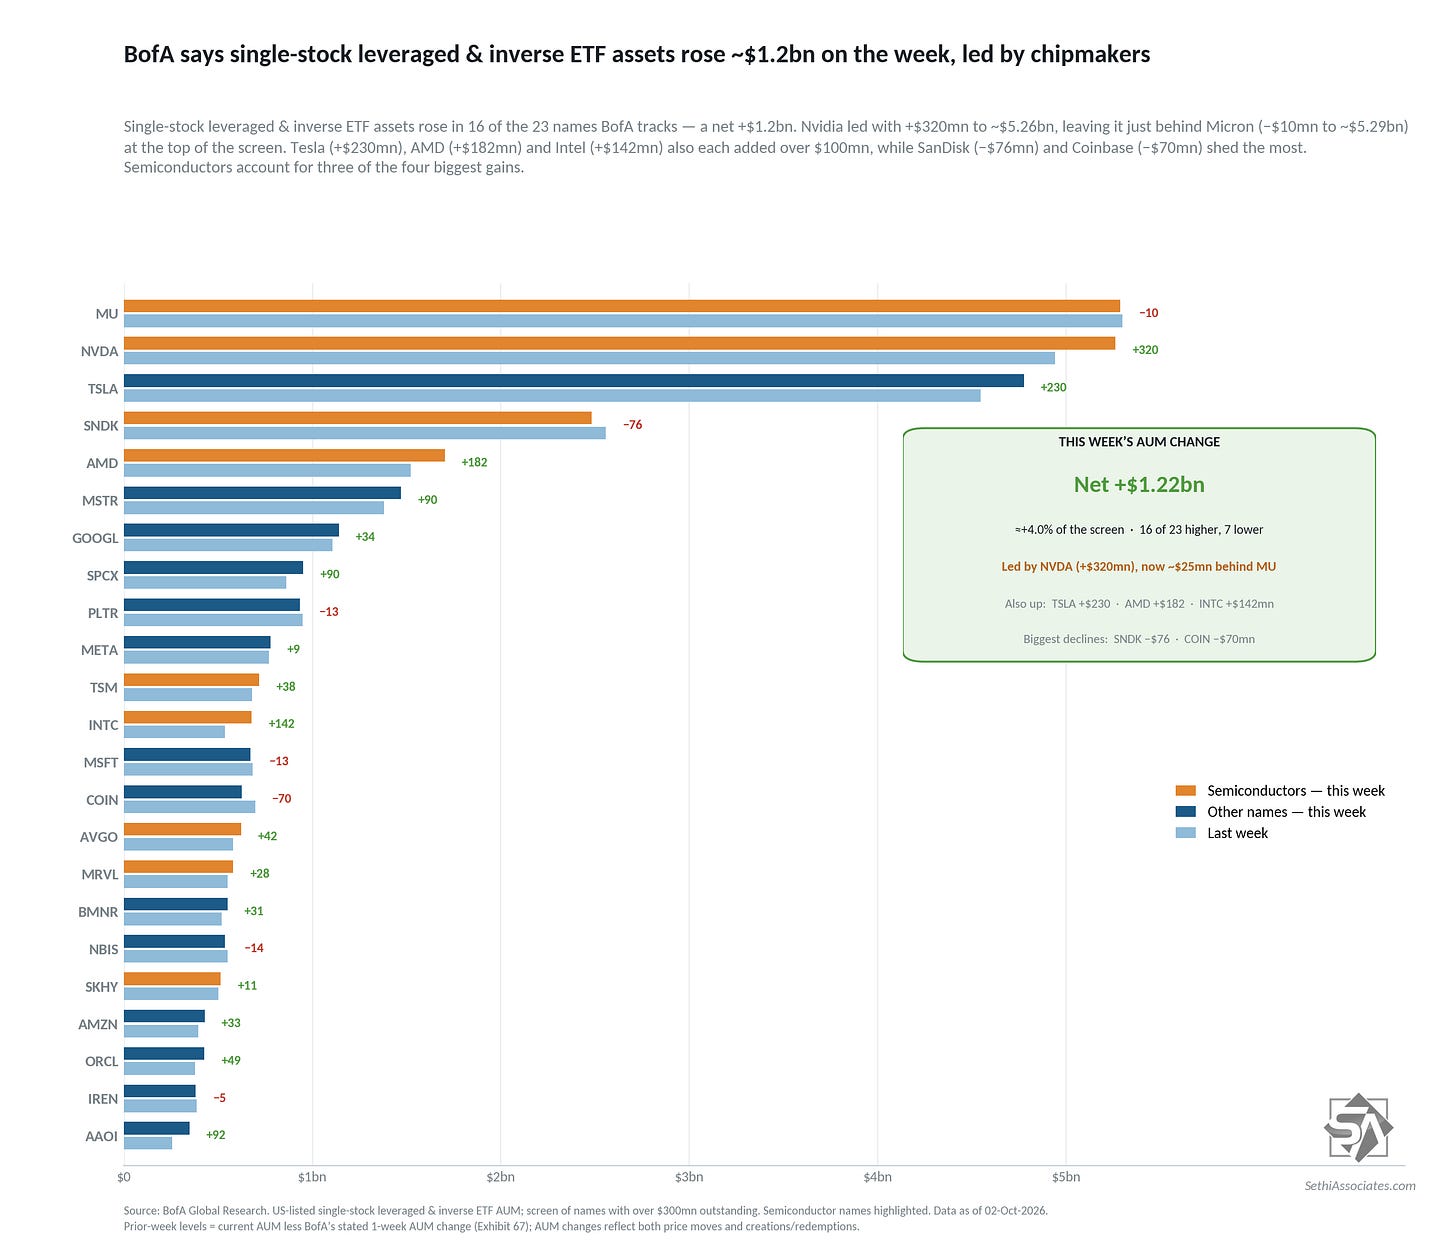
Single-stock leveraged ETF AUM also rose a third week led by Nvidia (NVDA) leveraged ETFs, now just behind Micron (MU).
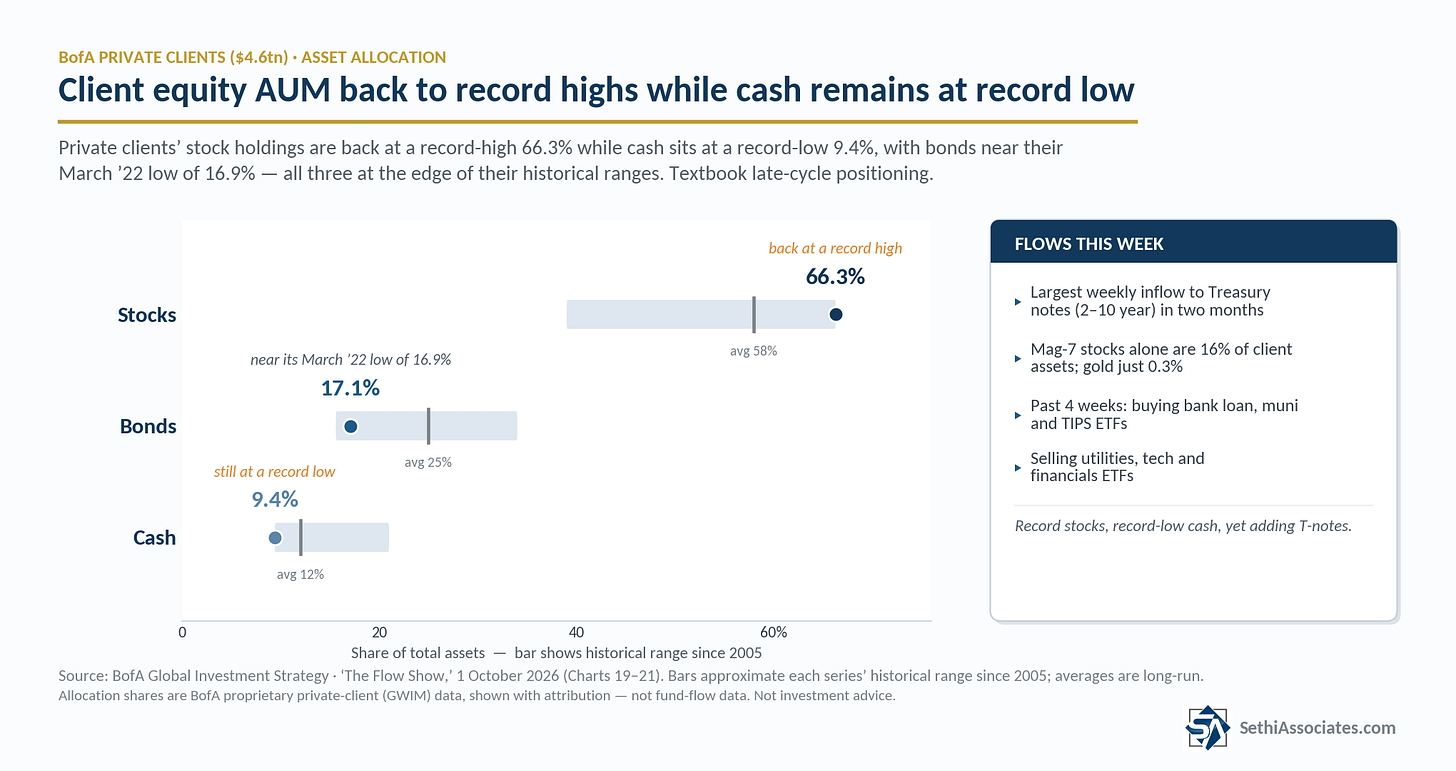
Turning to retail positioning, BofA client retail equity positioning continues to run counter to the pullback seen in other retail metrics with AUM in stocks back at an all-time highs at 66.3% (they must have revised the 66.5% they published five weeks ago), while bonds fell back to 17.1% (two tenths above the 16.9% September 4th that was the lowest since March 2022), while cash remained at the 9.4% record low.
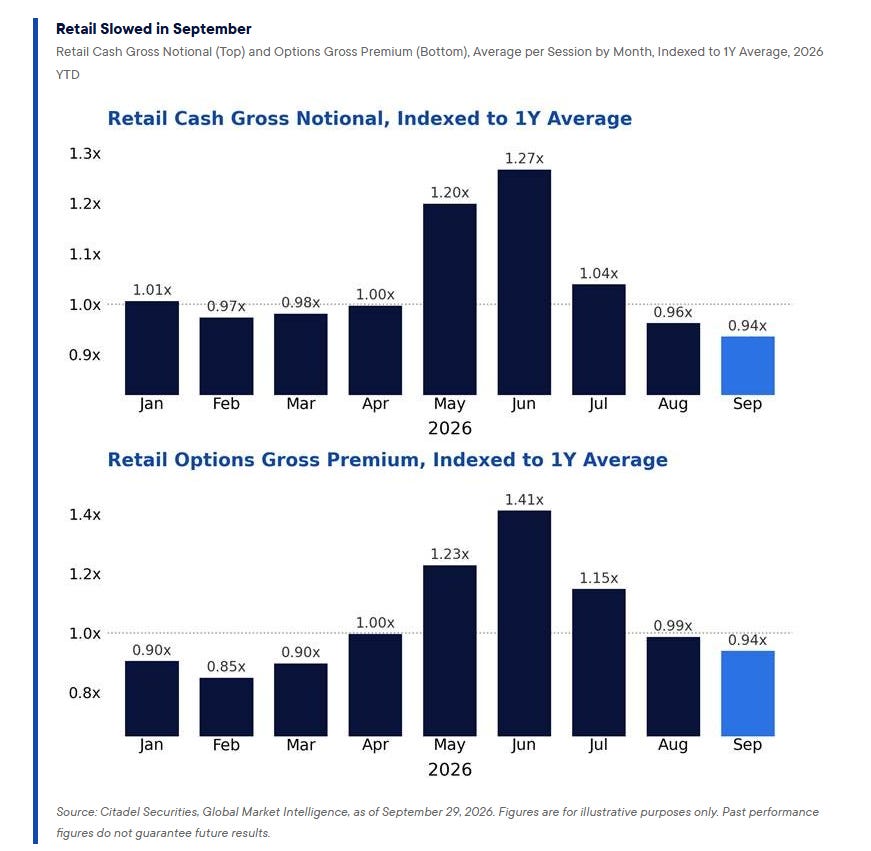
While Citadel’s Rubner says
Retail activity reset sharply from the summer highs. September cash turnover fell to 0.94x its trailing one-year average, the lowest level of 2026, while retail options premium also fell to 0.94x after reaching 1.41x in June. Cash activity is now 26% below the June peak, while options premium is roughly one-third lower.
That slowdown has historically tended to reverse in October. Cash activity has increased from September to October in each of the last four years, by an average of ~8%, while options activity has risen in each of the last three, by an average of ~15%.
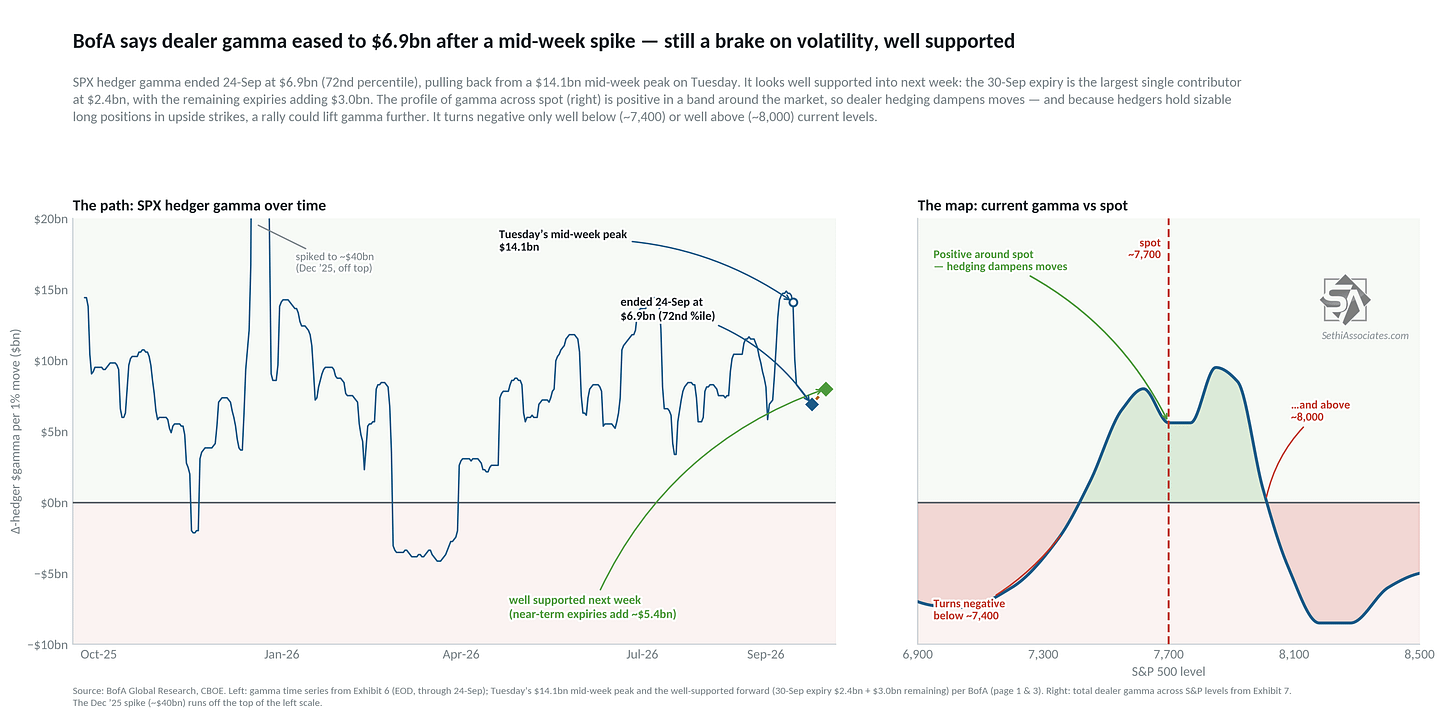
And looking at gamma* BofA saw SPX gamma last week as firmly positive all week ending Thursday at the 77th percentile, and it’s expected to remain so next week, although they note that “a notable amount of gamma at each close was attributable to flow selling options expiring the next day,” meaning 1-day options are doing a lot of the heavy lifting in keeping gamma supported.
Currently they model spot in a small valley and it builds on any declines to ~7,500 as well as rallies to ~7,800 soit should dampen volatility next week as it did this past week (when the SPX closed -0.27% for the week.It doesn’t turn into an accelerant outside of a sharp move over 3% in either direction.
*gamma plays an important if nebulous role in market volatility —positive gamma means options market makers will buy/sell in the opposite direction of moves in price dampening volatility, while negative gamma means the inverse and market makers accelerate rallies/sell-offs adding to volatility.
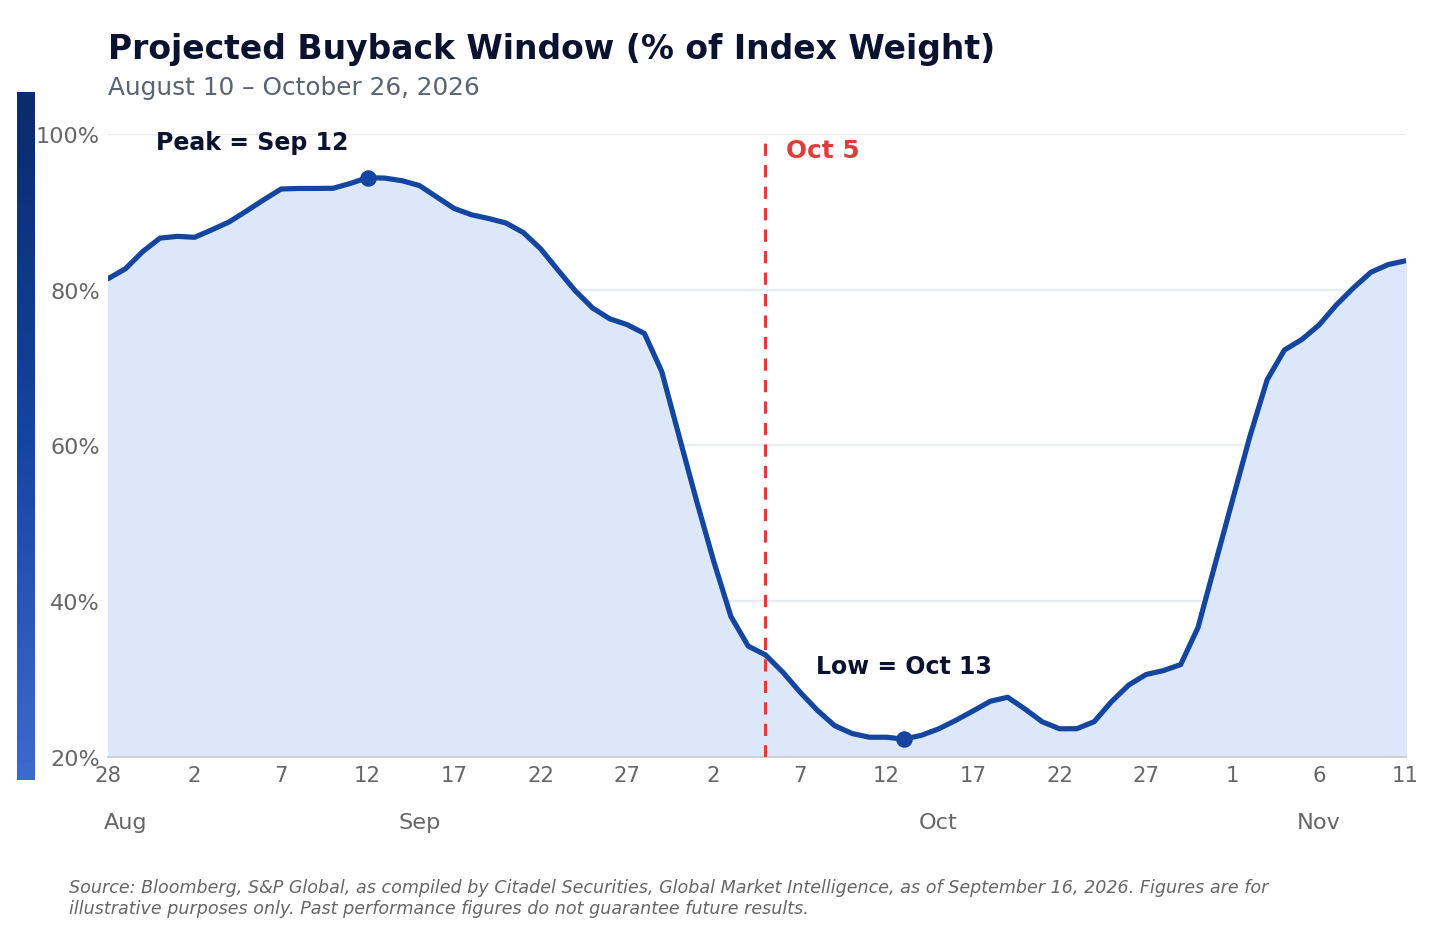
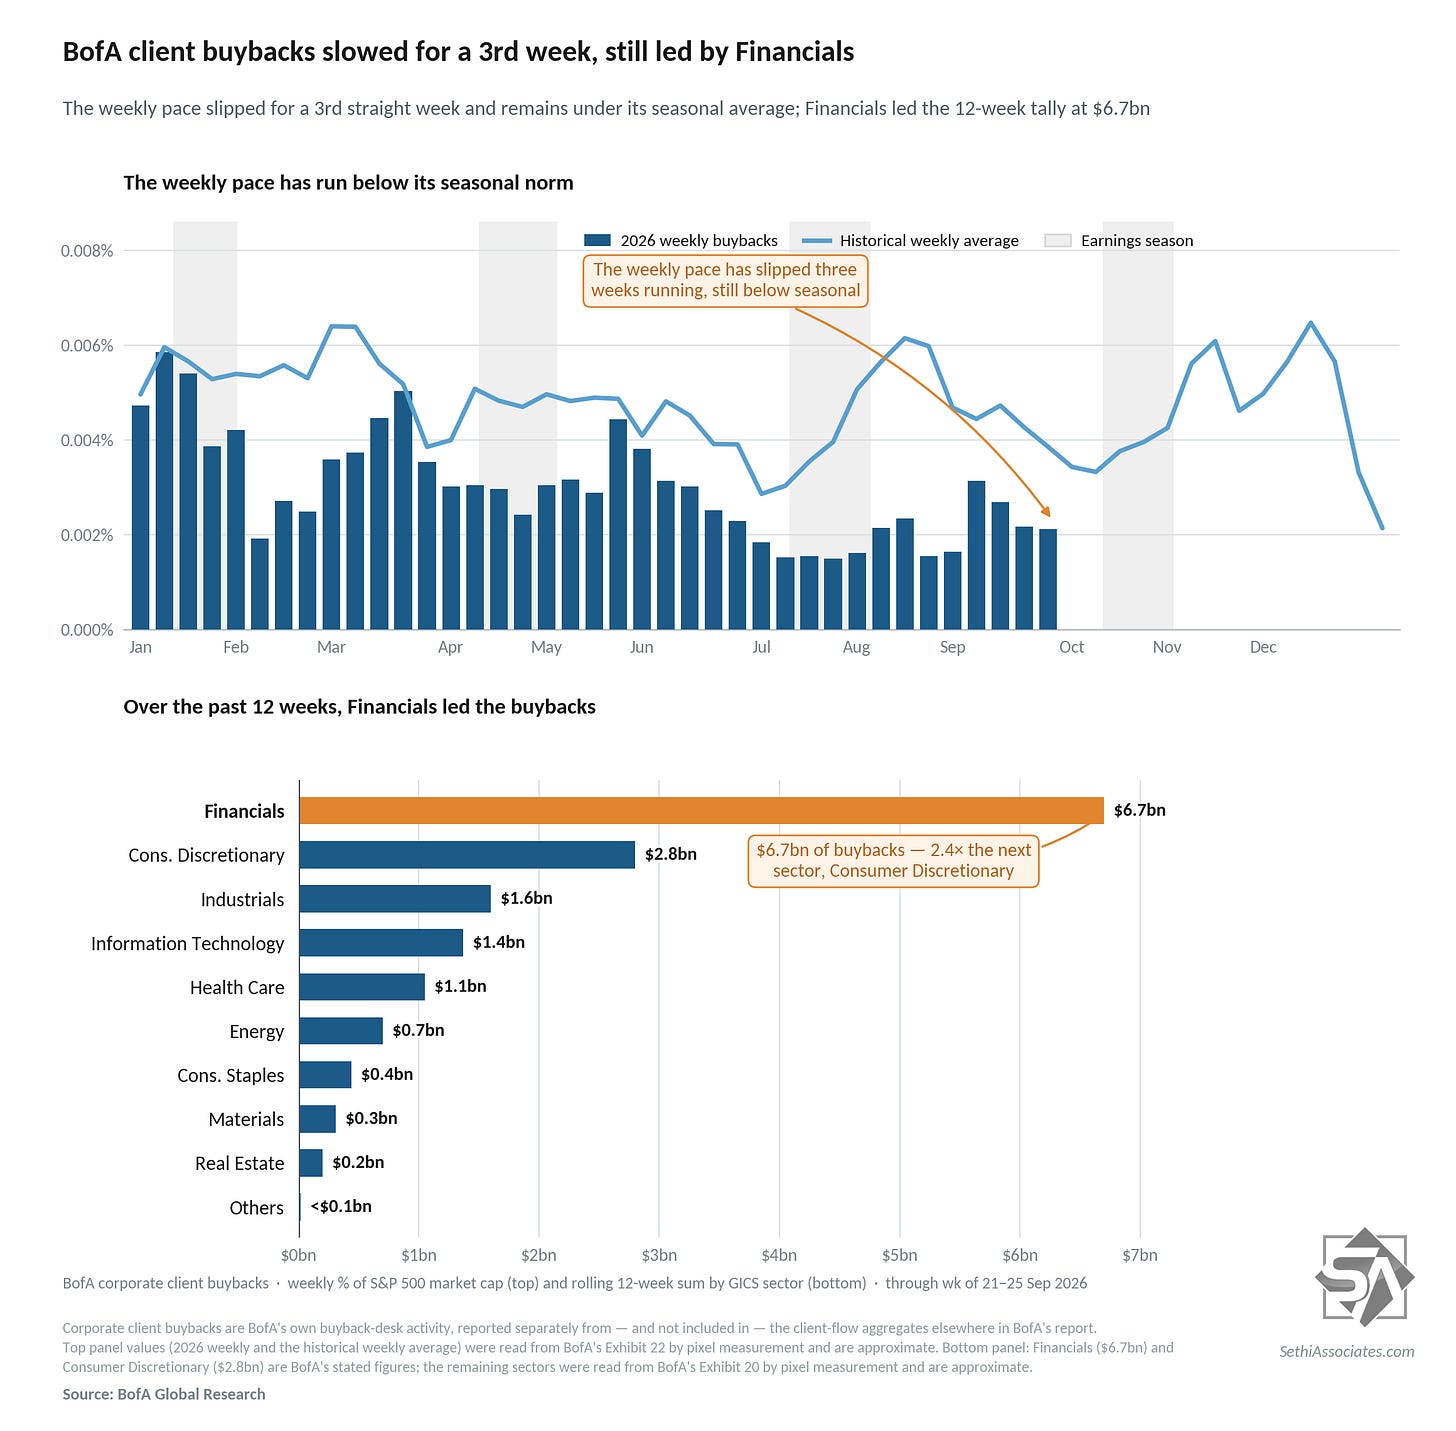
Turning to corporate buybacks (an important source of underlying demand), we are now deeply into the buyback blackout period with just around a third of discretionary buybacks by index weight for S&P 500 companies active this week on average (discretionary buybacks represent ~30% of all buybacks), and it won’t get back above that until we get into November.
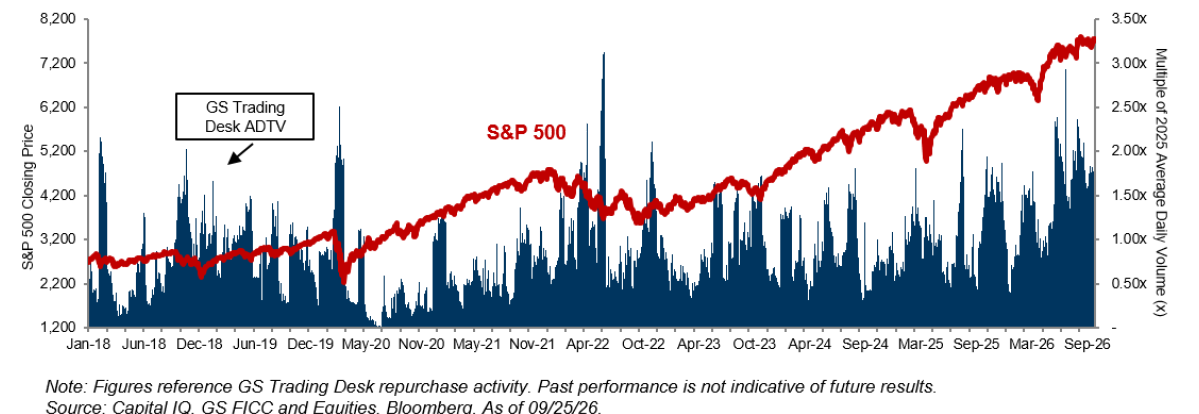
Goldman sees us more firmly into the blackout window at around 93% but also, unlike BofA, saw buybacks the week before last remaining above year-ago levels:
Desk Flows and Trading Activity: Our trading flows last week held a steady pace again. Overall volumes finished at 1.5x versus 2025 year-to-date ADTV and 1.3x versus 2024 year-to-date ADTV, with flows primarily clustered in Tech, Financials, and Health Care.
Blackout Metrics and Execution Mix: In line with this seasonal transition, corporate activity on our desk continues to shift toward more structured plans, marked by a ramp-up in 10b5-1 programs. In our weekly execution mix, we see 82% in 10b5-1 plans versus 18% in OMR plans, shifting from 79% and 21%, respectively, in the prior week.
Outlook: Looking ahead, these blackout parameters will begin to lift sequentially once October reporting kicks off. We still anticipate Financials to be the first sector to enter the open window, given their timing in the earnings-reporting cycle.
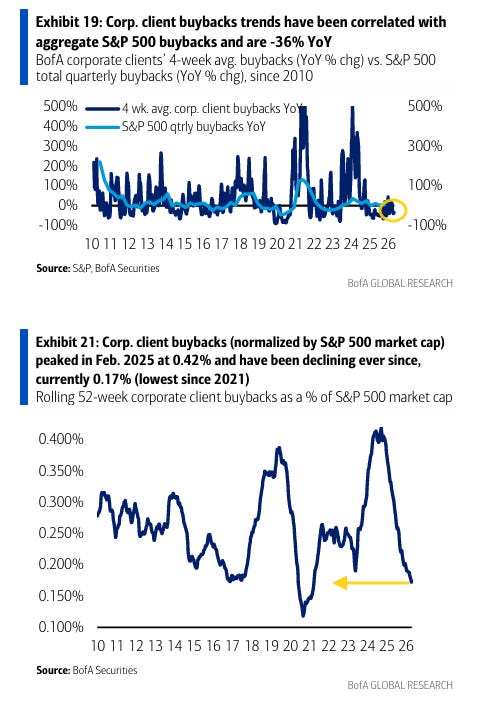
BofA in contrast said “buybacks slowed for a 3rd week”. They remain well under the historic average normalized by market cap and on a 4-week average basis they are to -36% y/y from +5% six weeks ago.
They say annualized cumulative buybacks YTD are tracking ~25% below 2025 levels and more than 40% below 2024 levels, though above 2010-23 annual levels. “Rolling 52-wk buybacks as a % of S&P 500 market cap are currently the lowest since Aug. 2021.”
Sentiment Is Mixed
Sentiment (which I treat separately from positioning) is one of those things that is generally positive for equities when it’s above average but not extreme (“it takes bulls to have a bull market”, etc.), although it can stay at extreme levels for longer than people think, so really it’s most helpful when it’s at extreme lows (“washed out”).
Currently we remain somewhere in the middle:
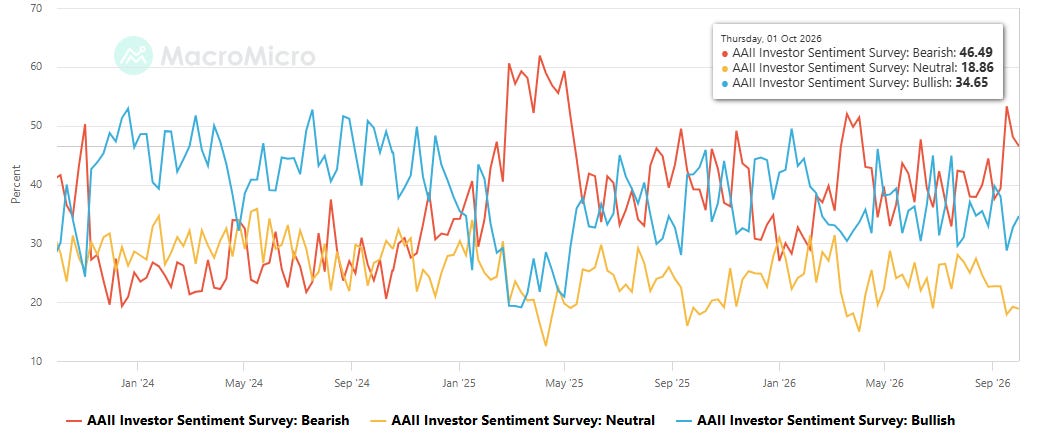
American Association of Individual Investors (AAII) saw bears ease further back from the highest since May 2025 hit two weeks ago while bulls edged further off the least since last September:
AAII bulls (those who see higher stock prices in 6 mths, blue line) rose to 34.7% from 32.7% the prior week and 28.8% the week before that which was the least since September 2025 remaining though below the long-term historic average of 37.5%.
Bulls also remained under the level of the bears (who see lower stock prices in 6 mths, red line) even as the bears eased for a second week to 46.5% from 48.1% and 53.3% (the highest since May 2025). That is the 10th week in 11 (and 25th in 31) Bulls have been below the Bears. Bears also remain above the long-term average of 31.0% for a 33rd straight week (and they’ve only been below it 9 weeks since Dec 12, 2024).
The Neutral camp (yellow line) was little changed at 18.9% from 19.2%. It remains under the long-run average of 31.5% and has been over that only twice since July 2024.
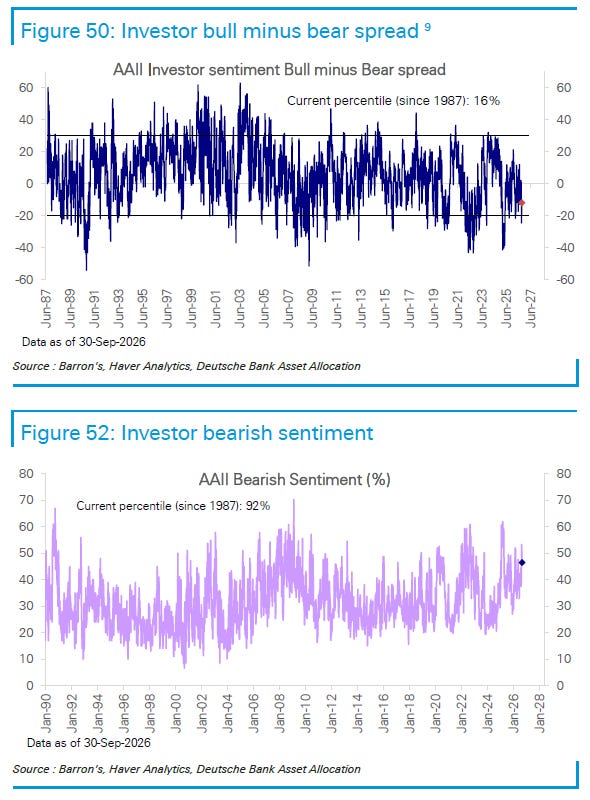
DB notes the bull-bear spread still is at just the 16th percentile to 1987 with bearish sentiment at the 92nd percentile.
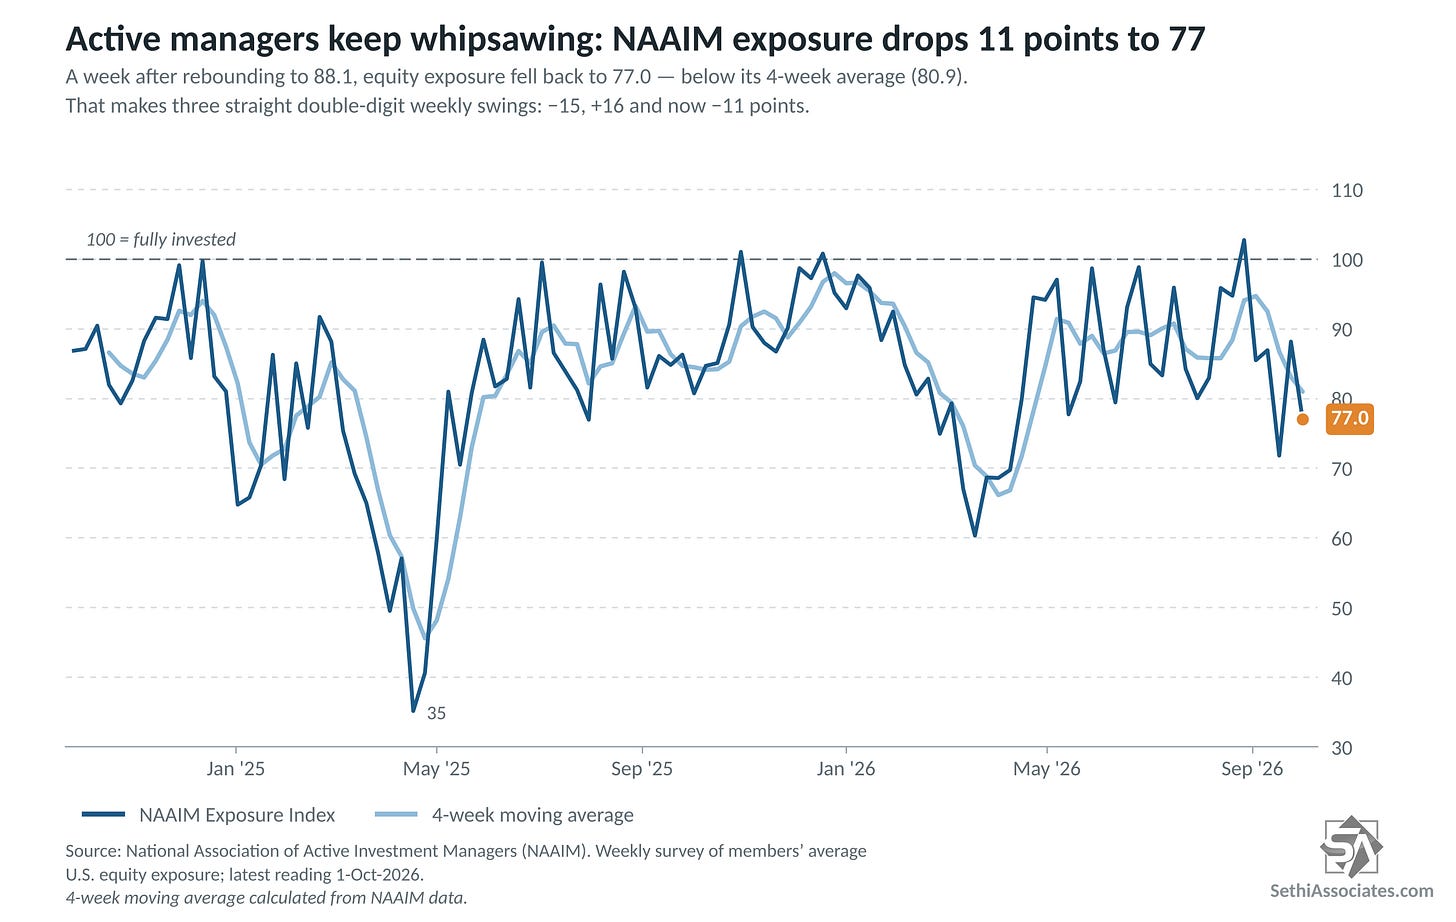
NAAIM’s survey of investment professionals* fell back to 77.0 from 88.1 the prior week, remaining though above the71.9 two weeks agowhich was the least since April 14th. It remains well below the 102.66 at the end of August (meaning they were on margin) which was the highest since July of 2024.
*The index according to NAAIM “represents the average exposure to US Equity markets reported by our members” and which ranges from -200% (2x short) to +200% (2x long).
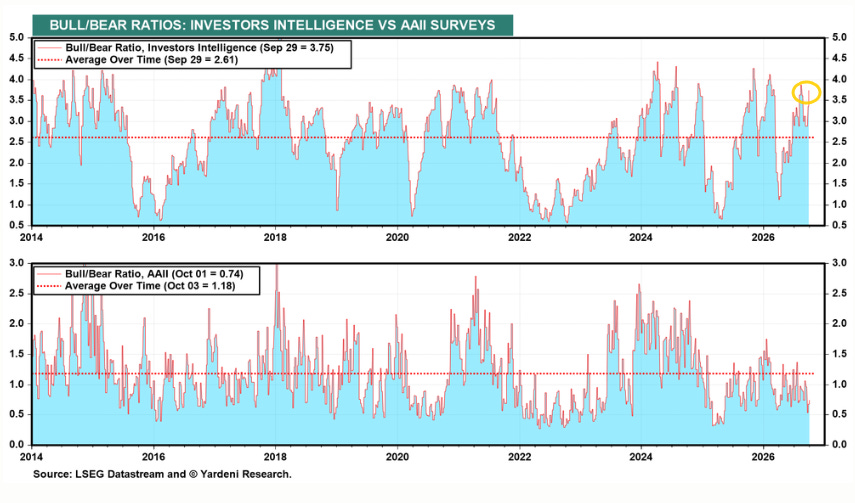
While the Investors Intelligence (independent investment-newsletter writers) survey saw the bull/bear ratio jump for a second week now up to 3.75 from 2.88 two weeks ago pushing further above its average since 2008. Ed Yardeni says “Newsletter writers are too bullish. Individual investors are too bearish.”
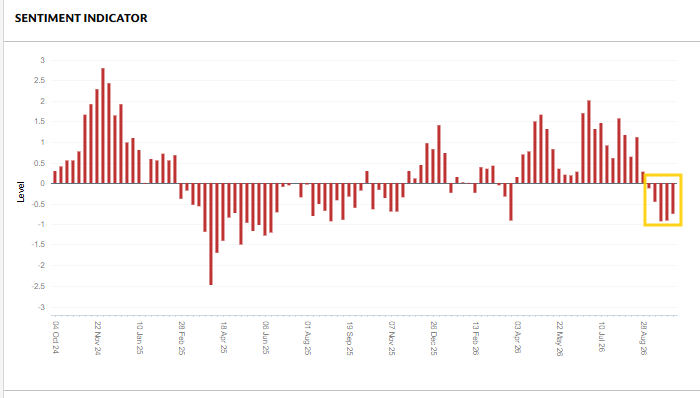
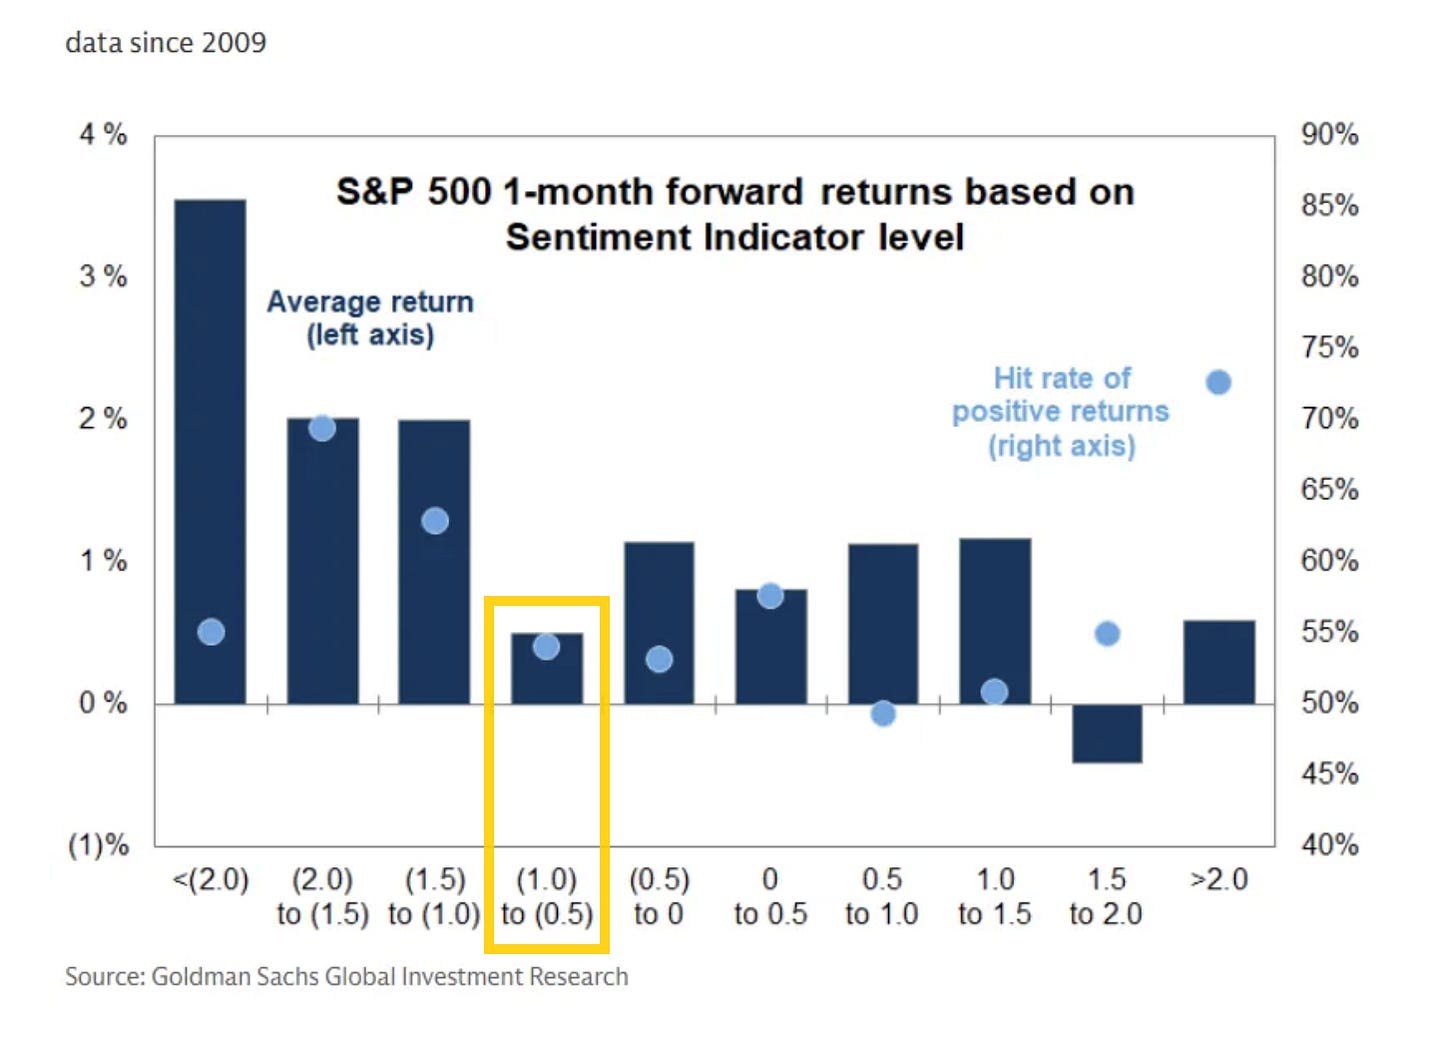
And Goldman’s US Equity Sentiment Indicator*, remained negative for a fourth week (-0.74 easing back from -0.92 two weeks ago which was the lowest since August 2025), the longest stretch since last November.
The current reading remains in the second worst bucket consistent with a 1-month average return of around 0.3% since 2009 with a positive rate around 53%.
*The indicator combines “six weekly and three monthly indicators that span [across the more than 80% of the US equity market that is owned by institutional, retail and foreign investors]. Readings of +1.0 or higher have historically signaled stretched equity positioning. Readings of -1.0 or lower have signaled very light positioning and have historically been a statistically significant signal for subsequent S&P 500 performance”.
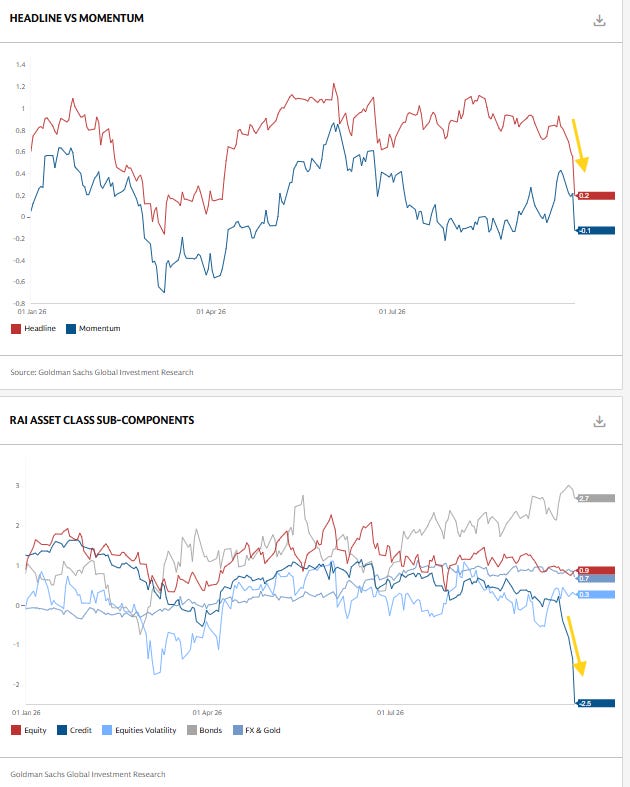
And Goldman’s Risk Appetite Indicator* fell sharply to 0.2 from 0.8 the prior week, while the momentum index fell to -0.1 from 0.4 mostly on the back of an abrupt decline in their credit component.
*”Goldman Sachs Risk Appetite Indicator (RAI) aims to track the level of global market risk appetite and risk aversion based on various market variables. A sharp rise in the index can send a warning signal that investors have more risk appetite and are potentially exposed to a correction if consensus views are tested. Similarly, a sharp decline indicates a reduction in risk appetite, and at extreme levels it can indicate that markets may have overshot. RAI signals are most powerful when the level of risk appetite is very low below -1.5, with levels closer to -2.0 giving the clearest signal over longer time horizons, as at such levels the asymmetry of subsequent medium term equity return becomes very positively skewed. RAI momentum is designed to track short term shifts of market risk appetite, and subcomponents of the RAI.”
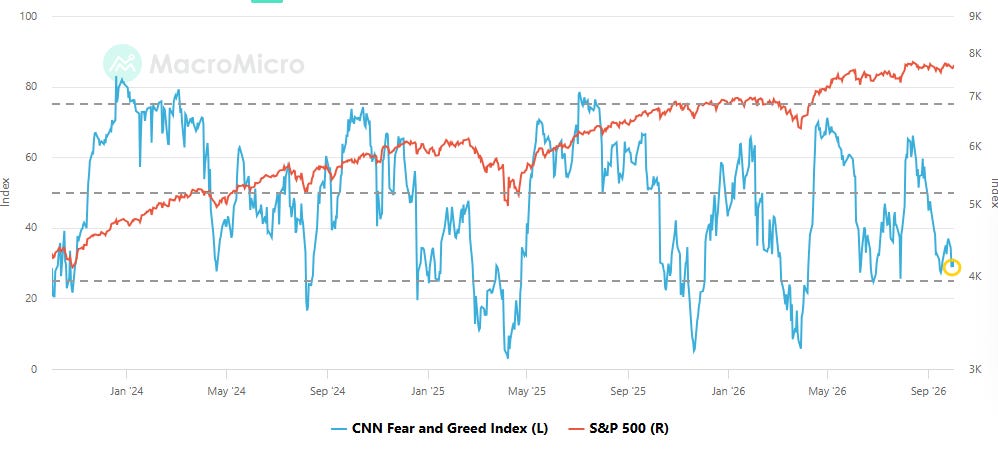
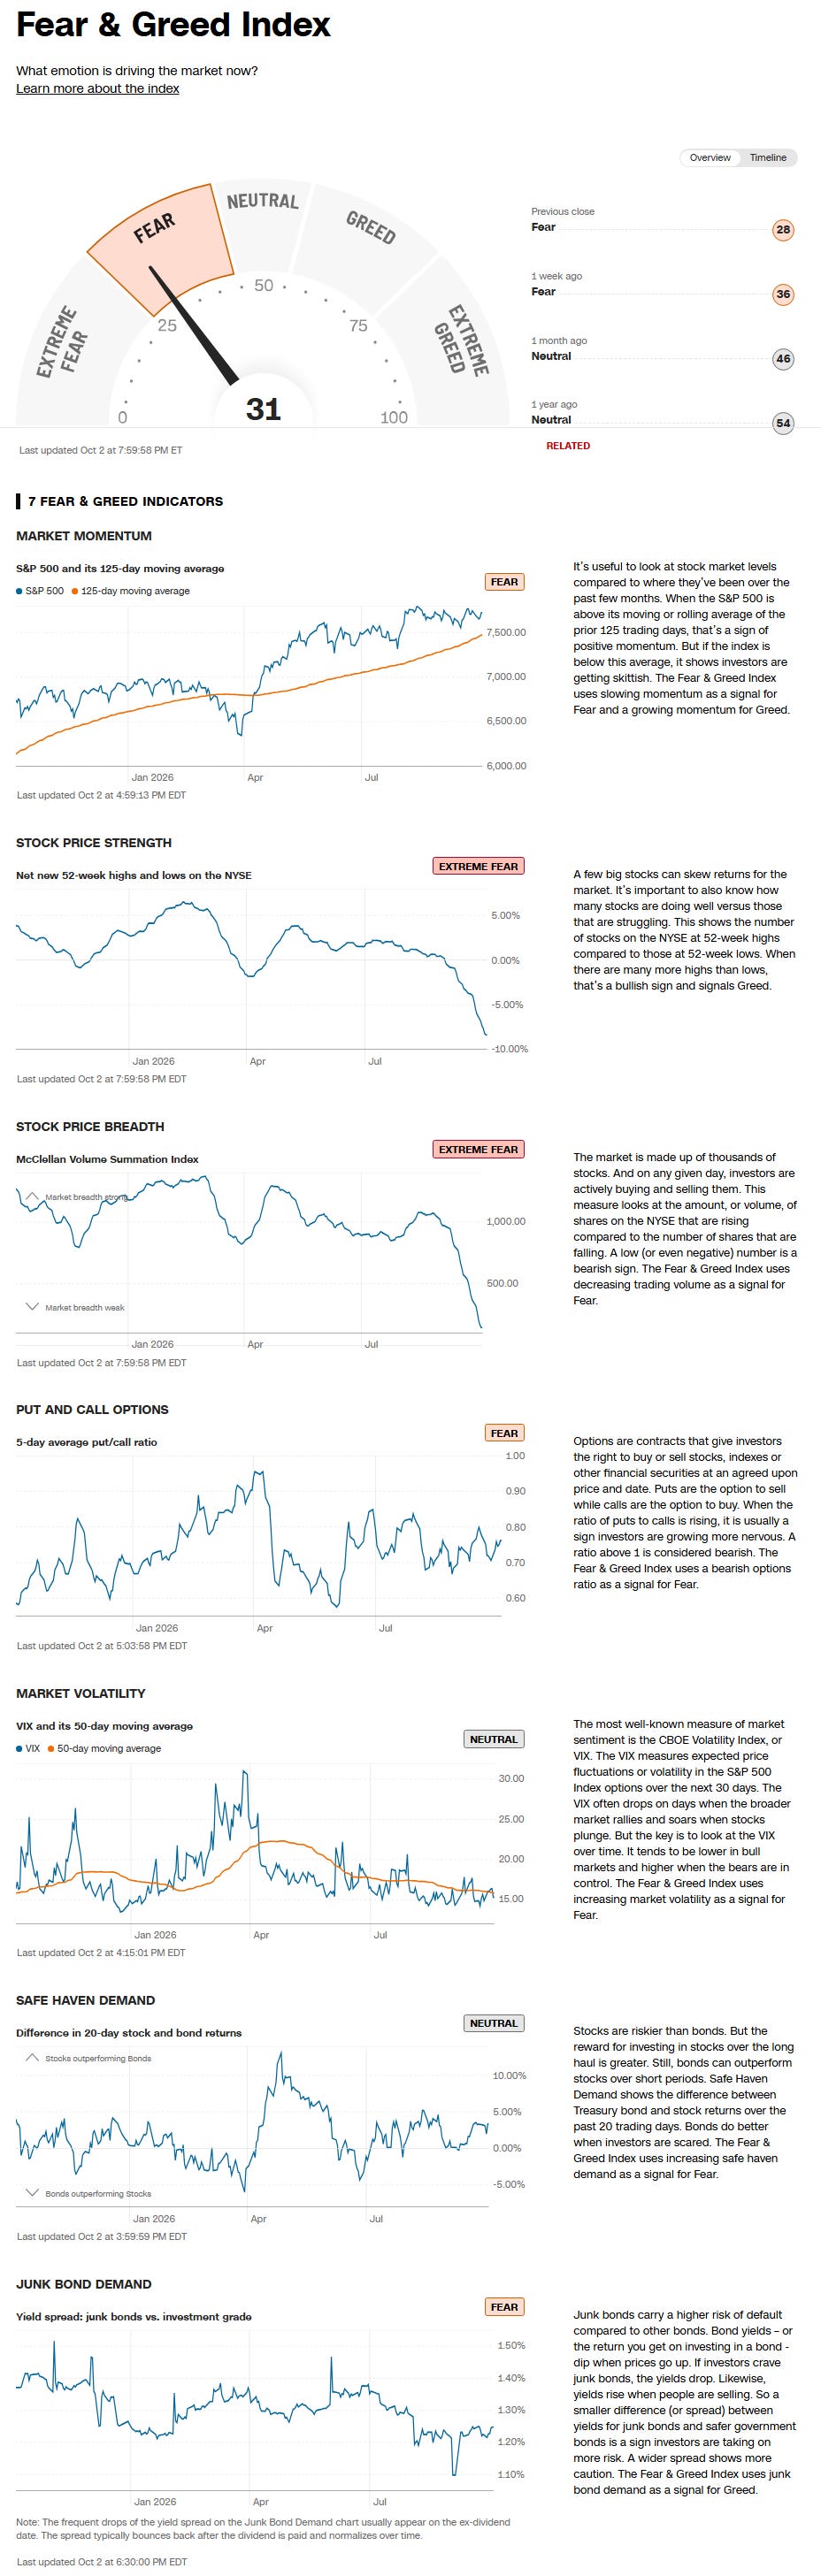
The CNN Fear & Greed Index (blue line) fell back to 31.7 from 37.0 the prior week, just above the local low of 28.0 September 16th, remaining in “Fear”.
Now no indicators above Neutral (from two) and five below (from three).
Extreme Greed = None
Greed = None
Neutral = market volatility (VIX & its 50-DMA); safe haven demand (20-day difference in stock/bond returns)
Fear = market momentum (SPX vs 125-DMA); put/call options (5-day put/call ratio) (from Greed); junk bond demand (vs investment grade) (from Greed)
Extreme Fear = stock price strength (net new 52-week highs); stock price breadth (McClellan Volume Summation Index)
And I noted in previous weeks if you have any questions on the indicator, TheStreet Pro’s own Jason Meshnick is your guy, as he helped create it.
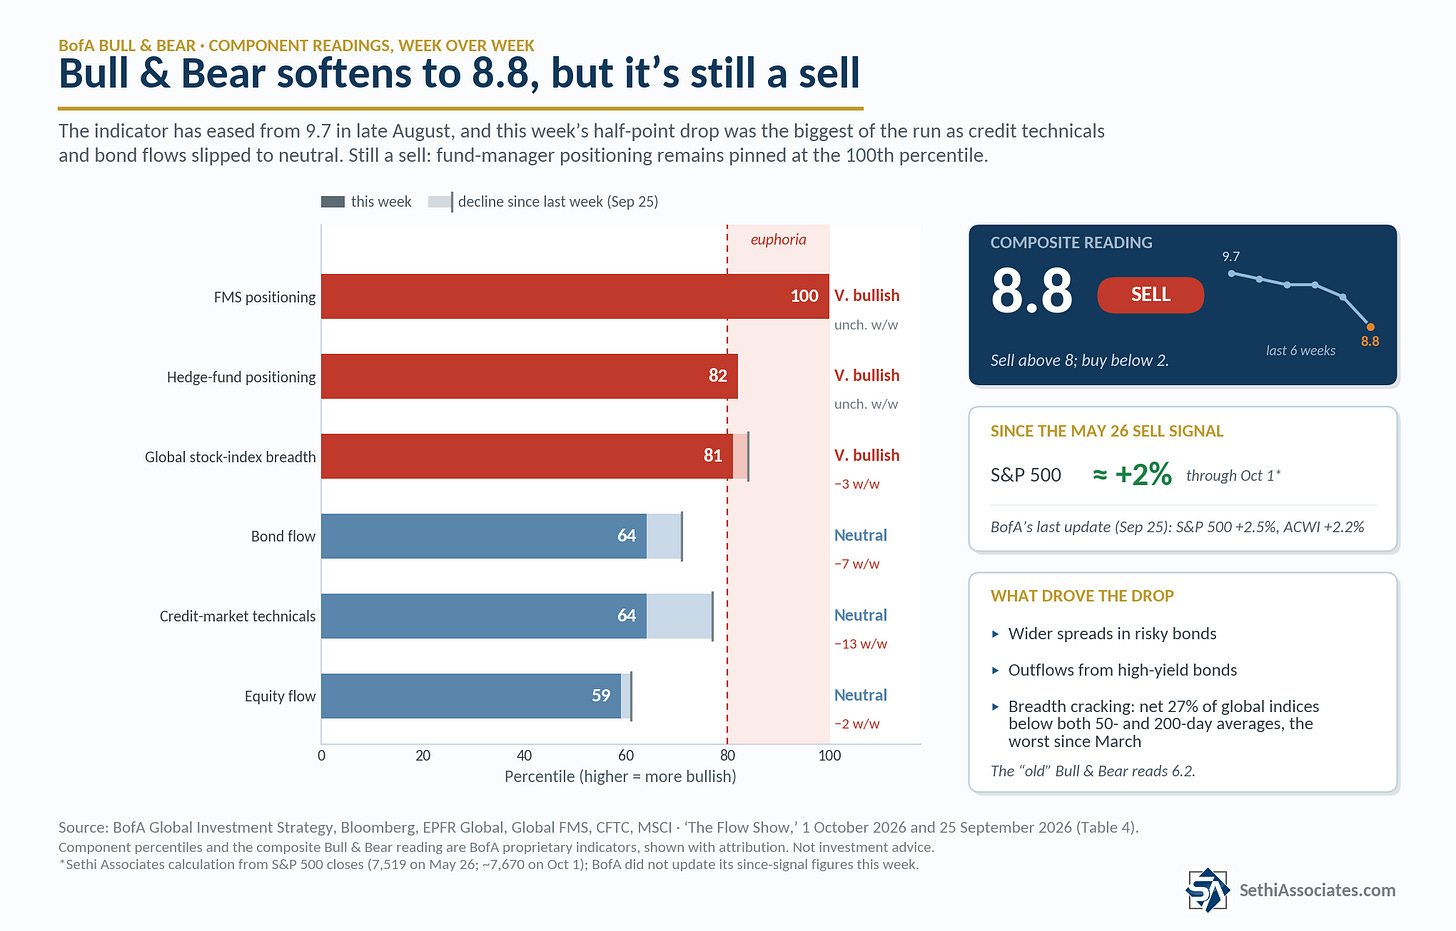
And BofA’s Bull & Bear Indicator eased back five tenths to 8.8, now nine tenths from the joint highest since 2021 hit a few weeks ago, but remaining above its sell signal (8.0) which it crossed back above the week of May 26th (since then the SPX is +2%):
down to 8.8 from 9.3 driven by wider spreads in risky bonds, HY bond outflows, rapidly deteriorating global stock index breadth (net 27% of global equity market indices trading below both 50d & 200dma – worst since Mar’26); “old” Bull & Bear Indicator at 6.2.
[From prior weeks]:
BofA Bull & Bear “sell signal” remains in place,extreme bull positioning says markets “toppy”, reduce equity exposure, retreat or rotate much smarter summer tactic for risk assets than reload.
17 “sell signals” since ‘02, average loss for global stocks over 2-3 months is 2-3% (hit ratio of ~60%), with max drawdowns of 15-20%(caveats always “tops are a process, lows are a moment”, i.e. greed harder to reverse than fear).
Tracking October
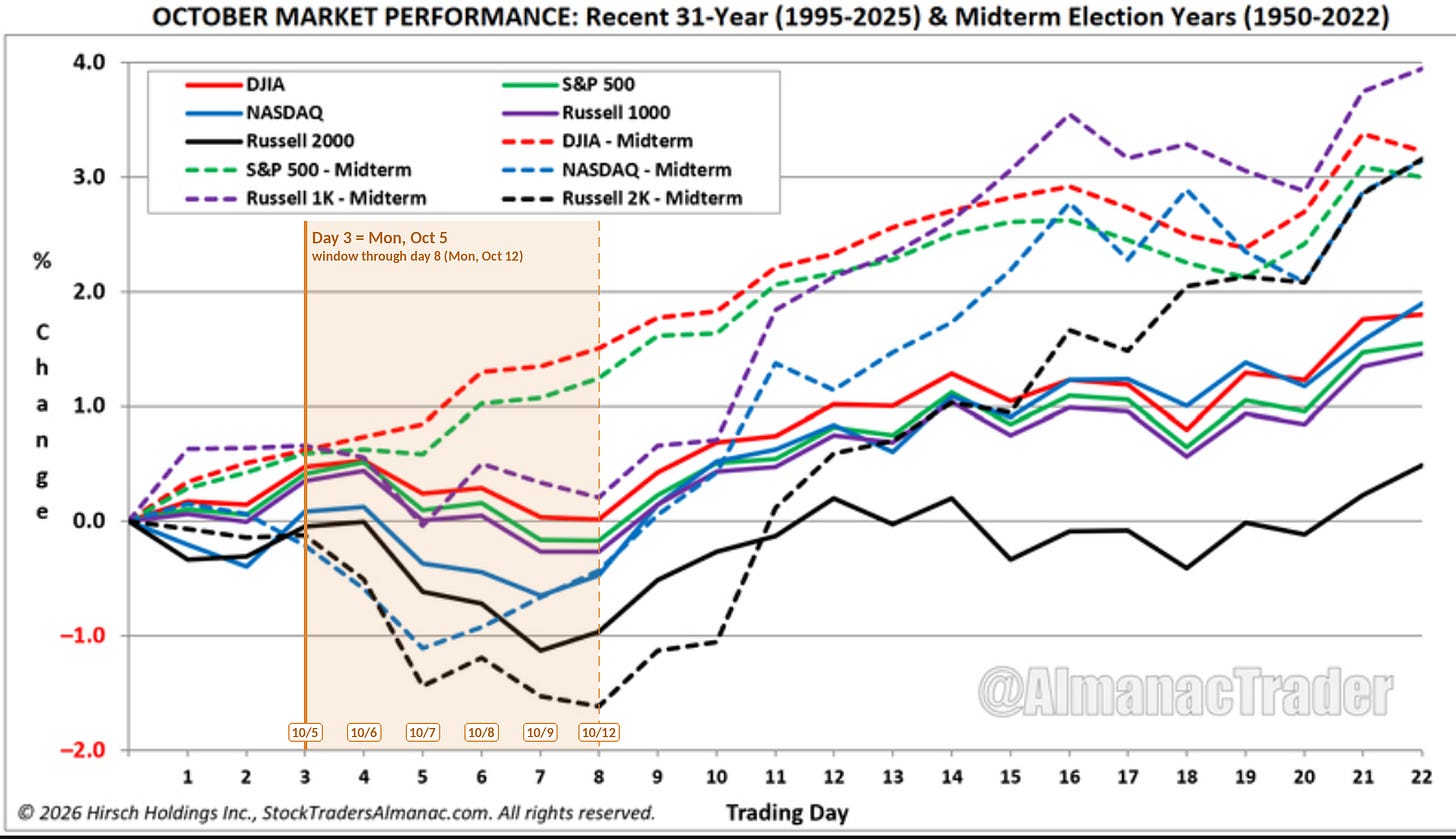
Looking at the seasonality breakdown from Jeff Hirsch, editor of the Stock Trader’s Almanac & Almanac Investor Newsletter, next week is mixed.
Monday is trading day 3. Over the past 31 years the week has been on average modestly weak. From the day-4 high, the S&P has given back about 0.7% and the Russell 2000 about 1.1% by day 7–8. That average carries an asterisk, though. The S&P fell roughly 18% over these same trading days in 2008, which by itself accounts for close to the entire decline in a 31-year average, so this is better described as a soft week than a reliably weak one.
In midterm years the indices split. The Dow and S&P have climbed about 1% through day 8, while the Nasdaq, Russell 1000 and Russell 2000 have fallen, the Russell 2000 by about 1.5%. Since the Russell 1000 is nearly the same index as the S&P, the gap reflects which years are averaged rather than any index difference. The Dow and S&P data go back to 1950, while the Russells only start with the 1982 midterm.
The post-1980 midterms are the weak ones, with October lows in 1998, 2002, 2022, and 2018’s sharp selloff all landing on trading days 6–8, and 1990’s low coming a day later, so for 2026 they’re probably the better guide, and that’s one for the bears this week, particularly in small caps.
From there, though, seasonality turns decidedly positive. Every index has turned higher by days 8–11, and in midterm years the Russell 2000 has gone from the laggard to a leader, gaining nearly 5% from its day-8 low through month-end.
Wrap-Up – Can Non-Tech Join the Rally (Part II)?
I said last week
I…continue to see many reasons to be bullish, particularly as we get into October and start what, by all accounts, should be another strong earnings season (although I’m less bullish on this quarter than I was last quarter as I’ll discuss in future weeks). The economy is strong, valuations are not demanding, many breadth and sentiment figures are at levels we’ve seen bounces in the past, there is a lot of dry powder on the discretionary side….
These are the ingredients of a bull market. So while there are some short-term headwinds, the longer term picture remains bright, with the caveat that the political wildcard will come back in a bigger way post-midterms. But that’s something we’ll talk about a month from now.
So in the short term the answer to “Can Non-Tech Join the Rally?” looks to be dependent on a softening in the factors that have kept them out.
And with little softening in the factors that have kept them out, we didn’t get much broadening last week, although we did get some, so perhaps that continue. I’m a broken record on this, but at some point we’re going to see a pullback in yields that has the potential to see a substantial rally in the non-Tech names. Even yields stabilizing seems to have catalyzed a bounce at the end of the week. A more dovish Fed has been helpful, so hopefully the minutes don’t undercut that Wednesday.
Seasonality also turns much more bullish as we move through the month.
Tech meanwhile has continued to lead. I’m slightly concerned by DB’s commentary about Tech starting to hit levels that have seen it pull back in the past. As I’ve mentioned before, they’ve called the past year as good as anyone, so that will be something I’m keeping a close eye on. Micron finishing the week down despite a blow-out earnings report is another reason for caution.
We will for the next month also face the headwind of the loss of discretionary buyback support, and we continue to have a weak systematic setup with the potential for a sharp move lower in equity prices if a selloff does get going (all as discussed in the flows section).
Next week is light on catalysts (at least on the calendar), so it will be interesting to see how markets trade. For now the setup remains constructive for the reasons mentioned above, and gamma levels remain high which should dampen volatility. “So I’m starting the week eyeing higher levels — with, of course, a plan if indices go the other way.
At the time of publication, Sethi was long MSFT, NVDA, PSKY, , QQQ, SPY, RSP, IWM.
While it didn't get much coverage from Bloomberg (who conducted the interview), in addition to Jefferson's more widely covered speech, not to be overlooked is one of the more hawkish Fed members, Minneapolis Fed President Kashkari (a dissenter at the July #FOMC cwanting a rateShow more
The center has spoken. After NY Fed President Williams confirms there's no rush to push through an October rate hike, Vice-Chair Jefferson, another member of the center (along with Powell and probably still Cook, so over a third of the FOMC) who rarely comments on policy said in
NY Fed President Williams, part of the core center of the Fed, who helped catalyze the recent jump in expectations for two #FOMC hikes this year, which reached 60% as of Monday after saying last week “we still have a lot of work to do," a switch from his previously more dovishShow more
investingLive
@investingLive_
Fed's Williams: One more hike likely this year is likely enough
investinglive.com/central-banks/…
The center has spoken. After NY Fed President Williams confirms there's no rush to push through an October rate hike, Vice-Chair Jefferson, another member of the center (along with Powell and probably still Cook, so over a third of the FOMC) who rarely comments on policy said inShow more
investingLive
@investingLive_
Fed's Jefferson: Weighing more data will allow the Fed to make a better call on rates
investinglive.com/central-banks/…
You can add Chicago Fed President Goolsbee (2026 #FOMC voter) to the list of voters signaling an October pause is very much on the table saying in a Fox Business interview Friday that there "is plenty of room for anything to be on the table."
As a reminder Goolsbee was moreShow more
investingLive
@investingLive_
Fed’s Goolsbee: Labor market is steady, inflation side of Fed’s job is more important
investinglive.com/central-banks/…
Goldman pushes out their expectation for an October #FOMC hike to December:
Today's inflation report, especially the downward revisions resulting from the methodological changes, imply that core PCE inflation is likely to substantially undershoot the median FOMC participant's
Core Inflation Moderates While Real Spending Jumps
Core and headline PCE prices were cut back by the annual benchmark revision, while spending jumps even as real incomes turned negative, pulling the saving rate to the least since Nov 2022.
pro.thestreet.com/market-comment…
August goods trade deficit comes in much larger than expected with a jump in imports, led by a 4% rise in capital goods (easily the largest import category and containing much of the AI-related imports) and a 16.6% jump in industrial supplies (which is likely related toShow more