A look at the upcoming week for the U.S. economy and equities — covering key drivers including earnings, positioning, breadth, valuations, sentiment, seasonality, and the Fed.
TheStreet Pro is excited to welcome its newest contributor, Neil Sethi, formerly the author of the Substack Neil’s Newsletter. While Neil will officially start Labor Day weekend, we wanted to provide a preview with his final Substack post, which is a comprehensive look at the upcoming week for the U.S. economy and equities, covering key drivers including earnings, positioning, breadth, valuations, sentiment, seasonality, and the Fed.
The Week Ahead
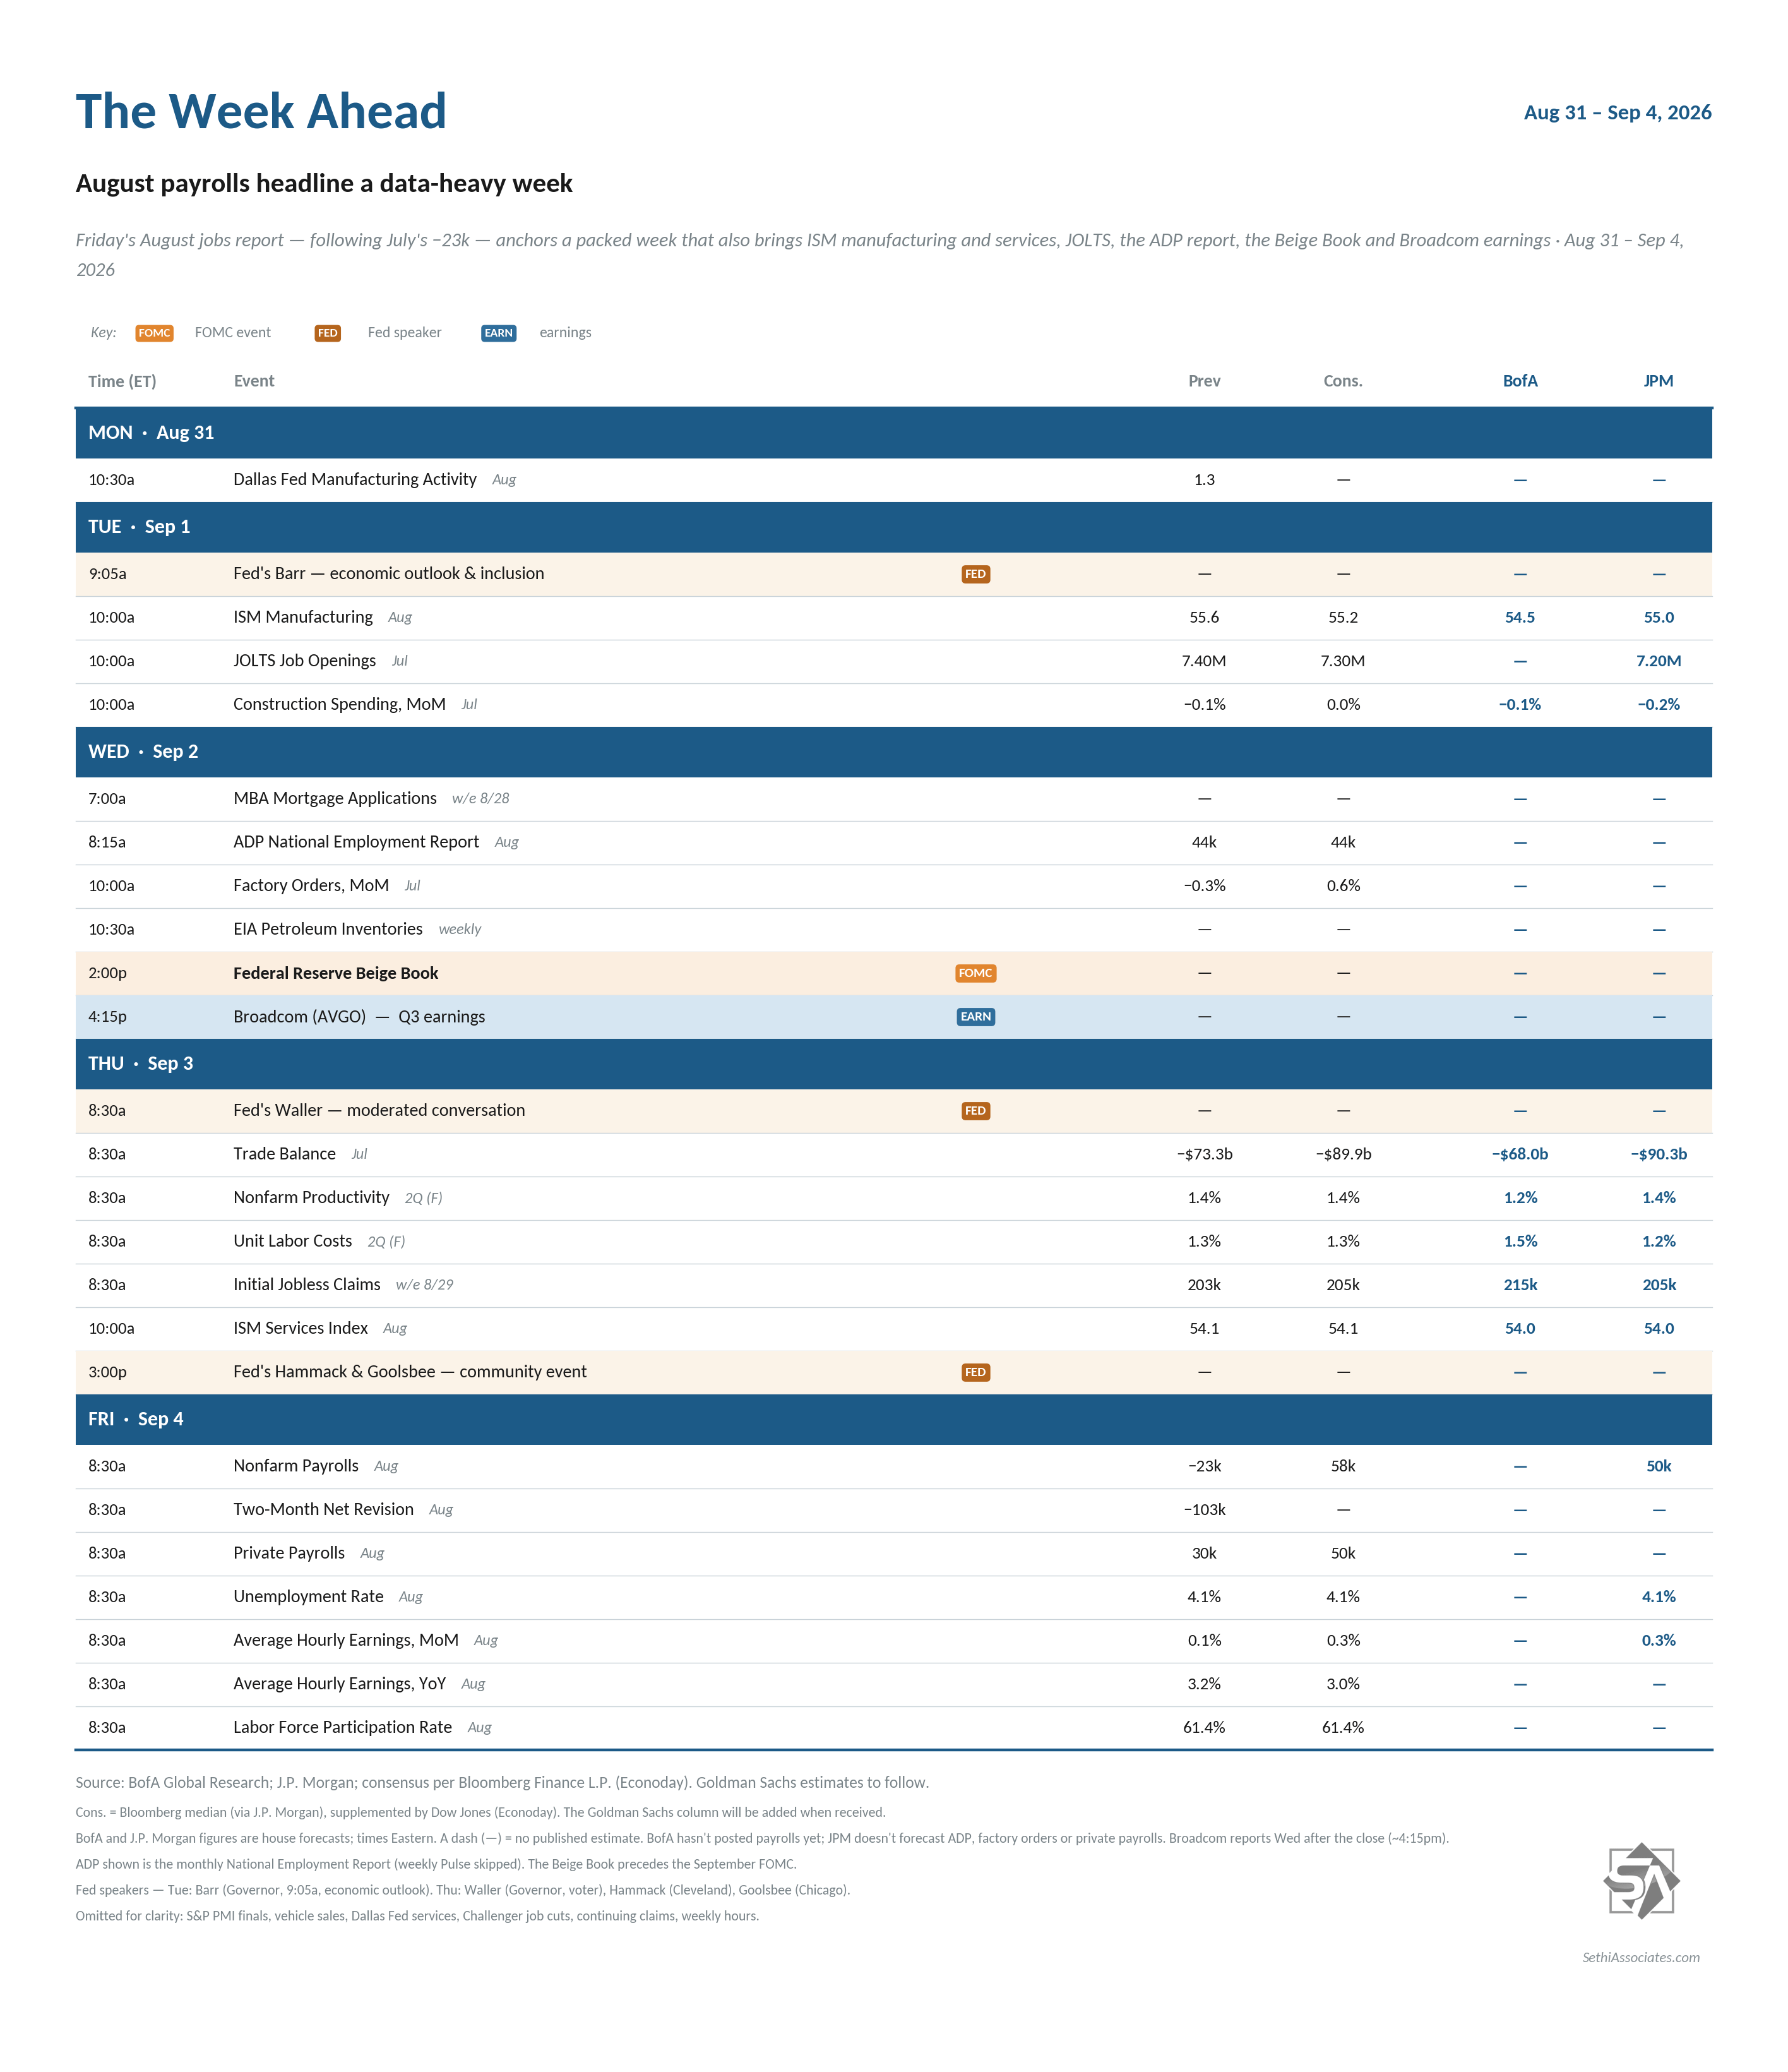
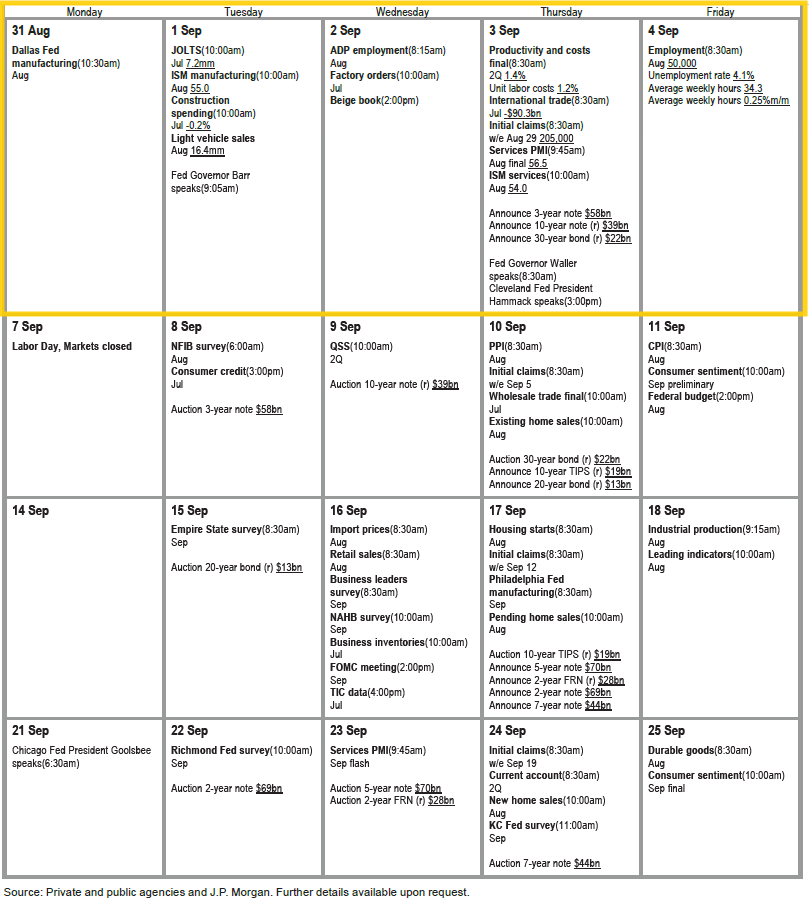
Unfortunately for traders wanting one last pre-Labor Day vacation, this week is not particularly conducive for that. Tuesday we start September and embark on a packed week culminating with the August Employment Situation report.
Before we get there, we’ll get August ADP monthly employment, Challenger job cuts, PMIs, and auto sales, July JOLTS, construction spending, and factory orders, as well as the standard weekly reports, including jobless claims, mortgage applications, and US petroleum inventories, although not the weekly ADP pulse given the monthly ADP report.
In terms of Fed speakers, the highlight will be Governor Waller on Thursday. Waller has been a leading voice at the Fed, so I’ll definitely want to hear what he has to say. We get another Governor though in Barr on Tuesday. Barr has been hawkish of late, so I would expect something not too dissimilar to what we heard from Warsh last week. We’ll also hear (again) from regional Fed presidents Hammack and Goolsbee. Finally, we’ll get the Beige Book of regional economic conditions for the September meeting Wednesday.
In terms of non-Bill (>1yr in maturity) USTreasury auctions, we’re off next week.
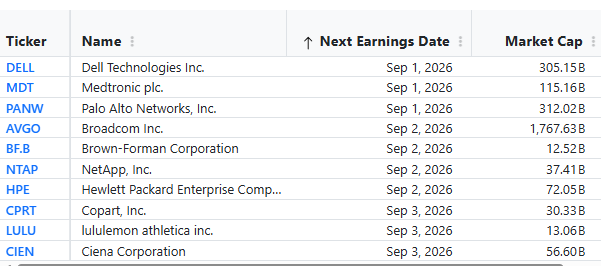
In terms of earnings, we continue to wrap up Q2 earnings season with 10 SPX components reporting including the last of our top 20 in market cap with Broadcom (AVGO) on Wednesday. But there are three other components >$100B in market cap in DELL, MDT, and PANW.
Central bank highlights include monetary policy decisions from the Bank of Canada and the Reserve Bank of New Zealand on Wednesday. G20 finance ministers and central bank governors also will meet in Asheville, North Carolina, running from August 31 to September 1.
Moving on to the European economic calendar, the focus will remain on the flash August CPIs in the Eurozone. The numbers for Germany will be out on Monday, with Italy and the Eurozone following on Tuesday. Inflation is also due in Switzerland on Thursday, with the Q2 GDP report out on the same day. Other notable releases include July retail sales on Tuesday and factory orders on Friday in Germany as well as final PMIs.
Over in Asia, both official PMIs on Monday and private PMIs will be out for China next week. In Japan, July retail sales and industrial production are due Monday. Our Chief Japan economist expects industrial production to rise by +0.1% MoM. Other Japanese releases include the Q2 Ministry of Finance survey and August consumer confidence on Tuesday.
And here are links to Christophe Barraud’s nice Week Ahead quick rundown of global events followed by Bloomberg’s with commentary.
Looking first at the economy, my intro has remained the same since the start of the Iran conflict: “we continue to see it weathering the various storms remarkably well due in large part to continued resilient consumption (fueled by huge increases in wealth over the past few years despite slowing incomes) and AI-spending… with data of late showing a stable (and perhaps accelerating) economy, but one that is also boosting inflation.”
As noted previously, while in June that “perhaps accelerating economy” parenthetical did a lot of work, things tailed off in July, and I noted two weeks ago “as we start August, the data has been mixed,” but the last two weeks things seemed to rebound somewhat outside of the housing sector (which saw another weak report in new home sales), and that continued into this week although consumer confidence edged back.
Most importantly, theJuly personal income and spending report(our most complete look at those critical aspects of the economy) saw incomes come in double expectations which drove the savings rate off 4-year lows. Spending came in as expected, which was a relatively soft reading (no growth from June when adjusted for inflation), but, as we saw with theJuly retail sales report, there were clear impacts on goods spending from the Prime Day move from July to June, so overall a better than expected report.
And while it gets little attention the Chicago Fed National Activity Index (CFNAI) gives a good distillation of a lot of inputs (85) from several different areas across the US economy and has an ~80% correlation with GDP. That eased to just under trend growth with the diffusion index (breadth of indicators) just off the strongest since 2022.
So no reason to change my outlook at this point. The economy was pretty strong in the first half, so some giveback in July is, if anything, a yellow light at this point and more what we should have expected. We’ll need at least another month of similar data before I even start to raise my recession concern levels.
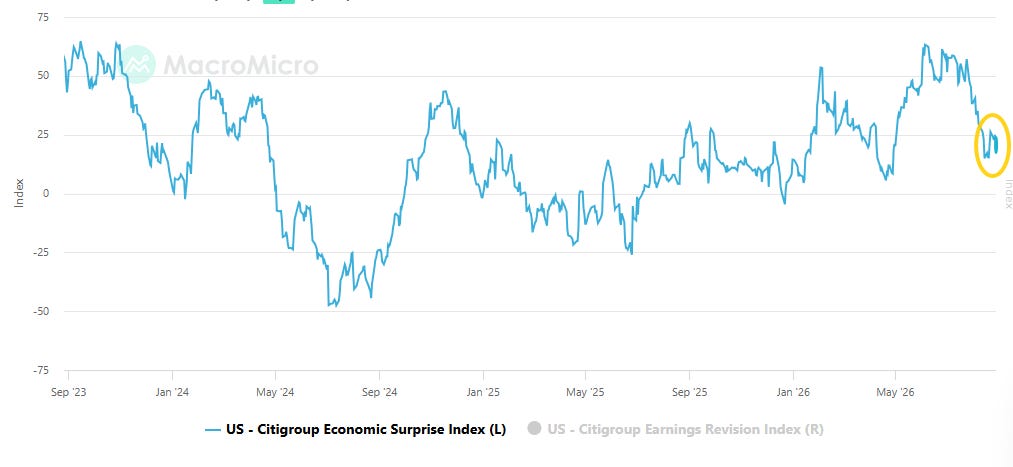
But between the weak housing and consumer confidence data (as well as a much larger than expected trade deficit (although with some apparent distortions from crude exports and AI-imports (we’ll find out more next week)), the Citi economic surprise index fell back to 21.2 from 26.1, although still above the 15.1 two weeks ago, the least since the start of May, but also well below the 57.1 a month ago (July 24th).
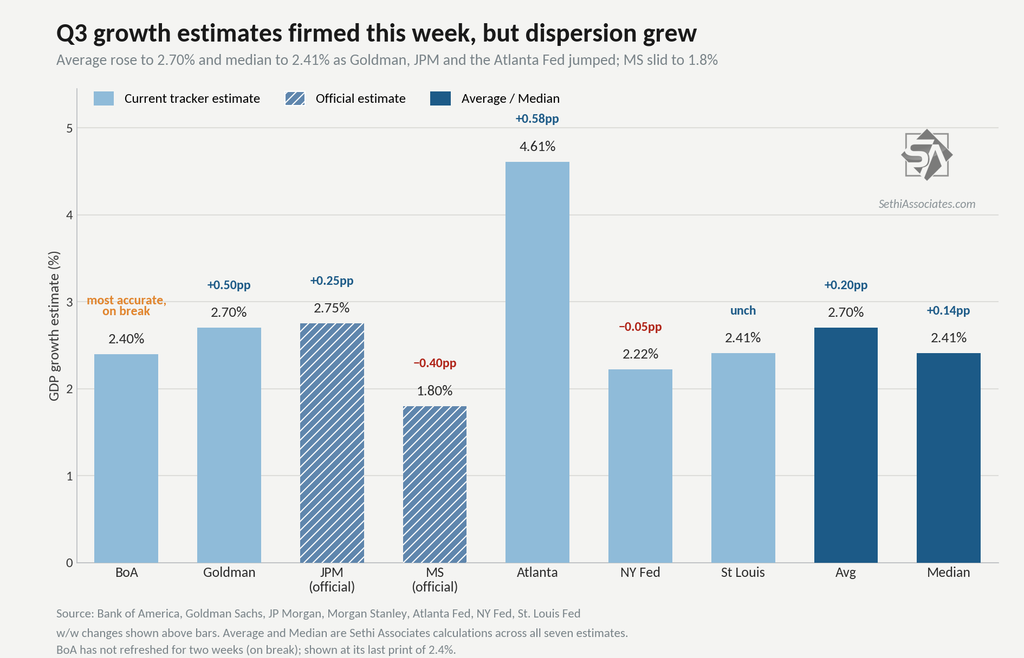
Meanwhile GDP estimates were mixed last week (with the top-to-bottom dispersion growing) but remain consistent with a solid economy (remembering GDP going into recessions generally doesn’t look like one is coming (it was up around 2% in Q2 & Q3 2008 well after the recession had started)).
BoA (who has been the most accurate over the past year) did not refresh theirs (they have been on break for two weeks) +2.4%. Goldman +2.7% (from +2.2%) JPM +2.75% (+2.5%) Morgan Stanley +1.8% (from +2.2%) Atlanta Fed +4.61% (from +4.03% remembering they have been very high to start the last two quarters as well) NY Fed +2.22% (+2.27% ) St Louis Fed +2.41 (+2.41%) Avg = +2.70% (from +2.50%) Median = +2.41% (from +2.27%)
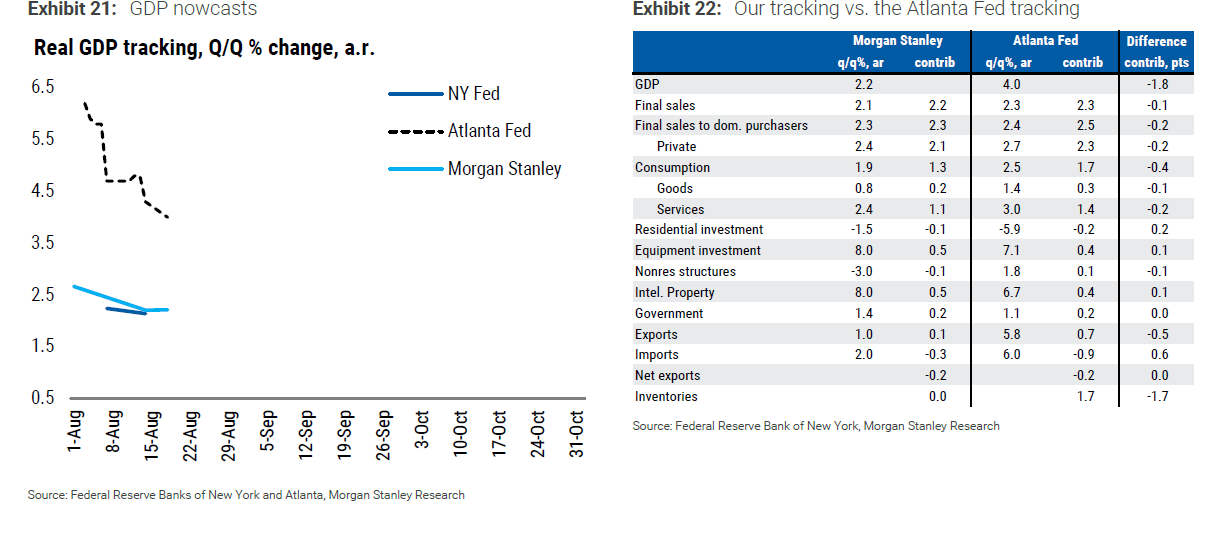
And on that dispersion the lowest (Morgan Stanley) again updated on the difference between their estimate and the Atlanta Fed (the highest):
We trimmed our GDP tracking estimate by 0.4 percentage point to 1.8%. July trade data indicated much faster real import growth, only partially offset by faster inventory accumulation. New home sales were also weaker than our underlying estimates.
The Atlanta Fed’s GDP tracking estimate is much stronger than ours, but its latest update preceded the August 27 report showing a wider trade gap. The Atlanta Fed also expects much stronger consumer-spending growth than we do.
And here was JPM (Feroli) on their increase:
This week’s economic reports were generally upbeat, prompting us to raise our third-quarter GDP tracking estimate from 2.50% to 2.75%. That moves the forecast closer to the 3% pace suggested by the July PMI, which had continued to strengthen earlier this month.
We increased our consumer-spending forecast by 1 percentage point to 2.75% and expect equipment investment to rise by more than 10% again. That should produce another solid quarter for private domestic final demand.
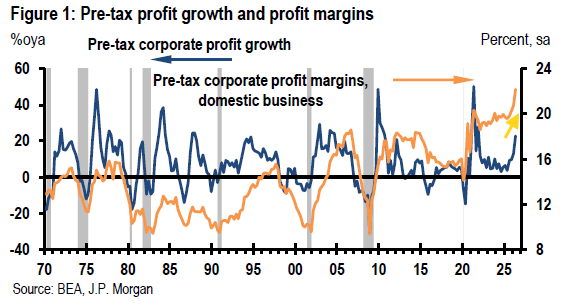
Corporate profit growth was robust, which bodes well for future job growth. Combined with the low level of jobless claims, this raises the possibility that unemployment could fall below the 4.0% level we forecast for next year.
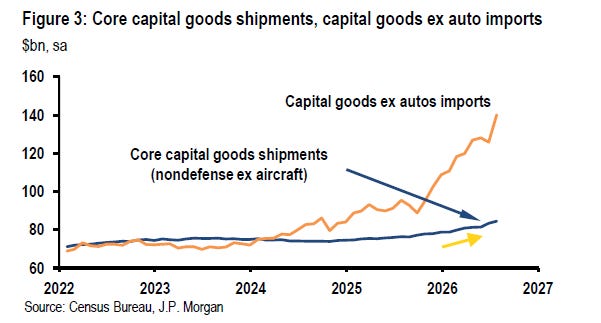
Core capital-goods order growth moderated in July, but this followed significant gains in prior months, while shipments continued to strengthen. Technology investment mostly appears in net trade, where the signal was also positive: the capital-goods deficit widened considerably.
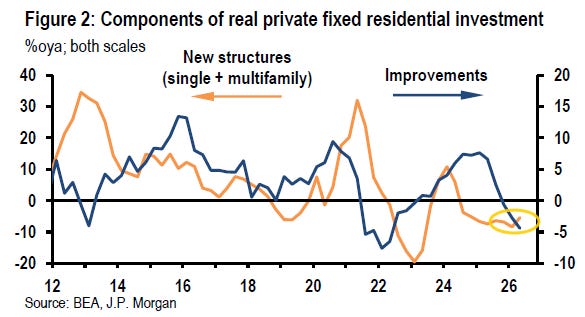
The one less-impressive part of the activity data was housing. The housing sector continues to be restrained by high interest rates, and elevated new home inventories could continue to dampen housing construction. We also wrote this week about how sluggishness in home-sale activity is translating into lower spending on home improvements.
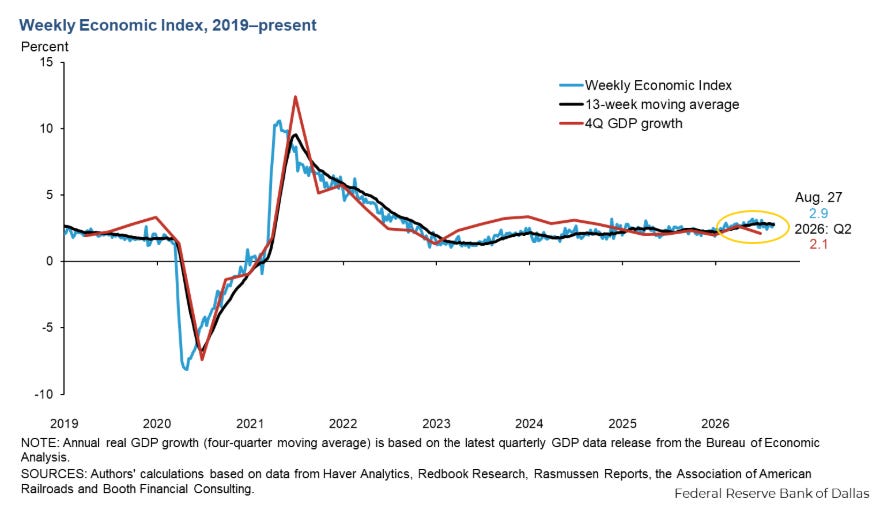
And as you know if you’re a regular reader, one of my favorite GDP trackers is the Weekly Economic Index from the Dallas Fed.*
In the week through Aug 22nd (so doesn’t have last week’s data) it increased to a very solid +2.85% from +2.59% the prior week.
The 13-wk avg was 2.79%, remaining just a little under the 2.87% July 24th which was the best since 2022, continuing to evidence economic momentum that is above trend.
*The WEI is scaled as a y/y rise for real GDP(so different than most GDP trackers which are Q/Q SAAR) and uses 10 daily and weekly economic series but runs a week behind other GDP trackers.
It has over time had one of the highest correlations with actual GDP of any tracker(see chart)although for Q2 it came in highpredicting +2.80% y/y GDP growth vs the actual first estimate of +2.10%, while for Q1 it predicted +2.48 vs 2.66%. More importantly, it has consistently indicated no recession and relatively healthy growth since the pandemic (which is what we’ve experienced).
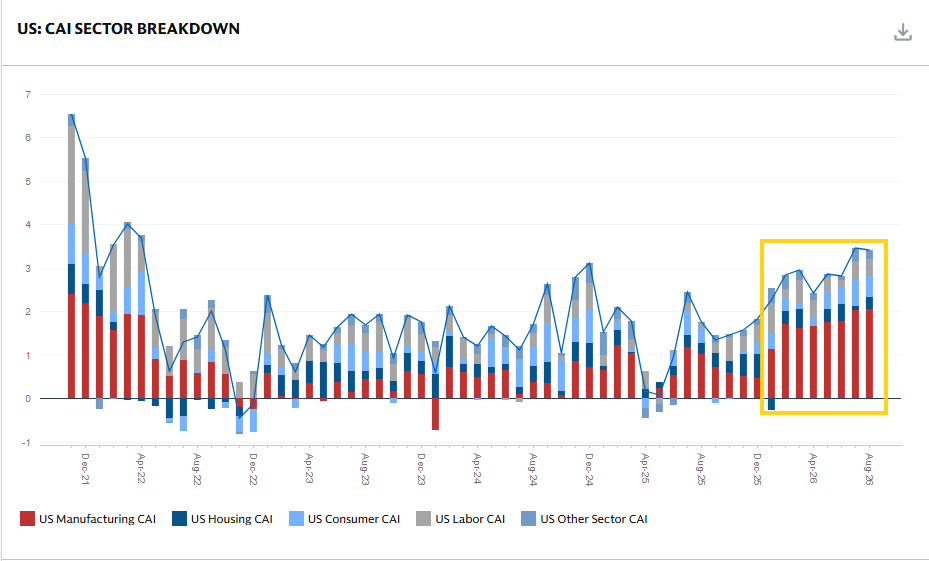
And Goldman updated their August US Current Activity Indicator* which eased back to +3.4% from 3.8%, but July was revised higher to 3.5%, the best since March 2022. That continues the strongest 8-month period since 2022, as the manufacturing component is getting more help from other sectors, although still represents 2.1% of that 3.5% reading.
*The CAI is their “real-time measure of inflation-adjusted economic momentum using 37 inputs.”
No update again this week from BofA on card spending. They are supposed to resume next week.
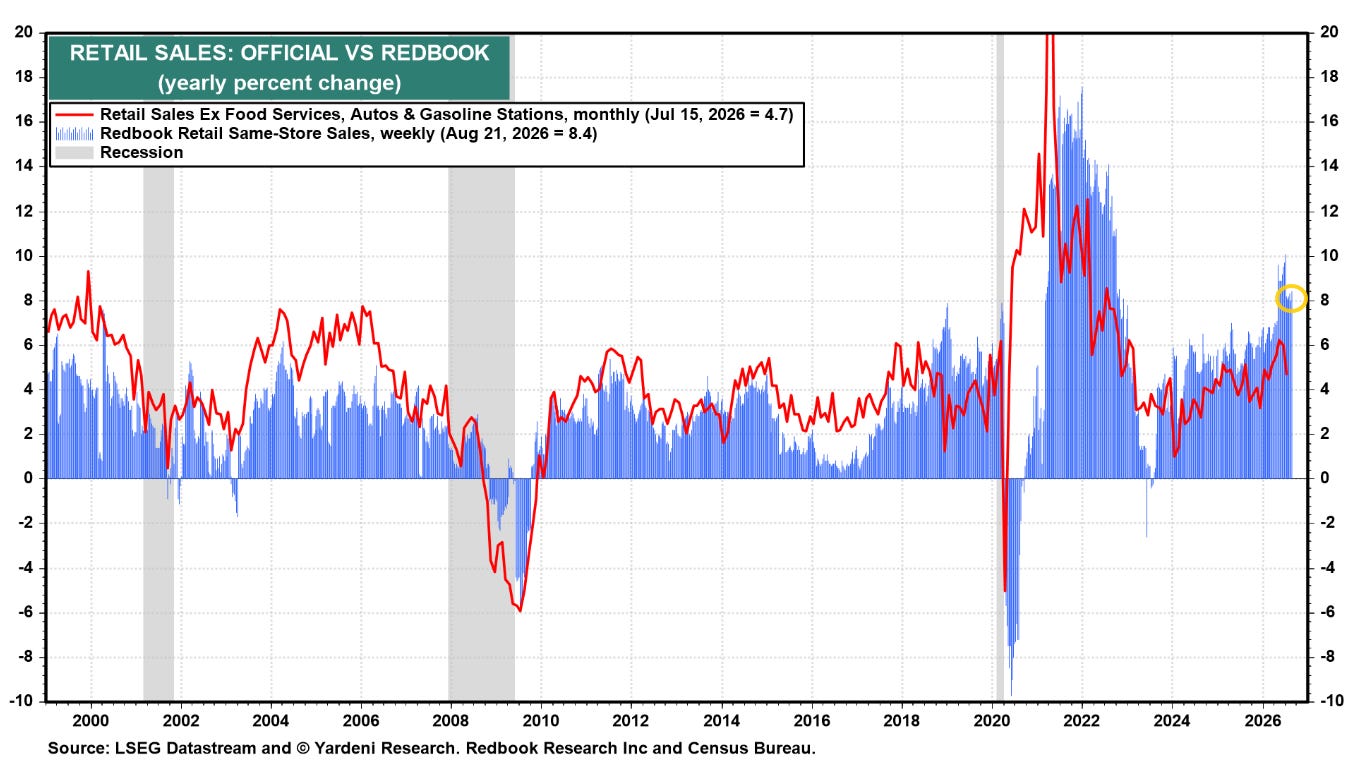
But Redbook sales accelerated to 8.4% y/y growth the week of August 21st remaining well above year ago levels. That compares to the 2025 average of 5.8% y/y.
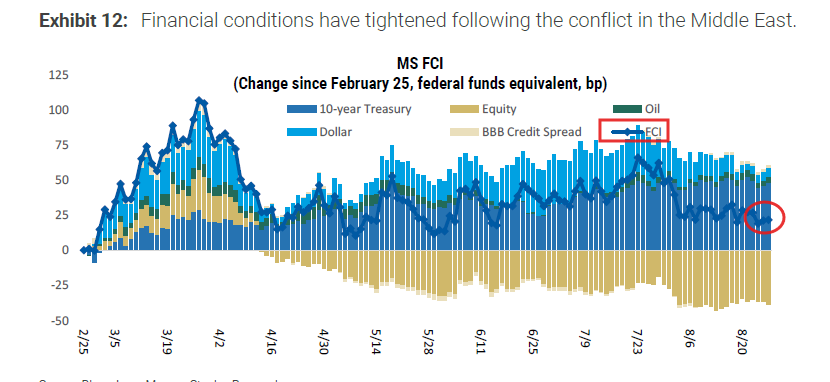
And MS’ Gapen notes financial conditions remain accomodative:
As of the August 27 market close, financial conditions remained tighter than before the recent escalation in the Middle East, but were meaningfully easier than before the July FOMC meeting.
Since the July FOMC meeting, financial conditions have eased by 32 basis points, driven primarily by positive equity returns and US dollar depreciation.
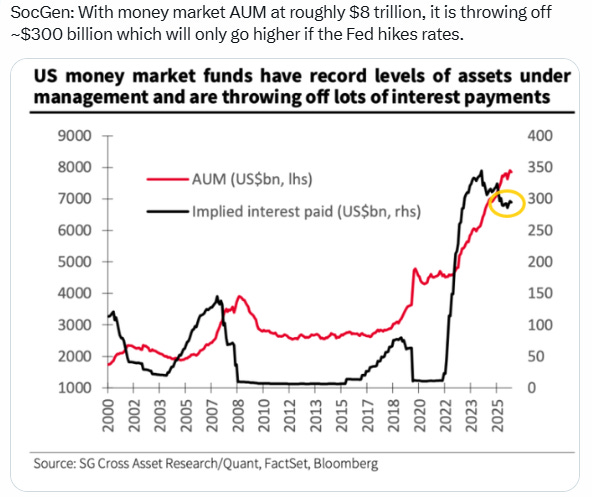
And don’t forget about all that interest income kicked off by higher rates.
Earnings
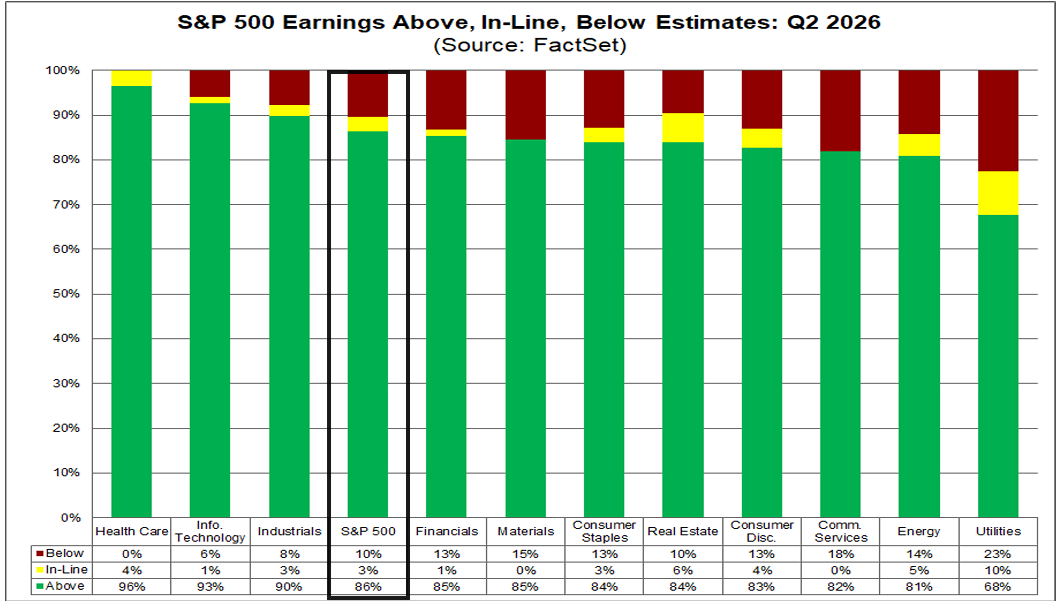
Through August 27th, according to FactSet, we’ve had 97%of SPX components report by earnings weight, so we can pretty much put a bow on results and start to more fully turn our attention to 2H and 2027.
While we came into the earnings season with a high bar the results cleared it, with 86% beating, slightly above the 84% beat rate in Q1 (which was the best since Q2 ‘21) and vs the 5yr average of 78% and the 10yr average of 76%.
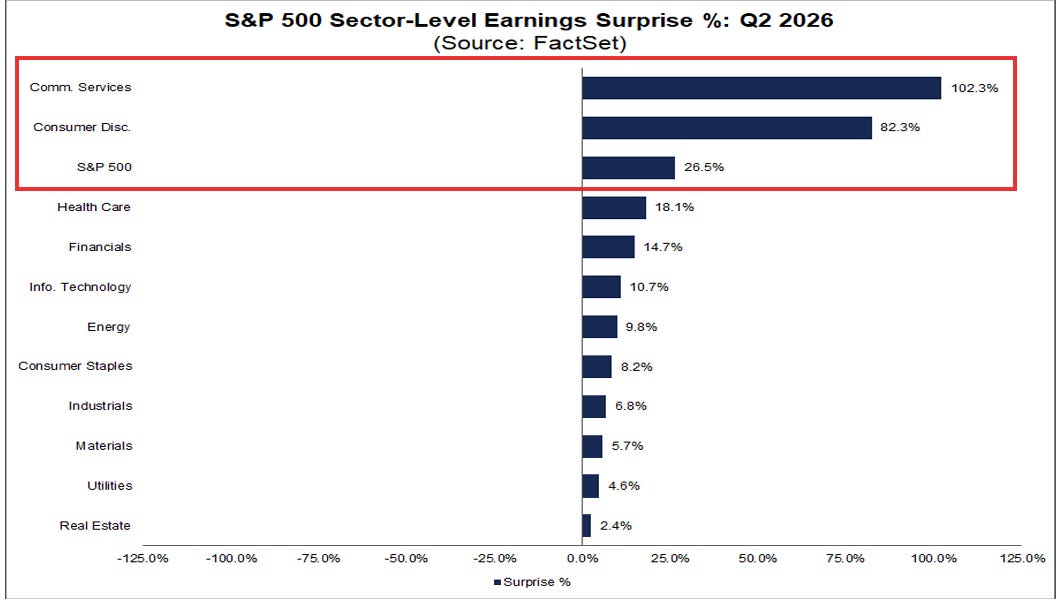
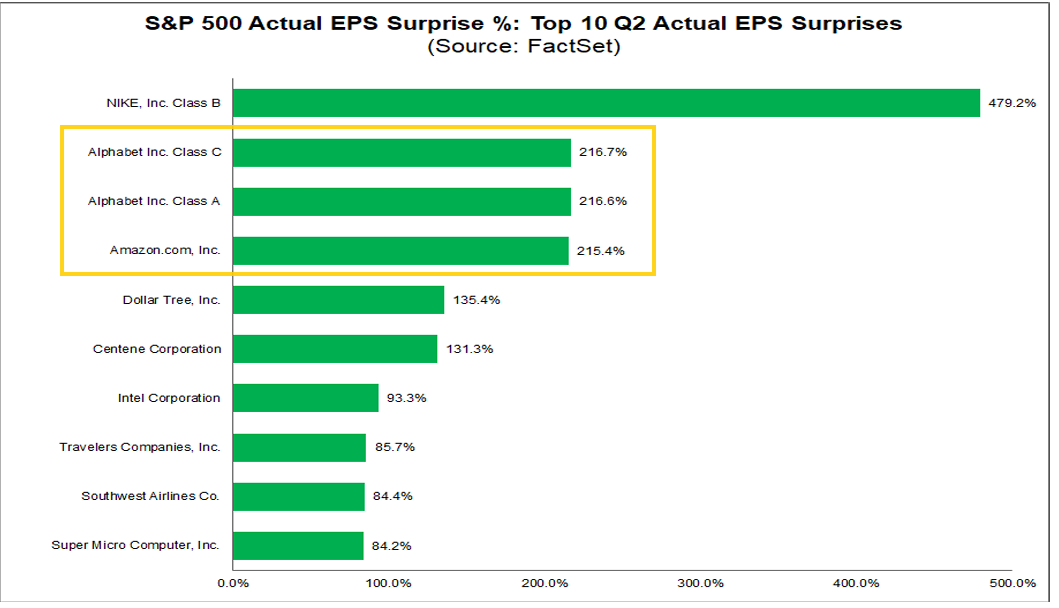
And despite the high bar the magnitude of the beats has been a huge +26.5%, the best since FactSet began tracking the metric in 2008 beating the 23.2% in Q2 2020 (pandemic rebound). It is nearly double Q1’s +16.6%, and nearly four times the +6.5% in Q4 and +6.6% in Q3, and vs the 10-yr average of 7.4% and the 5-yr average of 7.0%, led by Communication Services (+102.3%) boosted by Alphabet’s +217% beat on the back of a $98 billion gain tied to its investments followed by Consumer Discretionary’s +82.3% similarly boosted by Amazon’s massive 215% beat on the back of a $53.4 billion gain in its own investments (primarily Anthropic) as well as Nike’s +479% beat boosted by tariff refunds.
FactSet notes while excluding Amazon and Alphabet, the surprise percentage for the S&P 500 for Q2 2026 would fall to 10.8% that would still be “materially above” the 5 and 10-year averages.
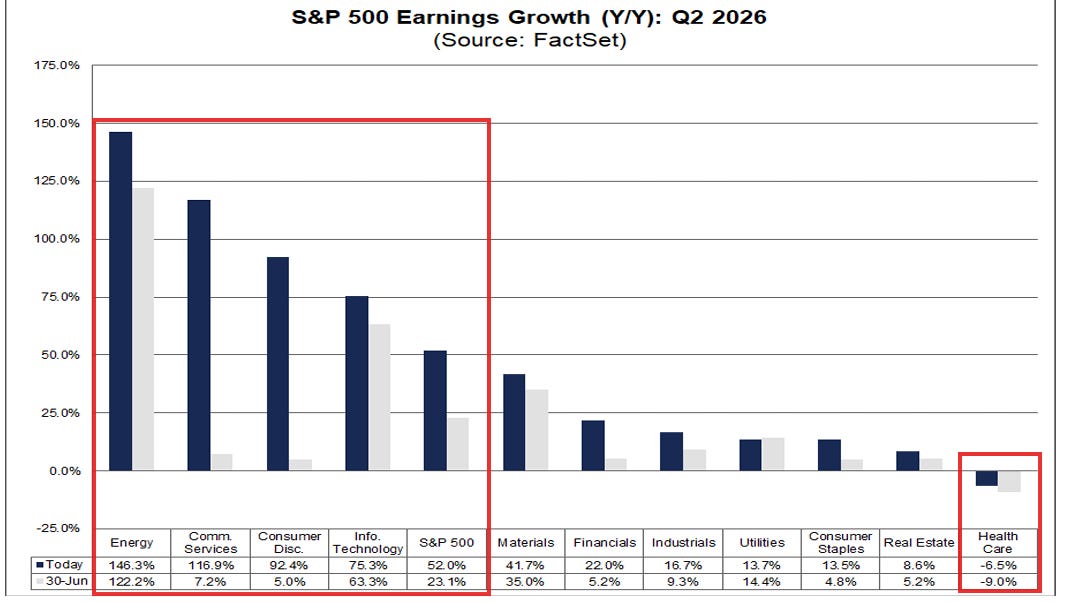
The beats have boosted Q2 earnings expectations to an eye-watering +52.0% up from 18.8% at the start of the quarter (April 1st). That would be the seventh consecutive quarter of double-digit earnings growth (and second above 20%) and the strongest since Q2 2021 (91.6%).
FactSet notes if Alphabet and Amazon.com were excluded, “the blended earnings growth rate for the S&P 500 for Q2 2026 would fall to [a still phenomenal] 33.8% from 52.0%,” the “second consecutive quarter of year-over-year earnings growth above 25% and 7th consecutive quarter of double-digit earnings growth.”
Energy continues to lead on a percentage growth basis (although less so on an earnings weighted basis) +146.3%, Comm Services is not far behind (+116.9%). Consumer Discretionary is +91.6%, and Tech is +75.3%. Just incredible numbers.
As with Q1 Health Care is expected to be the only sector with negative growth -6.5% (down from +6.7% on March 31st).
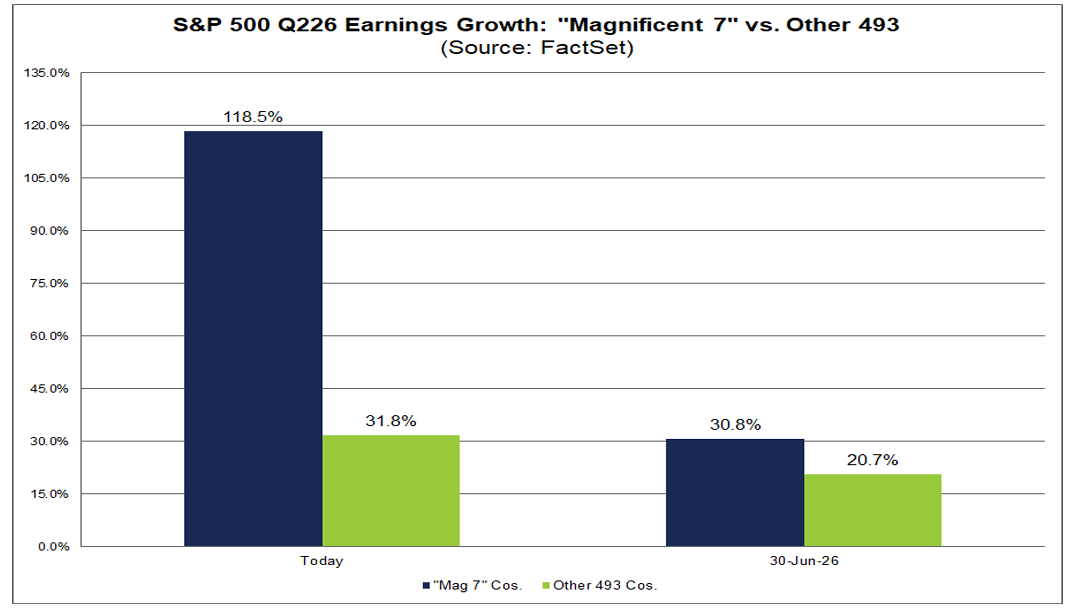
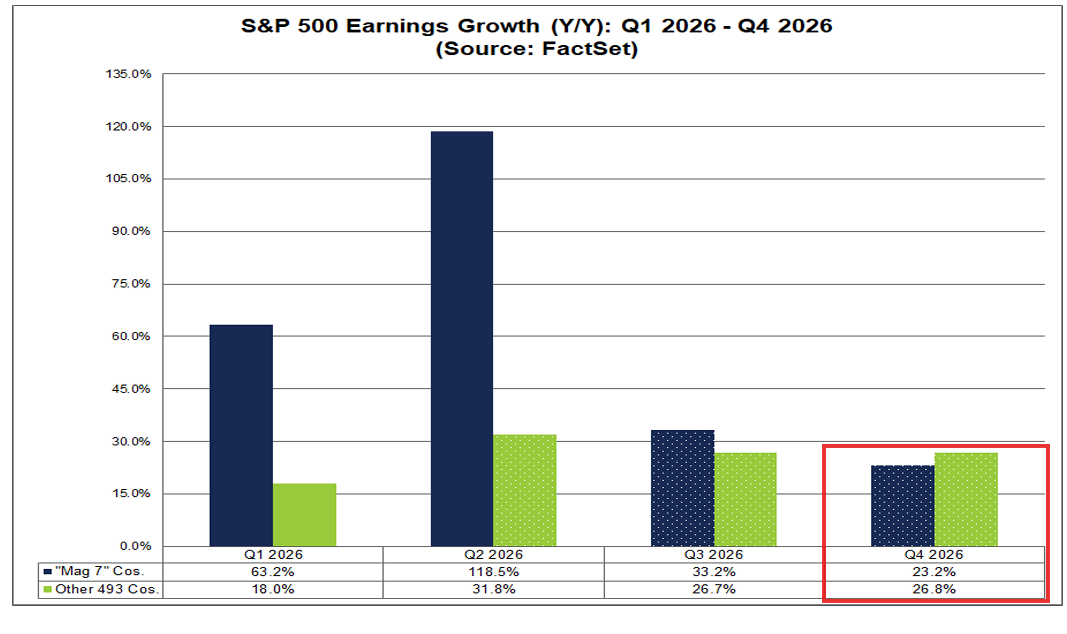
As a side note, the Mag-7 came in at another jaw-dropping +118.5% growth, the most since Q4 2020 when TSLA joined the SPX beating by 66.2% (compared to 25.6% for the “other 493”).
Excluding the Mag-7 still leaves Q2 earnings growth though at 31.8%, the best since Q4 2021 (32.4%).
In Q3 analysts expect the “other 493” S&P 500 companies to again trail vs the Mag-7 (26.7% vs. 33.2%) before reporting higher earnings growth in Q4 (26.8% vs. 23.2%).
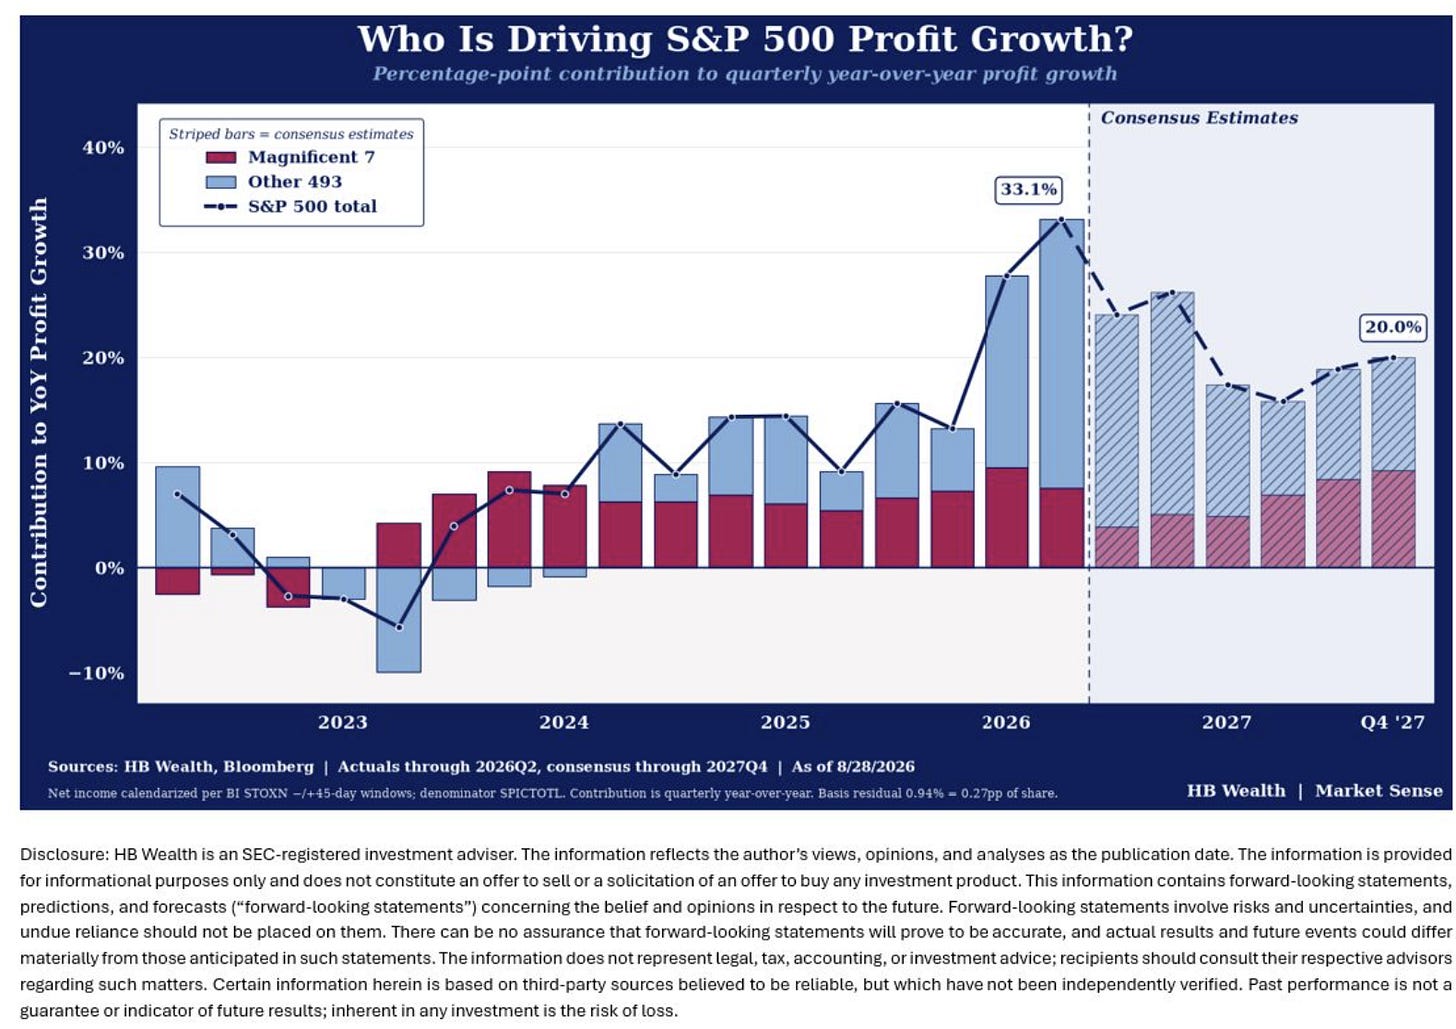
And while we’re on the Mag-7, the great Gina Martin Adams had this on LinkedIn:
the aggregate magnificent-7 numbers hide sharply rising contributions from Nvidia. Five of the other six members are expected to see its share of S&P 500 earnings shrink while Nvidia alone is expected to contribute nearly 10% to S&P 500 earnings by the end of 2027. The chipmaker reported much stronger than consensus revenues and earnings and while some margin compression from higher component costs is now baked in, the company is simply struggling to keep up with extraordinary demand for its chips, causing guidance to skyrocket.
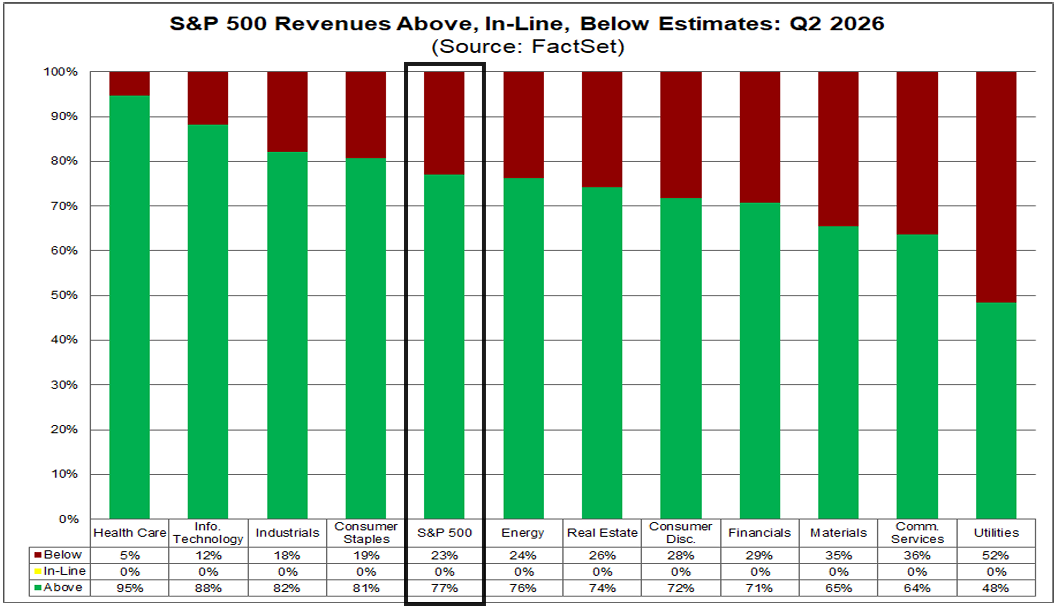
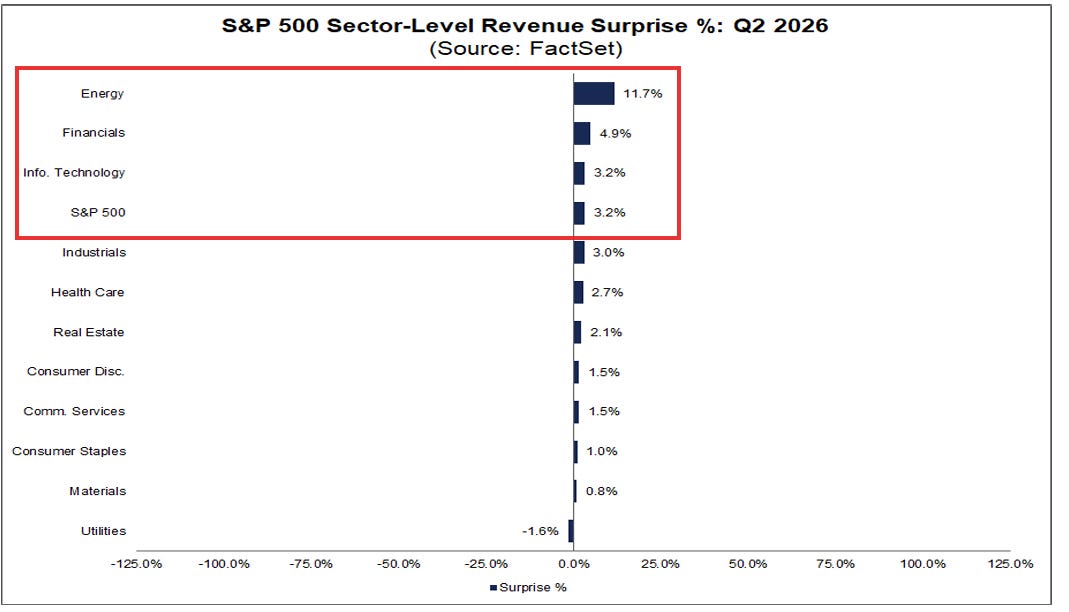
In terms of Q2 revenues, 77% of SPX components have beat (vs the 10-year average of 68% and 5-year average of 70%). The beats are 3.2% above estimates, which would be the best since Q2 2022 (3.2%) and above the 5-year average of 1.9% and the 10-year average of 1.6%.
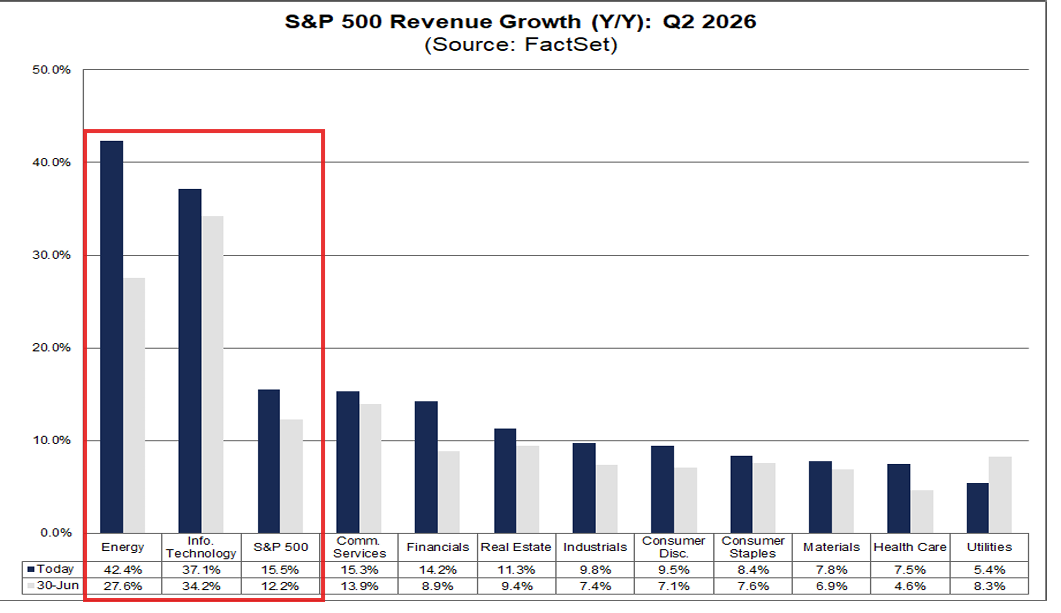
That has boosted Q2 revenue expectations to +15.5% (up from 9.5% at the start of the quarter (Apr 1st)) led by Energy (+42.4%), Tech (+37.1%), and Comm Services (+15.3%). No sector is expected to see a revenue decline y/y, in fact the least is +5.4% (Utilities).
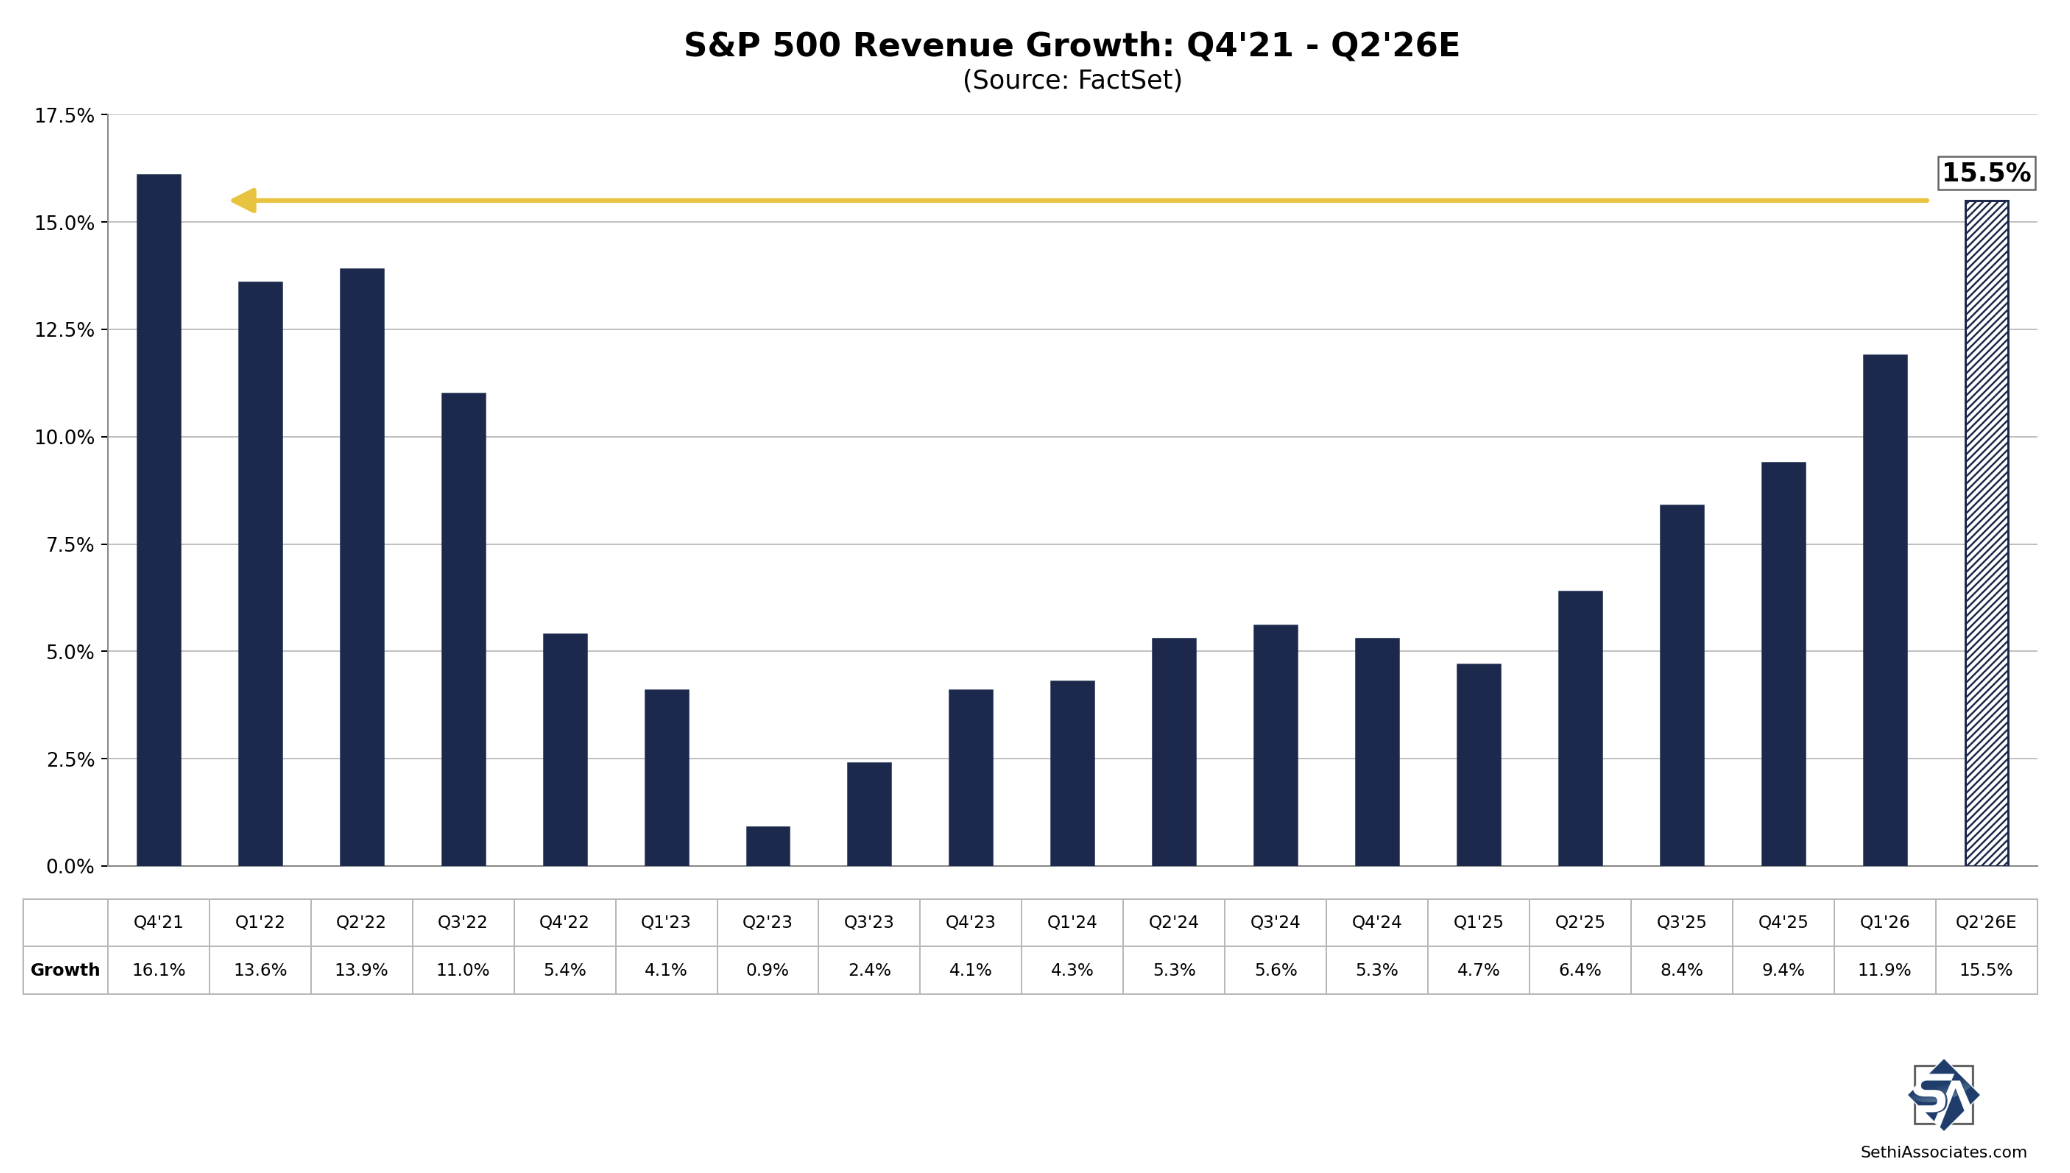
If 15.5% is the actual revenue growth rate for the quarter, it will mark the highest revenue growth rate reported by the index since Q4 2021 (16.1%). It will also mark the second consecutive quarter of double-digit revenue growth for the index.
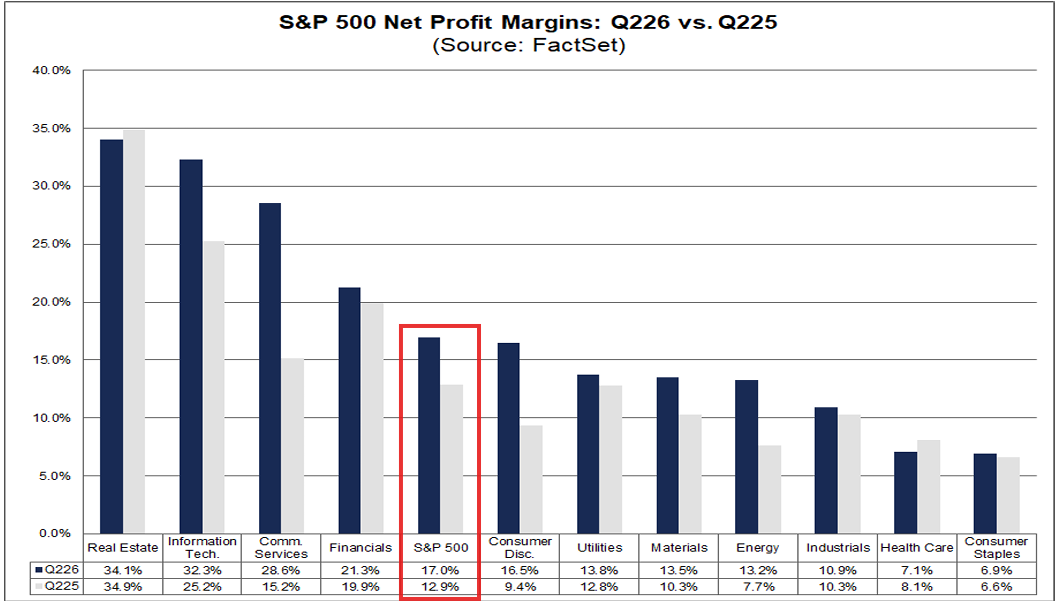
Profit margins were also boosted further and are now forecast at 17.0%, easily a new record (beating the 14.8% in Q1). They are also well above the prior year’s 12.9% and the 5-year average of 12.3%.
Again, this saw a big boost from the non-cash earnings in Amazon and Alphabet, but even removing those it only falls to 15.1%, still a record.
Just Health Care (7.1% vs. 8.1%) and Real Estate (34.1% vs. 34.9%) didn’t see a y/y increase in their profit margins.
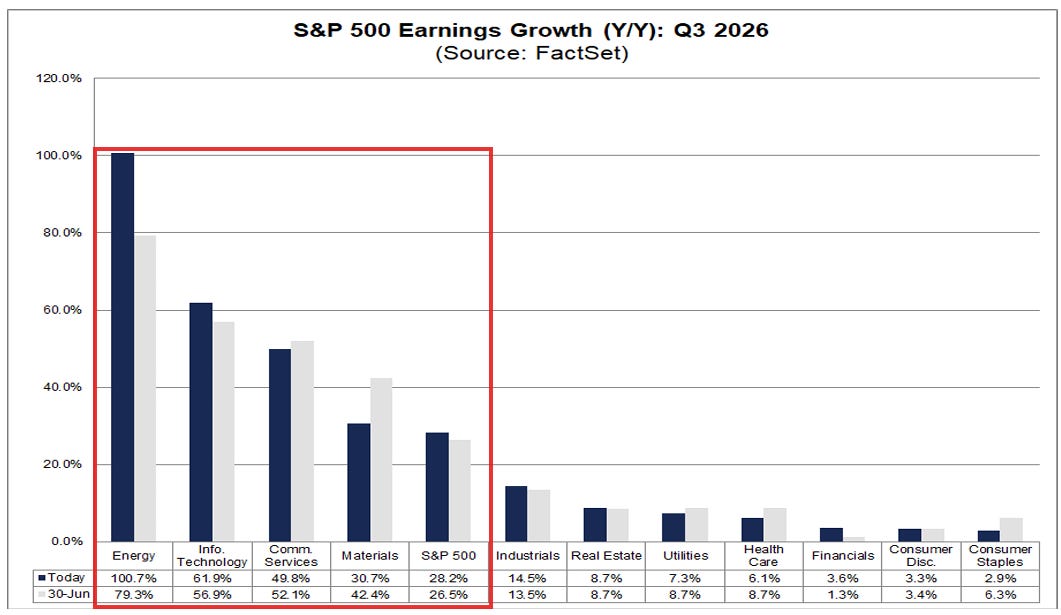
And at this point analysts are expecting a third consecutive quarter of 25%+ y/y earnings growth with the Q3 estimate at +28.2%. As in Q2, Energy is expected to lead at +100.7% y/y growth (up from +79.3% at the start of the quarter (July 1st), followed by Tech +61.9%, Comm Services +49.8%, and Materials +30.7%.
Unlike Q2 no sector is expected to have negative y/y growth with Staples the least at +2.9%.
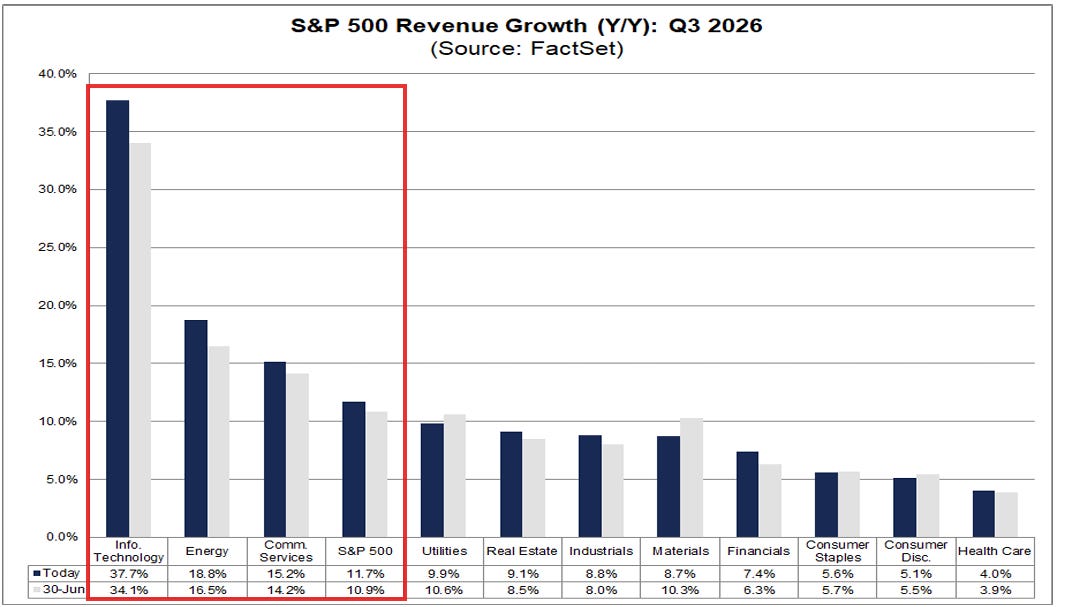
Q3 revenue growth is expected at +11.7%, led by Tech (+37.7%).
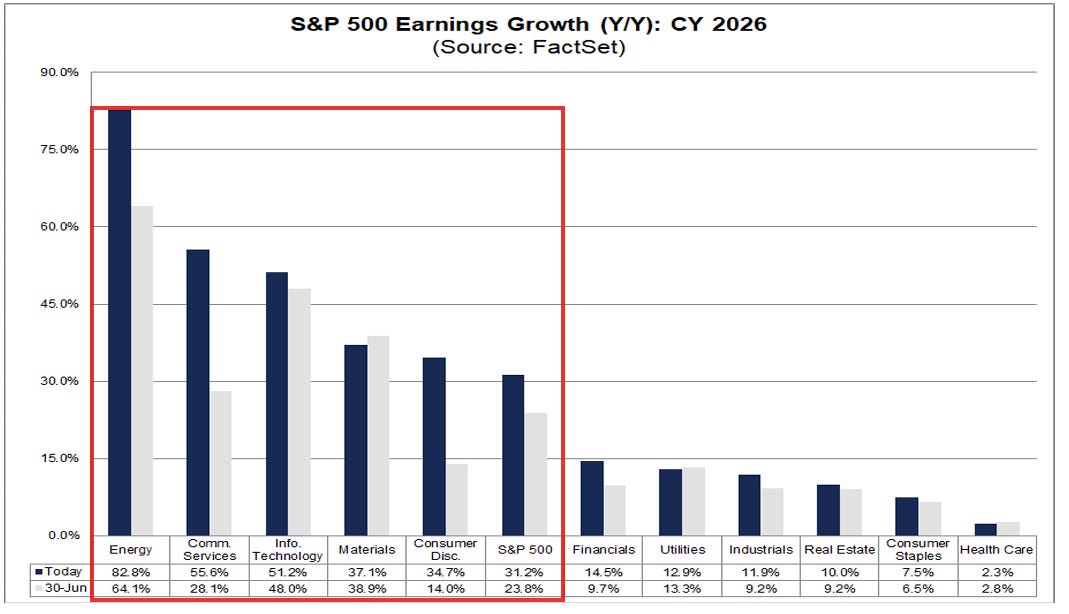
Andthose rising earnings expectations have seen 2026 SPX earnings growth expectations also continue to ratchet higher now at +31.2%, up from +17.1% March 31st and over double the +14.8% at the start of the year.
As in 2025, Tech is a leader with y/y earnings growth of +51.2% (up from +28.6% at the start of the year) but Energy will exceed that (on a percentage basis) at +82.8% (up from +6.4% at the start of the year) along with Comm Services +55.6%. Those sectors along with Materials (+37.1%) and Consumer Discretionary (+34.7%) represent the five sectors expected to come in above the SPX average.
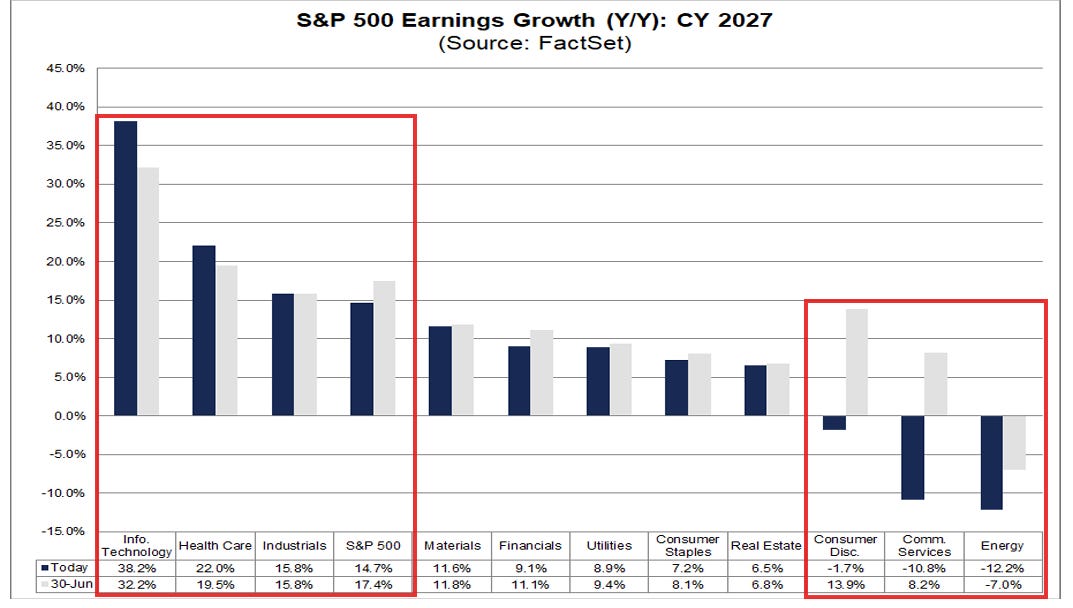
And 2027 earnings are expected to be up another +14.7%, which is down though from +17.4% as of June 30th as analysts are no longer carrying over all (but still most of) the boosts in 2026 earnings to next year (such as the full investment gains by some hyperscalers). That’s also down from +16.5% at the start of the second quarter (Apr 1st). Still it’s a double digit advance on top of what is expected to be a 30%+ gain in 2026. That would also represent a fourth straight year of double-digit earnings growth for the S&P 500, something we’ve rarely seen.
2027 is expected to be led again by Tech (+38.2%, up from 24.6% at the start of the second quarter (April 1st) despite the huge increase in 2026 estimates) followed by Health Care (+22.0%) which is expected to see a big turnaround after lagging in 2026. Industrials (+15.8%) is also above the SPX average.
In terms of the note at the start on investment gains not continuing, though, Comm Services (-10.8% from +8.2% at the start of the third quarter) and Consumer Discretionary (-1.7% from +13.9%) have joined Energy (-12.2%) as the sectors expected to see negative y/y growth next year.
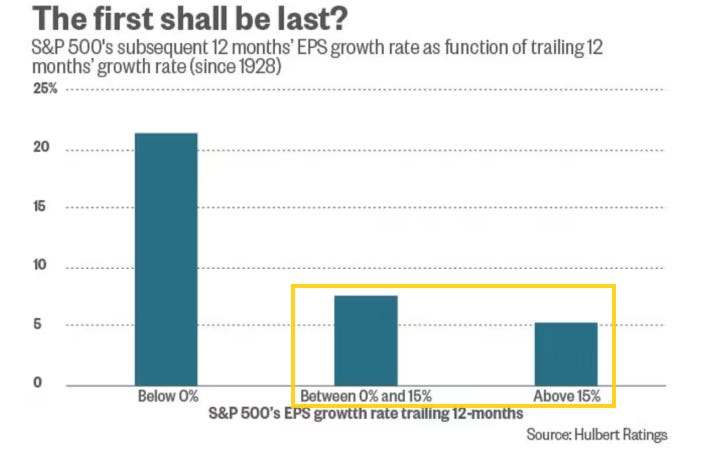
In terms of how unusual this is, outside of a bounceback from an earnings recession, see this chart from Mark Hulbert where since 1928 any earnings growth at all was most likely followed by high mid-single digit growth and over 15% growth by around 5%.
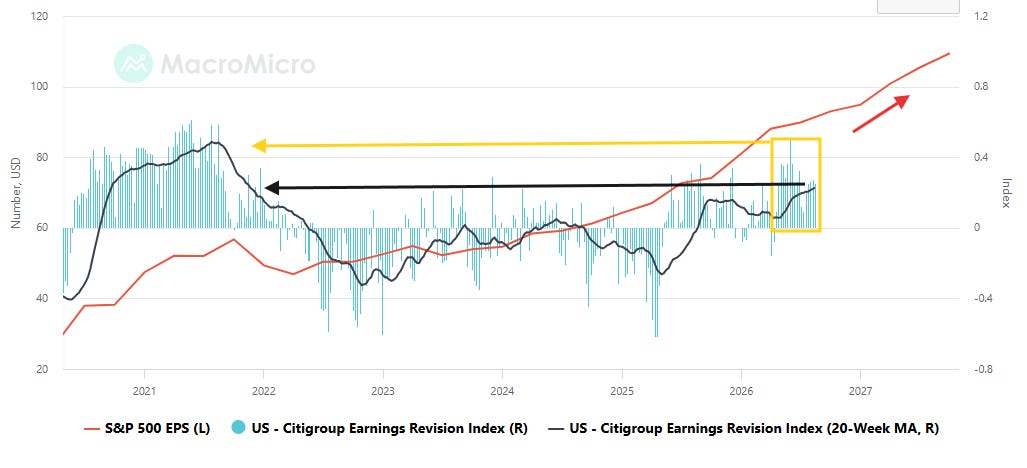
And earnings expectations continue to be supported by very strong earnings revisions. These were not updated by Citi this week, but as ofthe week of August 14th they continued the best 17 week streak since 2021.
As a result, the 20-week moving average (black line) lifted to the best since 2021 as well, as 12-month out EPS estimates (red line) continue to rise to new highs, as they’ve done each week since the turn of the year.
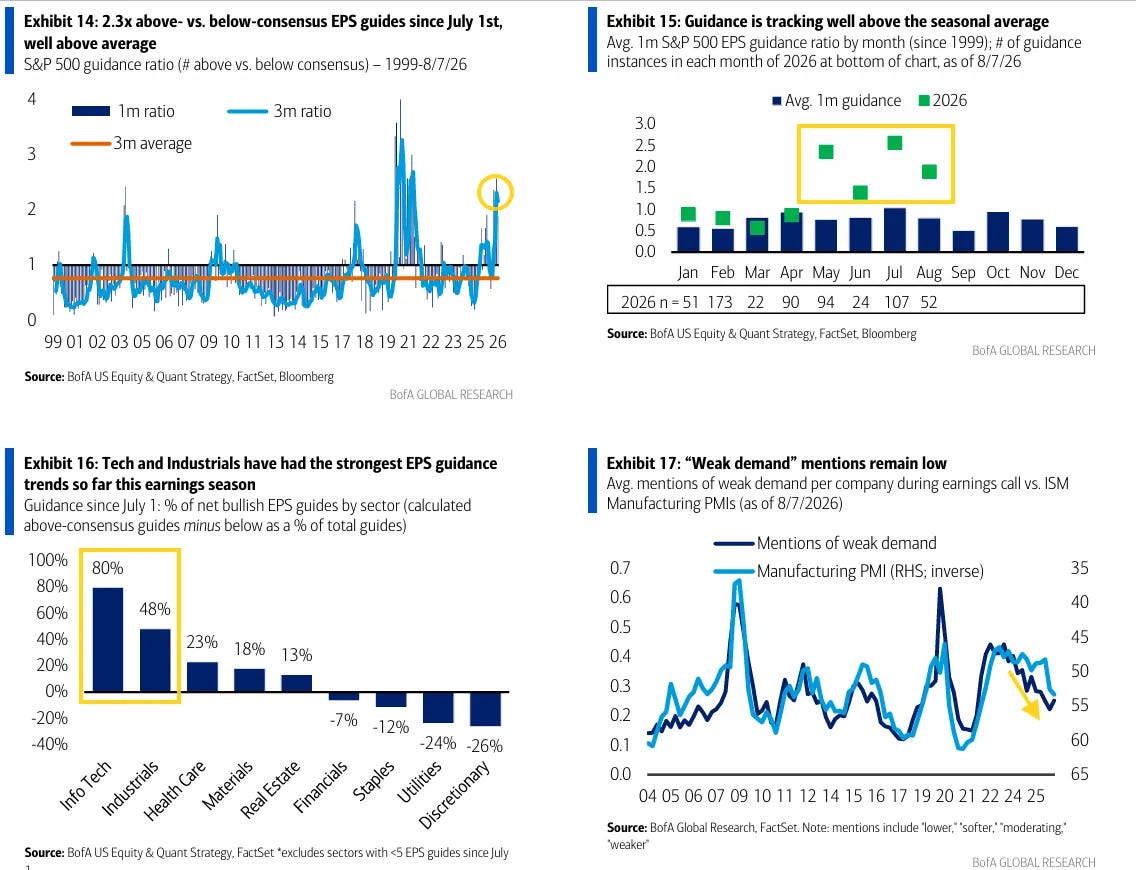
And BofA found as of two weeks ago: “There have been 2.3x more above-consensus than below-consensus EPS guides since July 1st, far better than historical norms (see Exhibit 15) and at the best level since 2021. By sector, Tech continues to see the strongest guidance trends.”
And Ed Yardeni from this weekend:
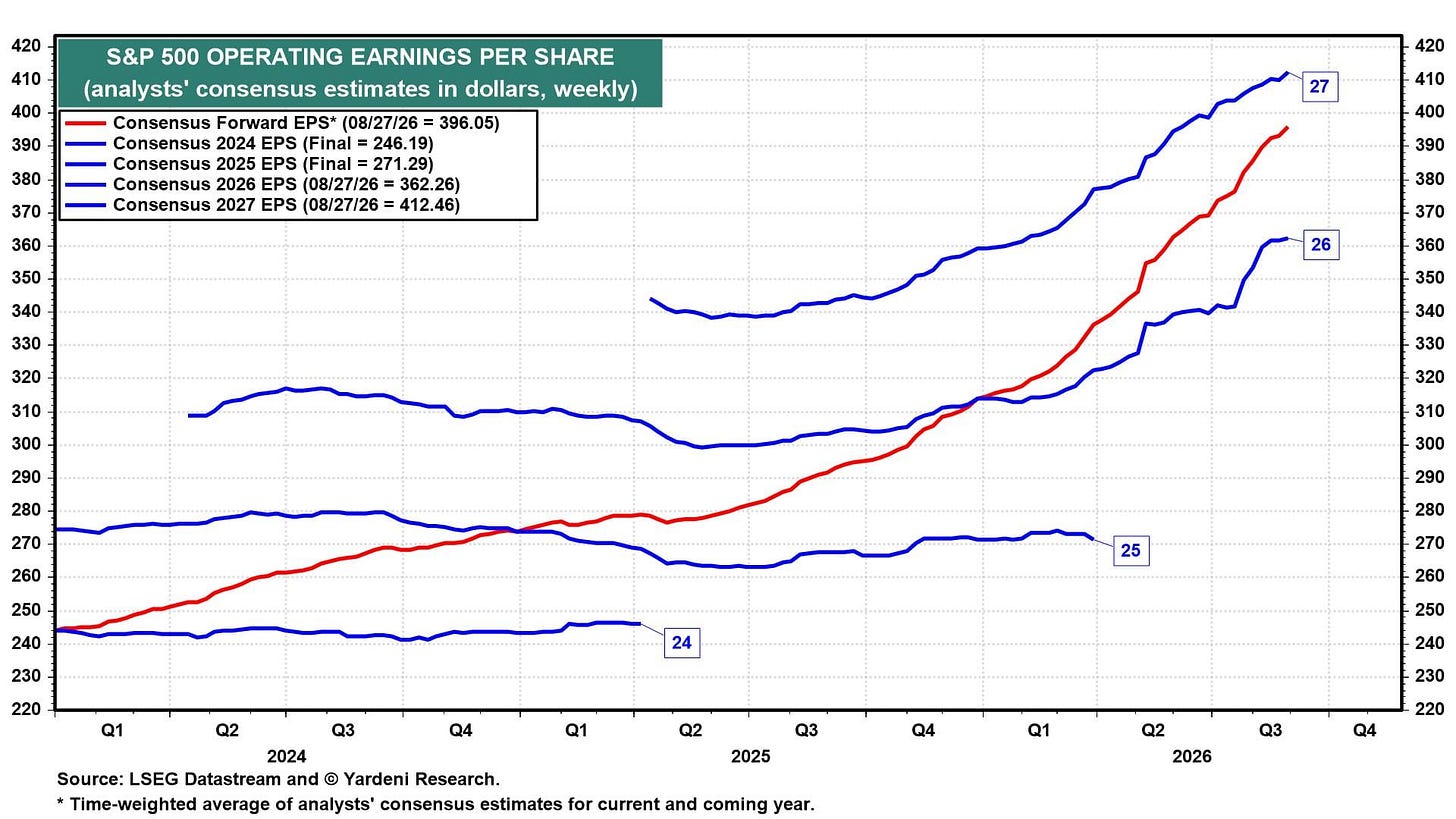
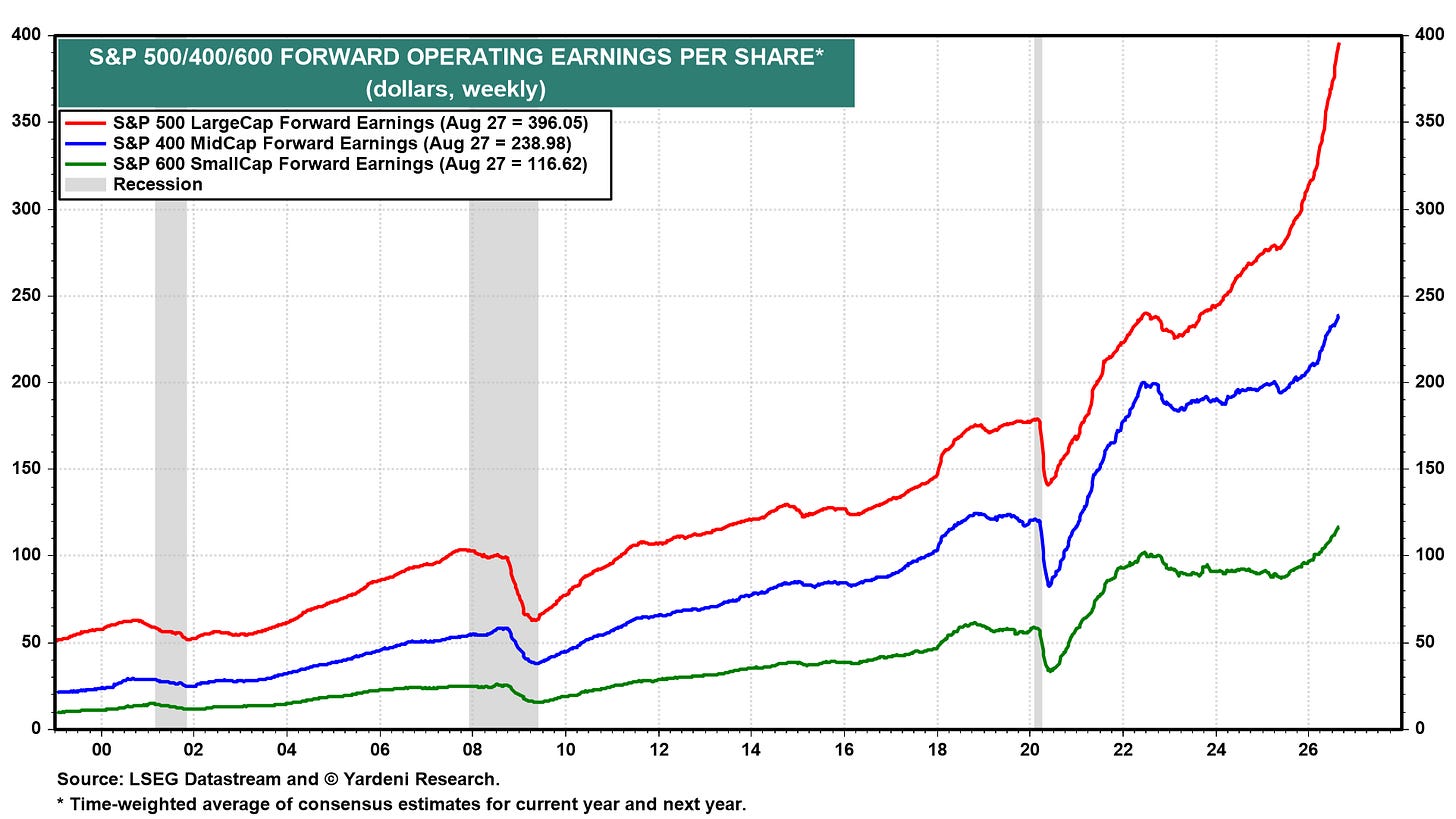
S&P 500 forward earnings per share rose to yet another record high last week at $396.05 (chart). By definition, it will converge to match the analysts’ consensus 2027 earnings estimate by the end of this year, which is currently at a record high of $412.46. We think both will hit $415 by year-end, taking the S&P up to 8,400 (with a 20.2 forward P/E).
Forward earnings for the S&P 400 and S&P 600 also have been rising to record highs (chart).
And from last weekend:
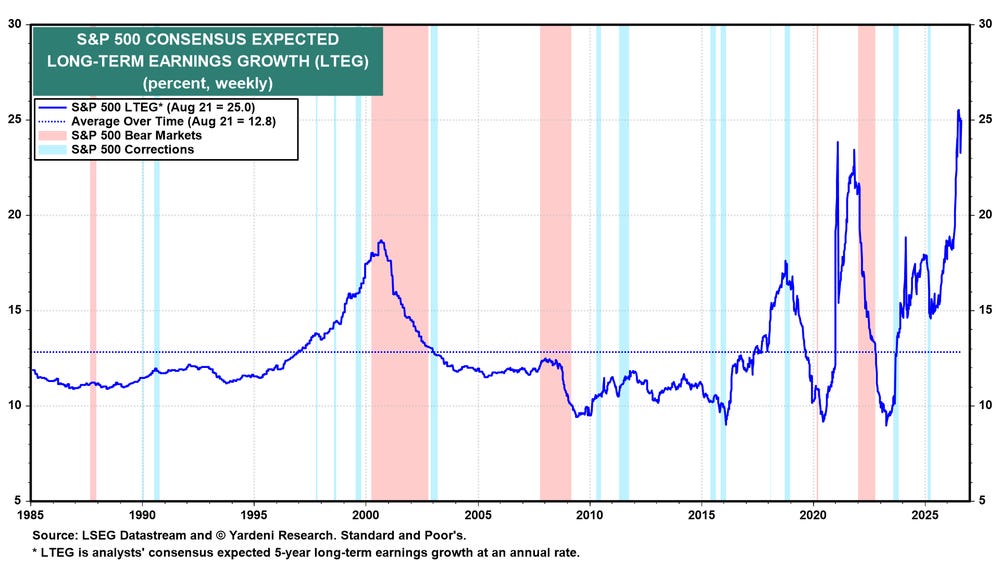
Consensus long-term earnings growth (analysts’ expected five-year annual growth rate) is currently 25.0%, nearly double the historical average of 12.8% (chart). This signals irrational exuberance in analysts’ earnings expectations. However, stronger-than-expected actual earnings have driven it.
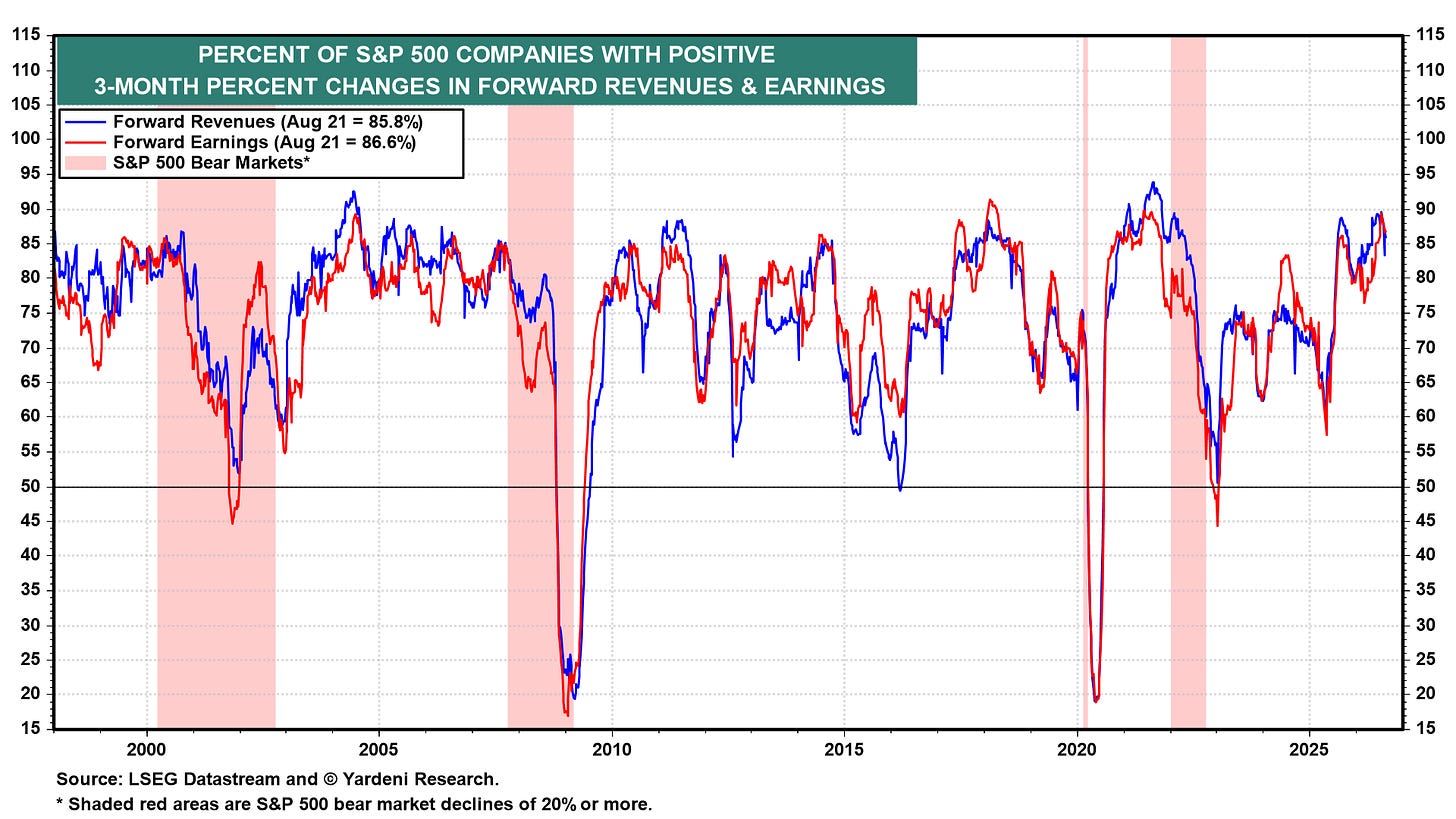
And the breadth of earnings has improved. The dispersion in forward revenue and earnings increases is very high (chart).
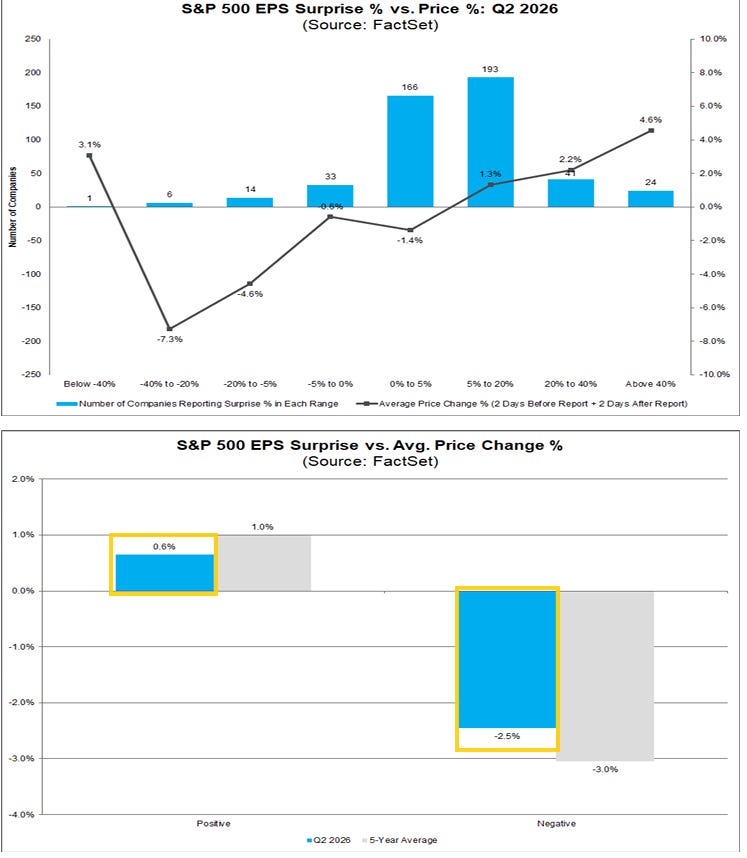
In looking at how markets are rewarding beats and punishing misses, according to FactSet (who looks from the two days before to two days after a report) in line with the high bar coming into earnings beats are being rewarded well under the typical amount, although improving to +0.6% (from -0.3% at the start of the month) but as compared though to the 5-yr average of +1.0%, and down from +1.2% in 1Q and 4Q ‘25 although above the +0.4% in 3Q and 2Q ‘25).
Misses though are being punished less than average at -2.5% vs the 5-yr avg of -3.0% and also better than the -4.3% in 1Q. Previous to that we saw -1.4% in 4Q, -5.0% in 3Q, and -5.5% in 2Q (the last of which BoA said was the worst negative reaction since 2000).
As a reminder, earlier in the reporting season BofA noted that Tech was pulling down the aggregate numbers. BofA looks just one day post-earnings:
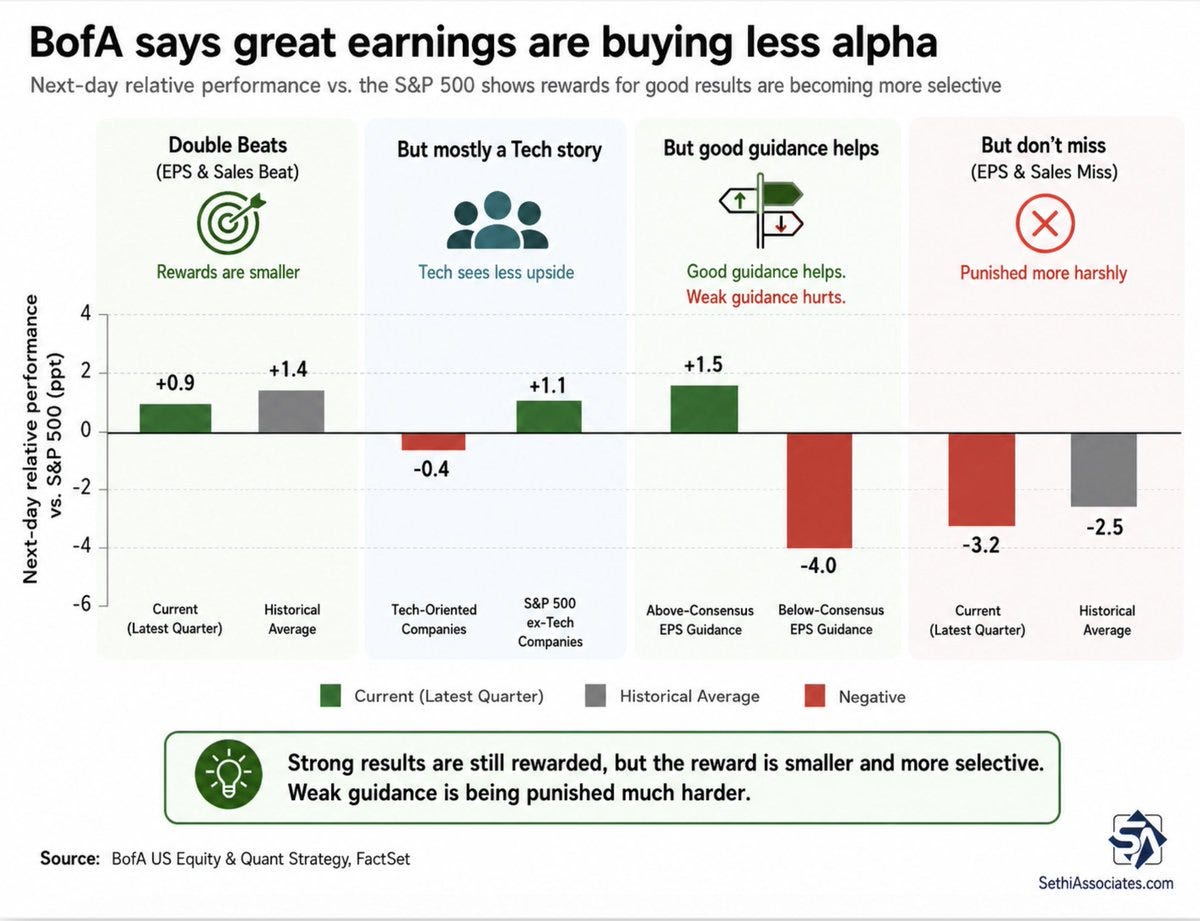
“Companies that beat EPS outperformed by just 10bp on average the next day. Those that beat both EPS and sales gained 90bp, well below the 1.4ppt historical avg.
“Even with positive reactions to Microsoft and Amazon, the avg. TMT stock that beat both metrics lagged after reporting.”
Meanwhile, misses have been punished more than usual (-3.2ppt vs. -2.5ppt historical avg.), while below-consensus EPS guides – which have been relatively rare this quarter – have faced an even steeper penalty (-4ppt the next day).
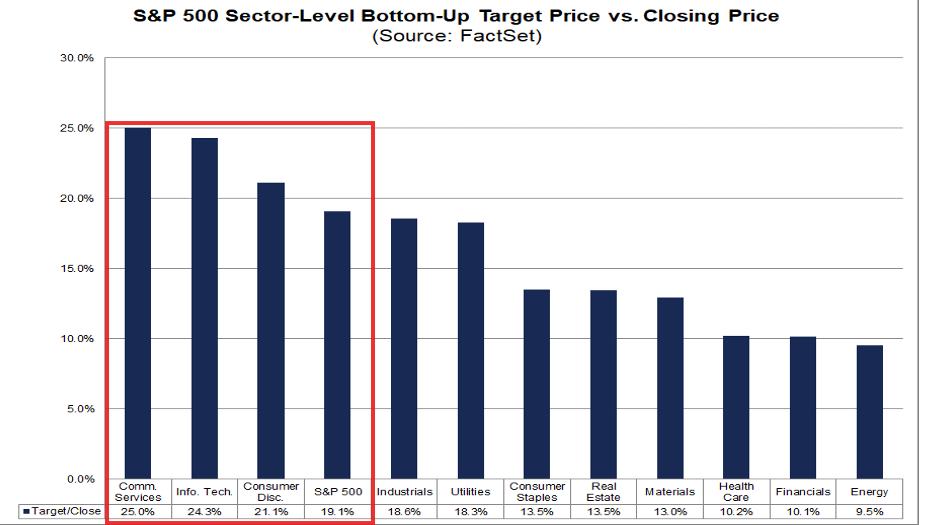
Analysts also collectively continue to think that the S&P 500 has a lot of upside with FactSet’s compilation of analyst bottom-up SPX 12-month price targets up to 9,204 (~915 pts since March 31st, ~+2,090 pts since Thanksgiving, and ~+3,040 pts since July 1, 2025). That would be +19.1% from Thursday’s close.
Comm Services (+25.0%) has overtakenTech (+24.3%) as the sector seen with the biggest upside, followed by fellow megacap growth sector Consumer Discretionary (+21.1%). On the other side Energy (+9.5%) has fallen to the sector with the least upside, the only sector not expected to see double digit upside over the next 12 months.
As a reminder we started the year with a 12-month bottoms-up price target of 8,000and according to FactSet the last 20 yrs (through 2024) analysts have been on avg +5.9% too high from where they start the year, but they have underestimated it five of the past six years (including 2025 when they saw 6,755 at the start of the year and we ended at 6,845)).
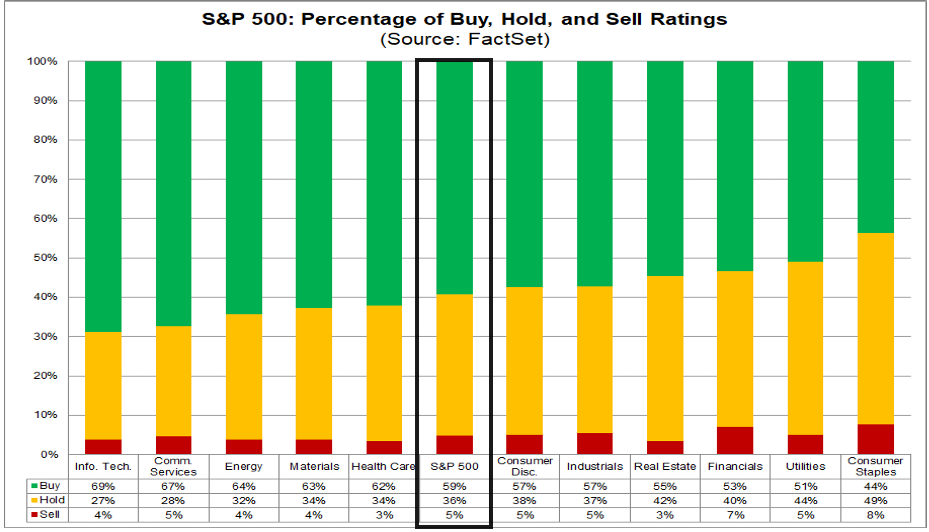
In terms of analyst ratings, buy and hold ratings continue to dominate with buy ratings at 59.2% seven tenths below the record high of 59.9% the last week of April. The 5-year month-end average though is 55.8% according to FactSet, so we’re well above that.
Hold ratings are at 35.9%, off the 35.4% record low (to 2009), but well below the 5-year month-end average of 38.7%, with sell ratings at 4.9%, remaining in their narrow range since 2009 but below the 5-year month end average of 5.6%.
Tech leads in buy ratings (69%) while Staples leads in sell ratings (8%).
These numbers have not changed much in August.
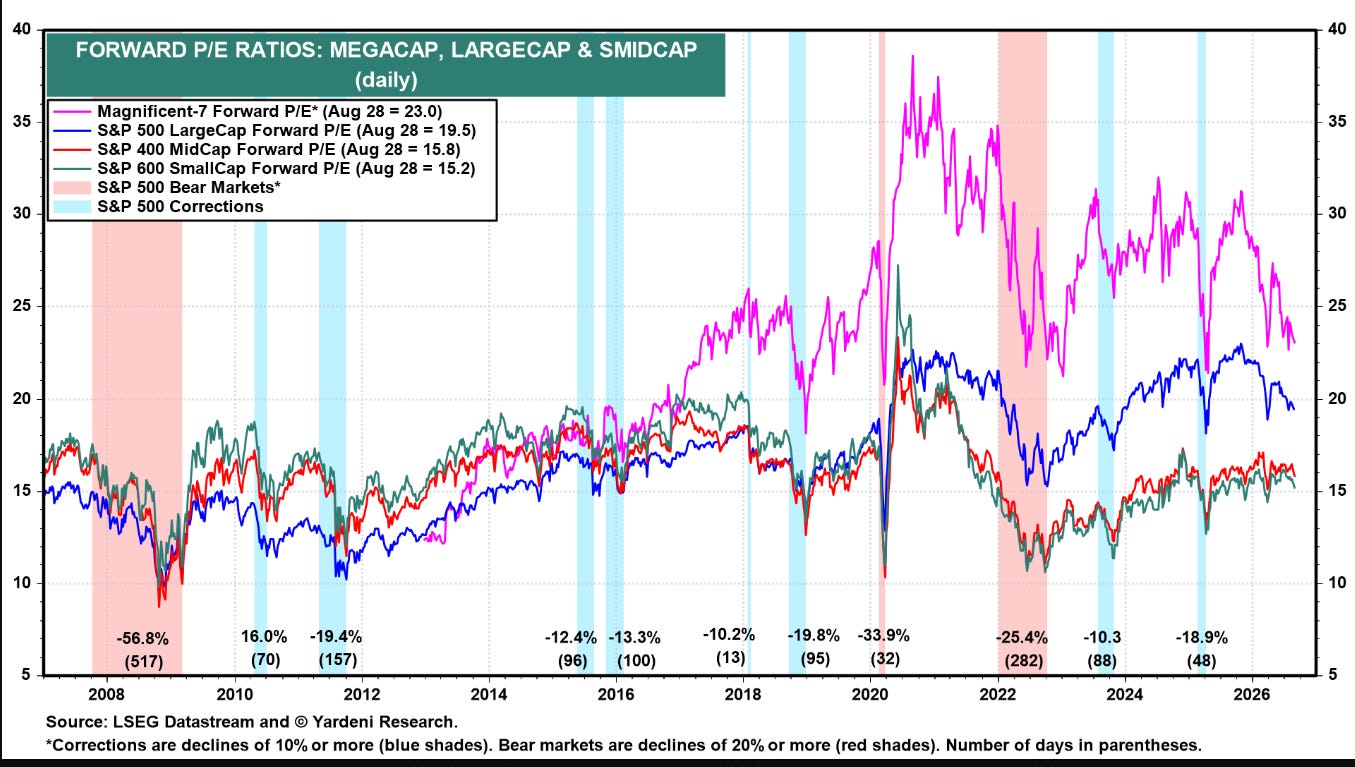
The weak results in stock prices this month while earnings expectations continue to push higher have seen valuations (price to next-twelve-month earnings) continue to ease back towards the least since April (and for the Mag-7 since April 2025).
Breadth
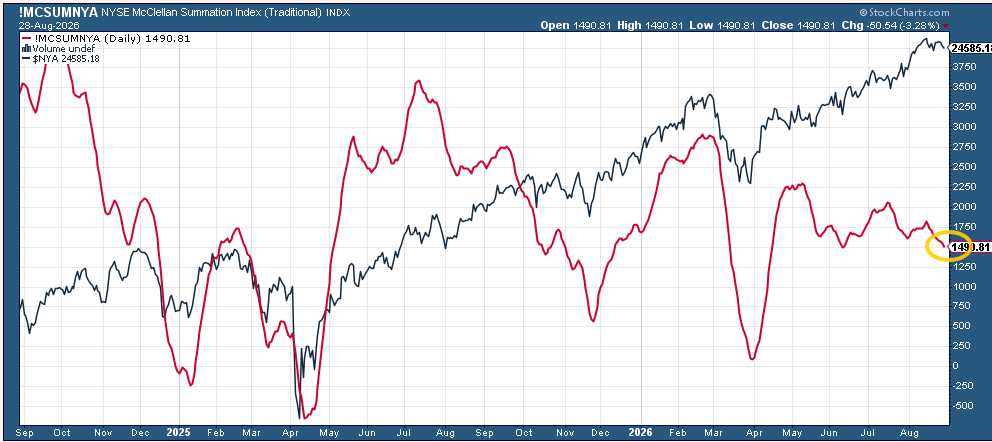
Breadth, which softened in the second half of July but made incremental improvement at the beginning of August softened for a second week.
The McClellan Summation Index (“what the average stock is doing”) fell to the joint least since April.
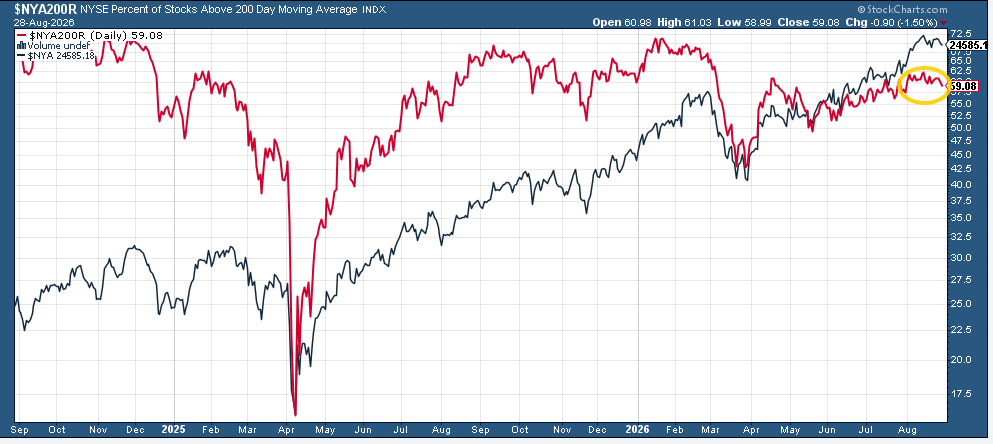
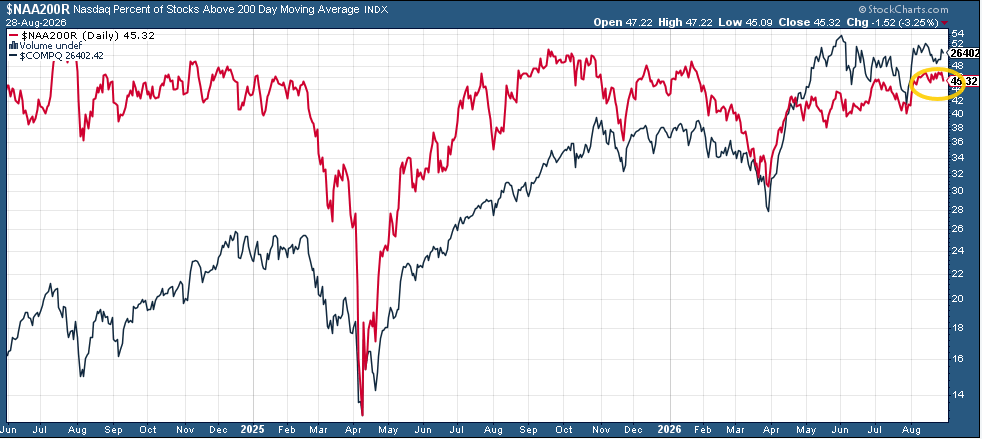
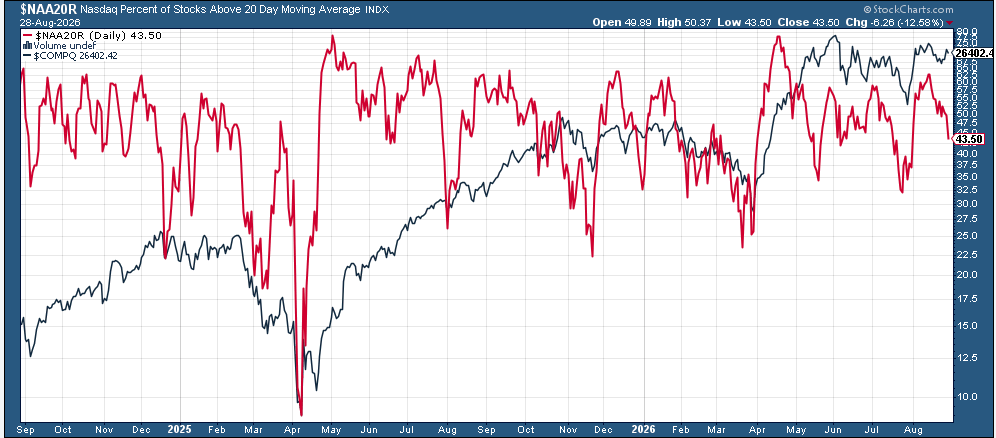
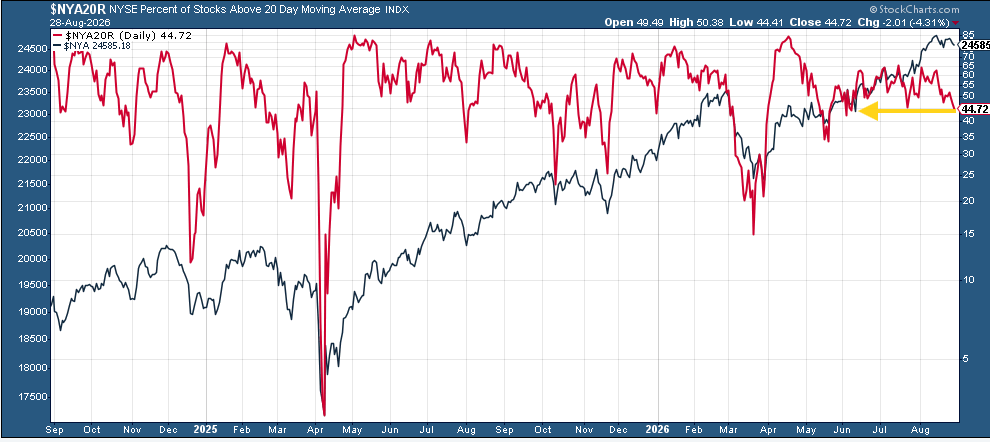
Percentage of stocks over 200-DMAs (red lines) fell to the lows of the month on the NYSE, holding in a little better on the Nasdaq.
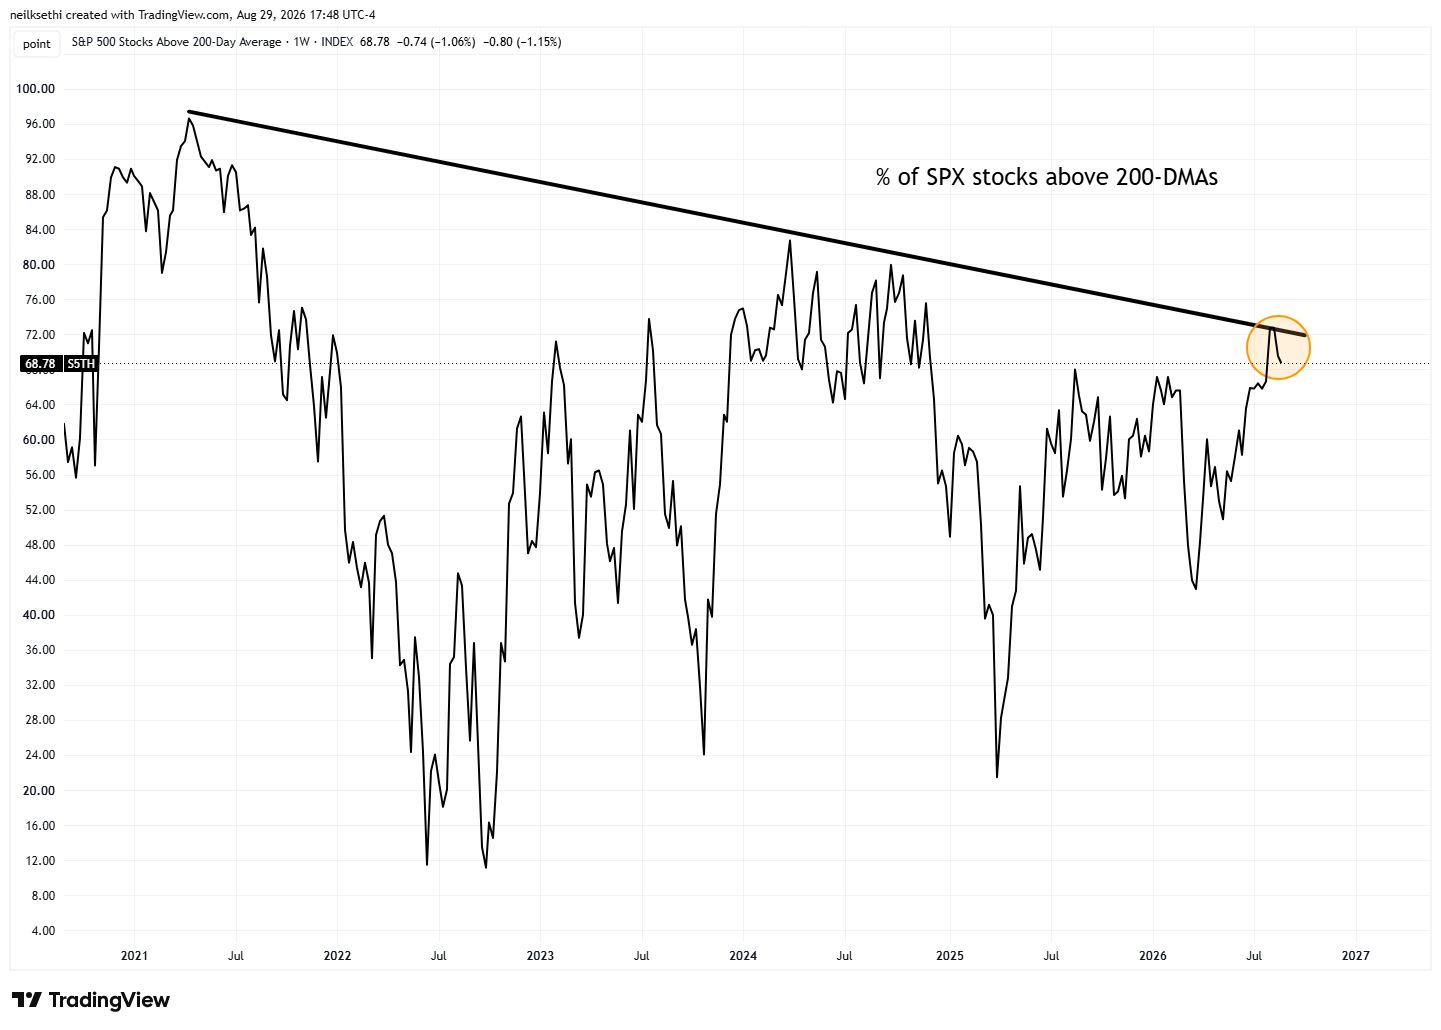
While SPX percent of components above their 200-DMAs fell further from the weekly trendline from 2021.
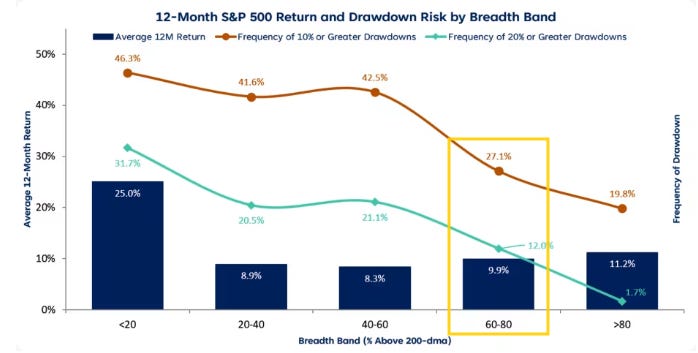
MarketWatch: Adam Turnquist, chief technical strategist at LPL Financial, notes though that with 69% of SPX members above their 200-DMA, historically that’s been associated with a solid 10%+ return with a low risk of drawdown (under 27% for 10% drawdown, under 12% for 20%).
While shorter-term 20-DMAs saw more deterioration with the NYSE the least since June.
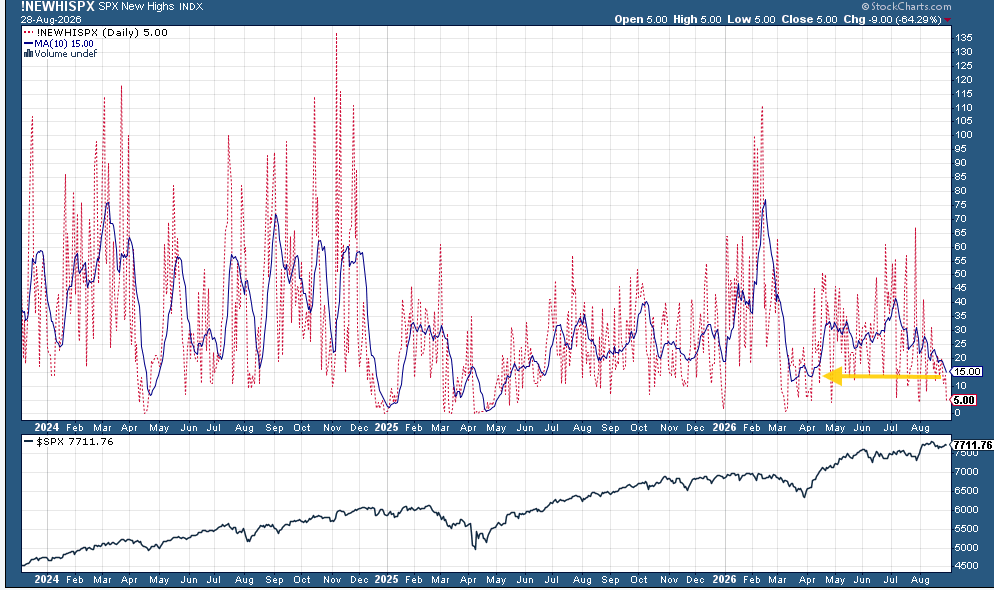
SPX new 52-week highs minus new lows deteriorated to just 5 Friday, the joint least since April with the 10-DMA (blue line) also falling to the least since April (15).
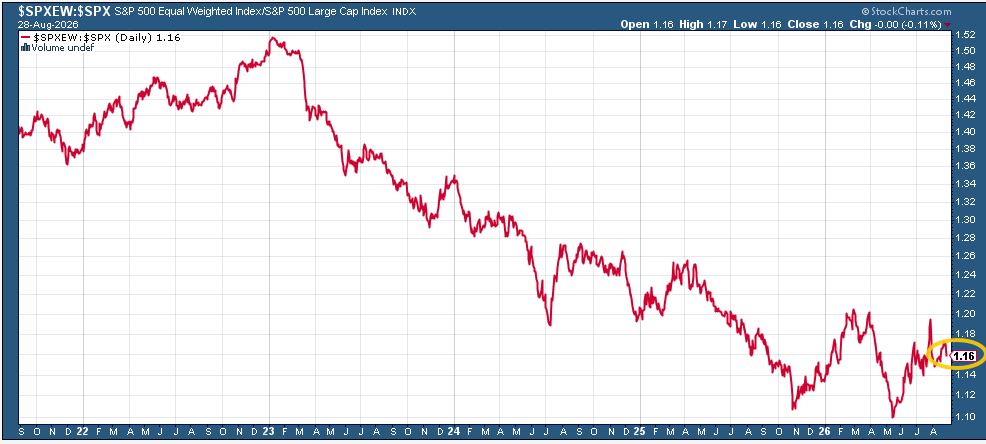
And the ratio of the equal-weight SPX to the cap-weighted remained in its range over the past month.
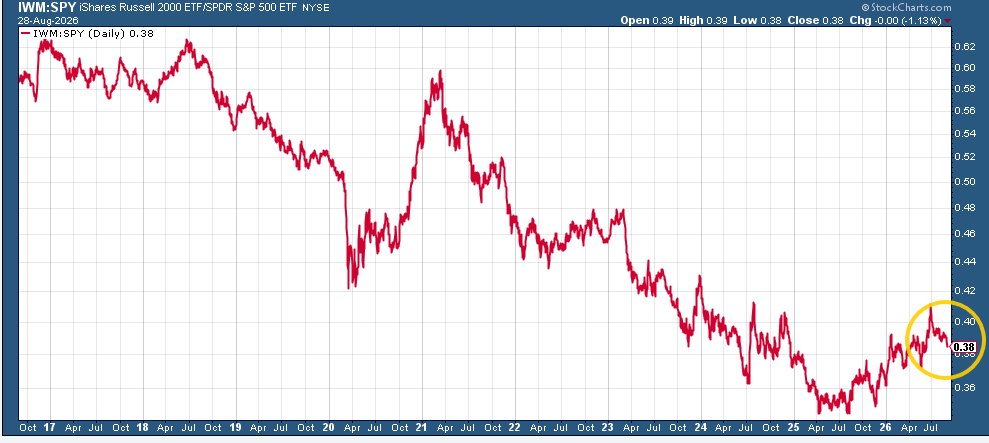
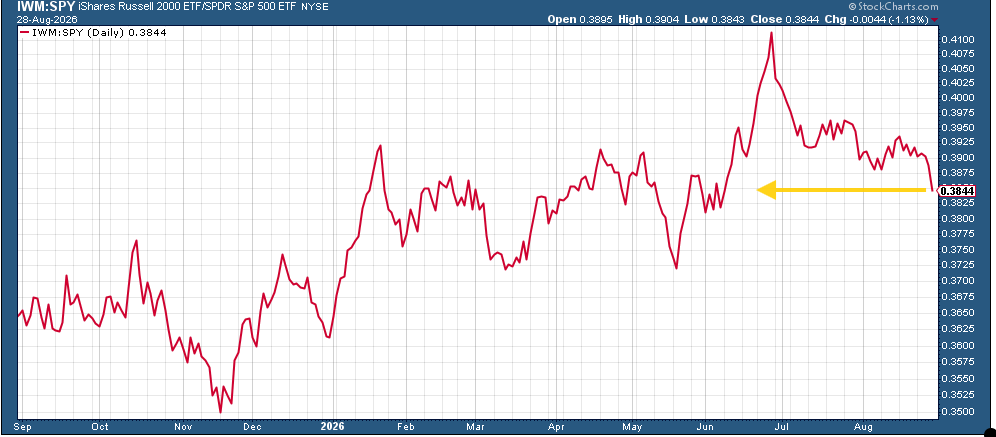
But the ratio of small caps to large caps (Russell 2000 to SPX) fell to the least since June.
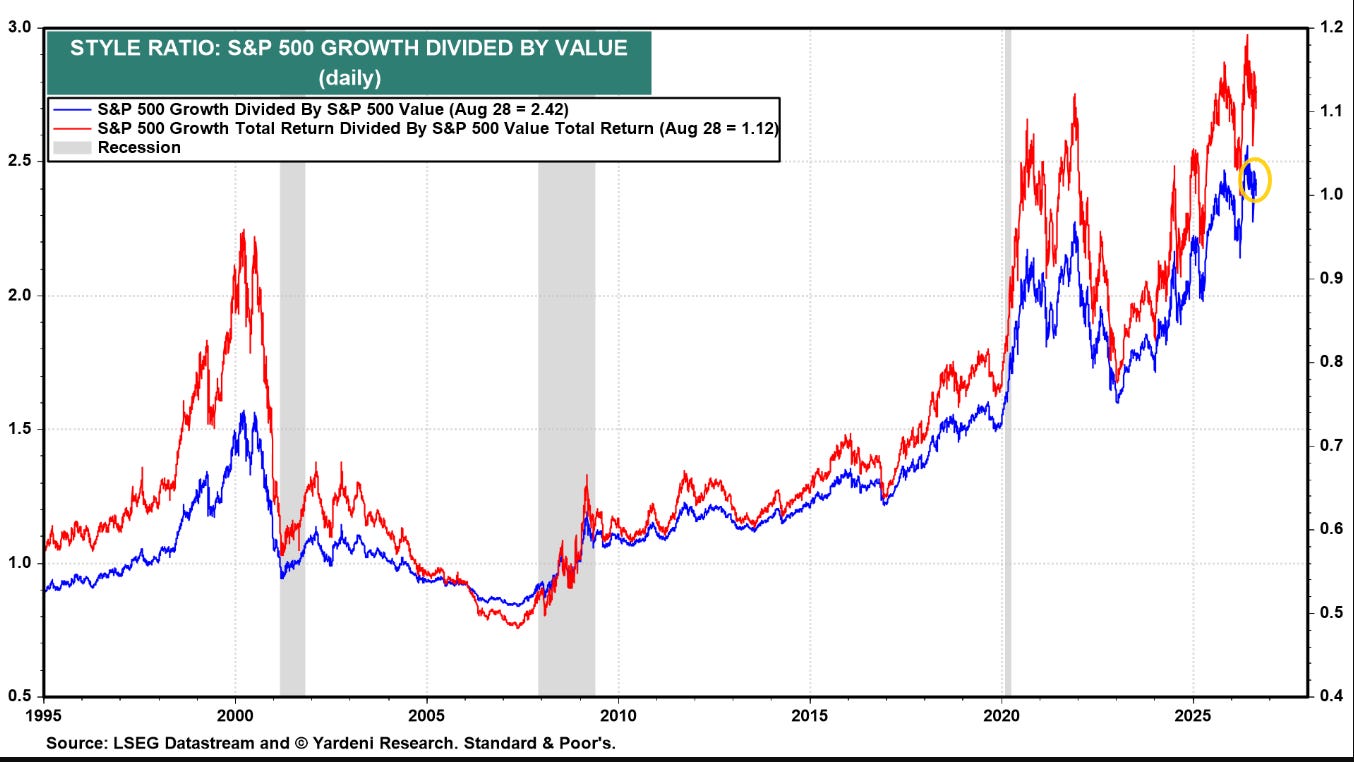
While S&P 500 growth/value edged up to 2.42 remaining above the 2.35 five weeks ago, which was the least since early May, but also still down from its all-time high of 2.52 hit at the end of May.
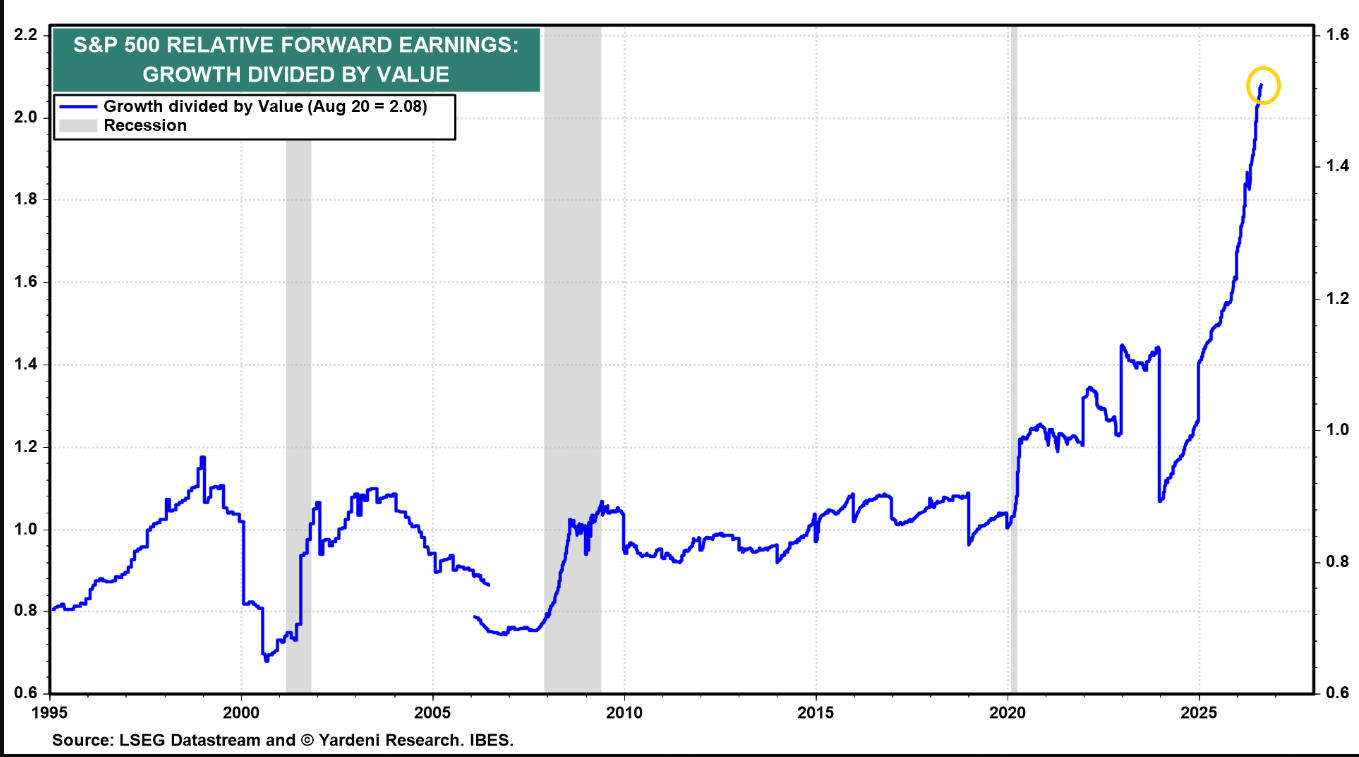
As the ratio of forward earnings for growth/value remained at an all-time high at 2.08.
Positioning/Flows
Turning to equity market positioning, after dropping back in July, positioning continued to rebuild.
Deutsche Bank:
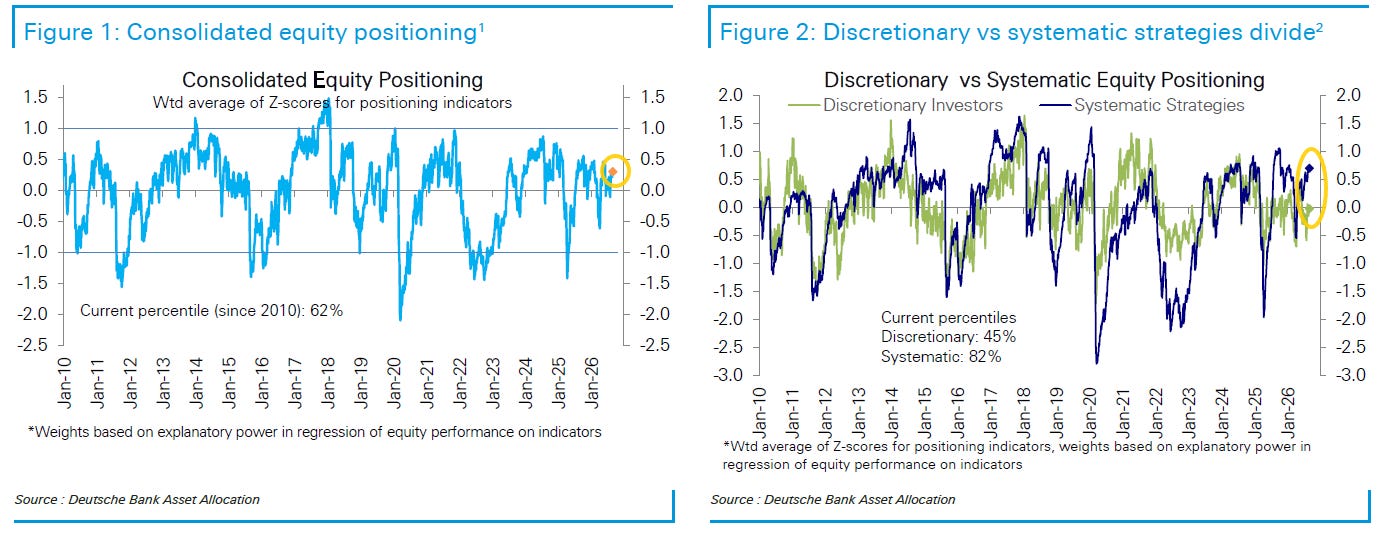
Our measure of aggregate equity positioning ticked up this week and remains modestly overweight at 0.30 standard deviations, or the 62nd percentile.
Discretionary investor positioning rose slightly to near-neutral, at -0.02 standard deviations and the 45th percentile.
Systematic-strategy positioning edged higher and remained overweight at 0.70 standard deviations, or the 82nd percentile.
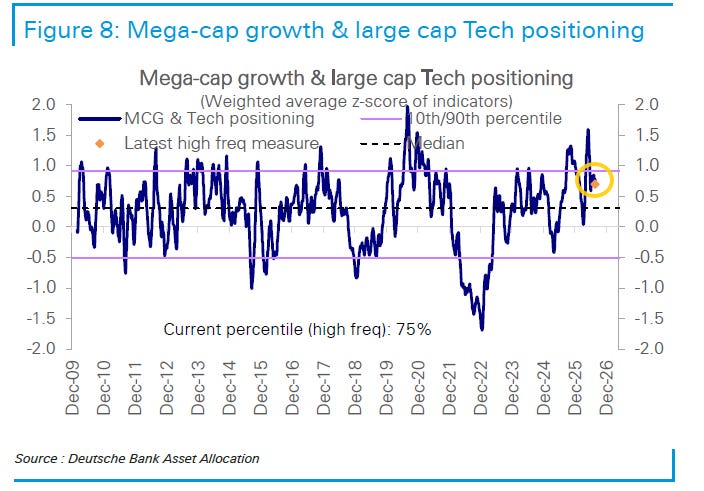
Large-cap Tech positioning continued to chop around overweight but not elevated levels, at the 75th percentile, while its relative performance versus the rest of the S&P 500 sits in the middle of its long-run trend channel.
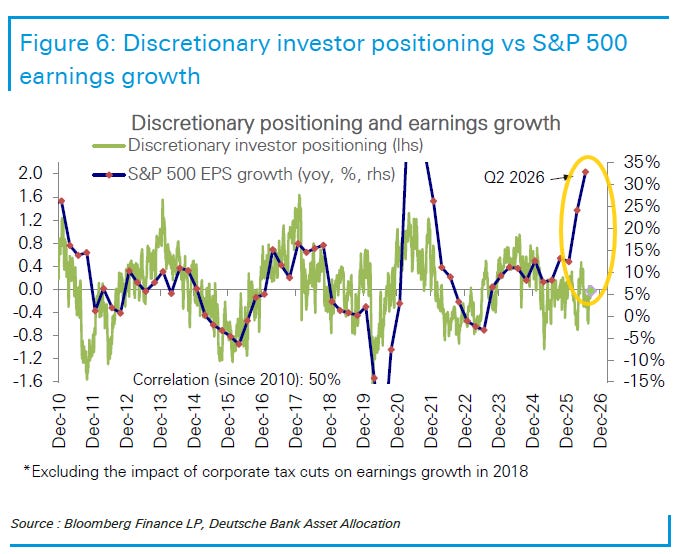
Discretionary equity positioning remains well below the level implied by booming earnings growth.
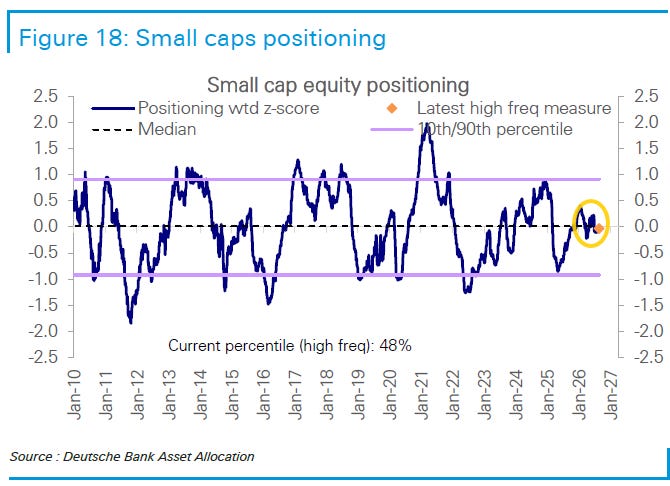
Small-cap positioning hovered just below neutral at -0.03 standard deviations, or the 48th percentile.
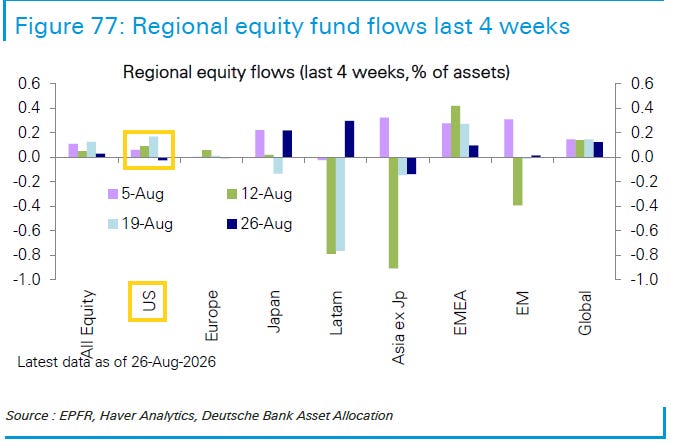
This week also saw the first outflows from US equity funds in five weeks, totaling $4.4 billion. By contrast, broad-global funds saw $9.9 billion of inflows, Japan funds received $2.7 billion, and broad emerging-market funds attracted $2.3 billion.
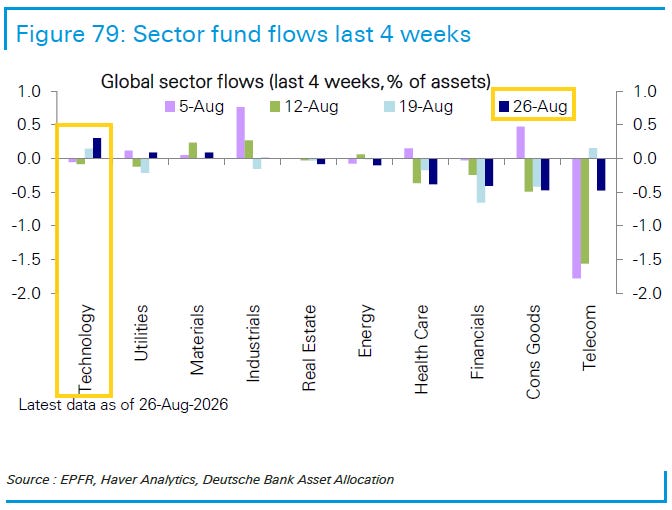
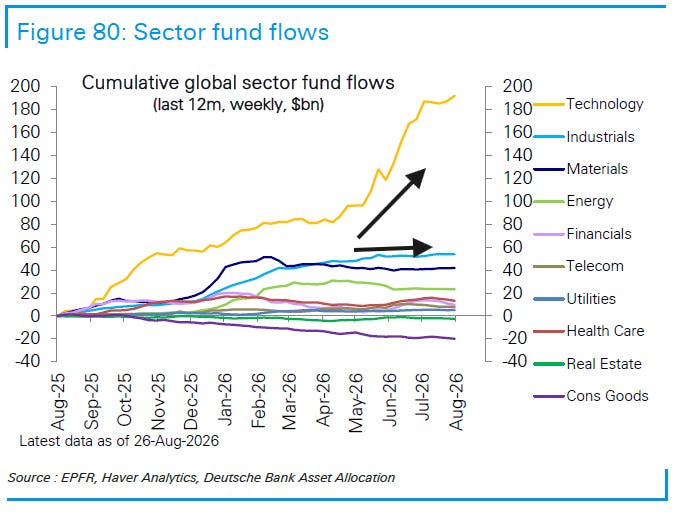
At the sector level, Tech received strong inflows of $4.6 billion, while most other sectors saw outflows, led by Financials at $1.2 billion, Healthcare at $1.1 billion, and Consumer Goods at $0.6 billion.
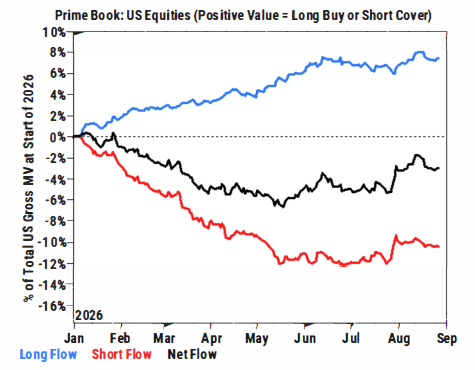
That continues a pattern that’s been going on most weeks this year with few sectors outside of industrials making much if any headway on inflows while Tech rockets higher.
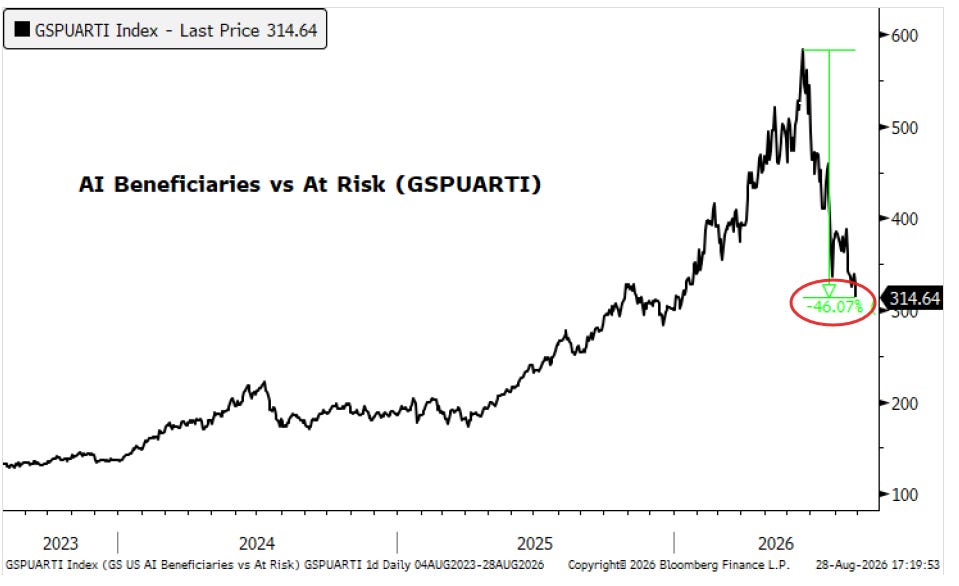
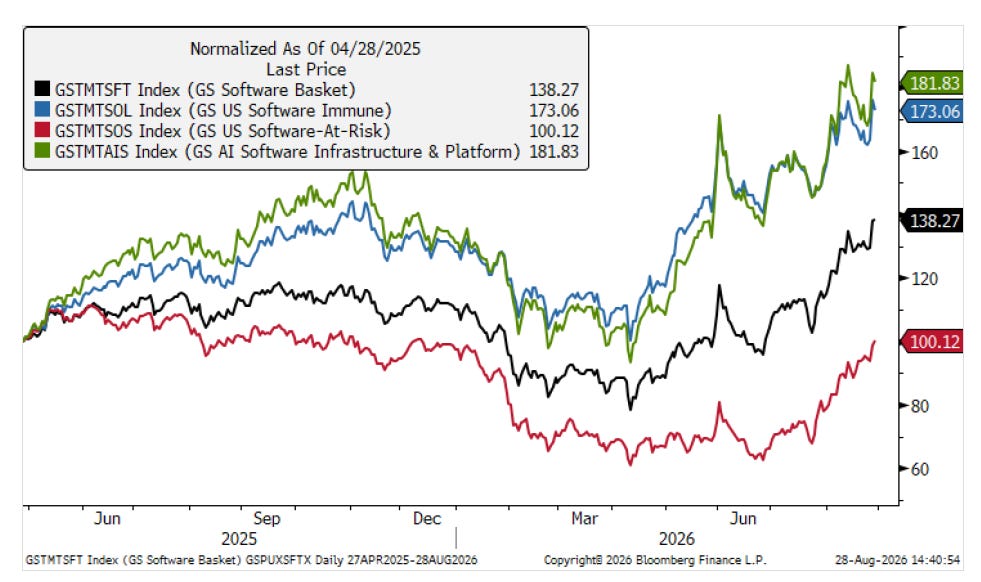
Goldman notes though of late that Tech buying has been more concentrated in the “AI at risk” bucket vs the “AI Beneficiaries” with the pair trade (short the former vs long the latter) down 46% from the highs:
Led by software:
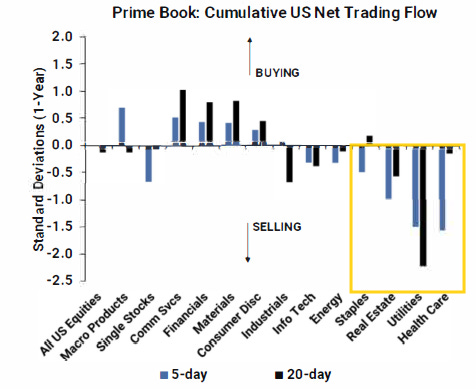
In terms of last week’s Flows Goldman says “US equities saw little net activity on the week” but they note “all defensive sectors (Health Care, Utilities, Staples) were net sold on the week and together saw the largest $ net selling since Apr ‘25, and 2) Health Care was the most net sold US sector in both $ and SD terms (-1.6 SDs 1-year), driven by short-and-long sales (1.1).
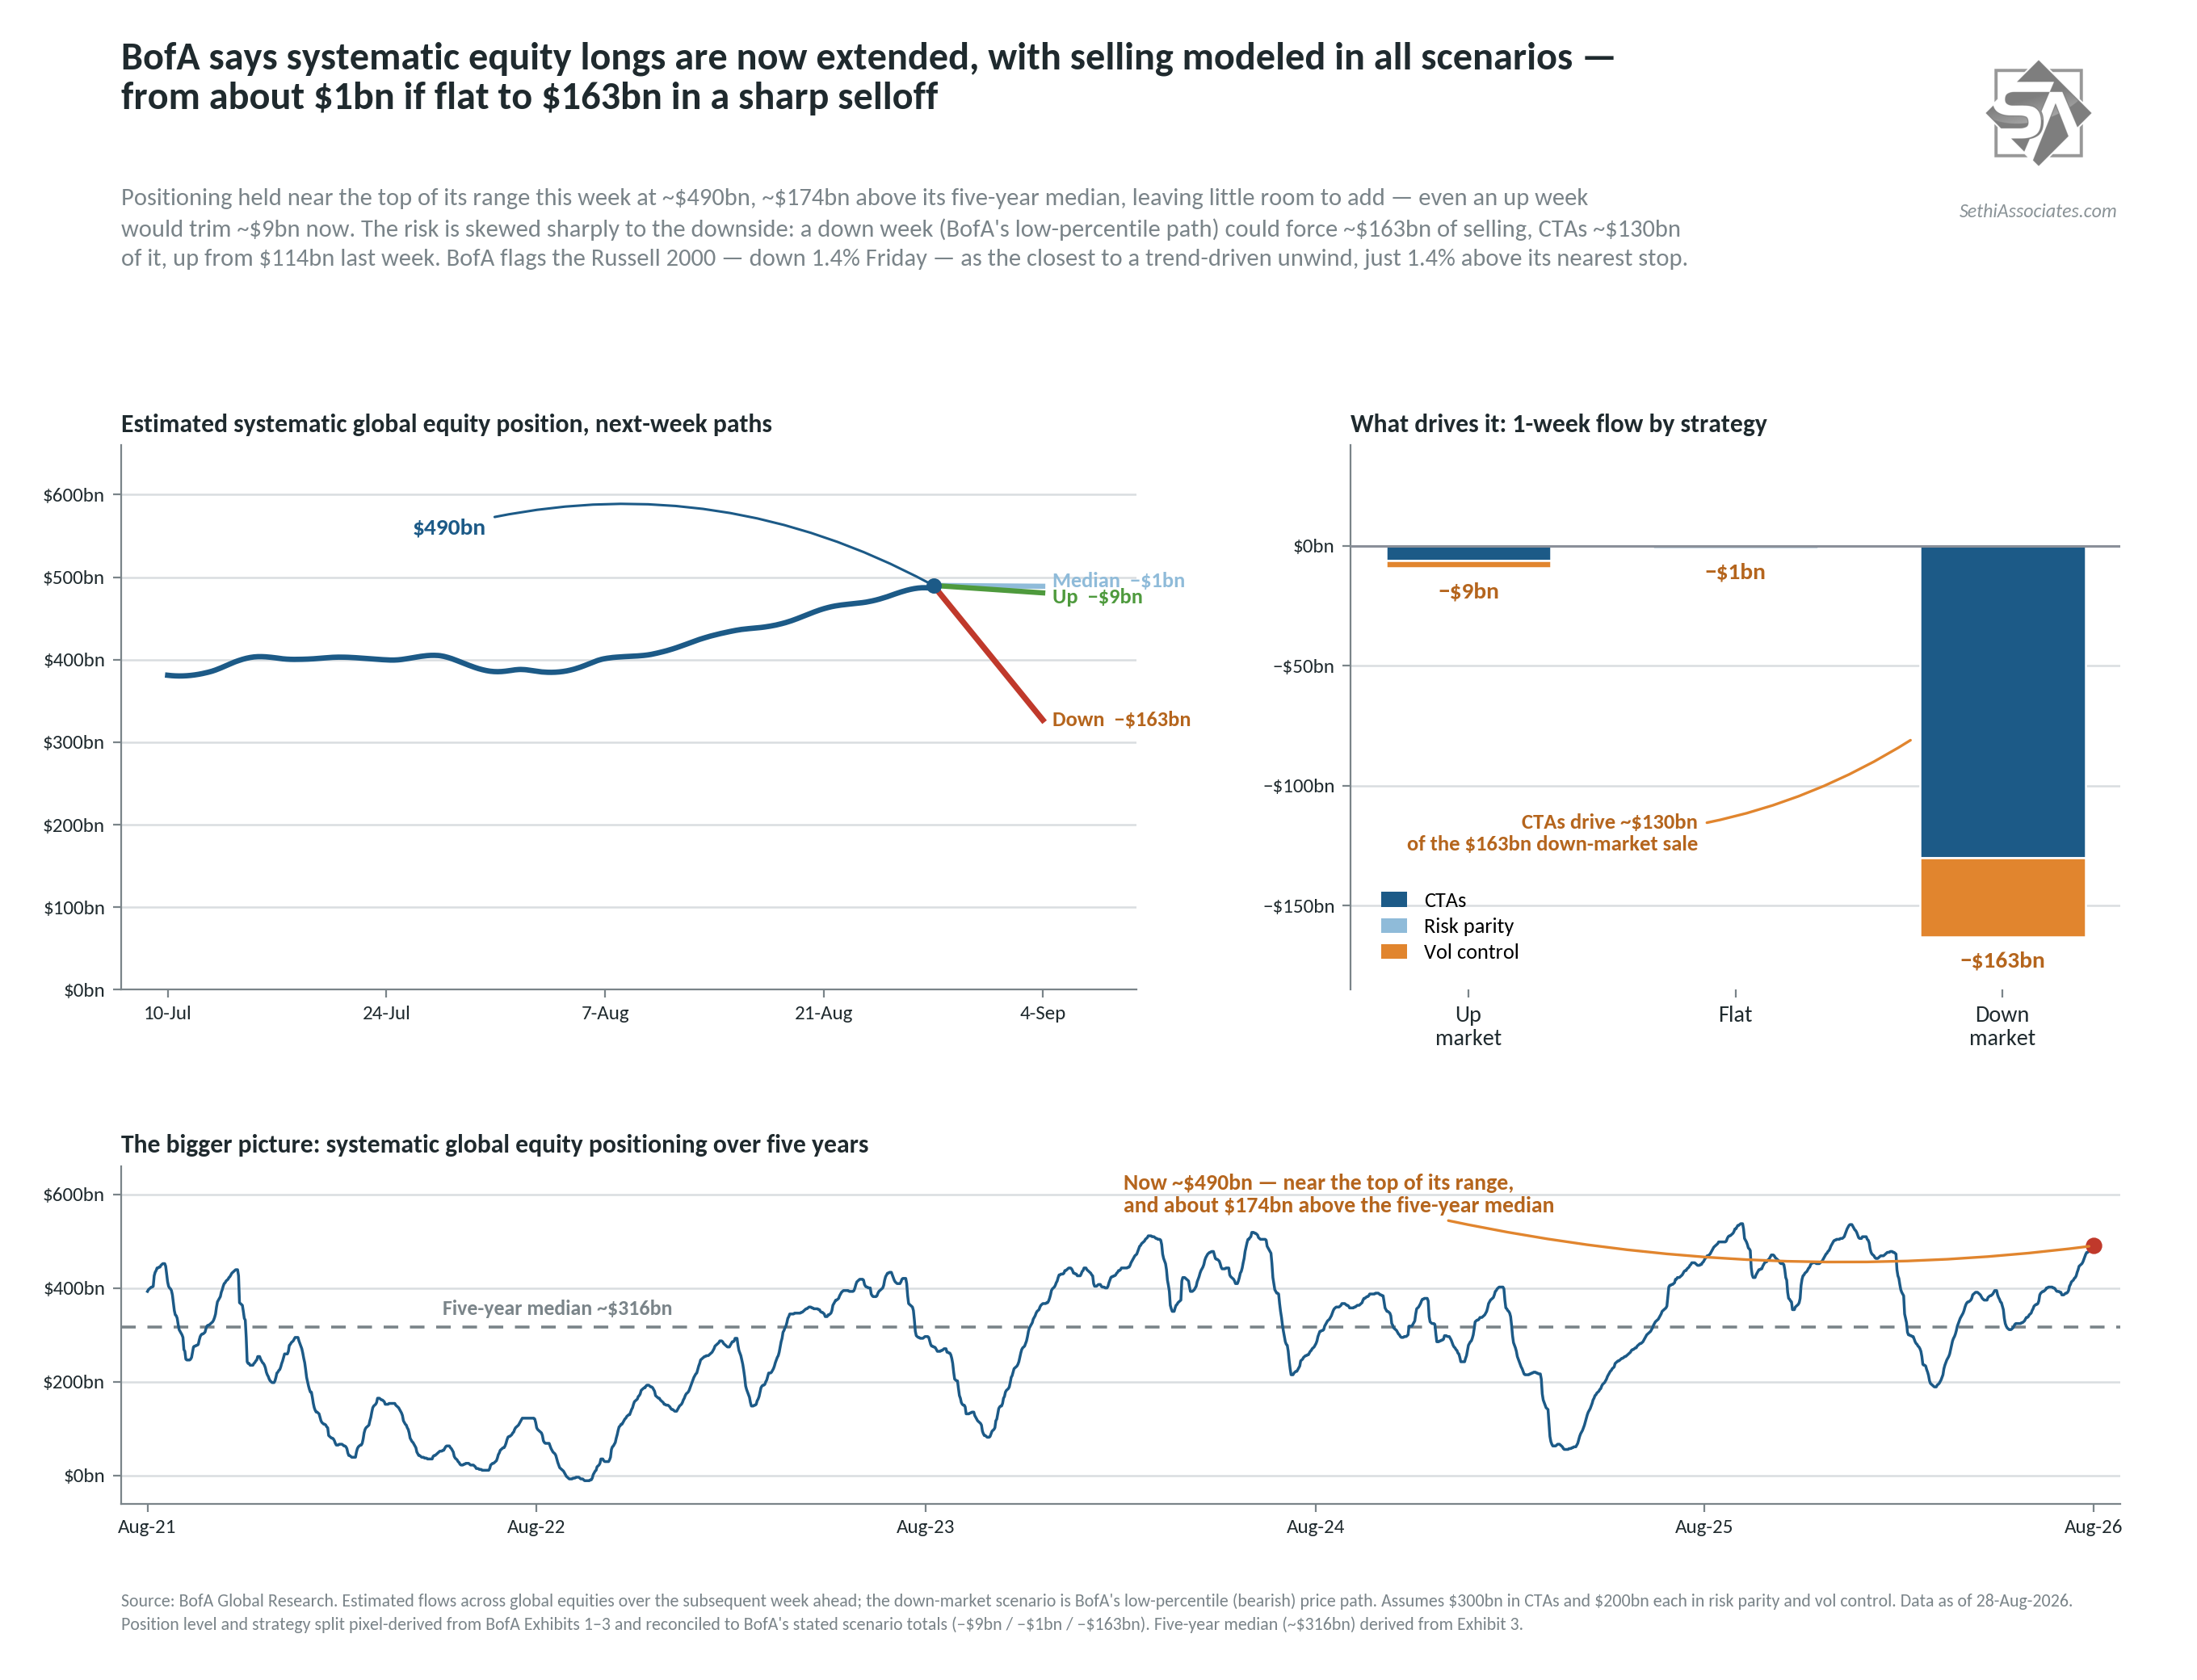
BofA for its part (note these are global flows) sees overall systematic positioning as having relevered further, now nearing the top of its 5-year range. And for the first time in a month they are now biased to sell in all scenarios, although very modestly outside of a significant move to the downside. The first sell triggers on the SPX, NDX, and RUT are ~-2%, -4%, and -1.4% respectively.
Specifically they see:
−$1B of selling in a flat market (from +$22B of buying the prior week);
−$9B of selling in an “up” market (from +$5B; “up market” defined as 97.5th percentile price path or ~+3.5% similar to Goldman); and
−$163B of selling in a “down” market (from −$114B last week and −$96B the prior week; “down market” defined as the 2.5th percentile price path or ~−2.9% (different than Goldman who uses −4.5%)).
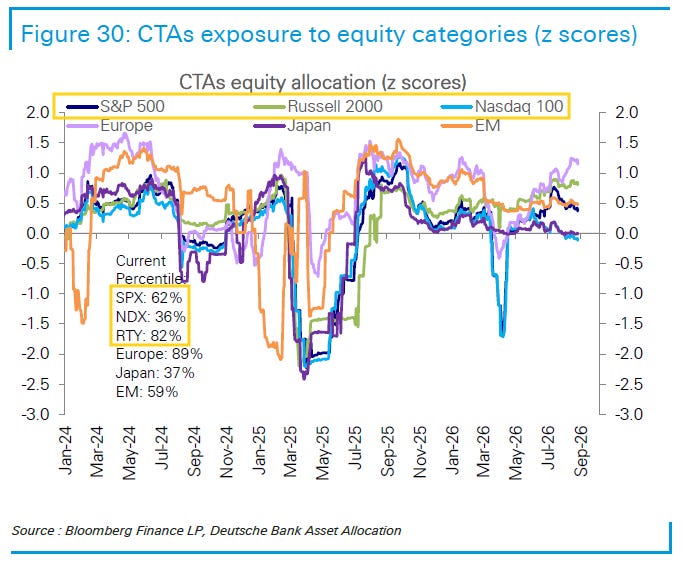
DB though sees CTA positioning differently edging back with the US at the 61st percentile (since 2009) still down from the 66th four weeks ago, with the Nasdaq-100 continuing to remain at just the 36th while SPX and RUT are at the 62nd and 82nd respectively.
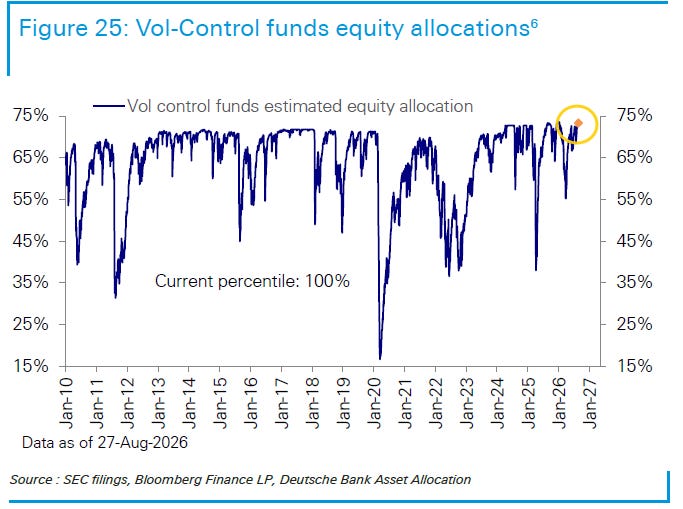
Vol control positioning (vol control strategies enter and exit based on changes in volatility over past windows (mostly 1-month and 3-month)) are in contrast to their estimates on CTAs now at “historical maximums (100th percentile).” from the 67th four weeks ago:
This stretched positioning limits the potential for further equity additions and creates a highly asymmetric flow backdrop should volatility rise.
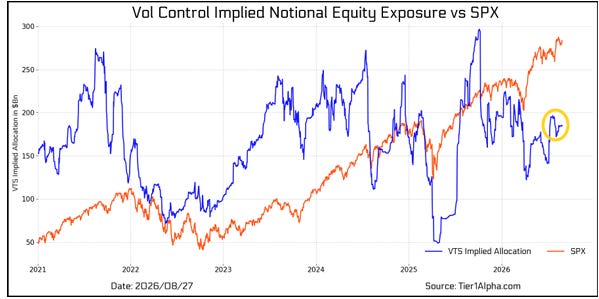
Tier1Alpha as a reminder sees vol control positioning as less extended but also with limited upside for increasing positioning:
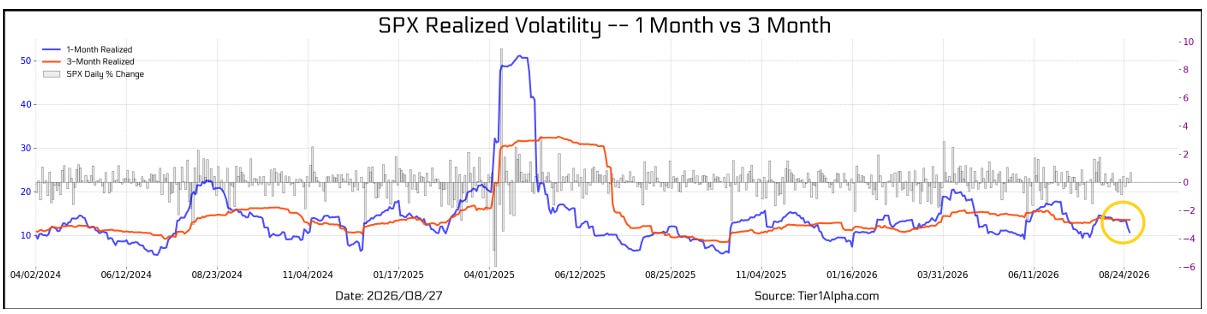
The more important development is that 1-month realized volatility has now fallen back below the 3-month measure, shifting the 3-month reading into the primary volatility input for funds that deploy volatility scaling as a way to manage risk. Because the longer-dated measure adjusts more slowly to day-to-day changes, these strategies should now be even less responsive to changes in short-term volatility. As a result, we expect systematic flows from this group to remain limited, with a more meaningful change in positioning likely requiring a sustained move in volatility large enough to materially shift the 3-month input.
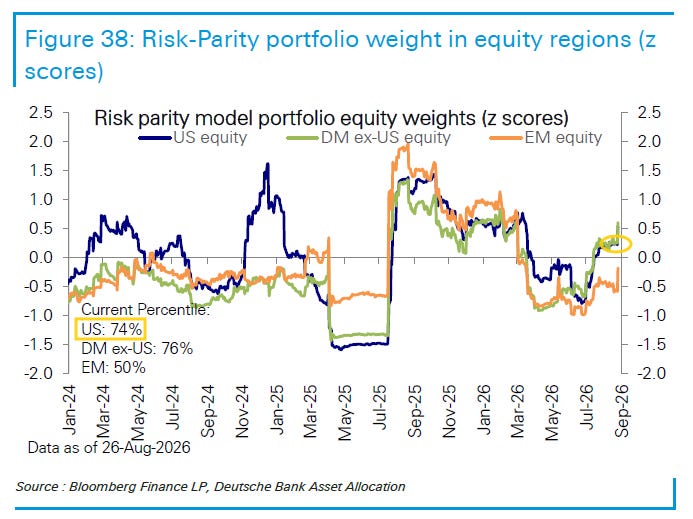
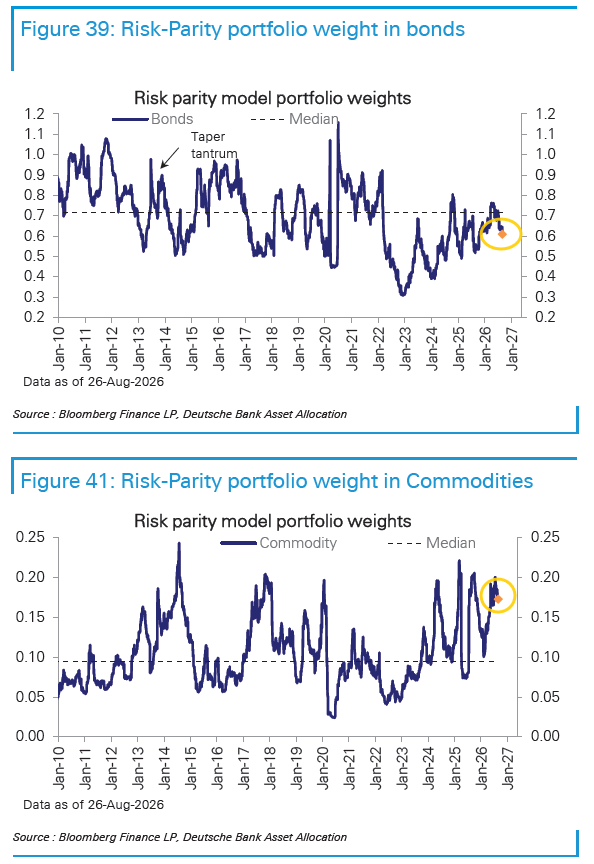
While for risk parity DB says equity positioning “increased this week” with the US rising to the 74th percentile from the 67th percentile. That leaves it overweight.Bond exposure dropped to the 31st percentile (from the 46th) while commodities remain elevated at the 91st (“elevated”) though down from the 96th two weeks ago.
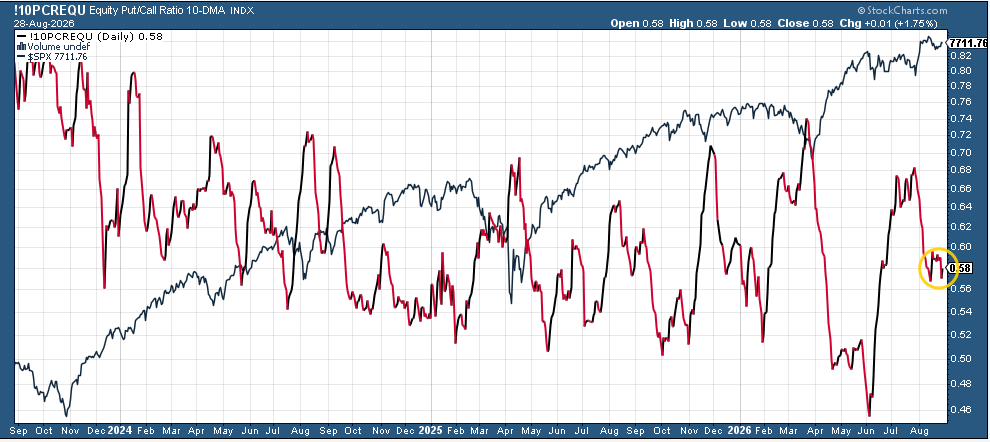
While call buying (which adds incremental upside pressure) remains in the middle of its range this year.
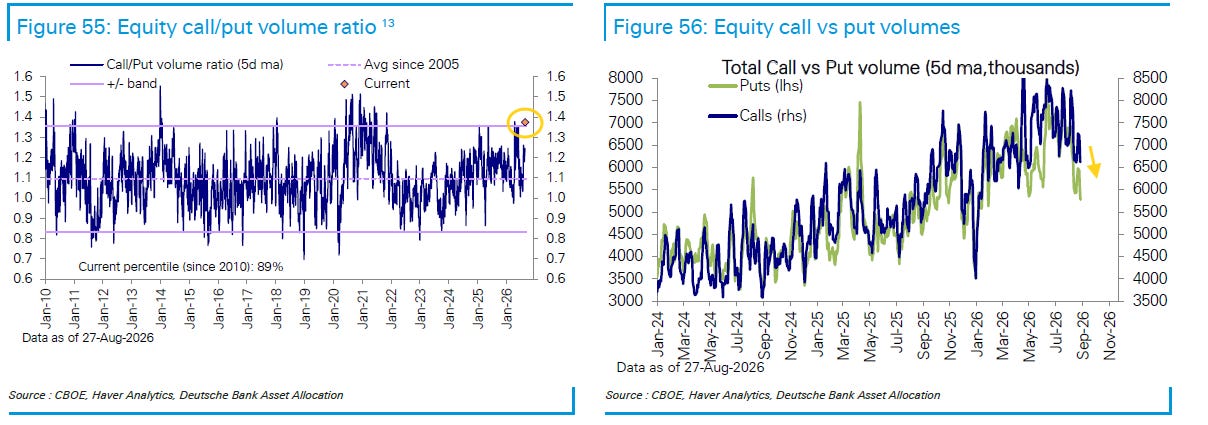
DB similarly saw call buying fall back but put buying even more driving the ratio to a 5-year high (89th percentile to 2010):
Like call buying,leveraged positioning acts as a “negative gamma source” as Charlie McElligott has put it (meaning that there is added buying/selling pressure from them in the direction of daily flows as they rebalance each day).
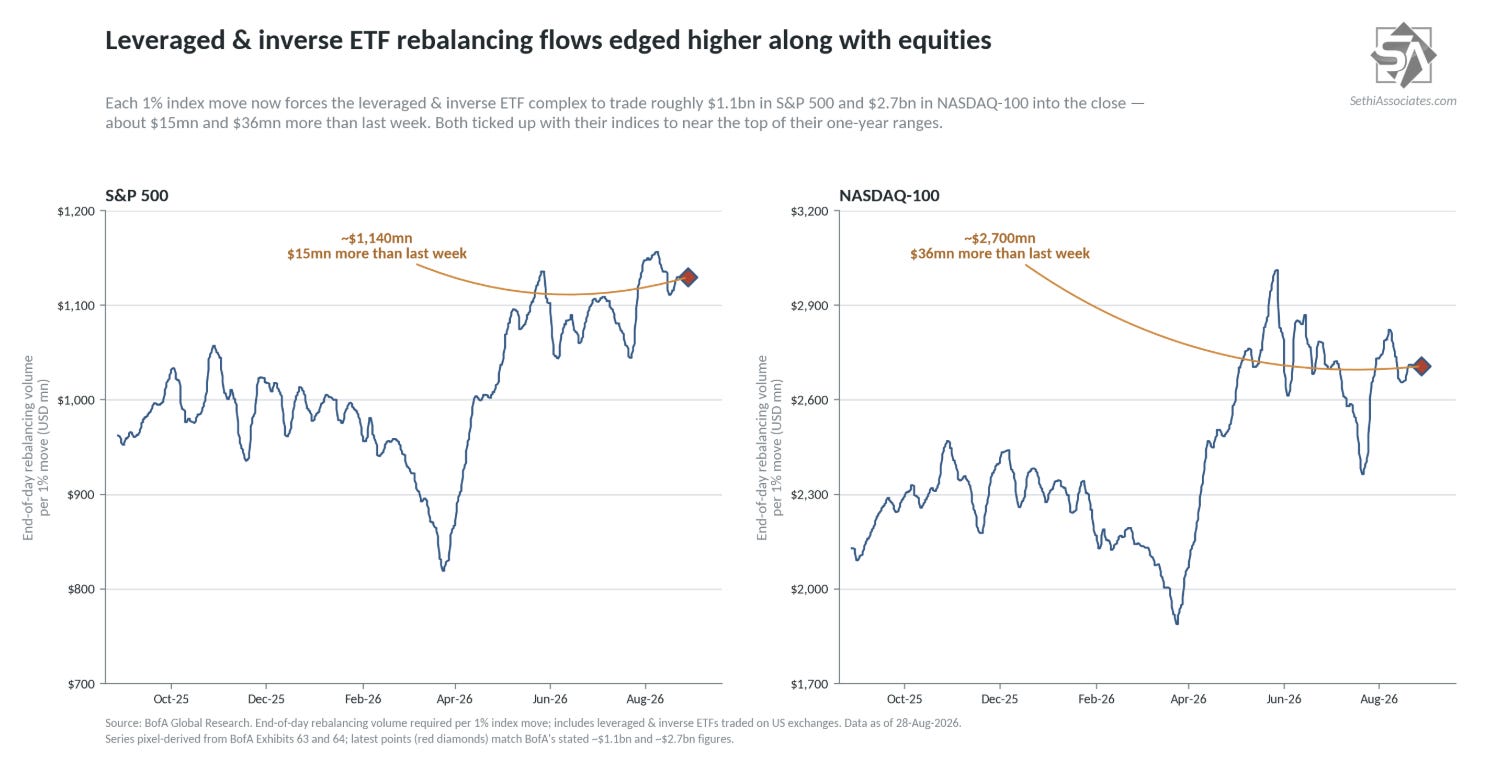
Positioning in Nasdaq-100 and SPX leveraged ETFs edged higher for the third week in four after having dropped sharply at the start of August.
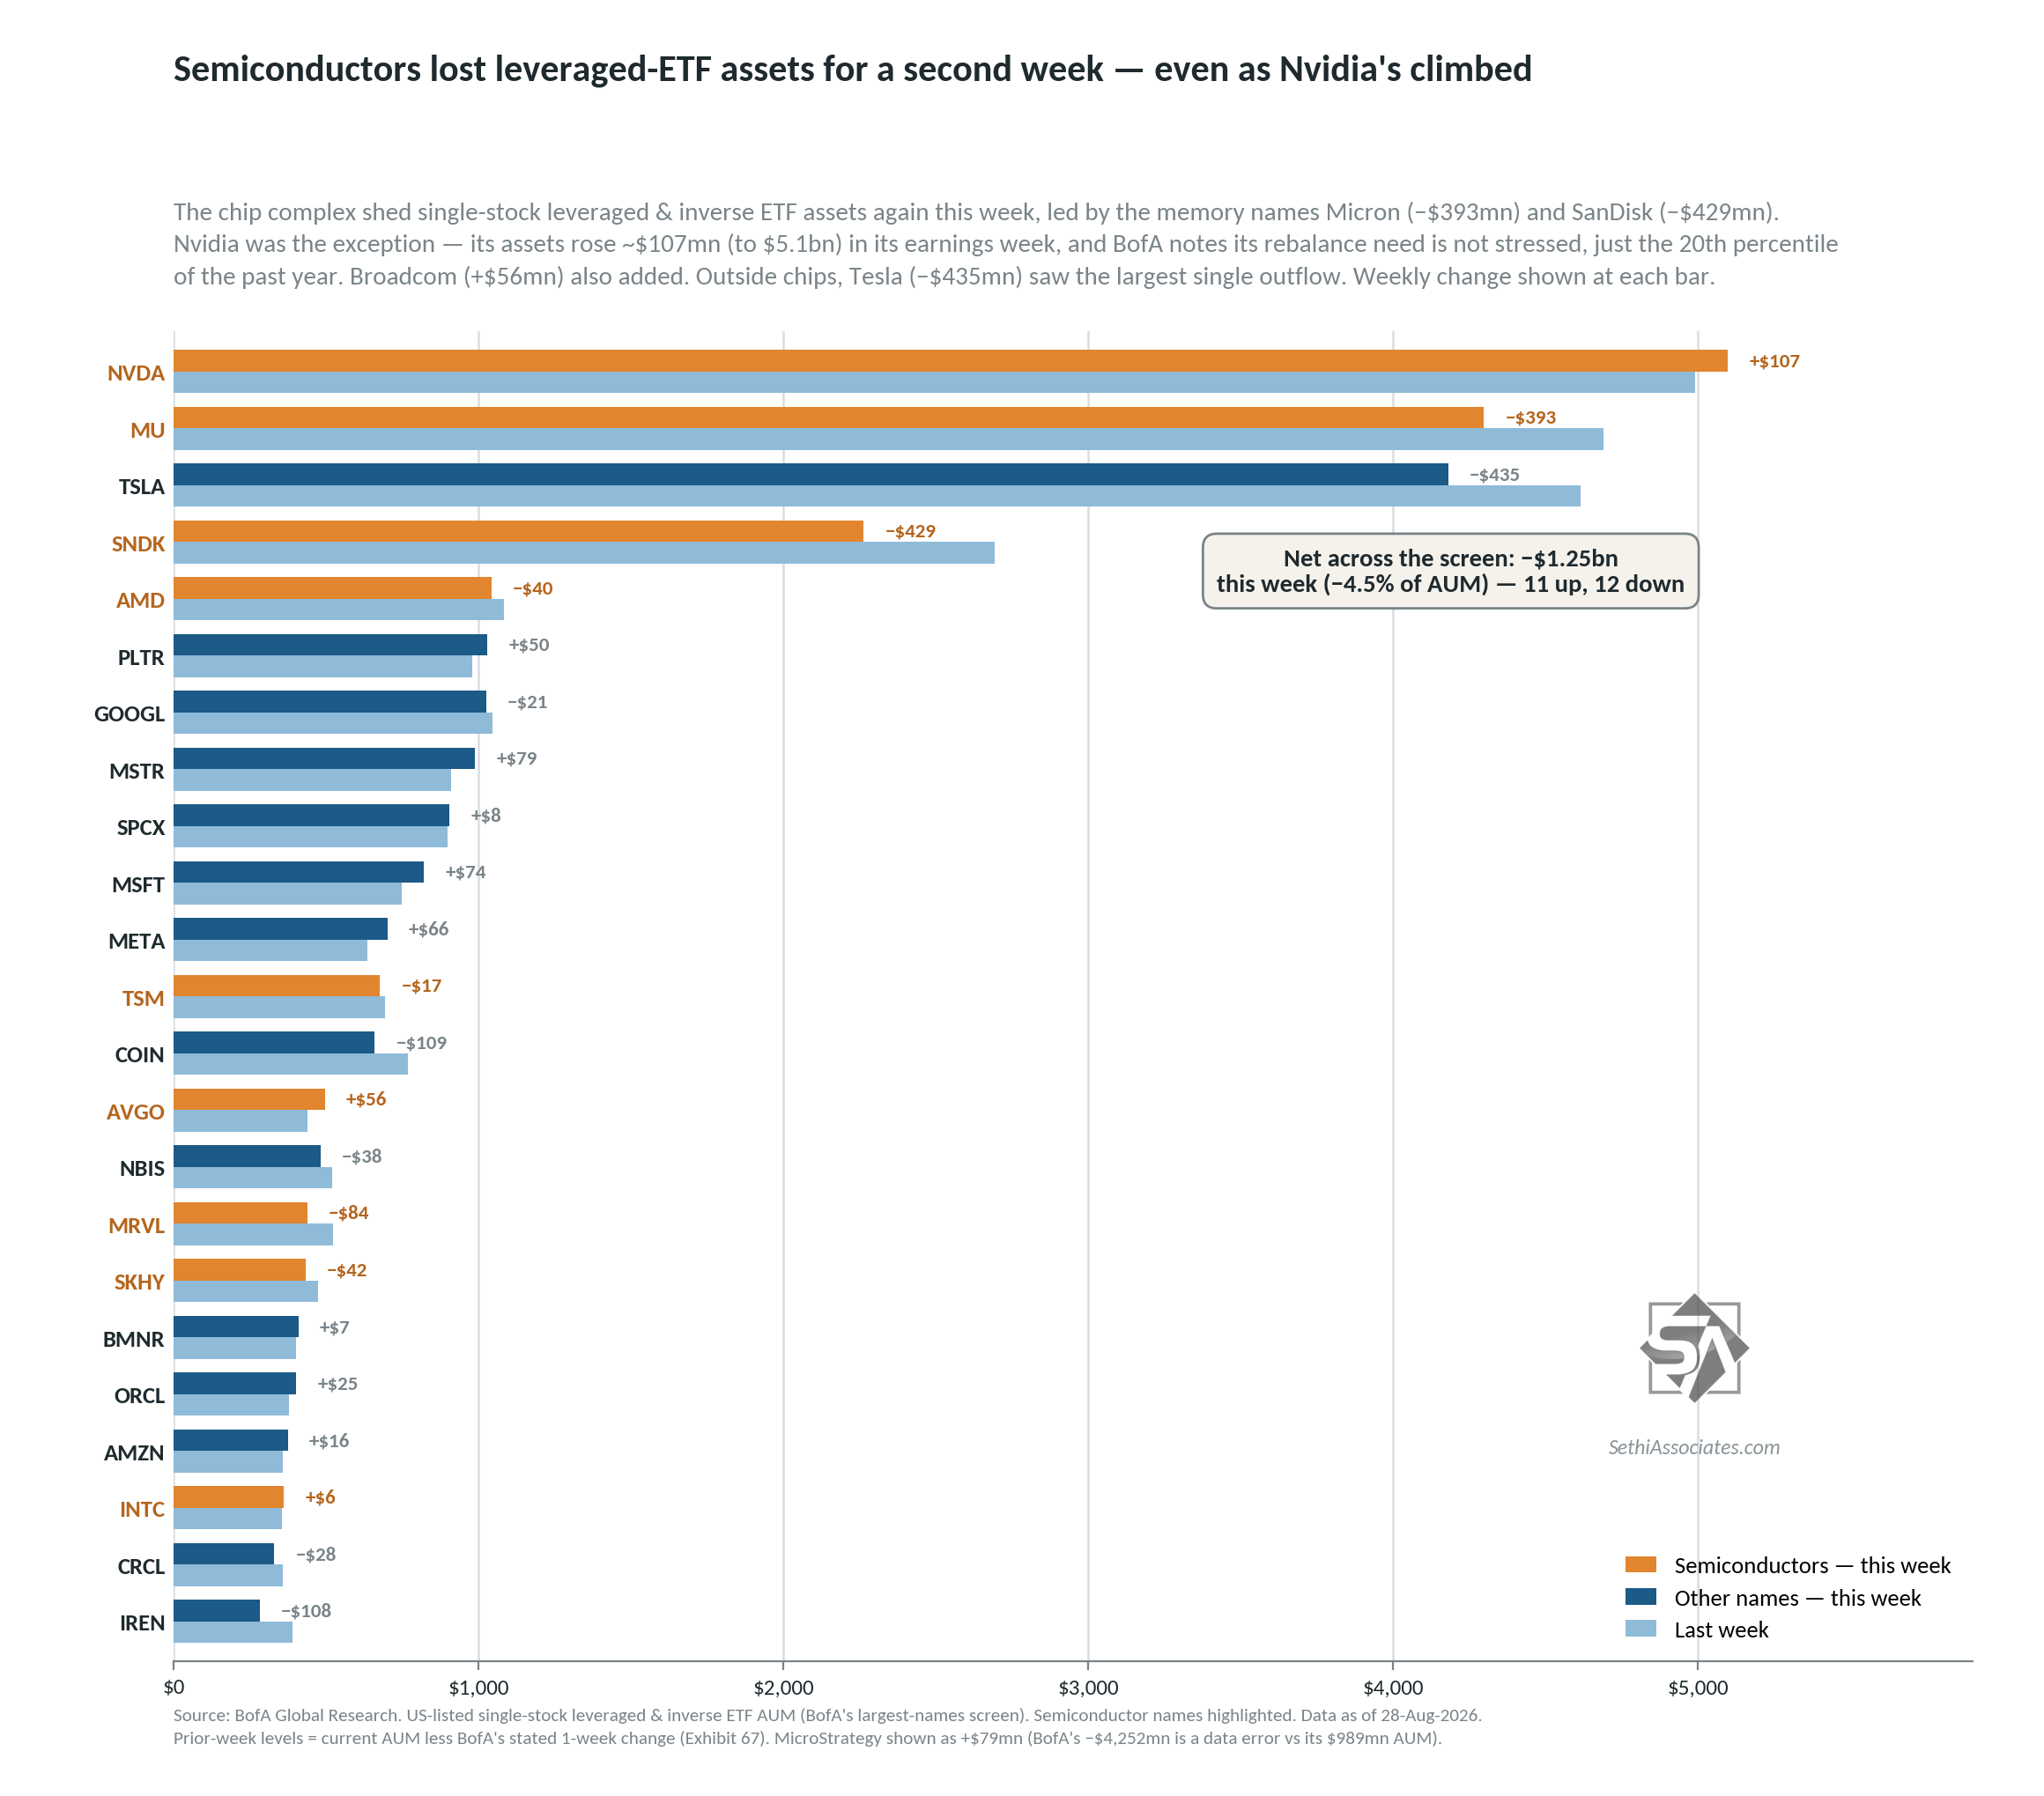
Single-stock leveraged ETF AUM collectively edged lower led by continued declines in semiconductor names despite Nvidia leveraged ETFs adding some AUM following its blowout earnings report.
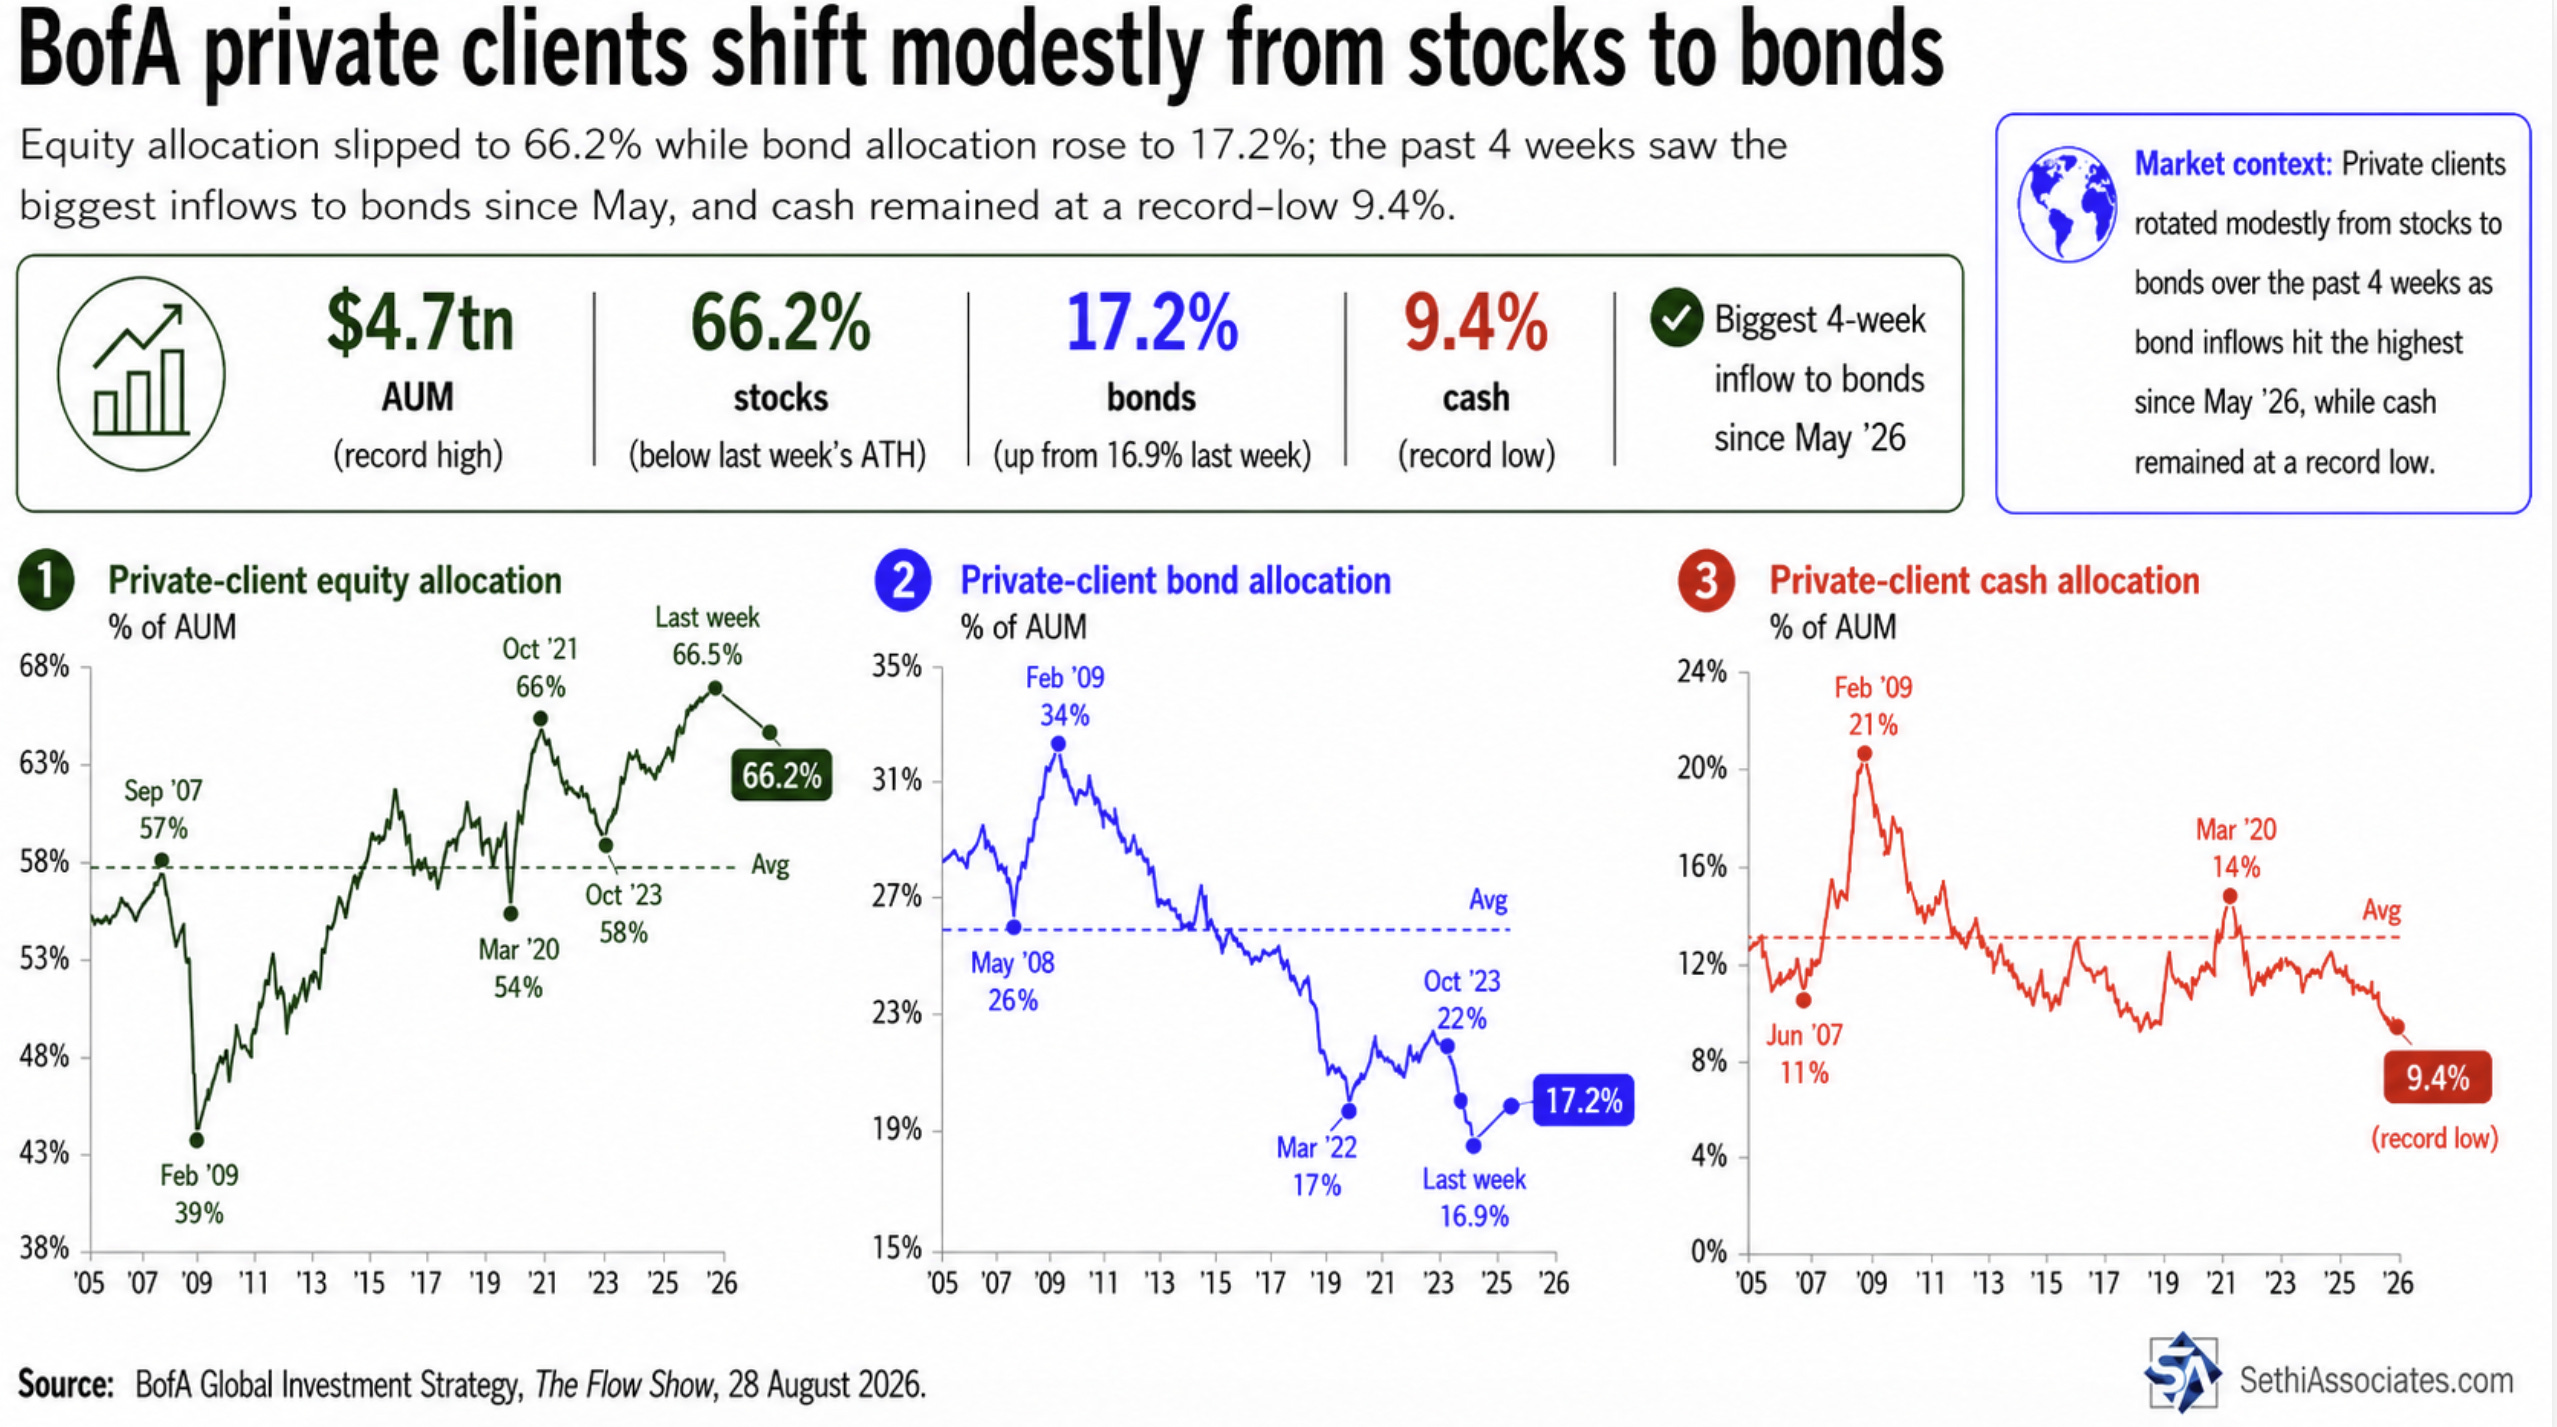
BoA client retail equity positioning reflected continued rebuilding with AUM in stocks increasing to 66.5% (up +0.1% w/w) to an all-time high after the largest inflow since Sept 2022 the prior week, 16.9% in bonds (-0.1% w/w to the lowest since Mar ‘22), while cash remained at 9.4% a record low.
Turning to gamma:
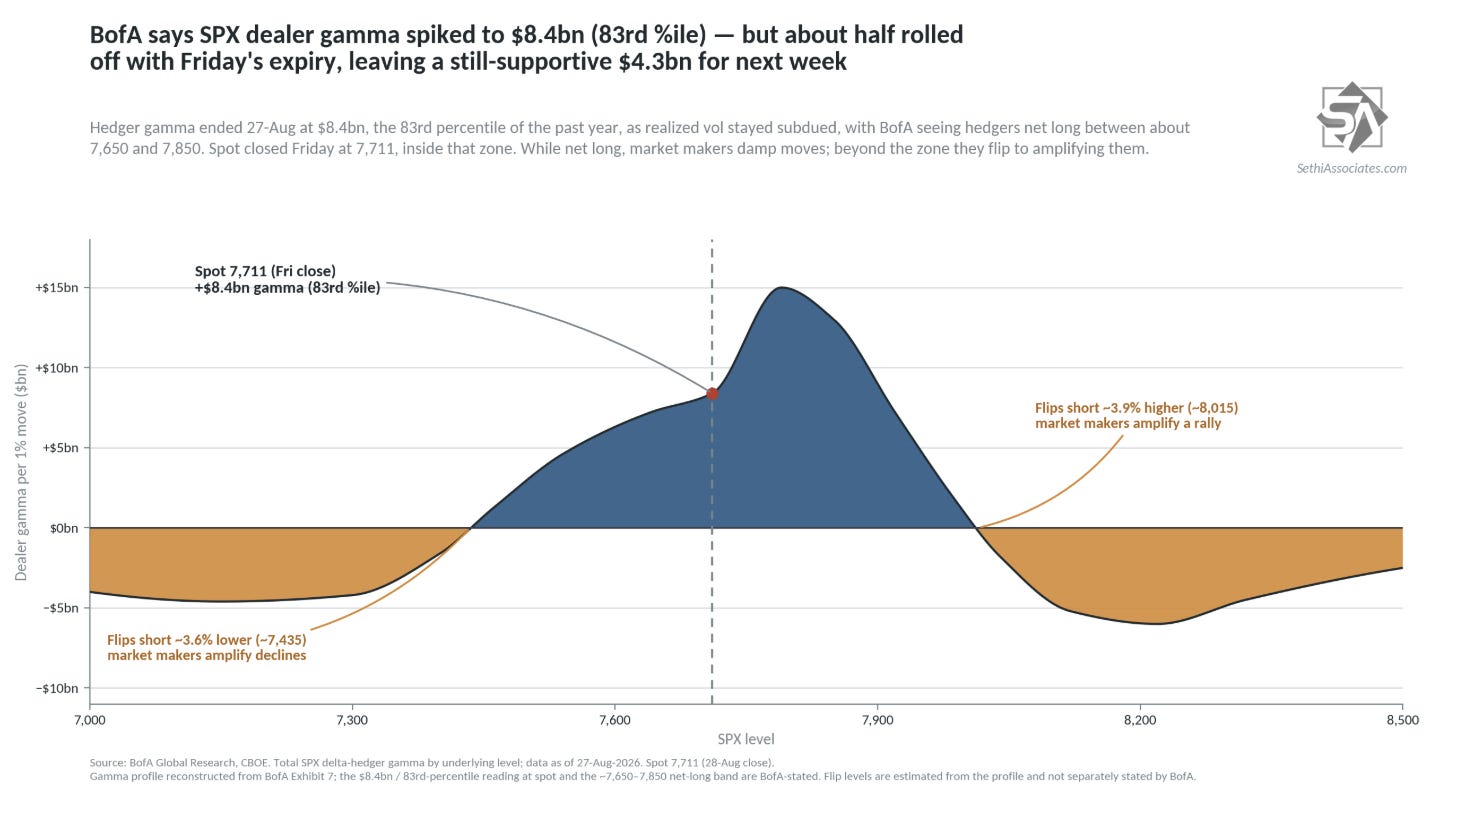
BoA saw gamma as of Thursday increasing to $8.4B (83rd one-year percentile) from $3.2B (39th) the prior week although $3.1B was to hedge Friday. They estimate $4.3B will remain on Monday leaving positioning “well supported” and dampening volatility. As a reminder, positive gamma means that options market makers will buy/sell in the opposite direction of moves.
Tier1Alpha’s update was also as of Thursday night and they also say
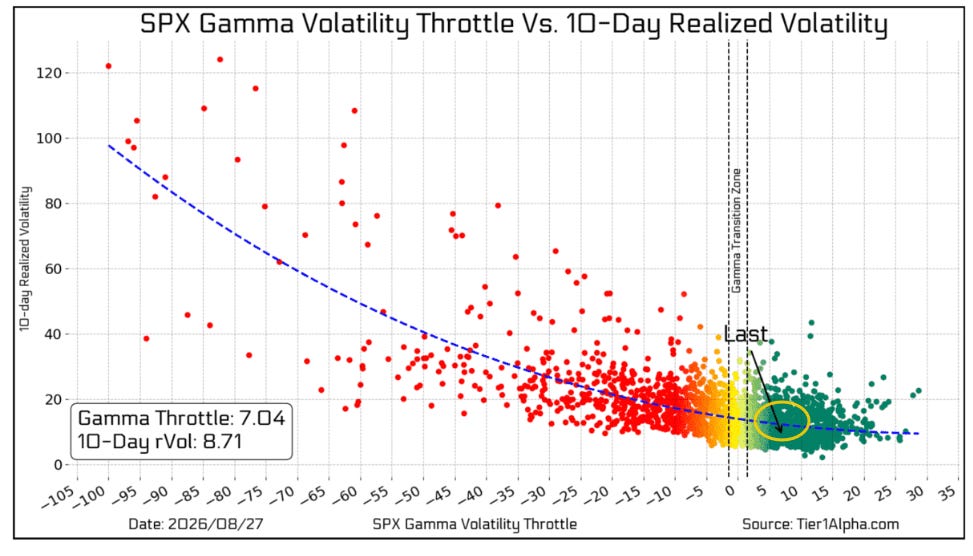
Market makers have shifted back into positive gamma territory, indicating that the conditions for lower volatility are back in play. Our GVT index has risen to 7.04, with a corresponding 10-day realized volatility of 8.71, slightly below its historical average. While positioning has improved since last week, we expect dealer flows to become more meaningful around the 7750 strike and above, given that is where the bulk of the more robust gamma exposure currently sits.
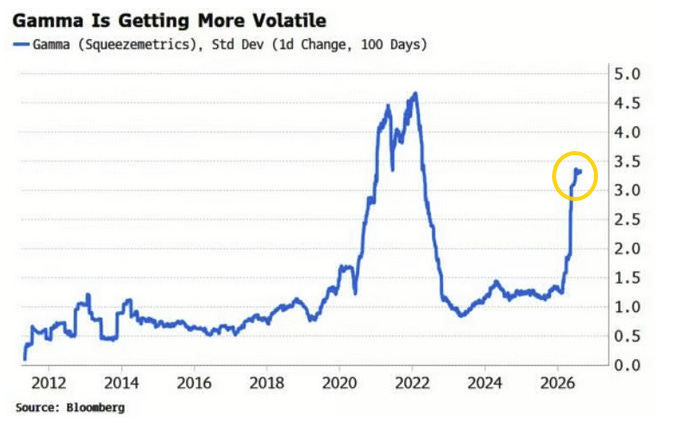
While BBG’s Simon White notes gamma has become more volatile this year:
“Gamma is positive and relatively high at the moment, but what is notable about this year is how volatile it has become. It has only been more changeable in the period after the pandemic, 2020-22.
“That means dealers’ hedging needs are turning on a dime more frequently, and thus dealers are more likely to rapidly switch from vol dampeners to vol accelerators, leaving low correlations at greater risk of shocking higher.
“That can happen with stocks rallying or selling off, but history shows rallies with rising correlations and negative gamma are the less common.”
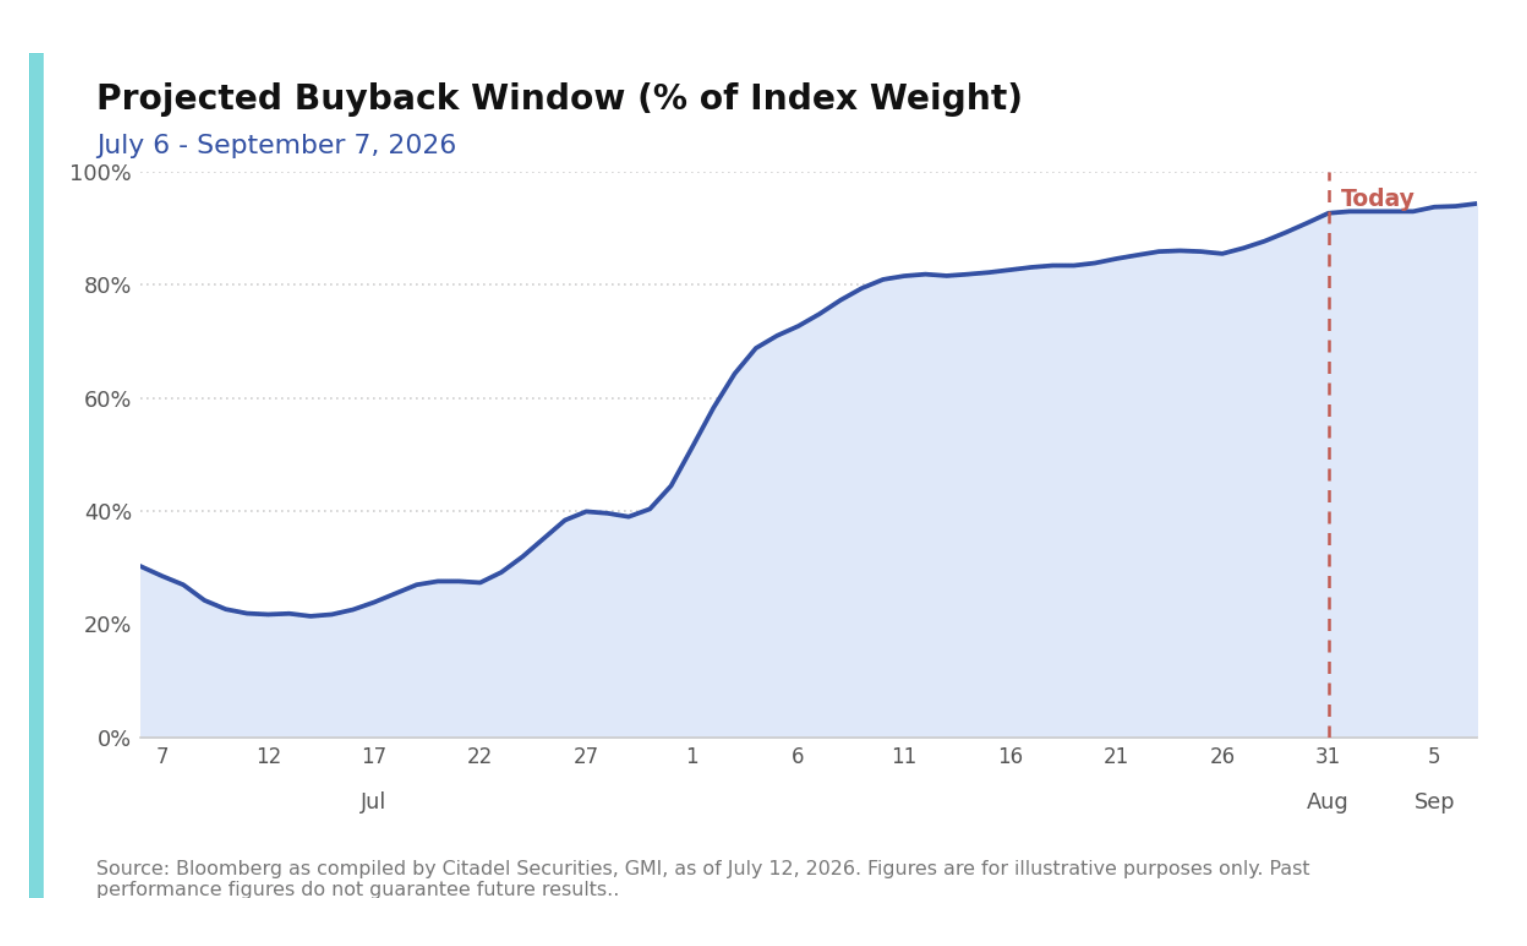
Turning to buybacks, we are now in the fully open buyback window with around 95% of discretionary buybacks by index weight for S&P 500 companies active this week (discretionary buybacks represent ~30% of all buybacks) according to Citadel’s Rubner, and 98% according to Goldman.
From Goldman this week:
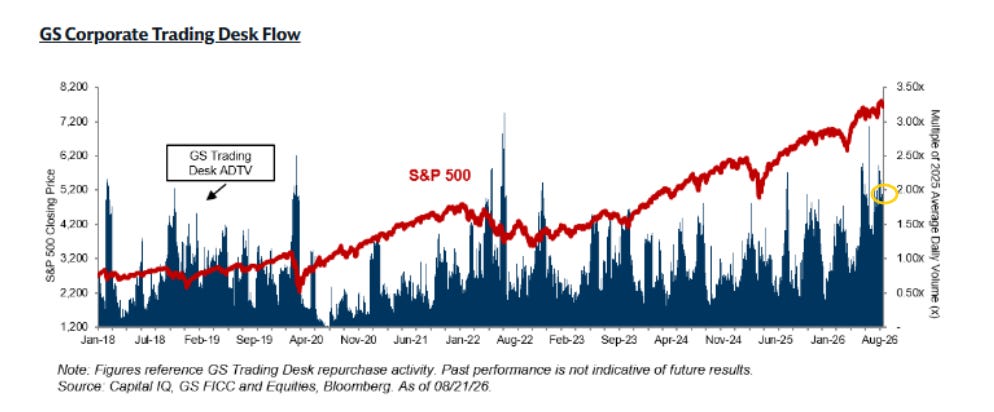
“Our desk volumes maintained a strong trajectory this week as corporate activity remained near peak open-window capacity. Against a backdrop of typical late-August liquidity constraints—further characterized by macro shifts, rate-curve adjustments, and Treasury liquidity-support operations—the consistent corporate bid is thought to provide an important anchor for broader US equities.
“Discretionary open-market participation continued its upward momentum, rising to 40% of total desk orders, compared with 37% last week. This surge in discretionary orders reflects corporates stepping in opportunistically to capture liquidity during volatility spikes.
“Backed by year-to-date buyback authorizations exceeding $1.08 trillion, the corporate bid is positioned to remain a strong source of liquidity through the otherwise thin summer trading environment.”
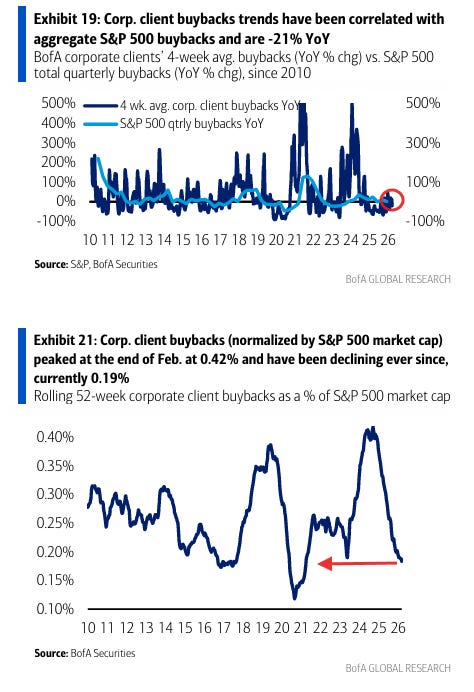
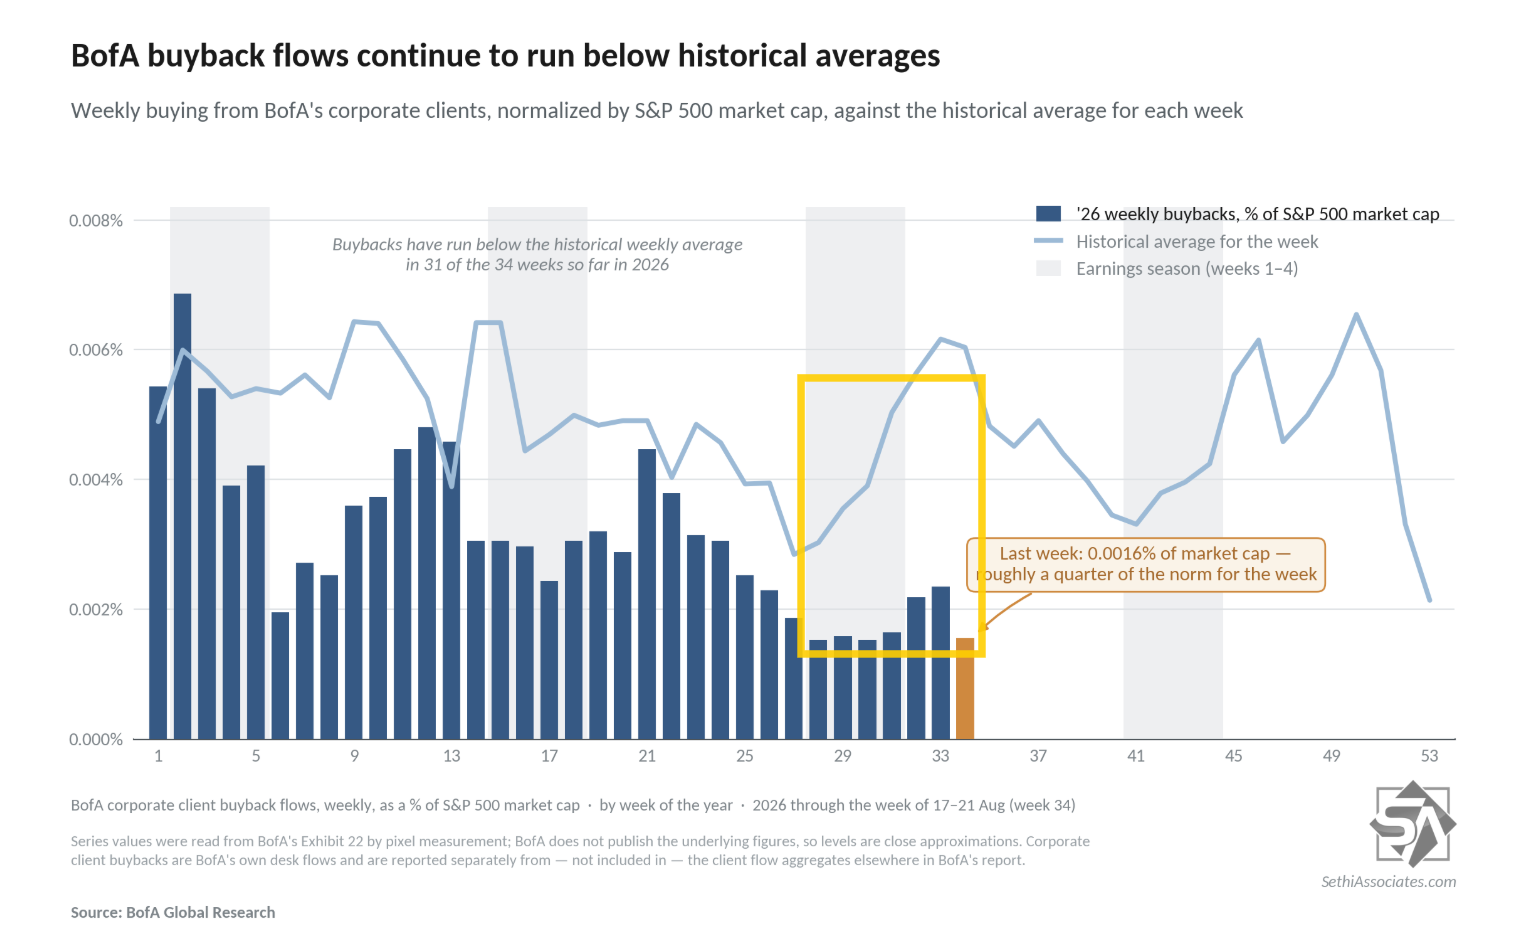
While BofA says buybacks “slowed last week” after three weeks of acceleration dropping to -21% (from +12%) y/y on a 4-week average basis. And they remain well below the historical average for Week 6 of earnings season when normalized by market cap.
YTD they say annualized buybacks are “slightly below full-year ‘25 levels and below ‘24 records, but above 2016-23 levels,” but as a % of market cap are now the least since 2021 (on a rolling 52-week basis).
Sentiment
Sentiment was mixed this week:
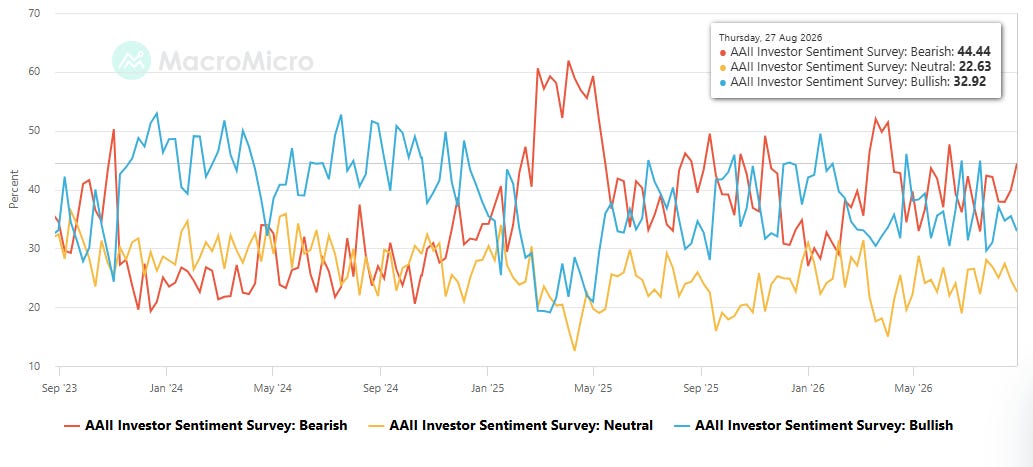
American Association of Individual Investors (AAII) sees bulls fall and bears push higher, with bulls remaining below the level of the bears for a sixth week (and 21st in 26):
AAII bulls (those who see higher stock prices in 6 mths, blue line) fell to 32.9% from 35.5% the prior week (still though above the 29.6% five weeks ago, the least since September), but remaining below the long-term historic average of 37.5% for a sixth week.
Bulls also remained below the level of the bears (who see lower stock prices in 6 mths, red line) for a sixth week (and the 21st week in the last 26) with the bears up to 44.4%, the most since June 11th, from 39.9%. Bears also remain above the long-term average of 31.0% for a 28th straight week (and they’ve only been below it 9 weeks since Dec 12, 2024).
The Neutral camp (yellow line) dropped to 22.6% from 24.6% . It remains under the long-run average of 31.5% and has been over that only twice since July 2024.
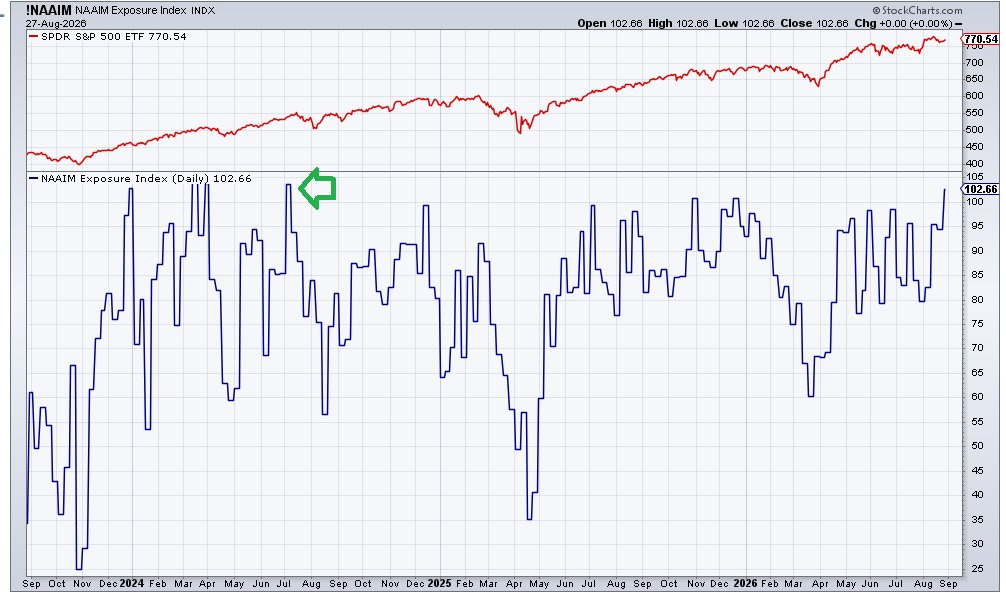
“The folks over at NAAIM increased their exposure* to 102.66, which means they are now on margin. That is the highest exposure they have had since July of 2024. It’s hard to see on the chart, but the S&P then corrected about ten percent (arrow). In fact, the only time it did not correct about ten percent after getting over 100 is in January 2024. Oh, it had a few days of whack, but that was that.
“I think we just have to expect a bout of volatility now.”
*The index according to NAAIM “represents the average exposure to US Equity markets reported by our members” and which ranges from -200% (2x short) to +200% (2x long).
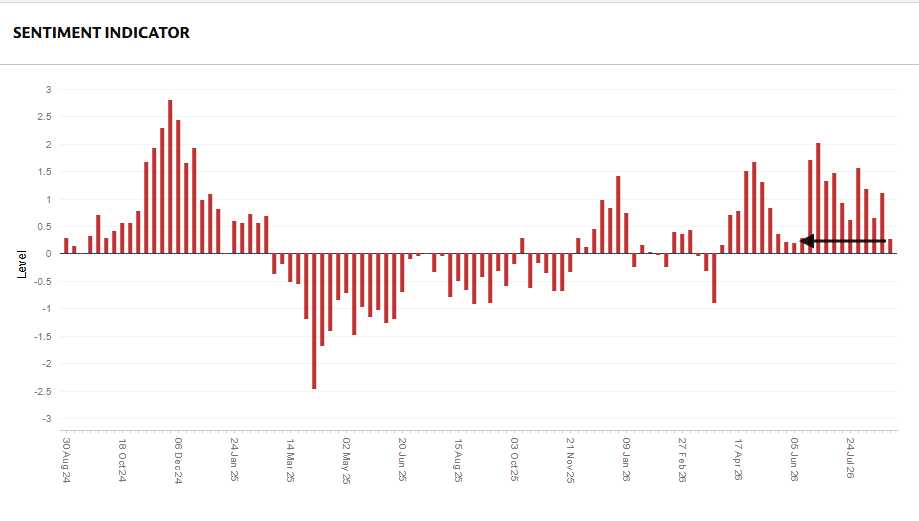
And Goldman’s US Equity Sentiment Indicator*, fell for the third week in four to 0.27, the least since June 5th.
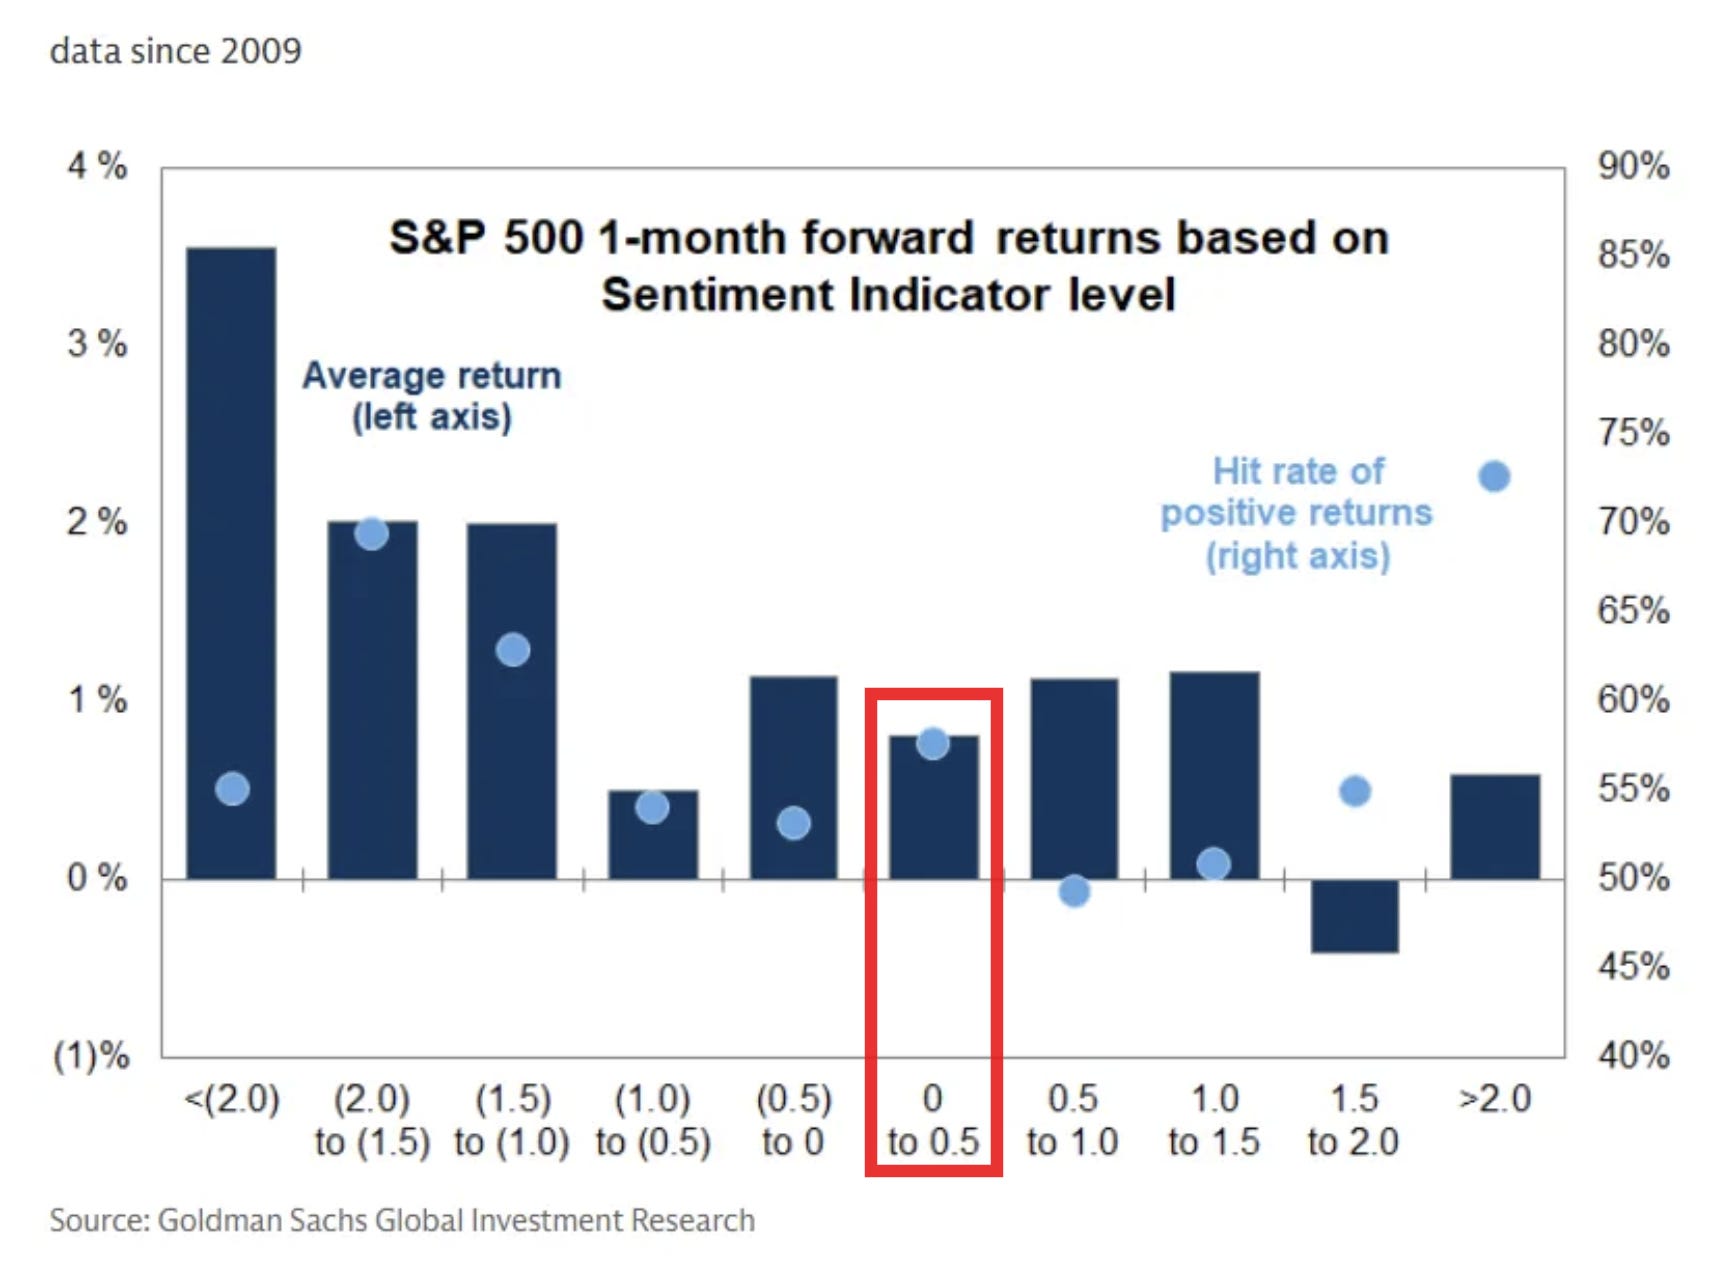
The current reading is consistent with a 1-month average return of around 0.7% since 2009 with a positive rate a little under 60%.
*The indicator combines “six weekly and three monthly indicators that span [across the more than 80% of the US equity market that is owned by institutional, retail and foreign investors]. Readings of +1.0 or higher have historically signaled stretched equity positioning. Readings of -1.0 or lower have signaled very light positioning and have historically been a statistically significant signal for subsequent S&P 500 performance”.
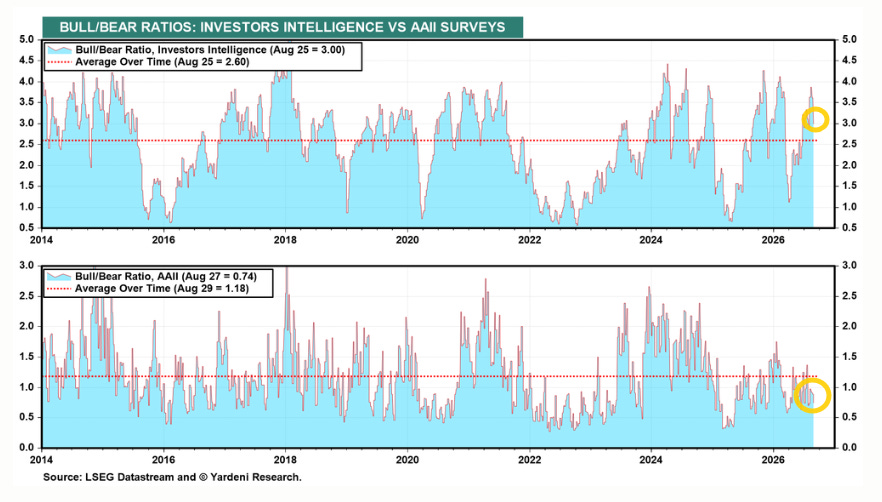
While Ed Yardeni says “Our two favorite bull-bear ratios remain relatively neutral (chart). These contrarian indicators aren’t providing strong buy or sell signals.”
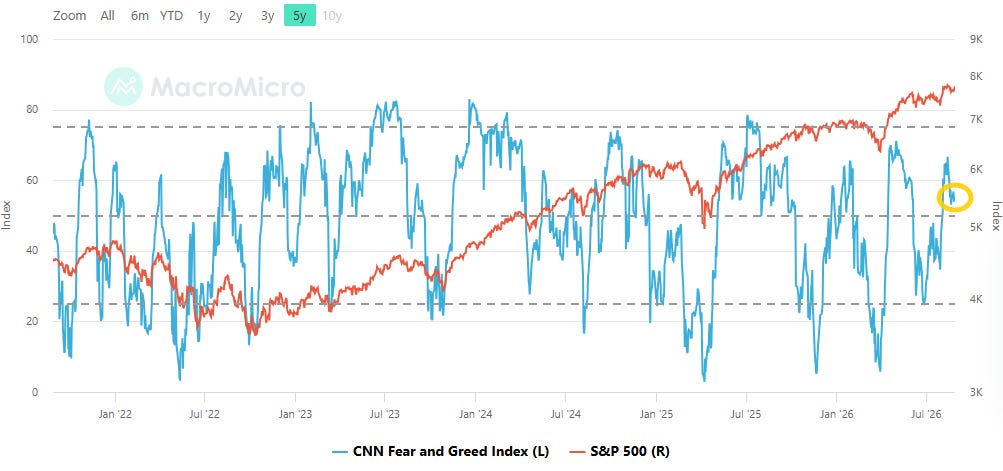
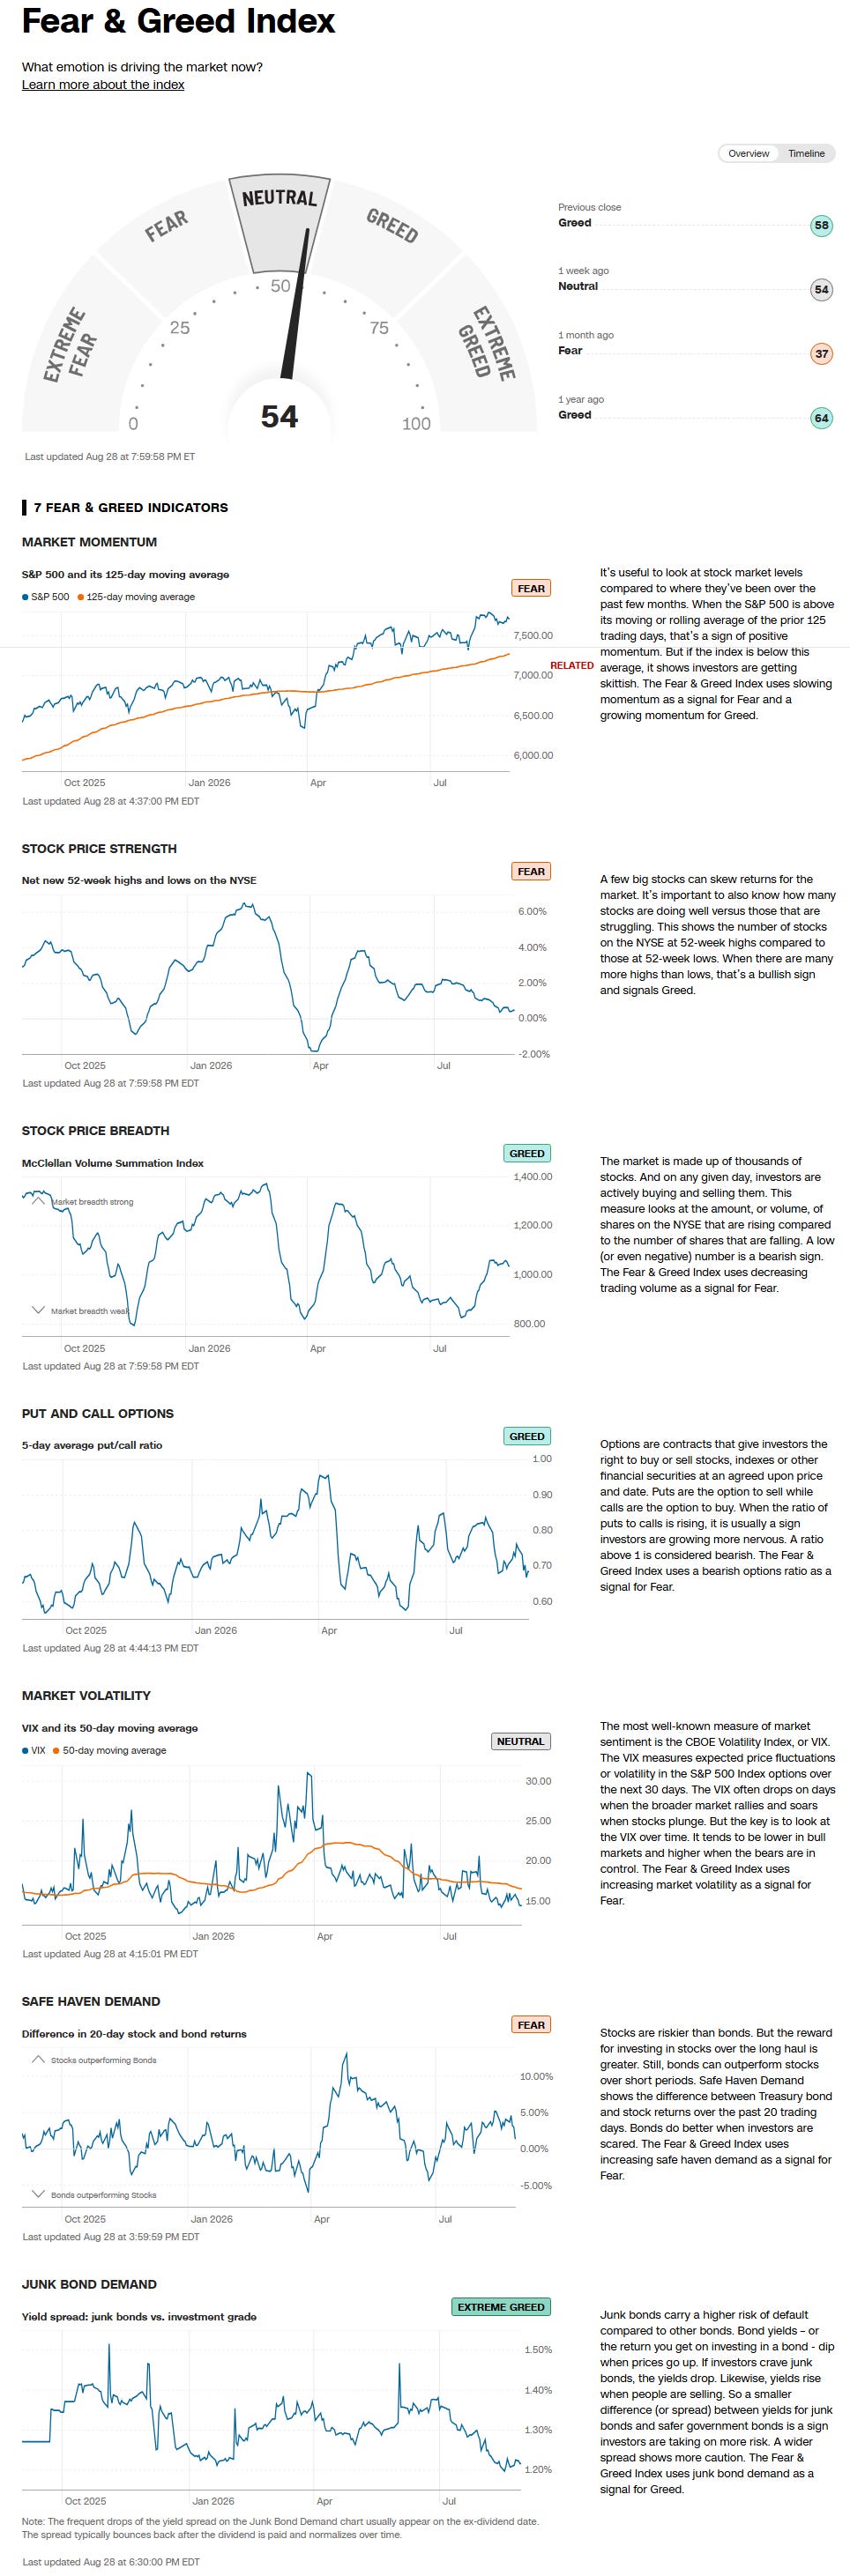
The CNN Fear & Greed Index (blue line) little changed from last week at 54.4. The Index remains at “Neutral”.
Things remain relatively balanced with three indicators above Neutral and three below.
Extreme Greed = junk bond demand (vs investment grade)
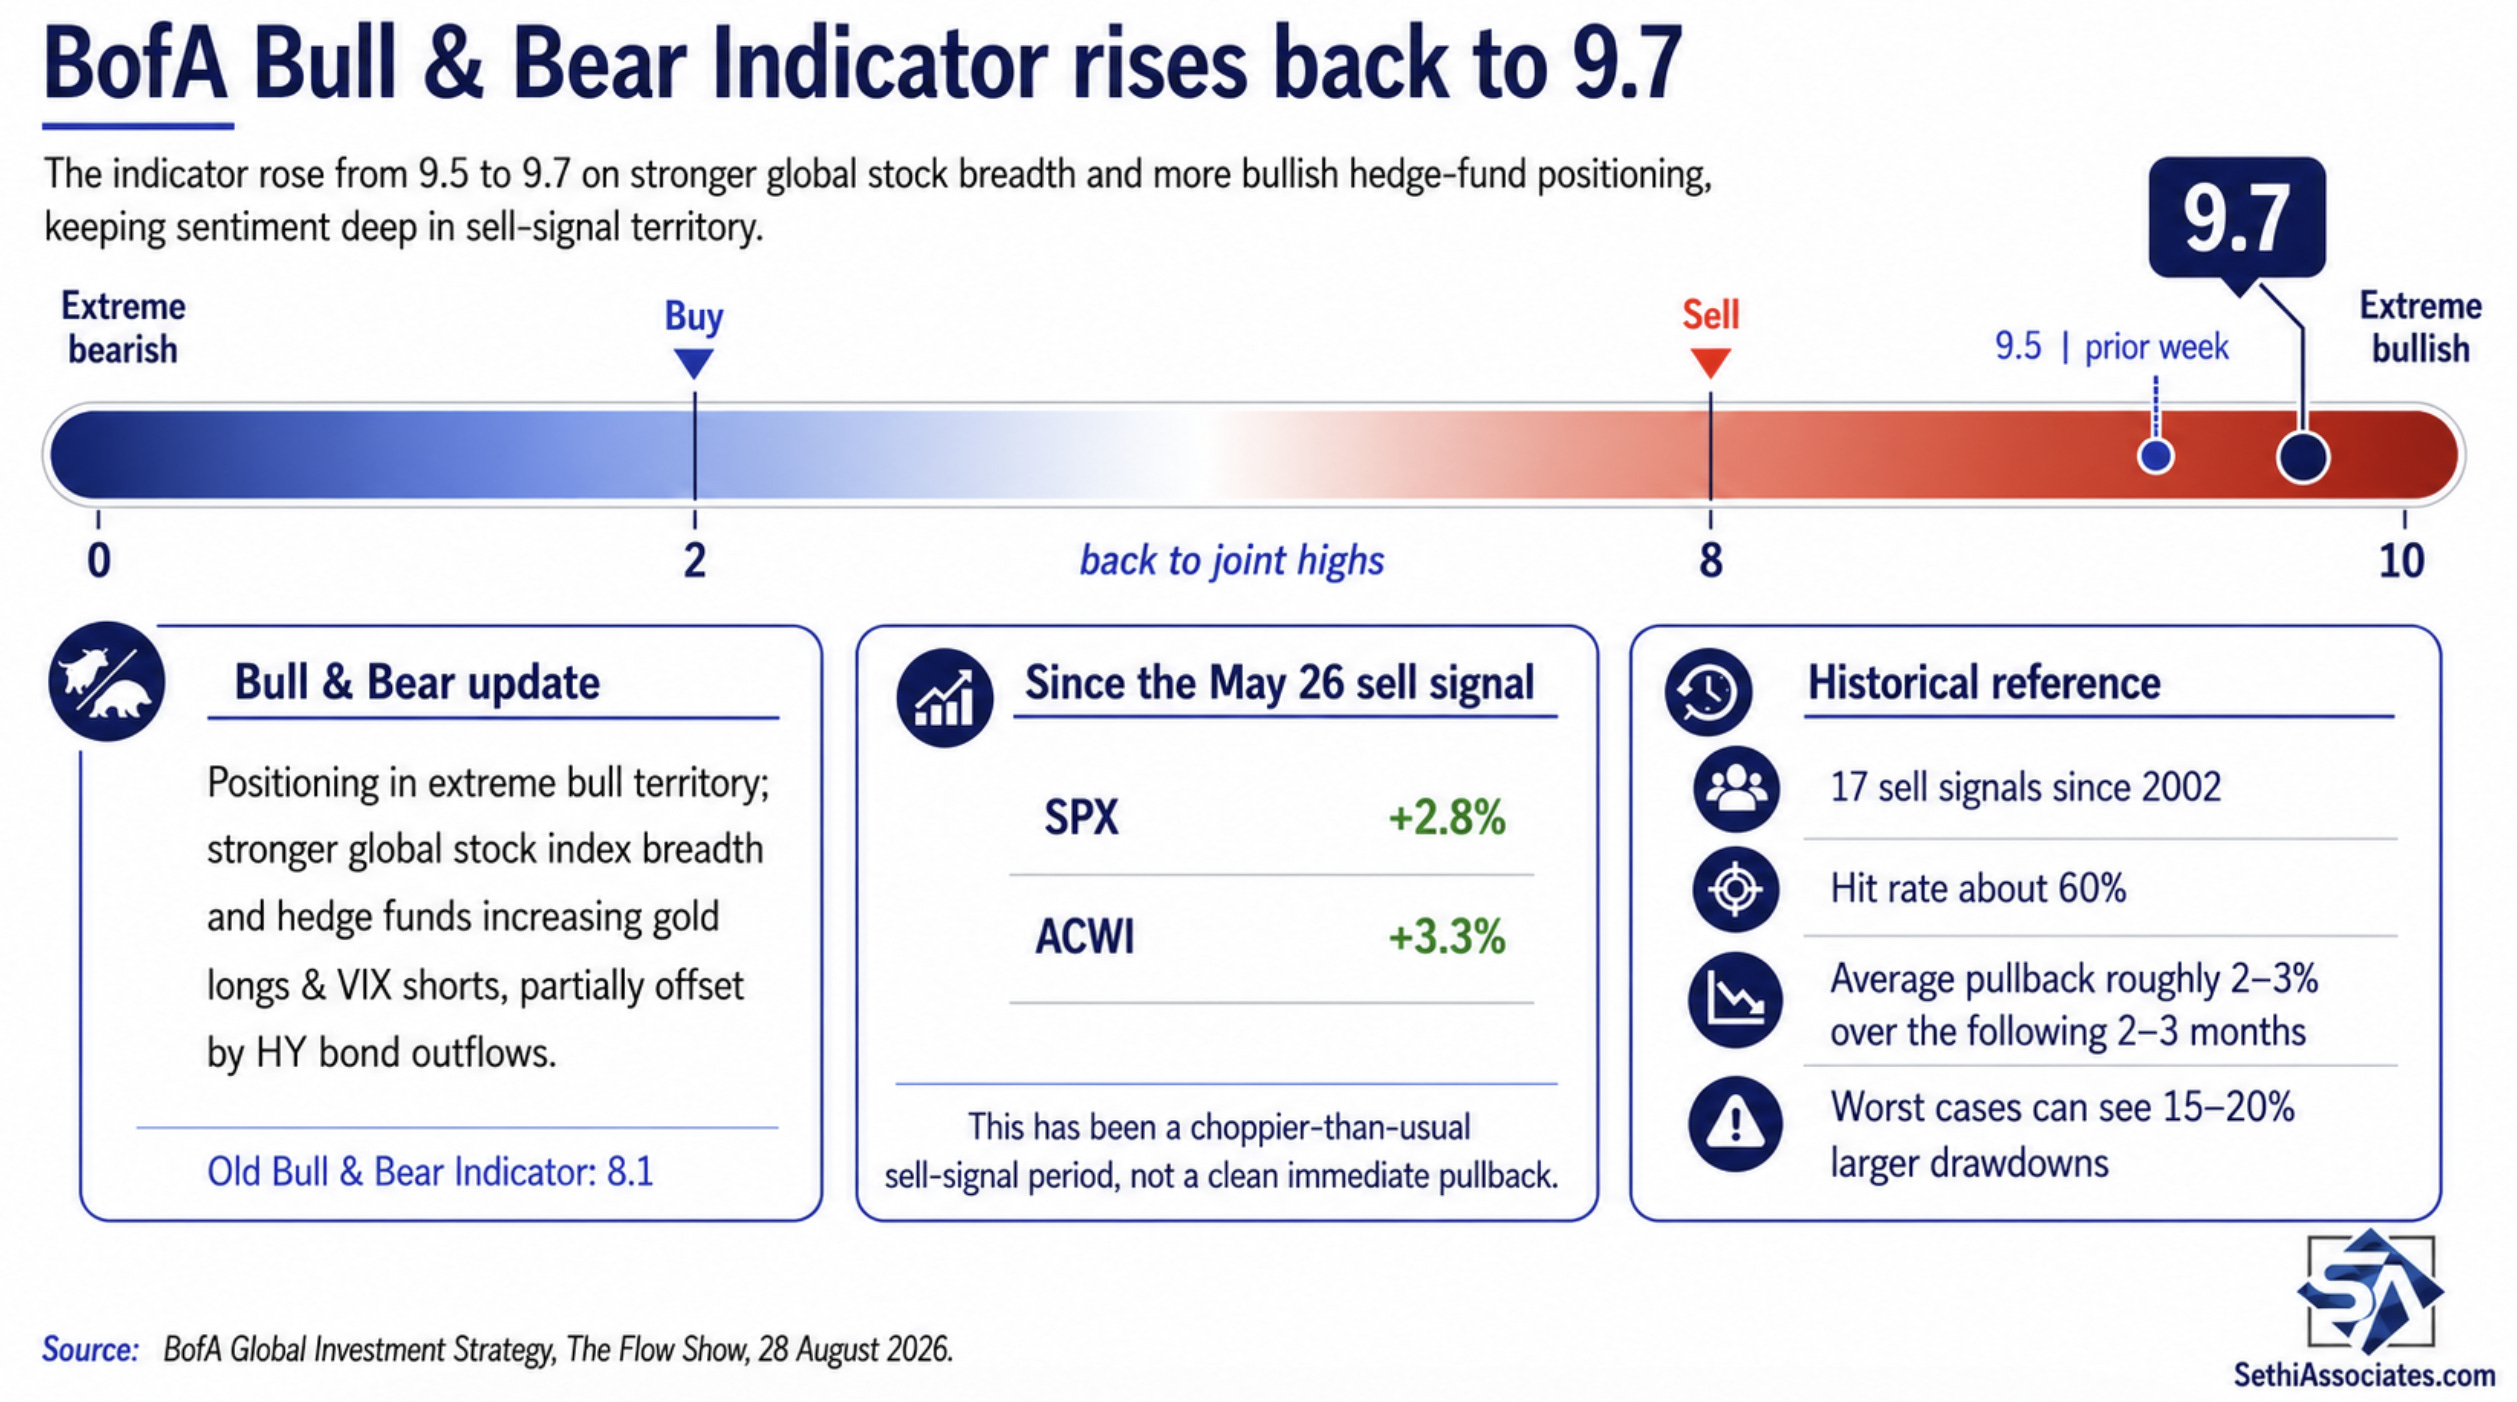
And BoA’s Bull & Bear Indicator rose back up to 9.7 matching three weeks ago as the highest since 2021, and remaining above its sell signal (8.0) which it crossed back above the week of May 22nd:
up to 9.7 from 9.5 on stronger global stock index breadth, hedge funds increasing gold longs & VIX shorts, partially offset by HY bond outflows; positioning in extreme bull territory; “sell signal” triggered May 26th; since then, SPX +2.8%, ACWI +3.3%; “old” Bull & Bear Indicator at 8.1
[From prior weeks]:
BofA Bull & Bear “sell signal” remains in place, extreme bull positioning says markets “toppy”, reduce equity exposure, retreat or rotate much smarter summer tactic for risk assets than reload.
17 “sell signals” since ’02, average loss for global stocks over 2-3 months is 2-3% (hit ratio of ~60%), with max drawdowns of 15-20% (caveats always “tops are a process, lows are a moment”, i.e. greed harder to reverse than fear).
And Helene Meisler’s followers flipped over to bearish after being basically split the prior week and bullish for the three weeks before that.
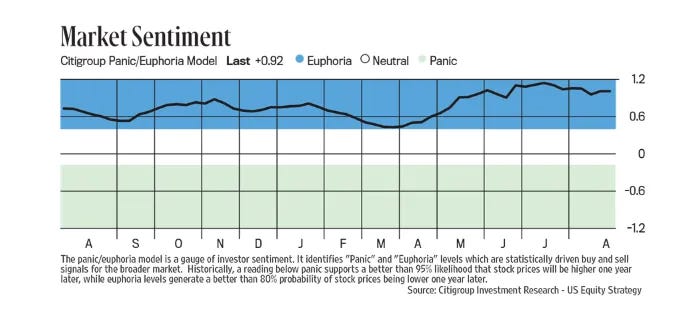
While the Citi panic/euphoria index remains squarely in Euphoria just a little off the highs. I should note it has had a fairly poor track record over the past couple of years (I will post the details in an upcoming week, too much to get through this week).
Seasonality
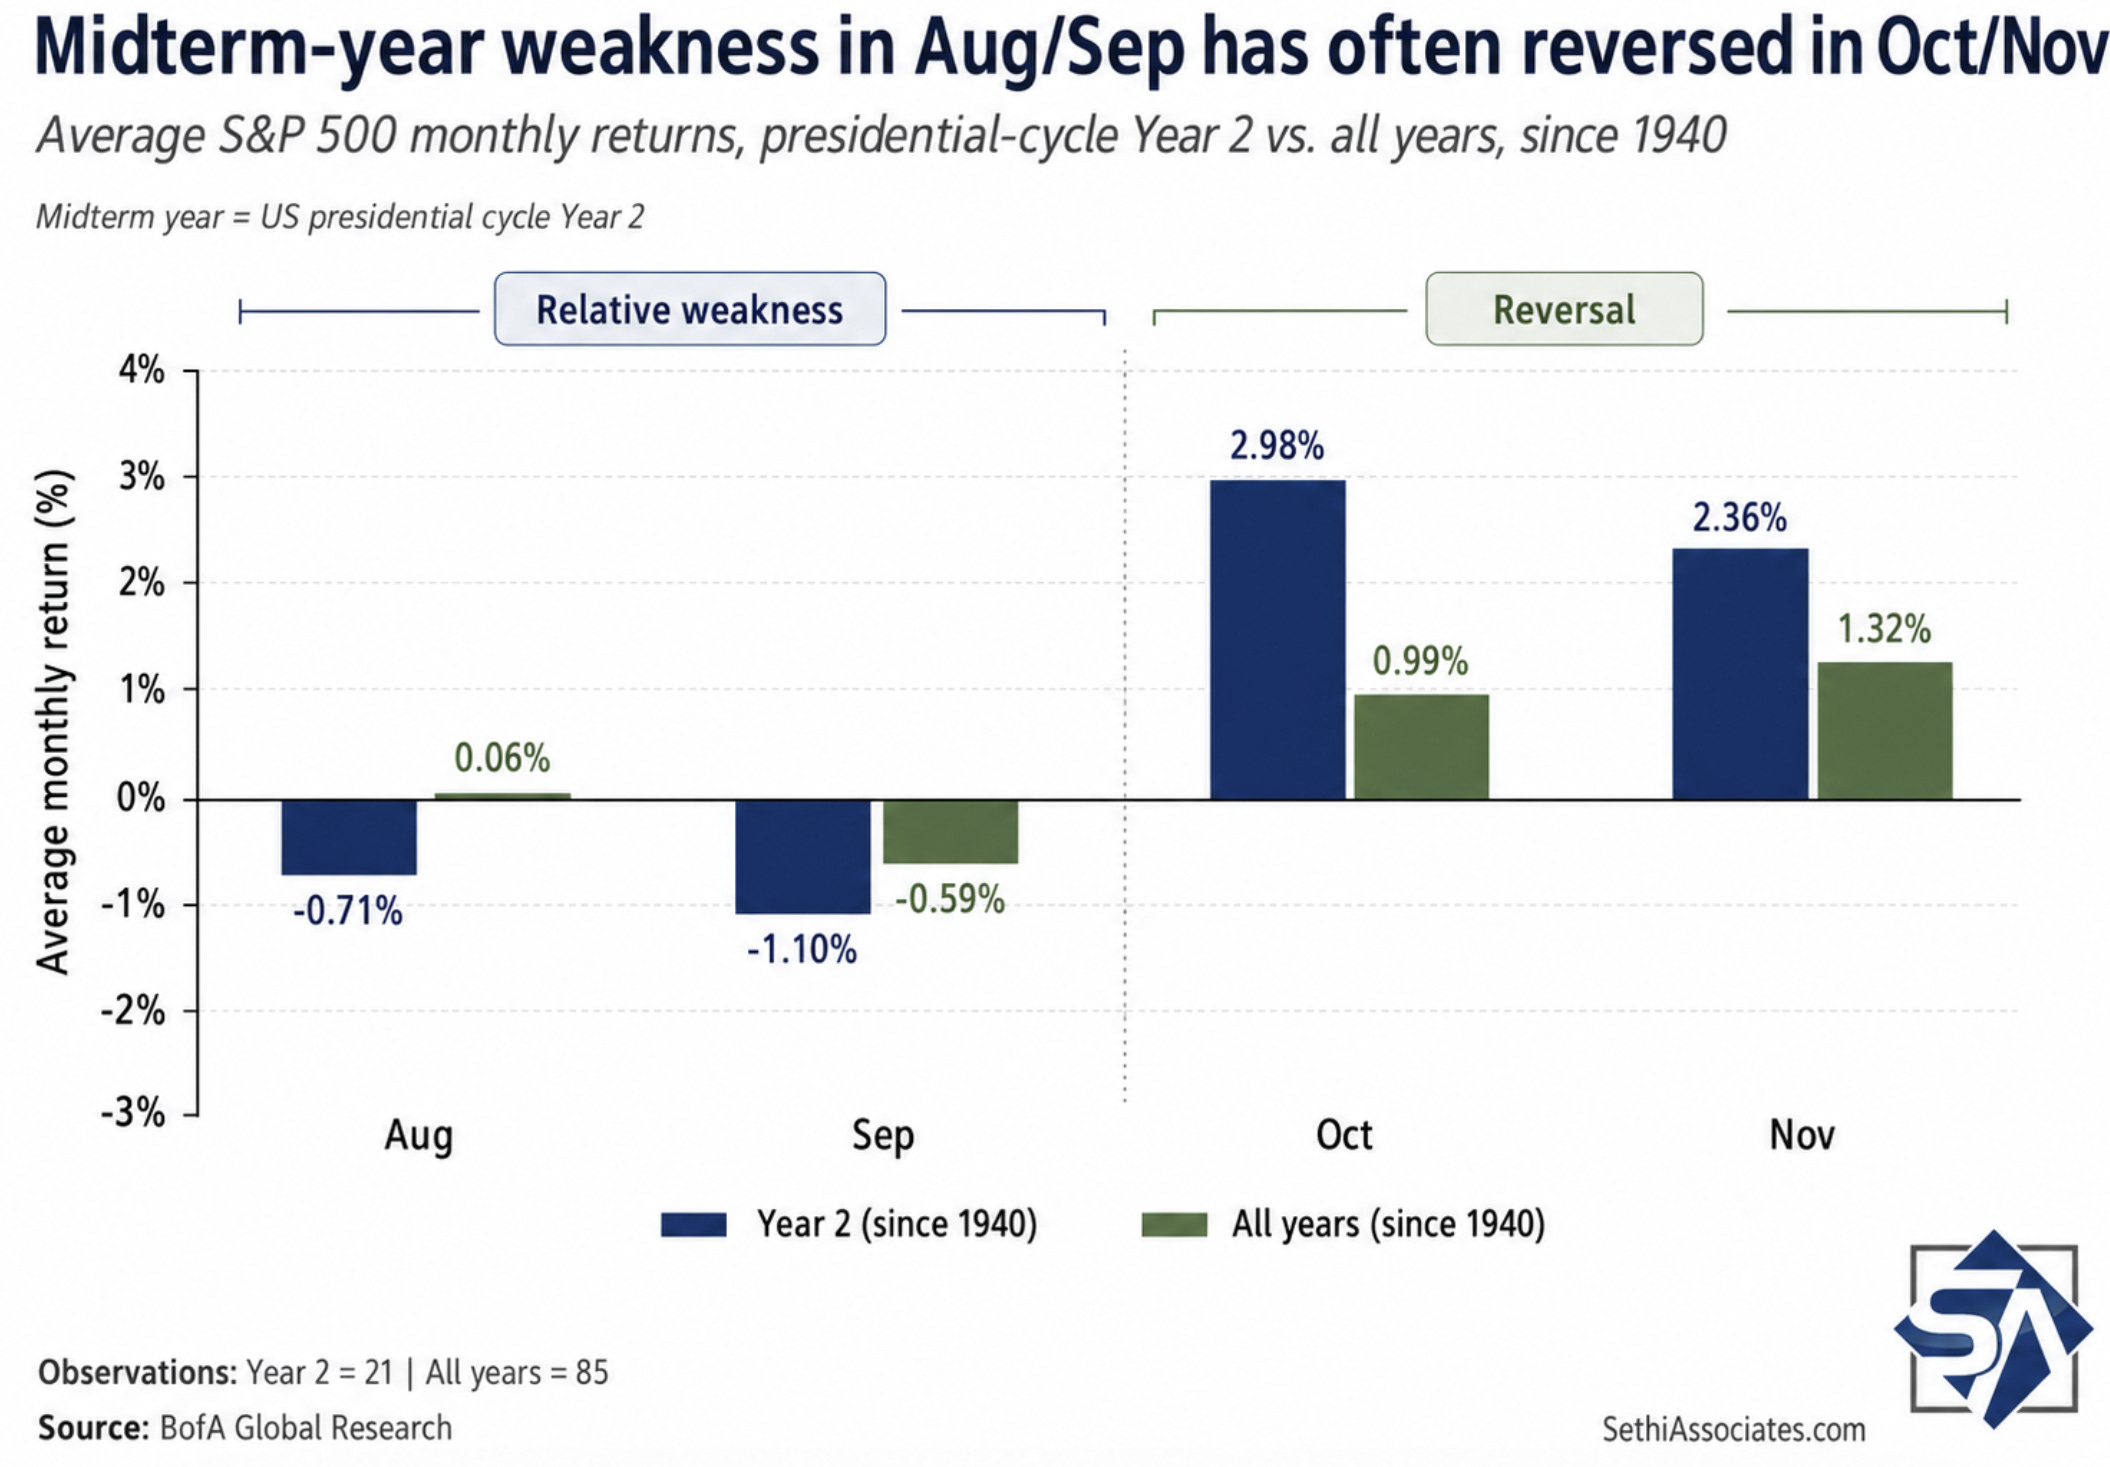
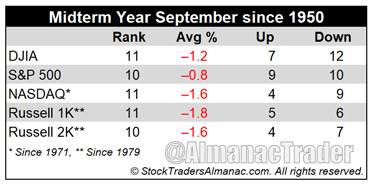
As we embark on September, traditionally it has been a weak month with an average loss of -0.59% since 1940 according to BofA which is even worse in mid-term years (-1.10%). The good news is once we’re past that we see two of our best months in October and November.
And that midterm year weakness is not just a SPX thing according to Jeff Hirsch.
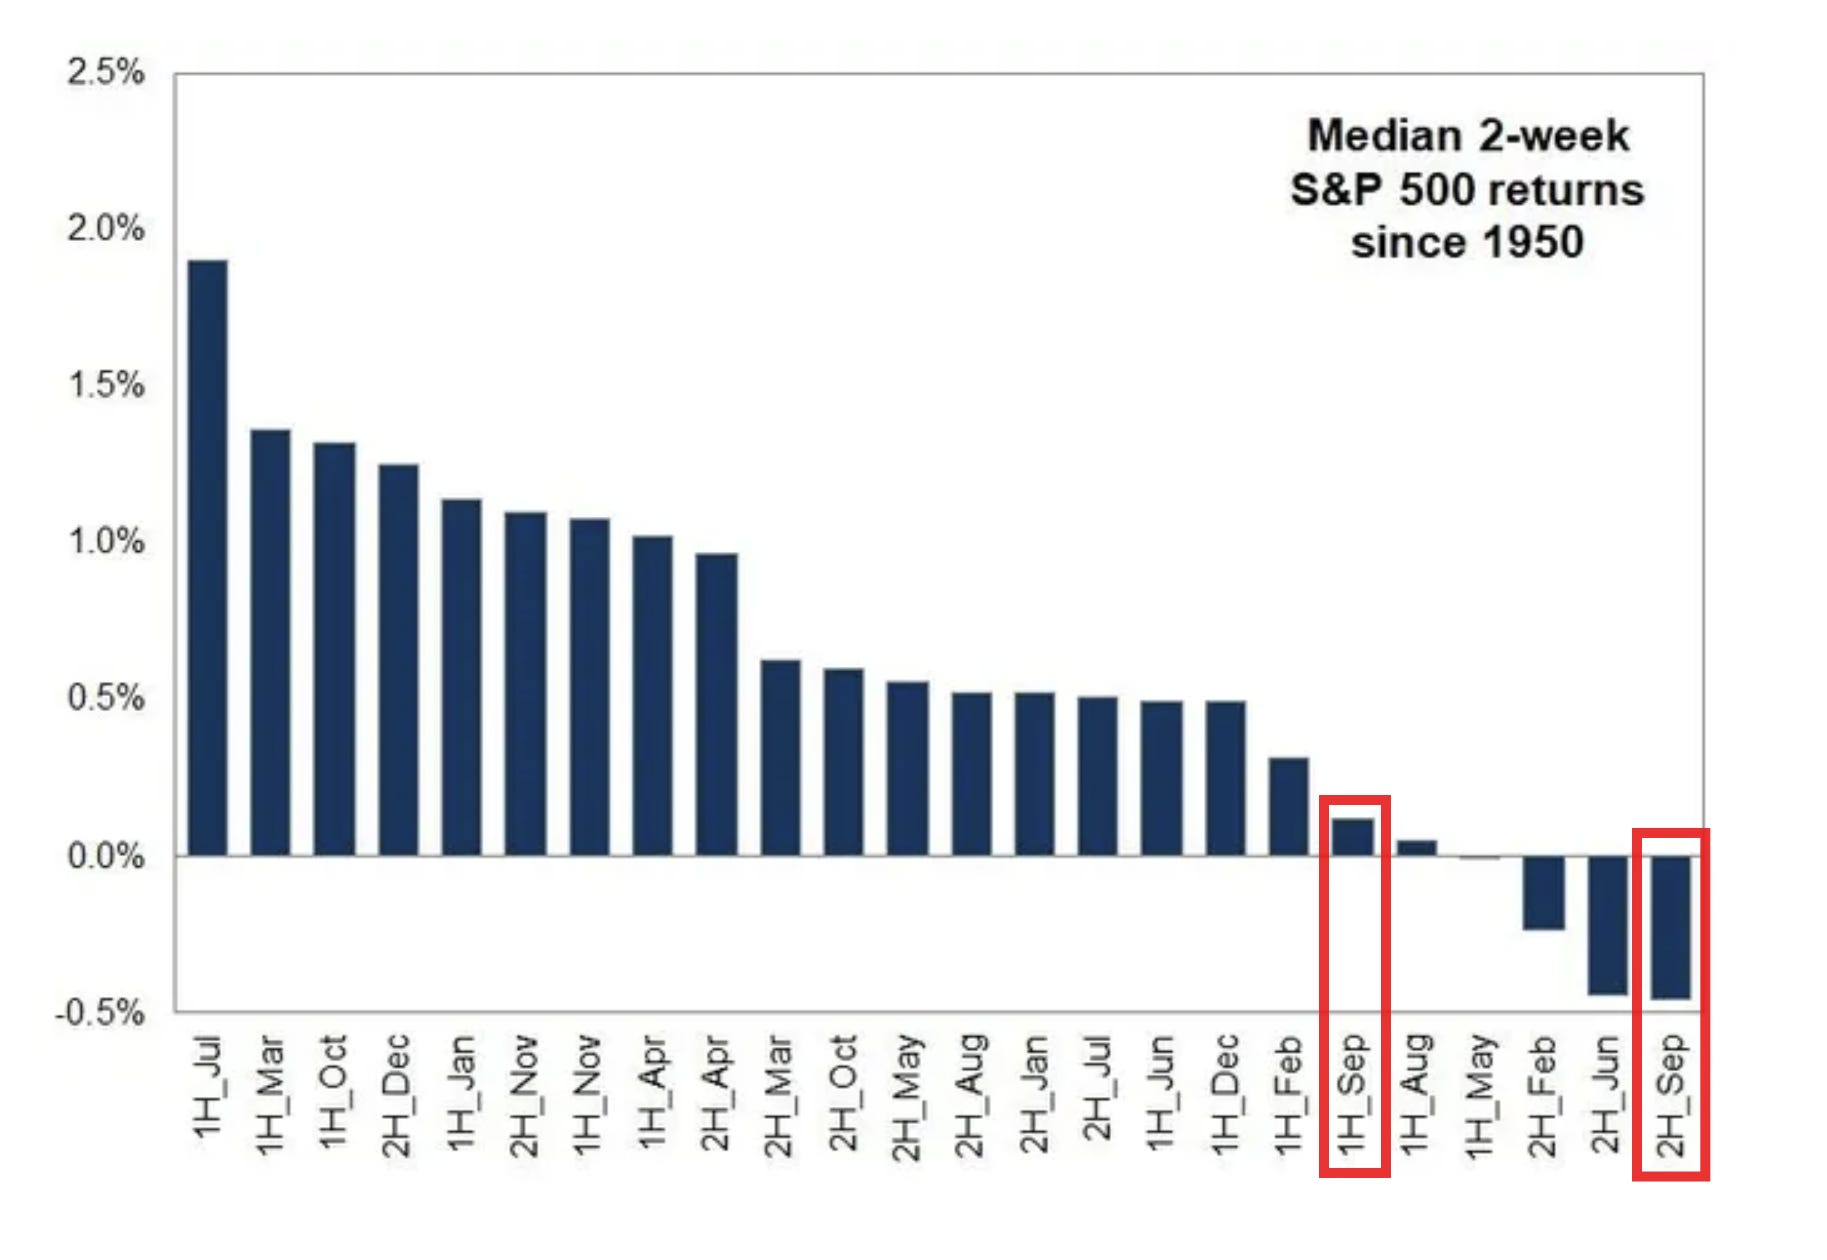
Looking at the first half of September it at least has a positive median gain of ~+0.1% since 1950. But the bad news is that the second half is the weakest of all half-months with a nearly -0.5% median loss.
Goldman Sachs
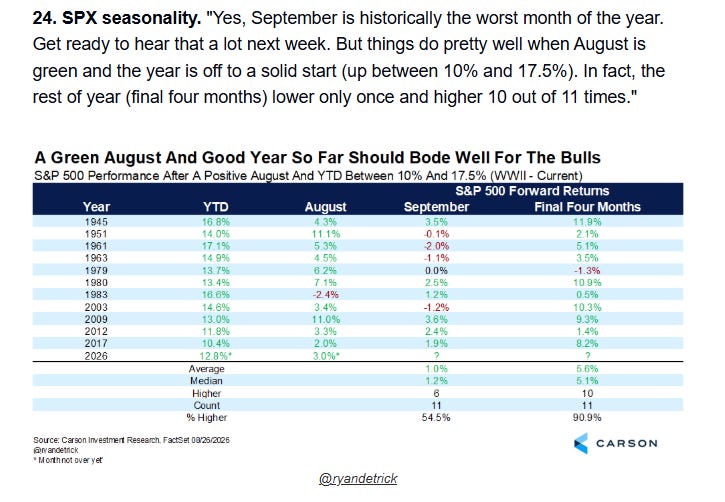
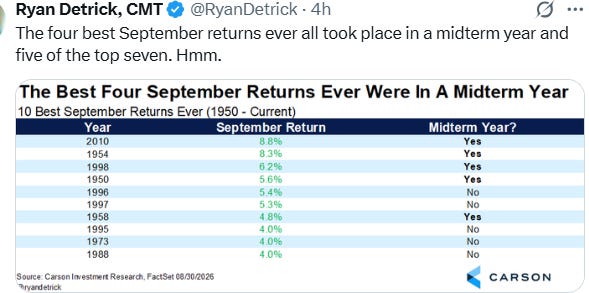
Although Ryan Detrick says that weakness normally hasn’t shown up after a positive August in a year the SPX is up between 10 and 17.5% like this one.
And Septembers in midterm years are not always bad.
Rates/Fed
Turning to interest rates and the Fed, I noted five weeks ago that after thinking that a rate hike this year was a low probability event, the chatter from Fed members, including the new Chair, made me “increasingly convinced that a hike is a real possibility this year, something I thought was unlikely absent a continued push higher in inflation.”
And three weeks I added:
Chair Warsh (assuming I’m right that he doesn’t want to raise rates) got some “welcome” (if you can call a weak jobs report “welcome”) relief in the payrolls report… but markets cut expectations and yields only marginally, meaning it will take a lot more than that to take the pressure off for one or more hikes this year.
That makes the August jobs report and the two sets of CPI/PPI reports we’ll get (starting next week) likely the deciding factors (although of course Warsh has the opportunity to “set the table” for the rest of the year with his Jackson Hole speech at the end of the month (though few expect him to do that).
And then Warsh got “some” if not “a lot” more help in not only the in-line CPI (enough to see core CPI slow to a 5-year low) but also a cool PPI and a weak retail sales report which saw a significant reduction in expectations for a September rate hike to around a third from well over 50% a week ago.
The following week we gotthe Fed minuteswhich confirmed that the committee had undoubtedly moved in a more hawkish direction, with “several” expressing a desire to raise rates immediately (likely the five that have expressed that publicly (the three dissenters Hammack, Logan, Kashkari) plus regional Fed presidents Schmid and Musalem)), and “many” (over half) “assessed that policy tightening would likely be necessary if inflation did not decline,” with the thinking “generally … that the information that would accumulate in the intermeeting period could provide more clarity, and correspondingly reduce uncertainty, about the inflation outlook.”
That again saw rate hike expectations drift higher before again falling back even as there was plenty in this week’s PCE prices report that hawks seized on. Which brought us to Chair Warsh’s appearance. Here was what I sent out to subscribers (with a few tweaks):
Those looking for a hawkish tone from Warsh got their wish (link to speech below). While his overall messaging is very similar to the majority as disclosed in the July minutes: “We must be confident that underlying inflation is moving to our objective, clearly and at sufficient speed. Otherwise, we have work to do,”he overall tilts in the direction of the hawks. “Price stability is not self-executing, nor is inflation necessarily mean-reverting. It is the Fed’s job to deliver stable prices,” he said.
Warsh deviates from the position of the doves/centrists who believe that current rates are “mildly (or modestly) restrictive” instead saying “on balance, I would be hard pressed to describe broad financial conditions as restrictive.”
In addition he says he takes little comfort from the recent inflation readings. While “better than expected,” Warsh said “they do not tell me that underlying trends have meaningfully improved.”
In that regard he specifically points to inflation breadth, something that Governor Waller has been talking about recently as well, pointing out that “Over the past 12 months, 54 percent of goods and services in the PCE basket showed price increases above 3 percent. This is well below the post-pandemic highs of about 77 percent, but it remains well above the level of 32 percent in the two decades that preceded the pandemic. Looking over just the past six months, the conclusion is similar: Of goods and services in the PCE basket, 49 percent showed annualized price increases above 3 percent.”
It is notable to me that Warsh didn’t talk about any inflation measures outside of PCE and went out of his way to emphasize it: “there should be no misunderstanding: The Fed’s price-stability objective of 2 percent, as measured by the personal consumption expenditures (PCE) price index, is a firm, fixed target.”
He also seemed to deviate from earlier remarks that there may be other ways to address inflation beyond the policy rate (such as the balance sheet, etc.): “short-term interest rates are the predominant tool to achieve the dual mandate.”
And on inflation expectations he also downplays somewhat the fact they have have remained low and stable saying “The thing about market measures of inflation expectations in economic history is that they tend to look strong and durable until they don’t... There is one signal nobody can miss: The responsibility for 65 months of sustained, elevated inflation sits squarely with the central bank. And that is where it belongs.”
And he shrugged off any concerns about the labor market and economy saying “For my part, today I am impressed by the overall performance of the economy, which appears to have strengthened…. Labor markets are quite stable. The jobless rate, at 4.1 percent, remains low by historical standards and has not changed much for a couple of years. Unemployment claims, on a four-week average—an empirically robust real-time indicator—are near their lowest level in decades.”
In explaining why the Fed didn’t hike in July he says “A good majority of my colleagues and I thought the wiser course was to await new information in the intermeeting period—especially given possible developments in supply chains, investment flows, and geopolitics—before deciding whether a change in interest rate policy was advisable. And we expressed our joint readiness to act as circumstances might require.”
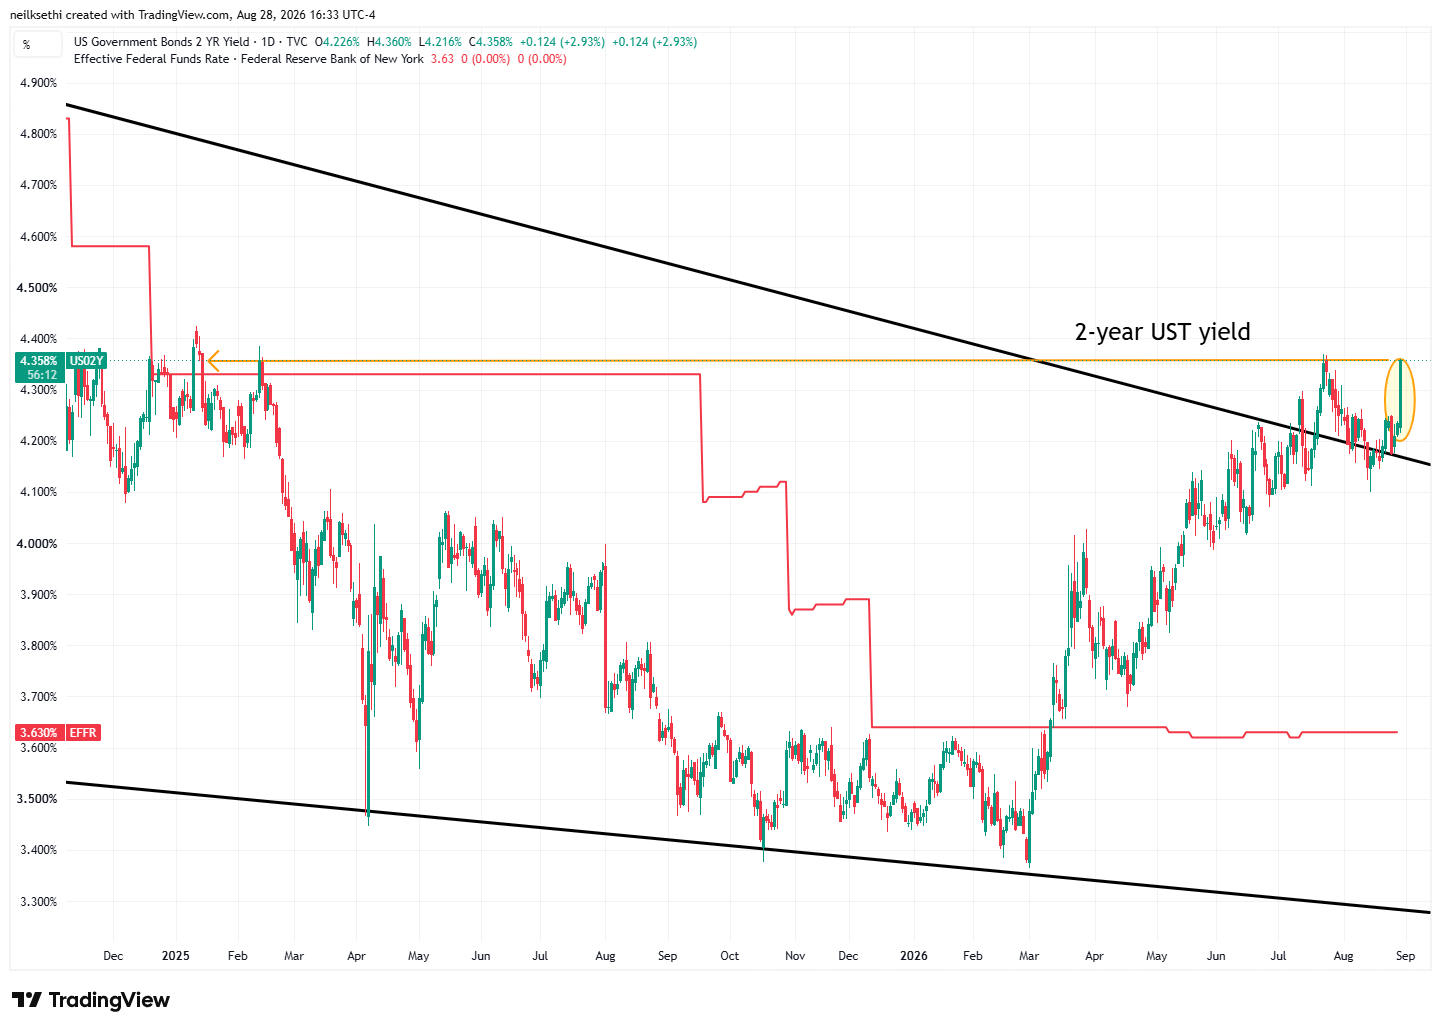
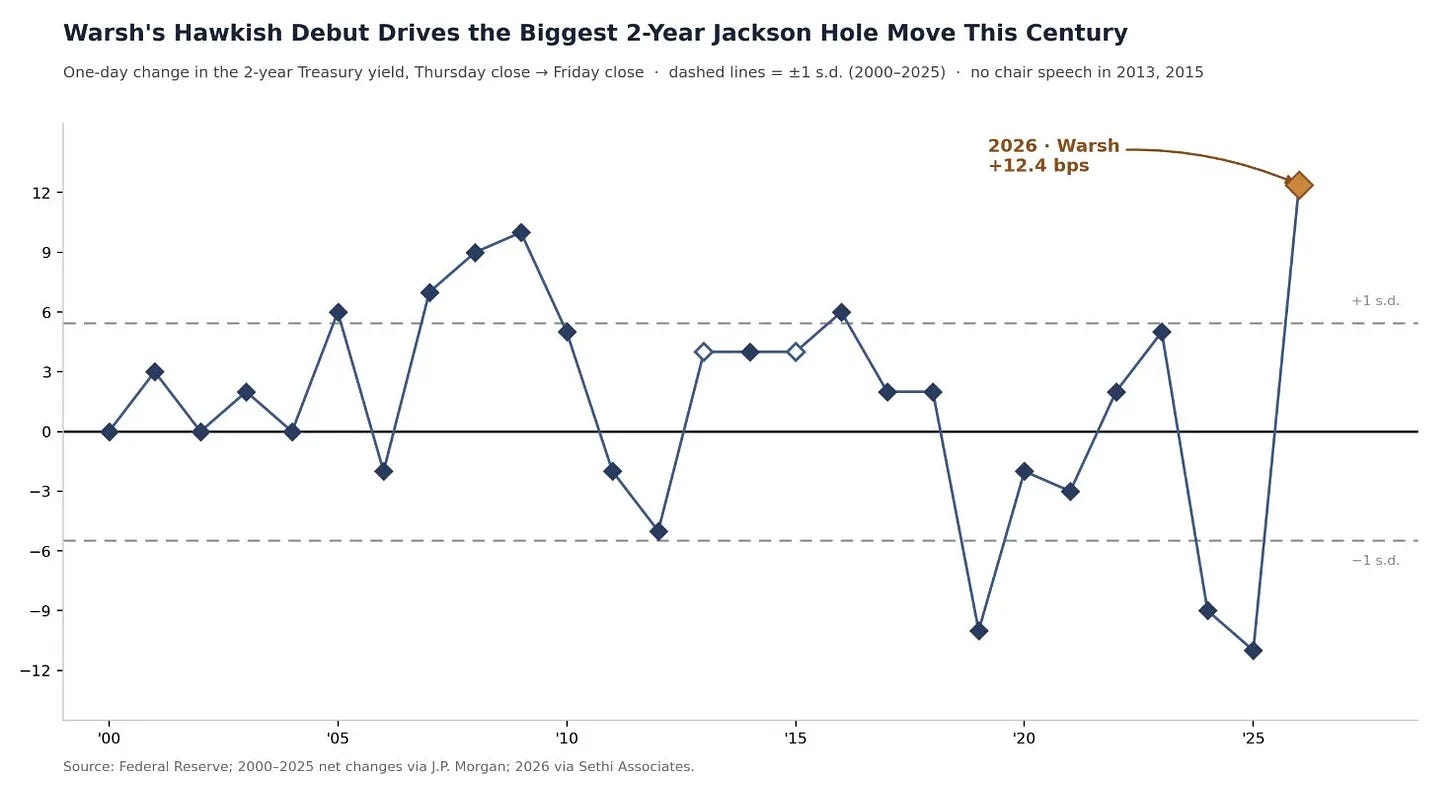
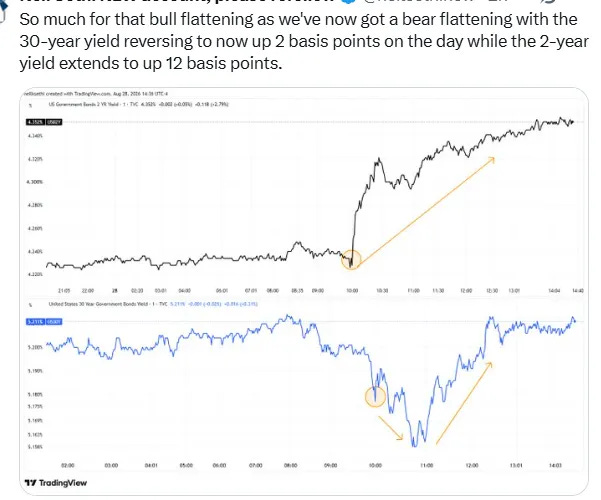
As noted in the Friday update the reaction was swift on the front end with 2-year Treasury yields…
… but also, after a brief dip, at the longer end (although less so).
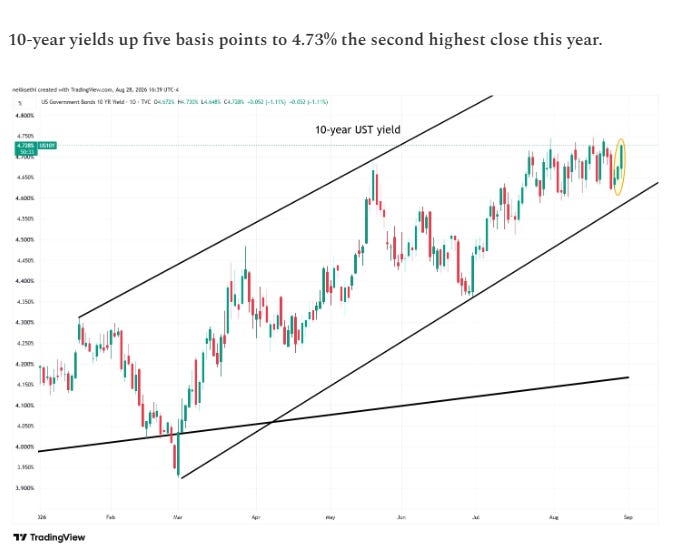
That also left the 10-year yield just off its highs of the year.
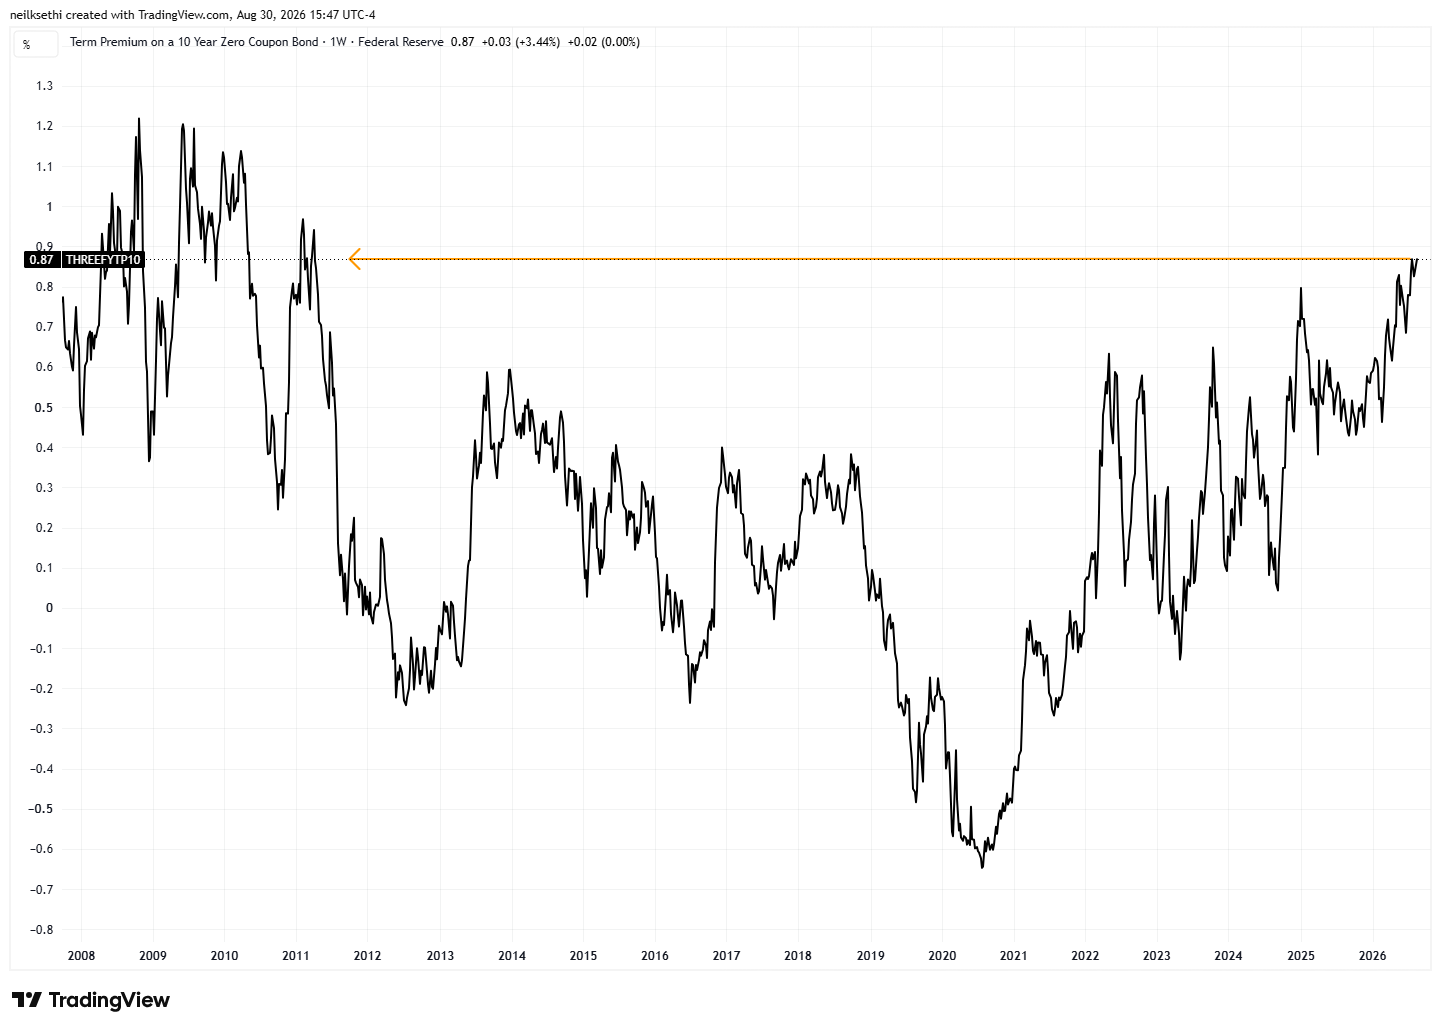
With 10-year term premium (the “risk premium” for buying longer duration bonds above inflation and Fed rate expectations) hitting the joint highest since 2011 according to one measure that I like because it controls for the expected path of short-term rates (Kim–Wright).
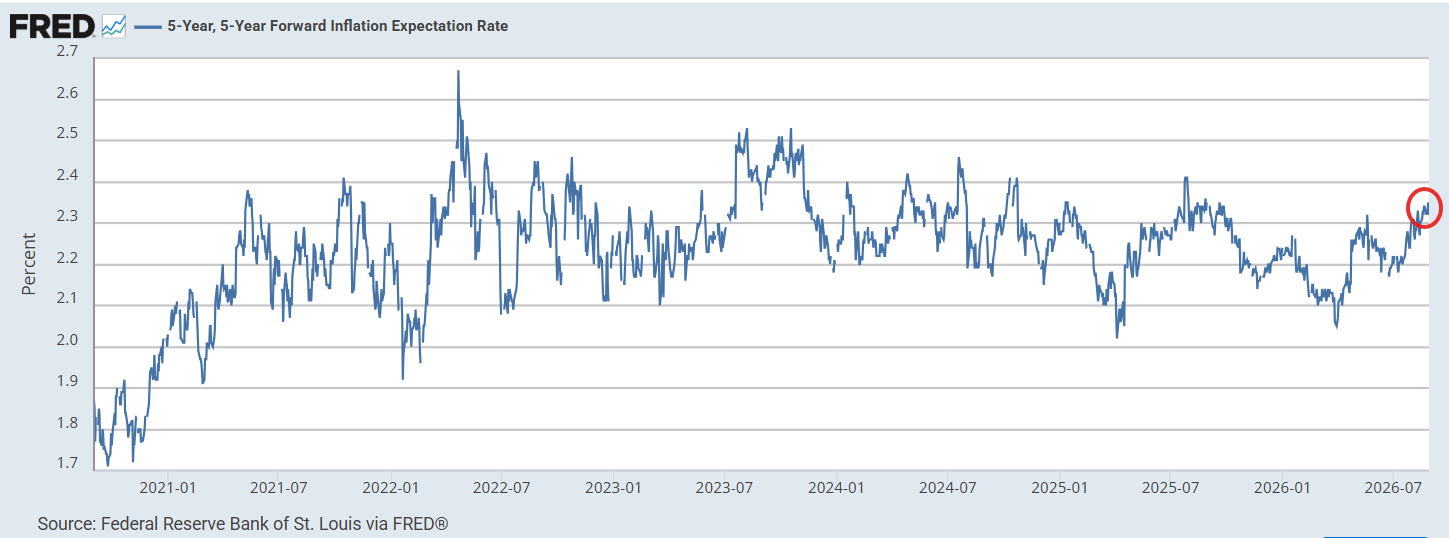
And the Warsh speech also didn’t do a lot in terms of inflation expectations with the Fed favorite 5-year, 5-year forward rate (expected inflation for the 5 years starting 5 years from now), dropping just 0.02pp to +2.32% from the highest since last September.
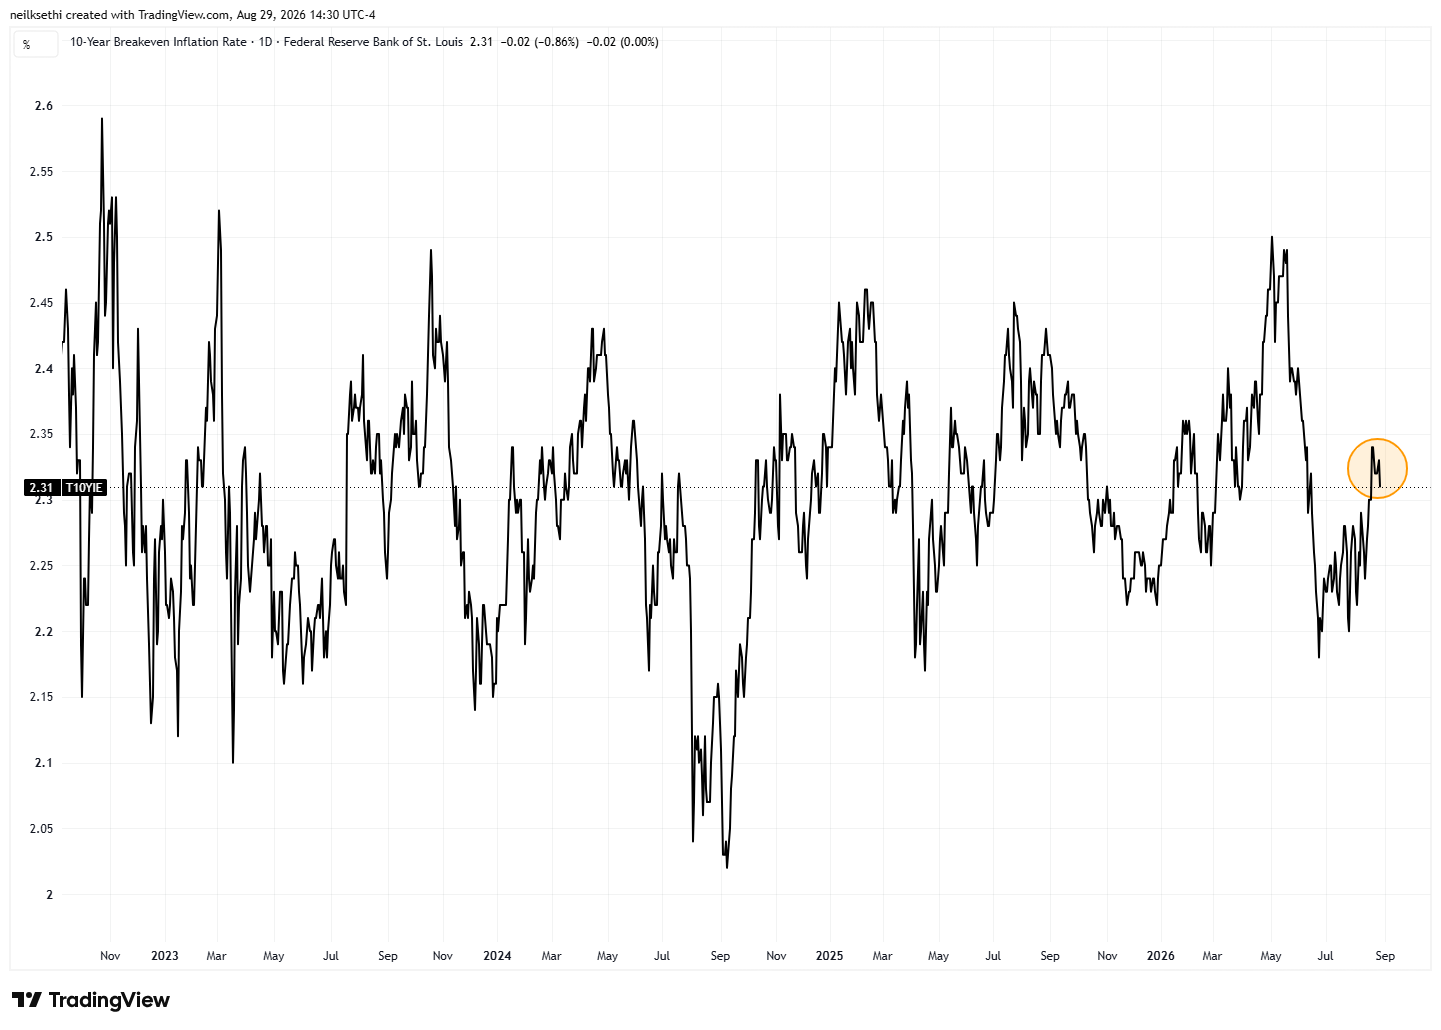
And a similar move in 10-year inflation breakevens after last week seeing the largest move higher since the start of the Iran conflict (and before that January 2025 as we approached Inauguration Day).
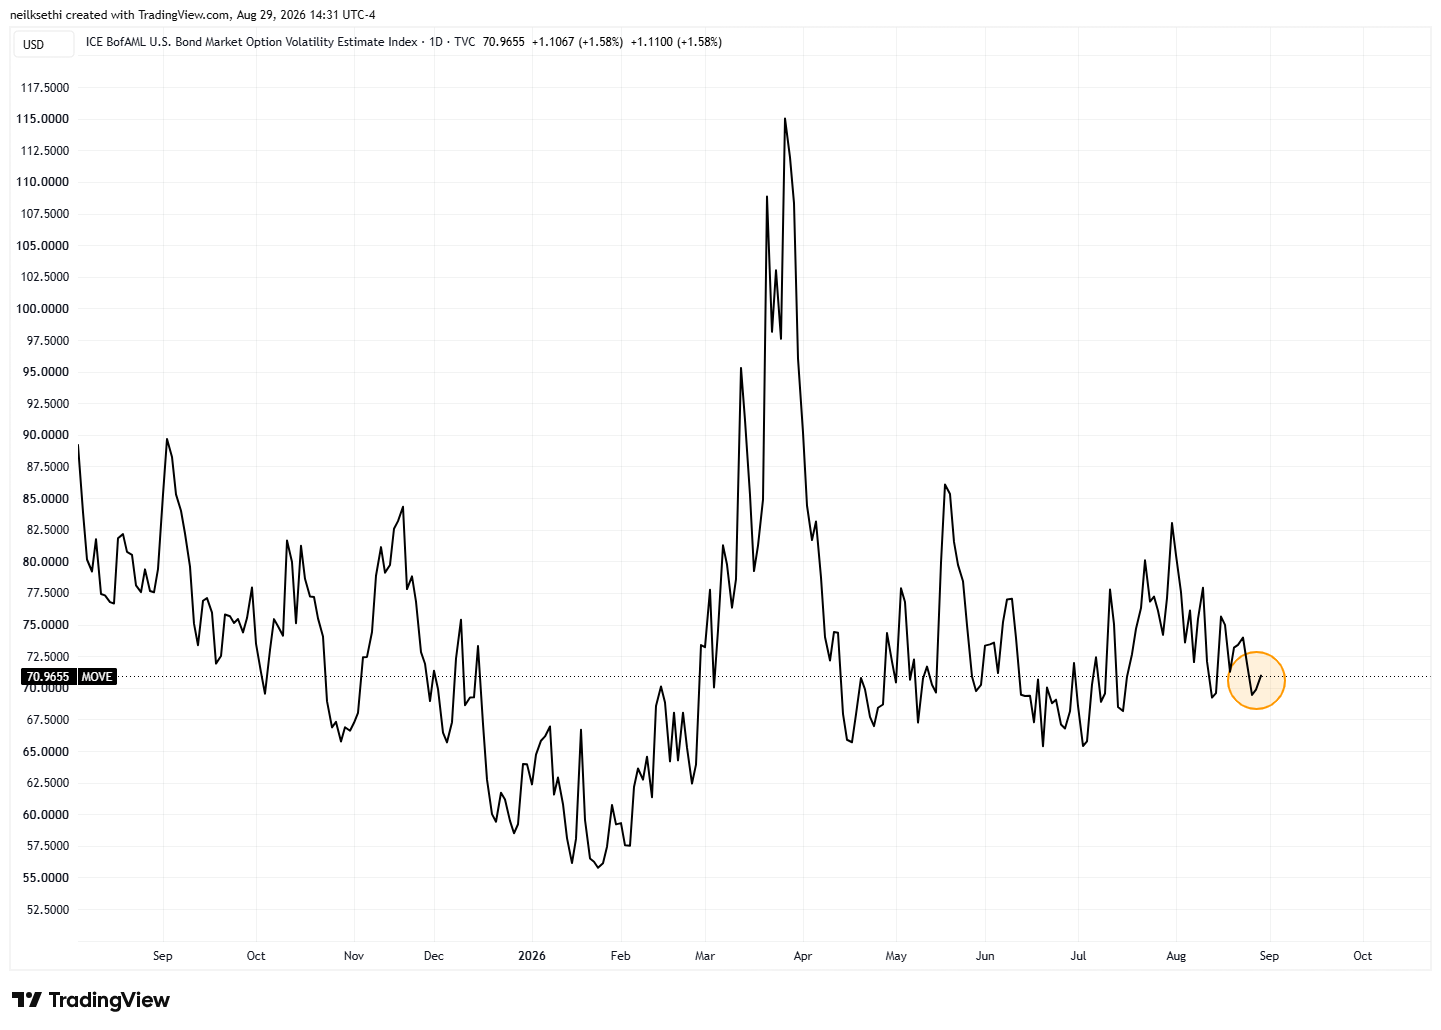
But at least expected 30-day Treasury market volatility (MOVE index) remains very contained.
So while many argued that a hawkish Warsh was necessary to control the long end and bring in term premium, it doesn’t appear that initially at least it was all that successful. Early days, though, so we’ll see where the coming weeks take us.
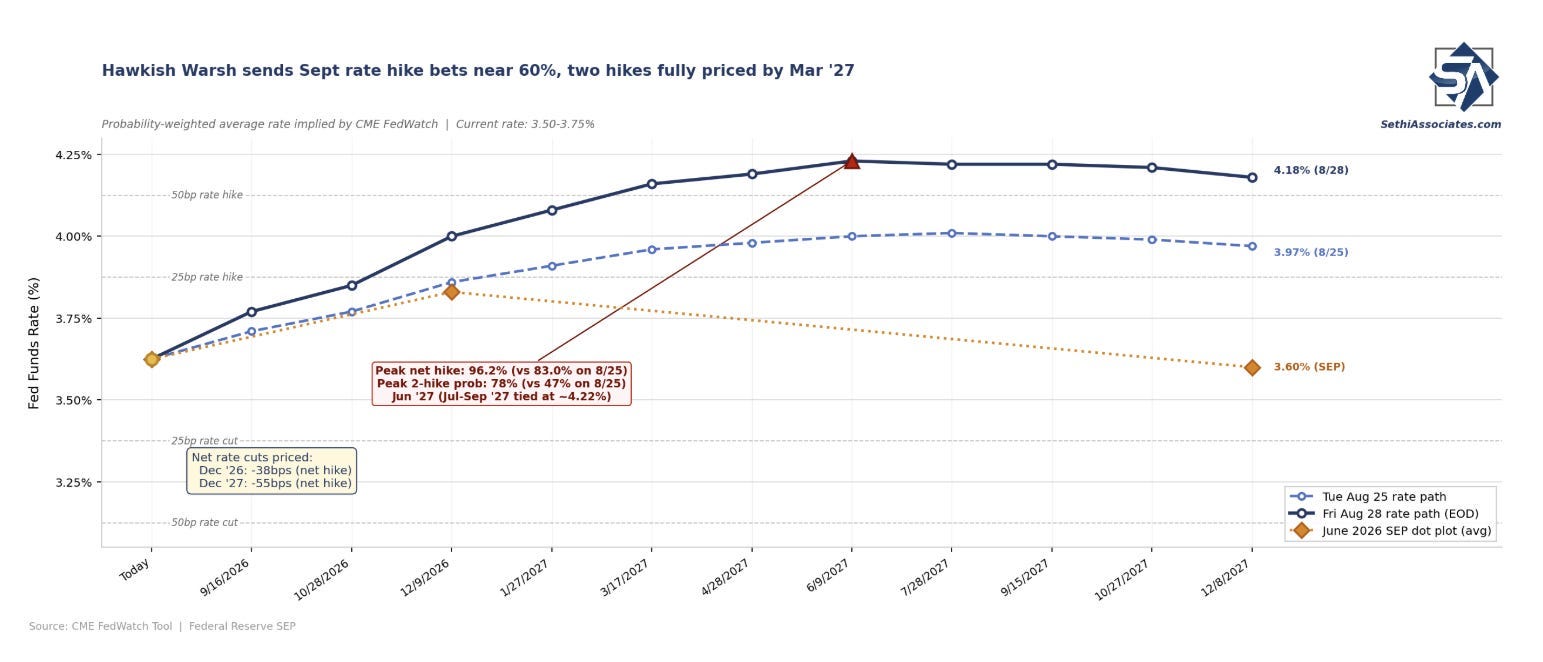
But there’s little question that the September meeting is not only “in play” but expectations have tipped to better than 50/50 that there’s a hike, while two hikes now are fully priced by March.
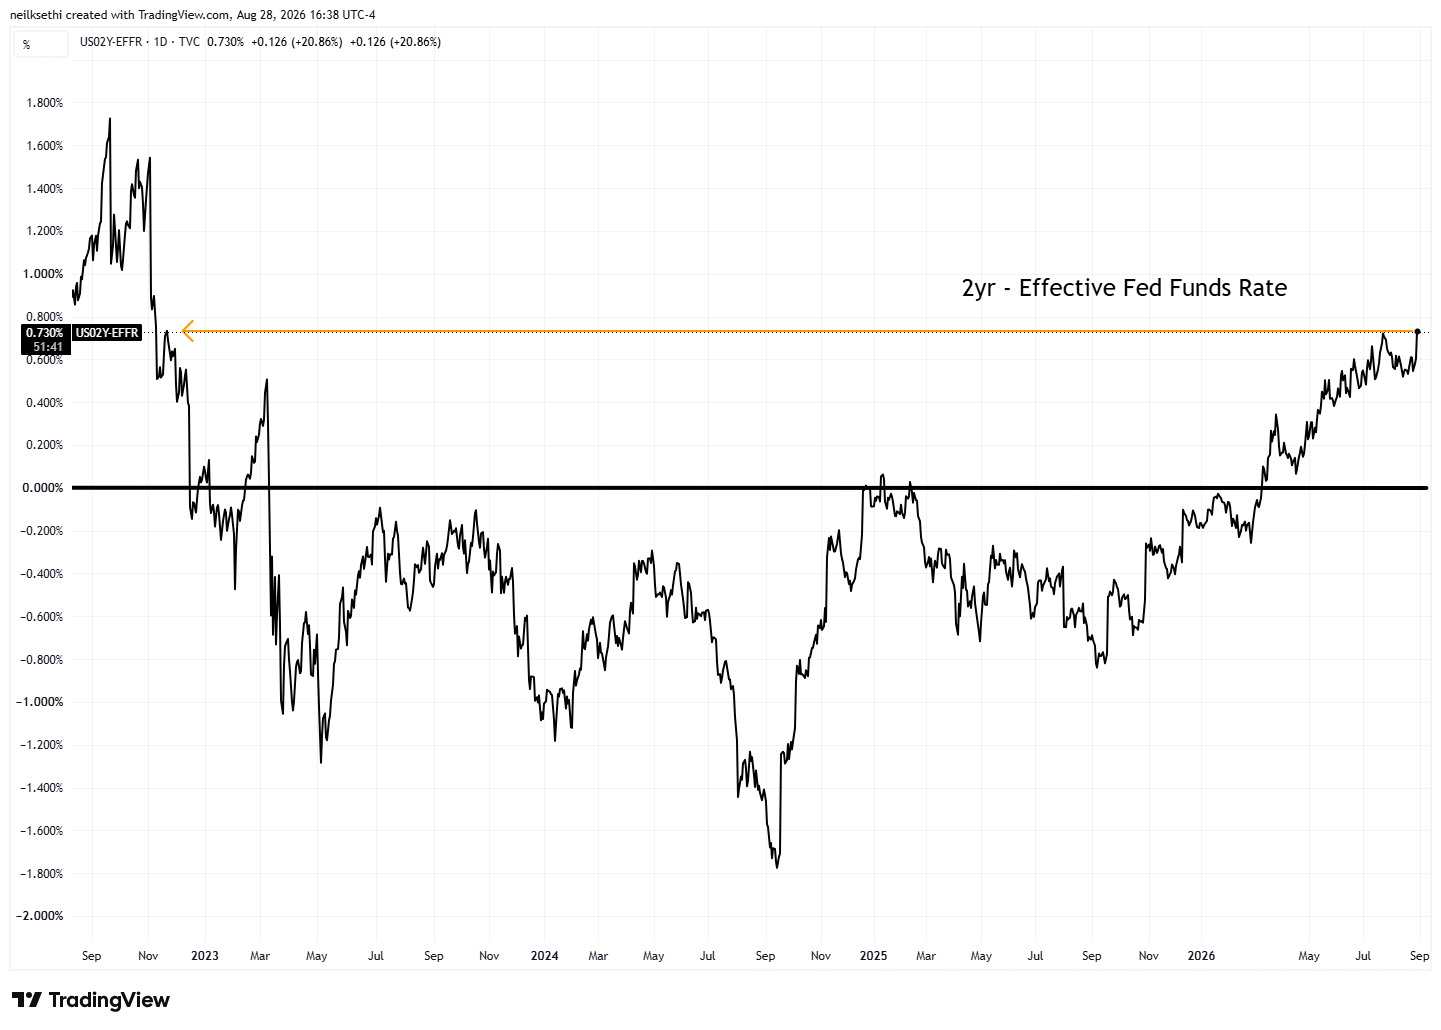
Which is also reflected in the Treasury market with 2-year yields (sensitive to Fed rate hike expectations) now ~73 basis points above the Effective Fed Funds rate (red line, basically the market pricing for Fed Funds), the most since November 2022.
But so far Warsh’s speech hasn’t seen much change in analyst expectations. Goldman was not expecting rate hikes this year, and they stuck with that call.
Warsh’s speech suggests that a hike in September is possible if the August CPI and PPI reports come in firmer than expected, but we continue to expect that core CPI and core PCE inflation will print at around 0.2% month-over-month in August and that the FOMC will remain on hold.
While BofA reaffirmed their call for three hikes this year starting in September after having backed away from it somewhat a couple of weeks ago. (Note: I wouldn’t normally post their note directly but someone else posted it on X so I assume it’s fair game).
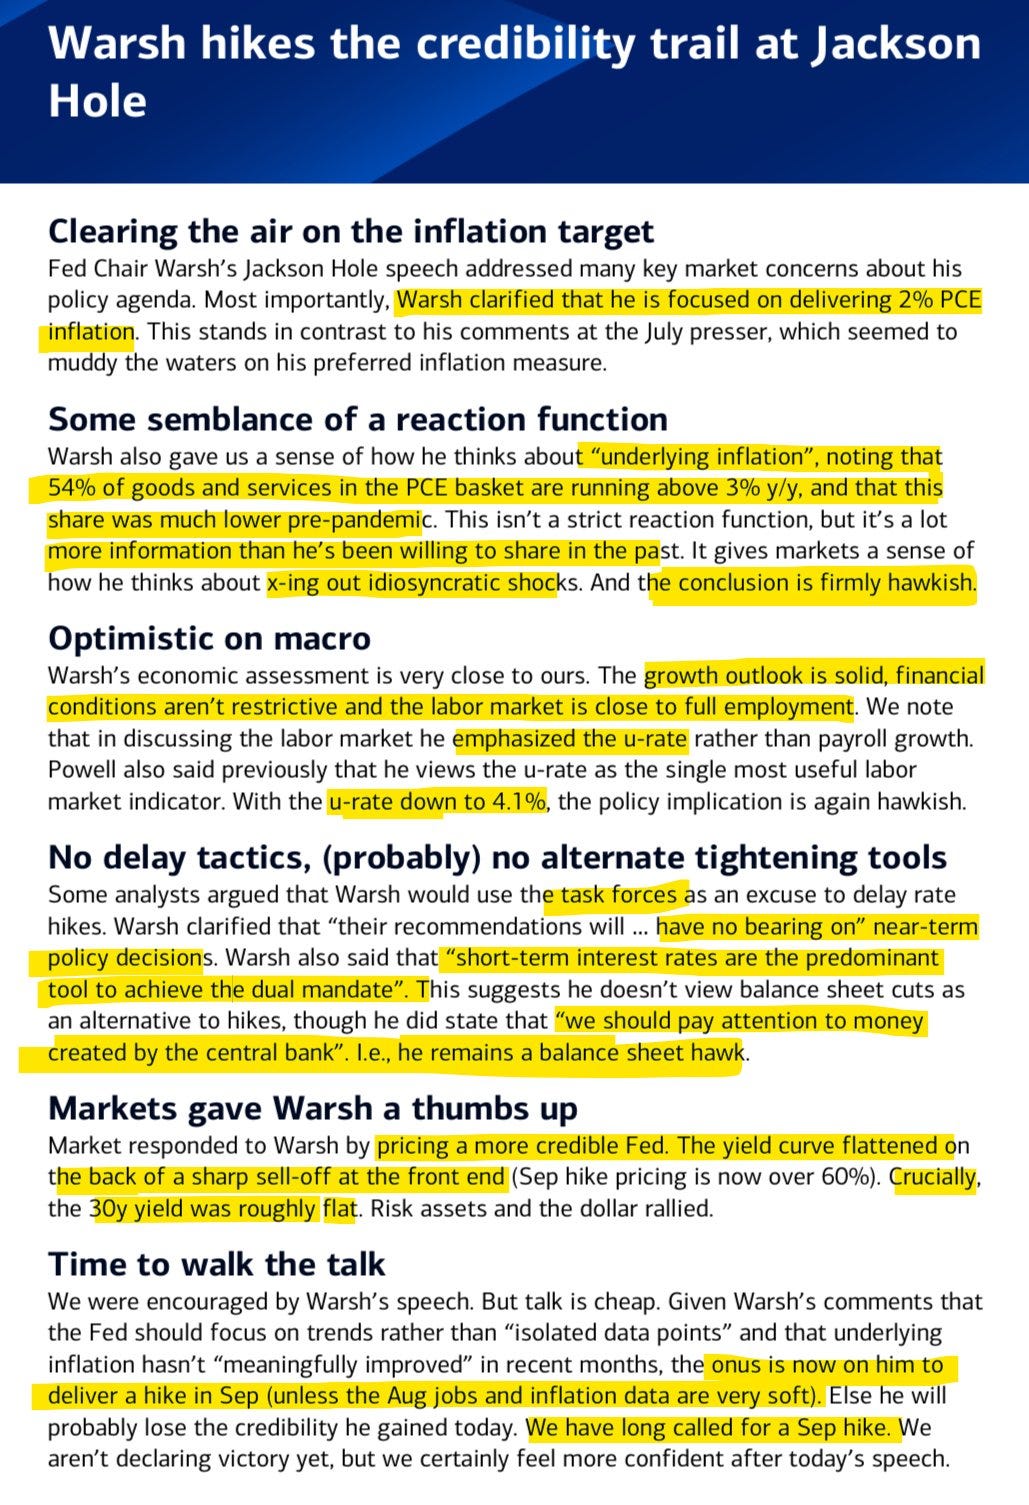
Their key takeaway is “We were encouraged by Warsh’s speech. But talk is cheap… the onus is now on him to deliver a hike in Sep (unless the Aug jobs and inflation data are very soft). Else he will probably lose the credibility he gained today. We have long called for a Sep hike. We aren’t declaring victory yet, but we certainly feel more confident after today’s speech.”
While JPM (Feroli) has been in the middle looking for a December hike:
We continue to expect that a hike won’t come until December, though agree that the September meeting is live. Moreover, regardless of the exact timing of hikes, Warsh’s speech suggested a Chair more willing to translate his concern about inflation into a policy tightening.
While a summer downside surprise in jobs is possible, the unemployment-rate trend should be sufficient to leave FOMC members with a reasonably favorable view of the labor market. The focus would then shift to the next inflation report, which should carry more weight for the FOMC outcome. A monthly inflation reading in the low 0.2% range would probably be sufficient to keep the Fed on hold for a little while longer, though the decision remains a close call.
In terms of my overall takeaway it seems that Warsh planted himself, at least rhetorically, in the middle of the doves (who see rates as modestly restrictive, were encouraged by the July inflation prints, and would stay on hold at least in the near term as long as inflation was showing signs of moderating) and the hawks (who took little comfort from the July inflation prints noting elevated services prices and inflation breadth and who see rates as not restrictive requiring immediate hikes). Whether he “delivers” as BofA indicates remains to be seen.
I had initially penciled in Warsh as a Chair who would push the committee to cuts if possible, if for no other reason than that was the whole point of him being nominated by Trump. But I have always been nagged by the fact that outside of the past couple of years Warsh has been rather hawkish, so much so that he was an outlier looking for rate hikes during the GFC, arguing that high unemployment had become “structural,” so the Fed needed to ignore the unemployment and focus on their inflation mandate.
So, quite frankly, I don’t really know what to make of him now. But it’s early days, and I and everyone else will get a much better feel as time goes by. But one thing hasn’t changed and that’s the fact that we very much remain data dependentwith the key inputs the August employment and CPI/PPI reports, although after Warsh’s speech it seems more so the latter – a hot CPI likely seals a hike regardless of the employment report.
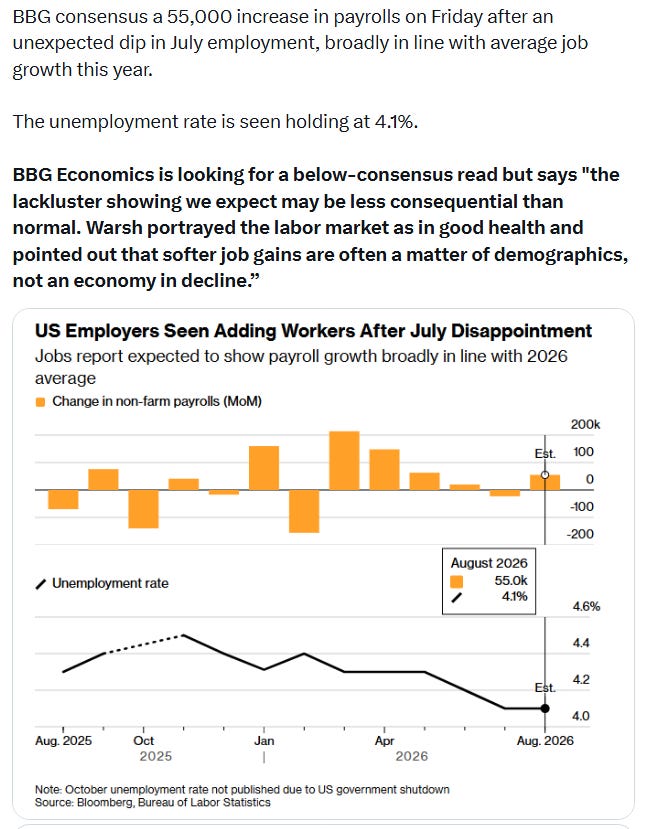
In that regard, BBG Economics is looking for a below-consensus read but says “the lackluster showing we expect may be less consequential than normal.Warsh portrayed the labor market as in good health and pointed out that softer job gains are often a matter of demographics, not an economy in decline.” That said they also note that the Fed has never raised rates after back-to-back negative payroll prints which is what we would have if the August report came in lower.
As noted in previous weeks, most think if they don’t go in September there’s little chance they go in October just a handful of days before the mid-term elections. That would push a first rate hike to December which stands at a 90% chance currently. A lot of data between now and then though.
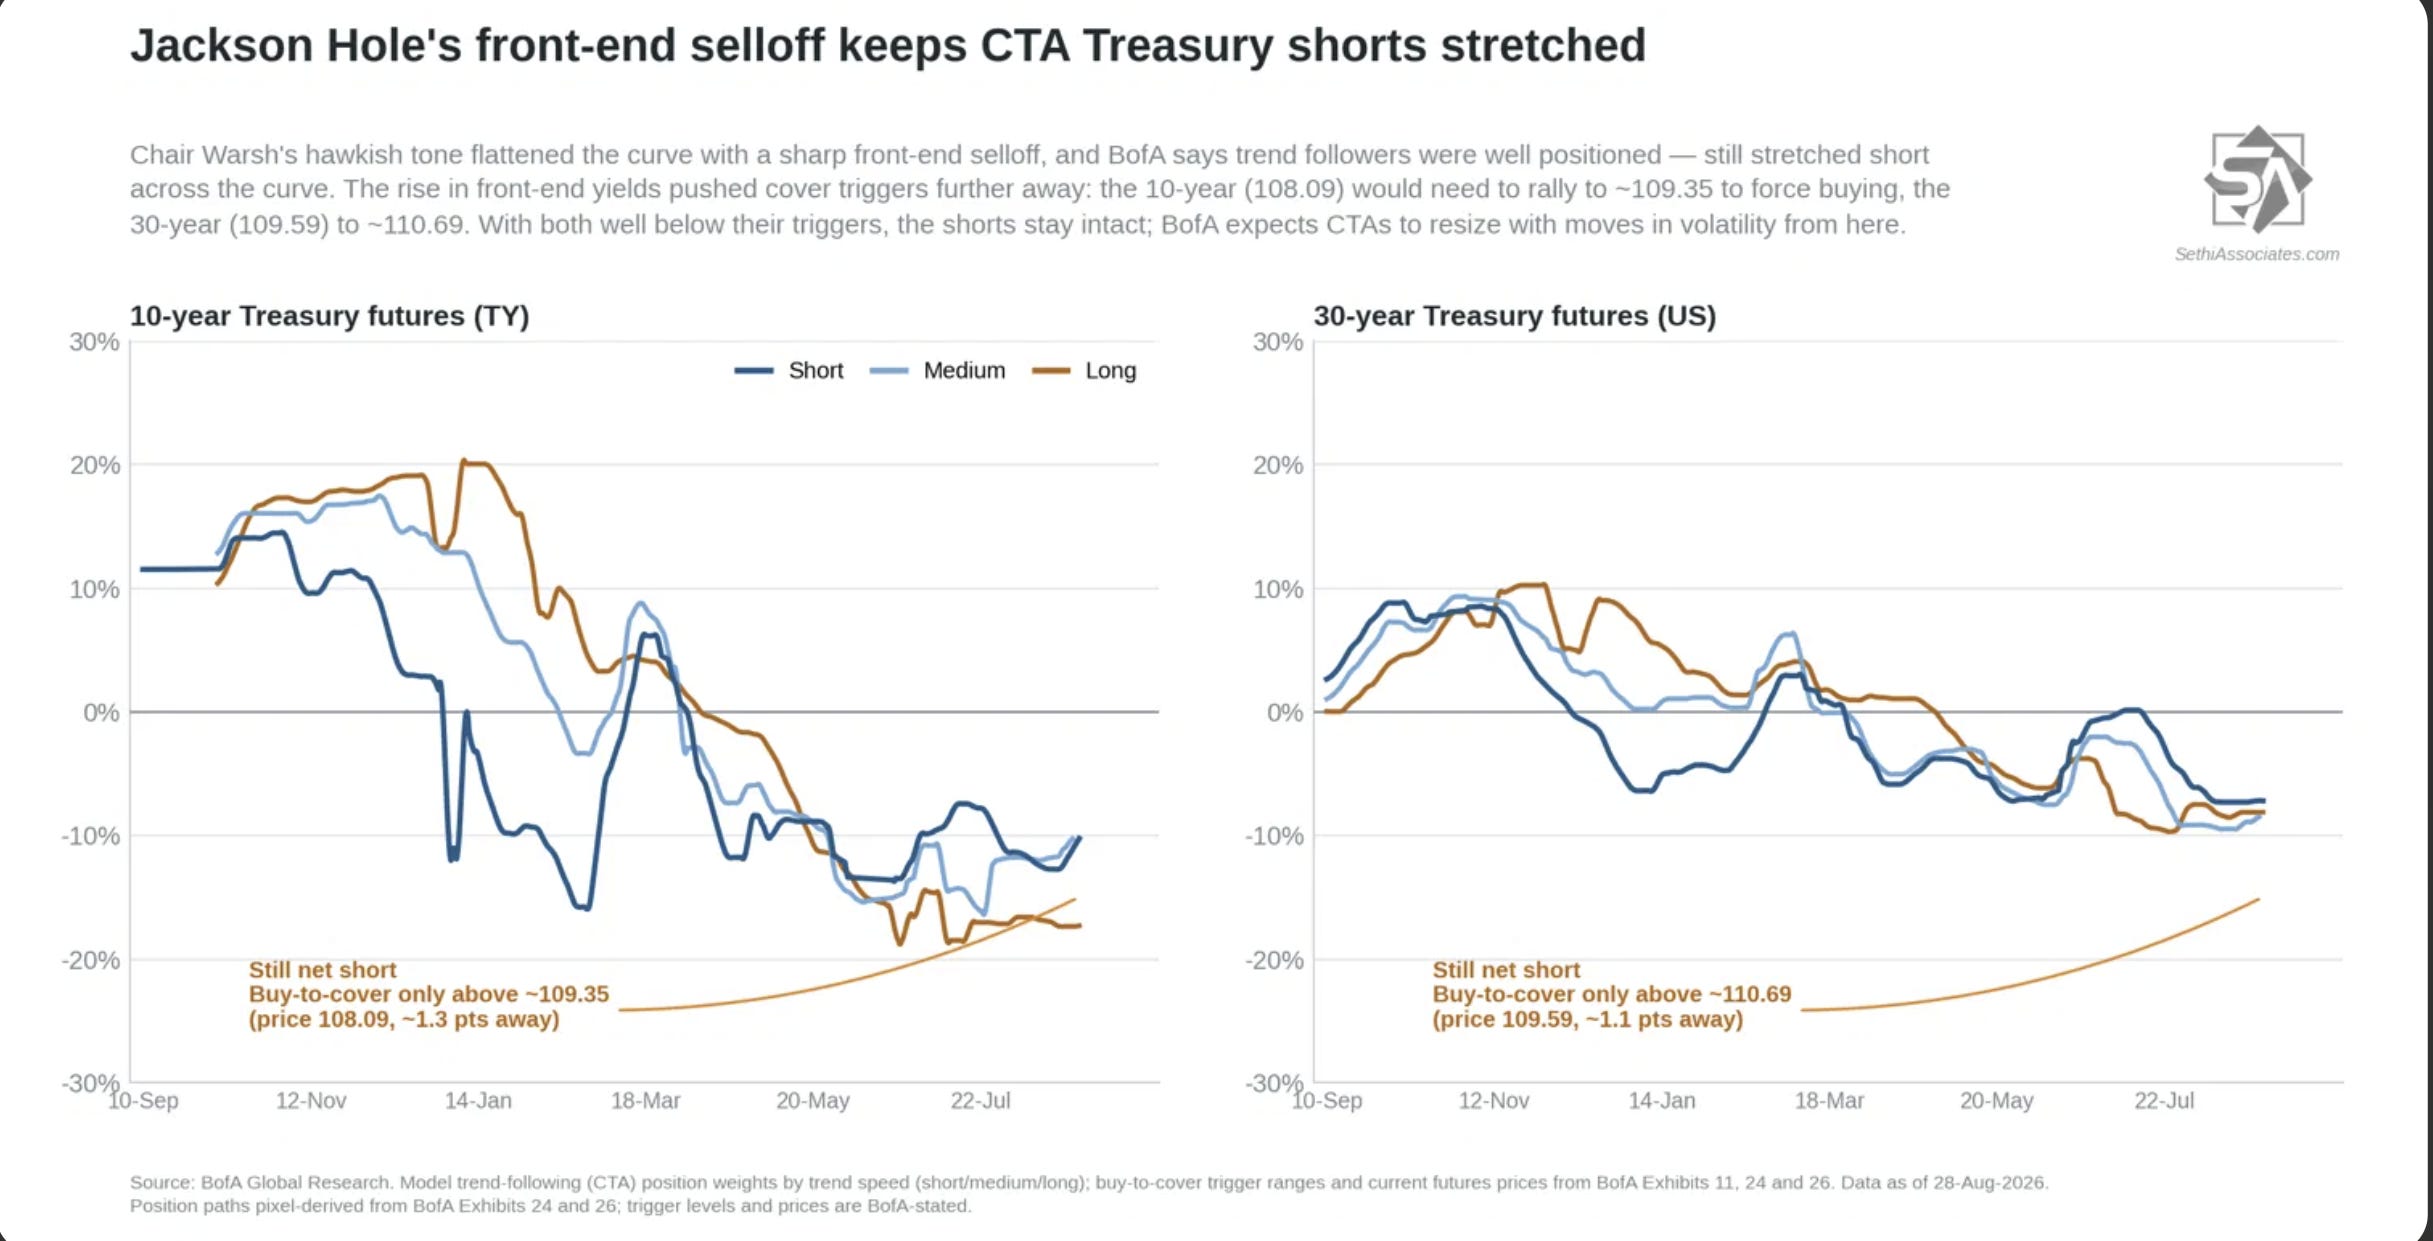
Turning back to rates, the drop in bonds (increase in yields) did nothing but push CTAs further short Treasuries where they already were “stretched” with cover triggers even further away.
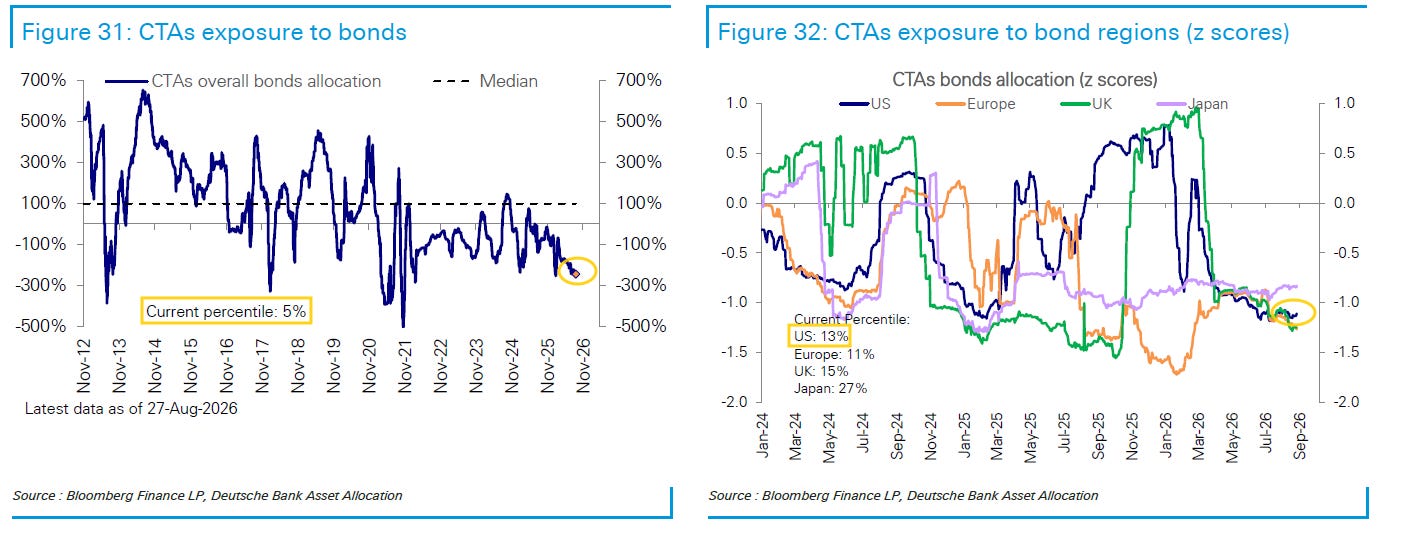
DB similarly sees global positioning in bonds short at just the 5th percentile to 2012 with the US at the 13th.
Overall, on yields, for now we remain in my new ranges established at the start of August: “I still think that 5% on the 10-year and 5.75% on the 30-year represent areas where we will see very strong buying. On the 2-year I think a lot depends on whether the Fed hikes. If they do there’s potentially another ~30 basis points to the upside ~4.75%). If they don’t, I think we’re going lower from here.” If we were to see any of those levels I would most likely be adding to my bond positions.
And, finally, I’d be remiss not to add this from MS’ Mike Wilson as it got quite a bit of attention when I posted it on X (not that I think we’re heading back to even 7% 10-year yields):
In a world of returning inflation, it is likely that economic cycles will no longer be able to persist for the extended 8–10-year periods experienced during the roughly 40-year disinflationary boom from 1982 to 2020. Instead, we are now in a period more akin to the post-World War II era, during which economic cycles were driven by higher nominal GDP growth and persistent inflation well above 2%. This implies greater economic volatility and a more reactive monetary-policy environment as inflation ebbs and flows.
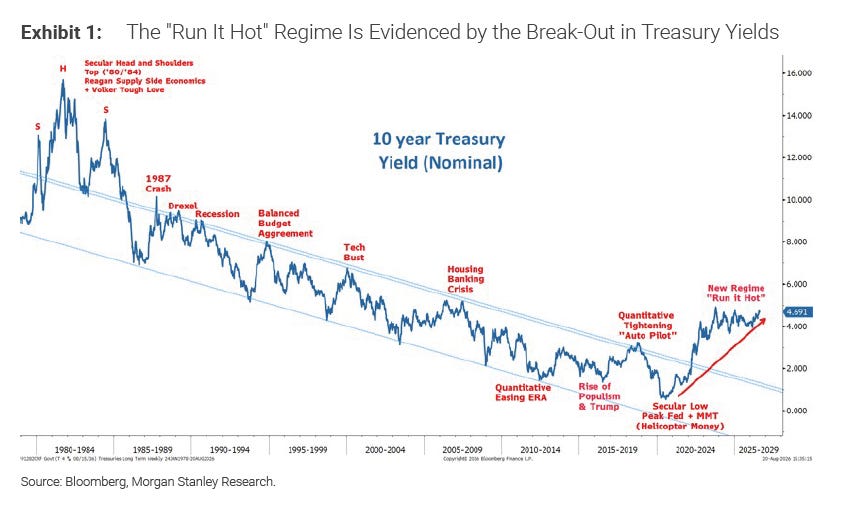
Perhaps the best evidence that the secular disinflation trend ended with COVID is the long-term chart of Treasury yields. As shown below, it does not require much technical-analysis experience to see how conditions have changed in the bond market. After what was perhaps the greatest secular bull market in Treasury bonds from 1982 to 2020, the reversal is clear, with important implications for all capital markets.
This narrative is now widely appreciated, but in our view it is far from over. Based on the well-established 36-year peak-to-trough Kondratieff cycle for bonds, we believe the long-term trend in yields remains higher, with occasional cyclical bond bull markets along the way—much like the period from 1945 to 1982, the prior roughly 36-year secular bear market for bonds.
Wrap-Up
I noted last week the observation from Deutsche Bank that
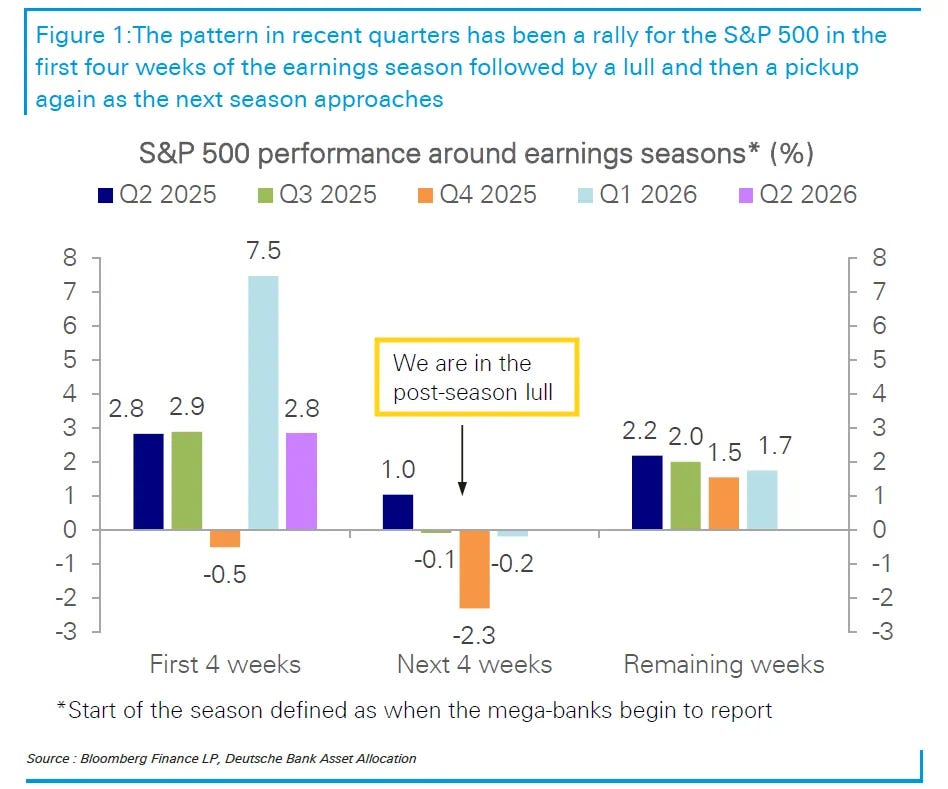
The S&P 500 has recently followed a clear earnings-season pattern: it rises through the first four weeks, pauses as reporting activity fades, and then picks up again heading into the next season. … The market is currently in this middle “lull” phase.
As I mentioned then that “lull phase” if correct will extend another week or so. And you can add poor seasonality to that (although as Ryan Detrick mentioned maybe not), along with pressures from yields and an increasingly hawkish Fed. Perhaps my largest concern is with systematic positioning which is by any measure overweight and by some measures quite extended, leaving that positioning vulnerable to either a jump in volatility or further equity declines exceeding 2% or so.
That said, the economy continues to look resilient, even if uneven, with GDP trackers remaining consistent with solid growth. Earnings have been extraordinary, and expectations are for those to slow but remain at double-digit levels through 2027. Valuations have continued to ease, and positioning is not uniformly stretched, especially on the discretionary side where there is plenty of room for it to move higher. Outside of a couple of outliers (NAAIM and Bull & Bear) sentiment remains fairly neutral as well.
Dealer gamma is positive again (suppressing volatility which encourages larger systematic holdings), buybacks are back in full force, retail continues to keep allocations high. All of these factors do not eliminate downside risk, but they do make it harder to become too negative unless the data, rates, or flows deteriorate more meaningfully.
So my view is that the setup remains constructive but perhaps less forgiving. The bull case remains intact until proven otherwise, but the market has some “worries” it will need to climb in September. But of course we know pullbacks and chop are part of the plan.
It is an interesting week with a lot of data but not much of which is likely to influence the Fed (and so the markets) in the short term (outside of either a huge beat or a huge miss on NFP).
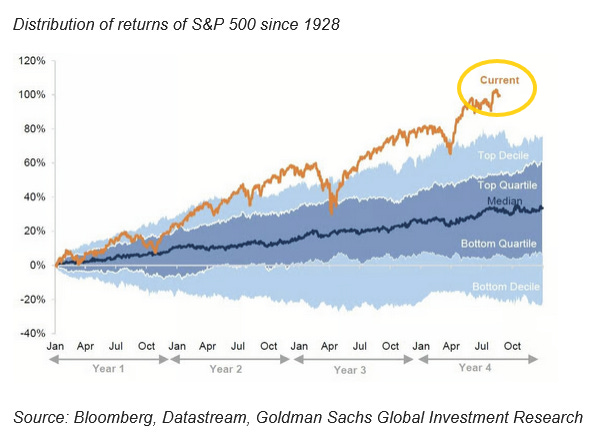
Equity returns since January 2023 have also been remarkably strong, so it would not be surprising to see some mean reversion or at least more chop. But that certainly doesn’t mean that needs to happen now.
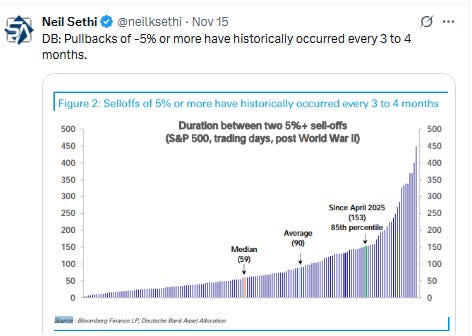
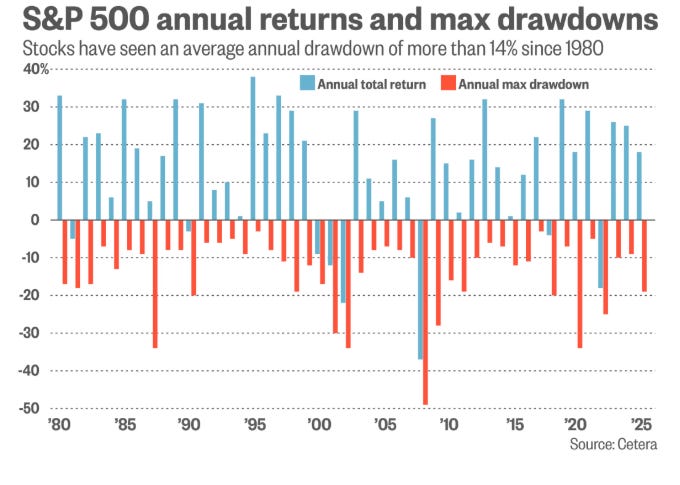
And as, always, remember that pullbacks/corrections are just part of the plan.