Bad News Was Good News Friday — for Stocks, Not Bonds
Payrolls missed every estimate, raising bets for an October FOMC hold, and the Nasdaq-100 powered to a record high. But Treasury yields reversed an early drop.
You've reached your free article limit
You've read 0 of 1 free Pro articles.
Quick Summary
- Stocks rallied after a surprisingly weak September jobs report reinforced bets for an FOMC hold in October, with growth stocks leading the charge and pushing the Nasdaq-100 index to a record high. The rally was the broadest of the week but a reversal higher in Treasury yields kept pressure on many sectors despite a drop in oil prices.
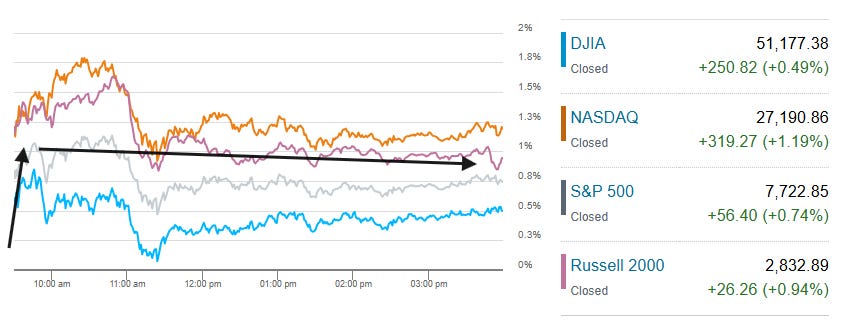
- Indices opened solidly higher but stalled as yields turned back up. Growth led with the Nasdaq +1.2%, but the Russell 2000 small cap index was still +0.9% (despite the rise in yields), S&P 500 was +0.7% while the Dow Jones Industrial Average lagged +0.5% as did the equal-weighted S&P 500 finishing up just +0.3%.
- Nonfarm payrolls rose just 29,000, missing every estimate in Bloomberg’s survey, and the prior two months were revised down by 60,000 jobs while year-over-year wage growth slipped to the slowest since 2021. But the household survey told a different story with the second-strongest job growth (after August) since January 2025 along with a sharp rise in the labor force which saw the unemployment tick up (rounded) a tenth to 4.2%. Markets took their cure from the payrolls and wage data now seeing about a 78% chance the Fed stands pat in October (CME FedWatch).
- However, 2027 rate hike expectations would reverse their early softening and press to the highest since Wednesday with more than three rate hikes priced through next December (although still down from nearly four a week ago). Treasury yields would also reverse an initial drop (10-year +4bp to ~5.28% just two basis points from the highest close since 2002). The reversal was despite oil easing 2.1% to ~$91 after the G7 announced a coordinated 100-million-barrel release of petroleum and products (fuel) through the IEA. It also agreed not to restrict oil exports, an effort to bring down the soaring price of diesel and other fuels
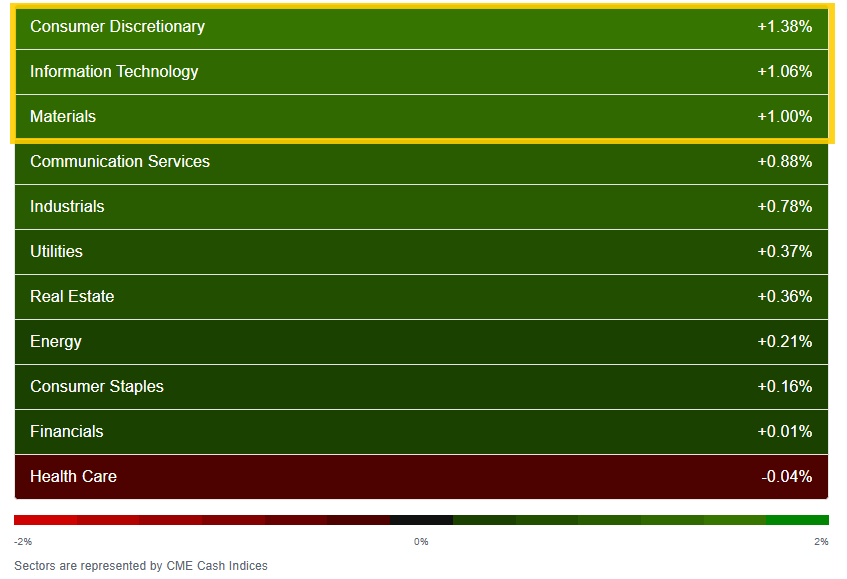
- Breadth was the best in weeks, with 10 of 11 sectors higher, but it was the megacap-growth sectors taking three of the top four spots: Consumer Discretionary and Tech (both up more than 1%), plus Communications.
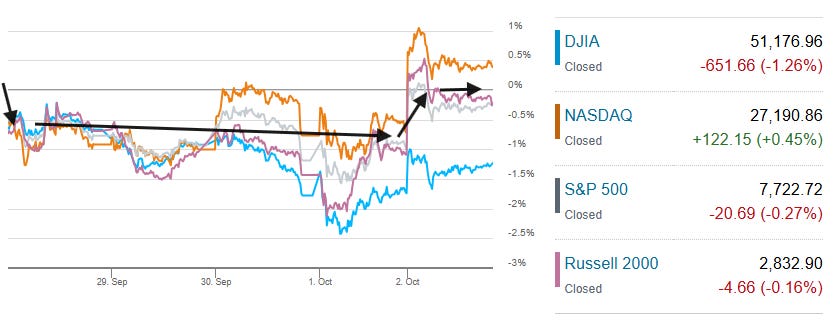
- For the week, only the Nasdaq finished green (+0.5%). The Russell 2000 fell 0.2%, the S&P 500 0.3% and the Dow 1.3%.
- Next week is a lighter one (full details at the end) before things pick up the following week.
Friday:
The week:
Market Commentary
Equities:
- “The good news here is that this should give us the positive bridge until we get to third quarter earnings, and those are going to be very strong, up almost 30% year over year,” Saira Malik, chief investment officer at Nuveen, told CNBC’s “Squawk Box.” “So, I think this could be the start of the Santa Claus rally that we’ve all been hoping for.”
- At Edward Jones, Angelo Kourkafas said the latest data pointed to a labor market that is cooling, but remains fundamentally healthy and is not showing signs of generating significant inflationary pressures.“While higher rates and geopolitical uncertainty may continue to weigh on valuations and contribute to periods of volatility, a still-expanding economy and robust earnings growth should help provide a solid foundation for stocks through the remainder of the year,” he added.
- “Over the past four years, global stock markets have reached one record high after another because corporate earnings are growing faster than most analysts expected. What many initially interpreted as a short-term recovery has proved to be a structural upswing with global reach,” Burkhard Varnholt, senior financial market adviser at UBS Switzerland, wrote Friday. “We therefore see the real story of this bull market as less about prices and more about an economic revival,” Varnholt added.
Bonds:
- “Going forward, 5% on the 10-year Treasury is the level to watch. If that becomes the new floor, it could challenge the idea that markets can continue to absorb higher rates without consequences,” said Bret Kenwell at eToro.
- “The slower growth in hourly earnings, even with hours worked up slightly, suggests negative real earnings growth. Though consumers have credit and some savings to potentially work through, I suspect there is a limit to how long real consumption can remain as robust as we saw in August. It’s another reason to think Treasury yields may have seen their high.” – Bloomberg Intelligence chief US interest-rate strategist Ira Jersey
NFP:
- Lots (and lots) of comments about the Fed/NFP in the NFP breakdown earlier today (at the end) – September Payrolls Miss Every Estimate, Wage Growth Slowest Since 2021
Stock and Sector Breakdown:
Does it count as broadening if the top is dominated by growth?
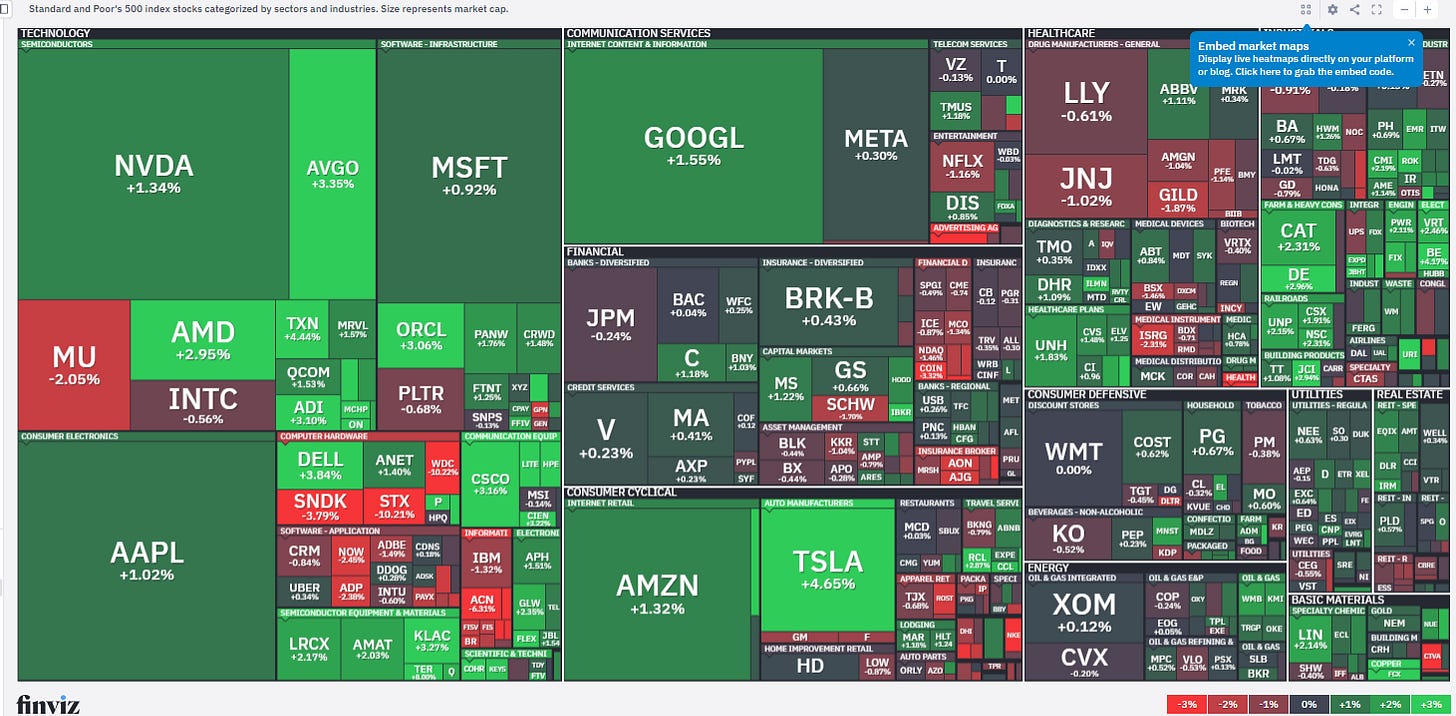
10 of 11 sectors higher Friday, the best in weeks (after 5 Thursday, 2 Wednesday, 4 Tuesday, 3 Monday) with three of the top four spots taken by the megacap-dominated growth sectors of Consumer Discretionary, Tech (both up over 1%), and Communications. Materials was also up 1%. Health Care in last place a second session, although was just marginally negative (less than 0.1%).
Technology and mega-cap growth stocks remained at the forefront of the advance. The PHLX Semiconductor Index (SOX) gained 2.4%, and the Vanguard Mega Cap Growth ETF (MGK) rose 1.0%.
Tesla (TSLA) +4.65% was the biggest winner in the top 10 S&P 500 components after the company’s Q3 deliveries came in well above estimates, with 486,532 units delivered during the quarter. This came in above analysts’ delivery estimate of 463,761 units, but was down year-over-year from 497,099 units. Relatedly, SpaceX (SPCX) +7.31%, which is not in the S&P 500, but is in the Nasdaq-100, was another top performer after a strong week that included a successful NASA astronaut launch and a Google AI satellite mission. The gains also came just days after Starship reached Earth’s orbit for the first time and successfully deployed 26 Starlink V3 satellites, which was an important step toward expanding SpaceX’s largest business. On Thursday, SpaceX launched NASA’s Crew-13 mission aboard a Falcon 9 rocket from Florida.
NVIDIA (NVDA) +1.3% was another notable name after Morgan Stanley put NVIDIA back atop its list of semiconductor stocks on Friday, touting the company’s range of customers and the importance of graphics processing units (GPUs) to agentic artificial intelligence. But not all Tech did well. Western Digital (WDC) -10.2% and Seagate Tech (STX) -10.2% were the two largest losers in the S&P 500 after Toshiba announced an expansion of HDD production in the Philippines intended to double production, raising concerns of overcapacity. That was even as Morgan Stanley said they would “gladly” buy the dip.
NIKE (NKE) -3.57% was another which ranked among the worst-performing S&P 500 components and fell to fresh decade lows following a disappointing FY27 outlook. If you missed it, Sarge wrote a piece about why he would Invest in Nike? Only With Your Money.
Teradyne (TER) +8.0% led all S&P 500 components on no news.
Other news:
Seeds and genetics company Vylor (VYLR) -1.5% was added to the S&P 500 on Thursday after it was spun off from Corteva the same day. The company replaced Corteva (CTVA) -5.2%, which will move to the S&P MidCap 400.
Also Moderna (MRNA) +0.6% will replace Warner Bros. Discovery (WBD) 0.0% in the tech-heavy blue-chip Nasdaq-100 index after the biotech’s shares have risen nearly sixfold over the past year.
[Note: chart uses futures prices.]
Despite the strong breadth, the number of large SPX winners (up over 3%) fell back to ~30 from ~45 Thursday, but up from 9 Wednesday, while the number of large losers (down over 3%) remained at 14. As mentioned previously, both of these metrics have remained very subdued since the start of August rarely getting above 50 and only once above 100.
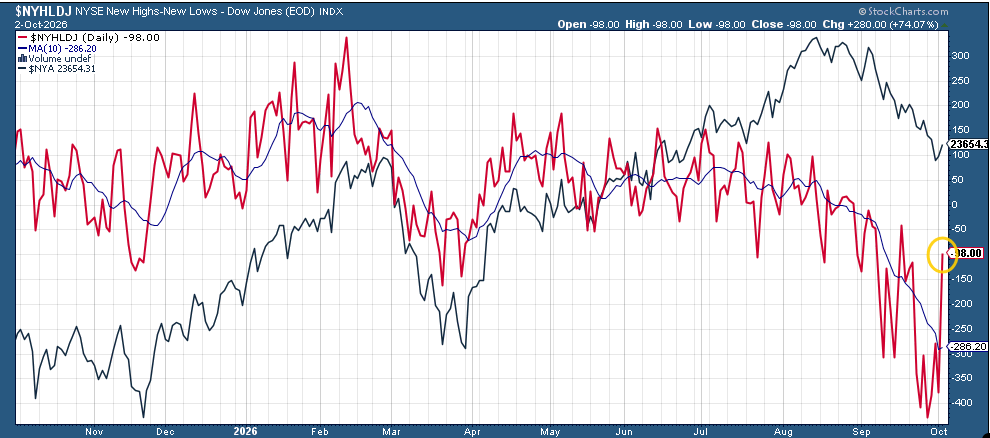
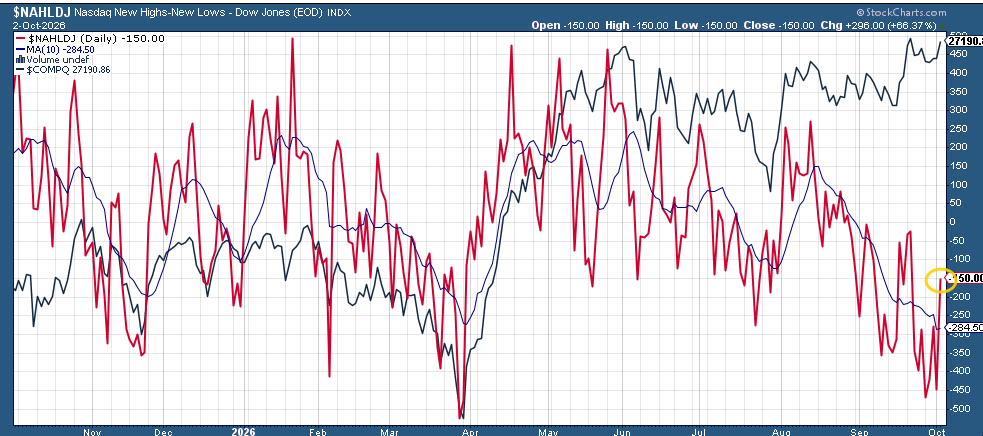
Positive volume was also better for a fourth day although mediocre on the NYSE and Nasdaq. Similarly new 52-week highs vs lows improved to -99 from -379 on the NYSE and to -157 from -446 on the Nasdaq. That’s the best since September 17th on the NYSE and September 23rd on the Nasdaq, but notably both are still negative.
In that regard, from MarketWatch:
Today was the 25th straight session that the Nasdaq saw more new 52-week lows than new highs, the longest such streak since the 43-day stretch that ended April 22, 2025. The key difference between then and now: On April 22 of last year, the Nasdaq Comp closed 19.2% below its then-record close reached five months earlier.
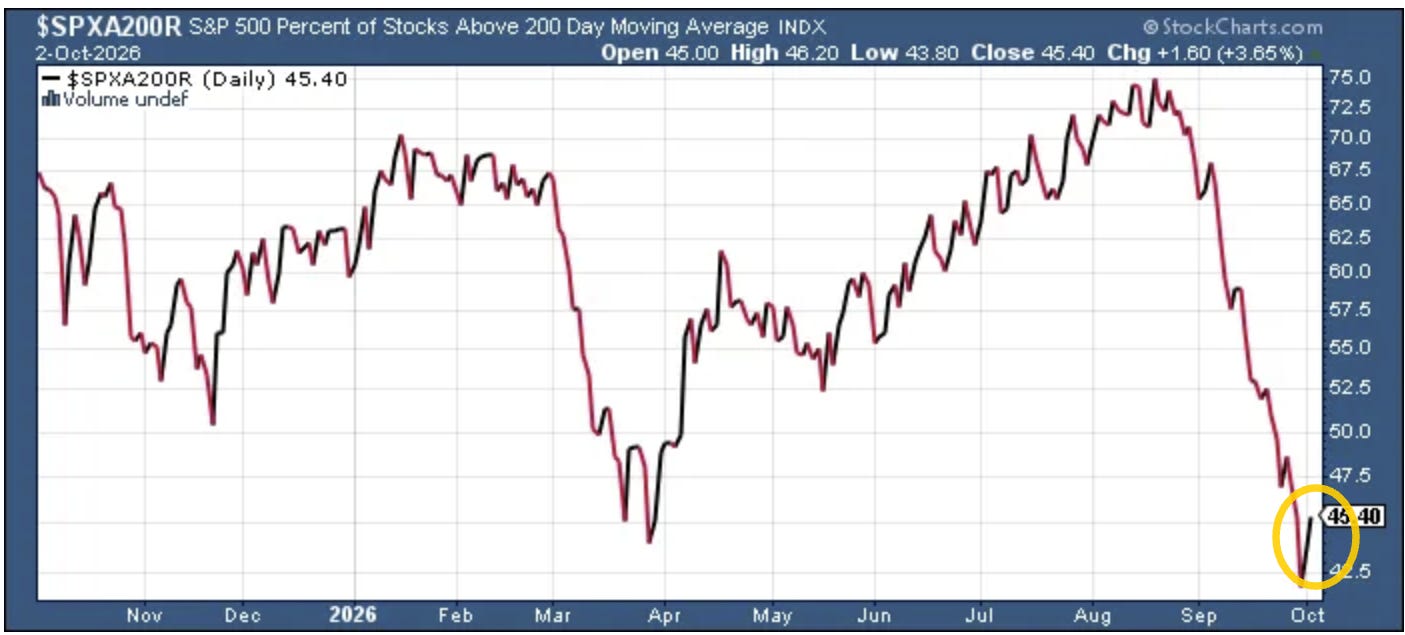
And we did see a continued turn higher in the percent of S&P 500 stocks trading above their 200-day moving average (although still well under 50%).
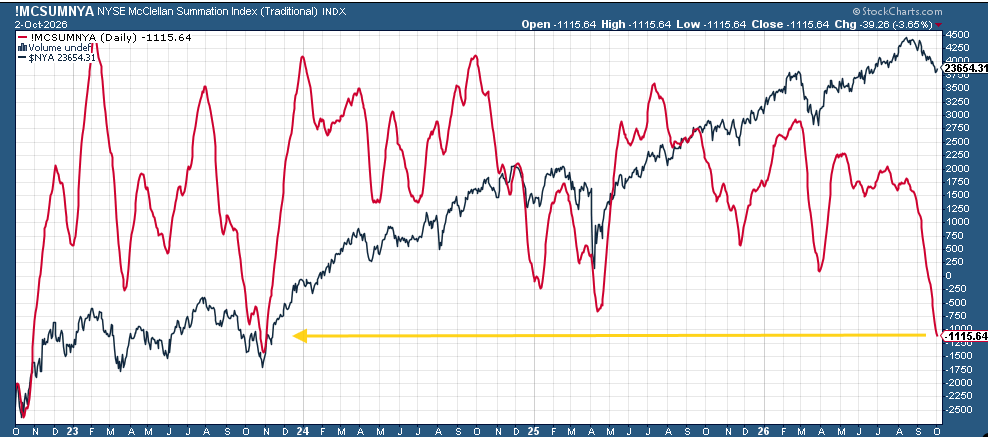
But with the growth-heavy advance, the McClellan Summation Index (red line, broadly whether the typical stock is doing relatively better or worse than the index) continues to plummet to new post-November 2023 lows, although it does take some time for this indicator to turn as it is a summation index.
Some other stock-specific commentary from TheStreet Pro:
- Chris Versace –
- Stephen Guilfoyle –
- Bret Jensen – Citigroup Turns to 2 Promising Biotech Stocks
A Look At The Charts
Note on all charts the colored lines are moving averages (the average price over the lookback period — days on the daily charts, weeks on the weekly charts):
20 = green
50 = purple
100 = blue
200 = brownException is monthly charts where blue is 10-month moving average and brown is 20-month moving average.
MACD = Moving average convergence/divergence line, a measure of momentum that compares longer term and shorter term momentum to gauge if a move is strengthening or weakening. This is probably my favorite individual indicator.
RSI = Relative Strength Index (basically what it sounds like) = measures the strength of the move comparing gains to losses over the given lookback window (I use the standard 14 periods).
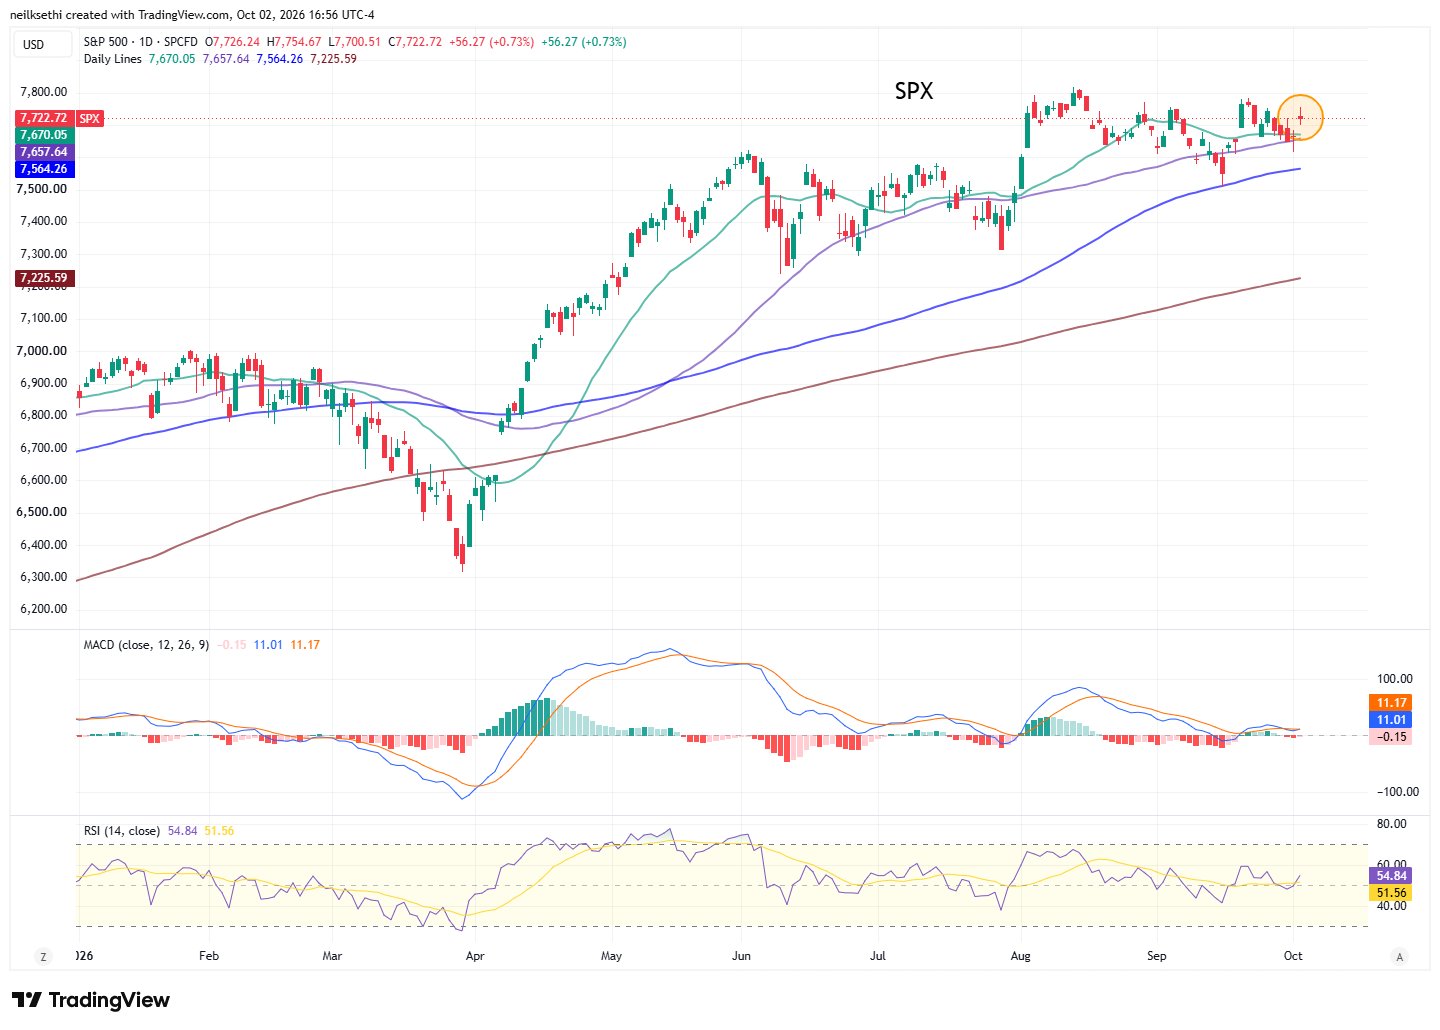
SPX recovered almost all of its losses for the week. Interestingly it was the fifth straight red candle (meaning closed lower than it opened). The daily MACD and RSI have turned back to a positive tilt overall.
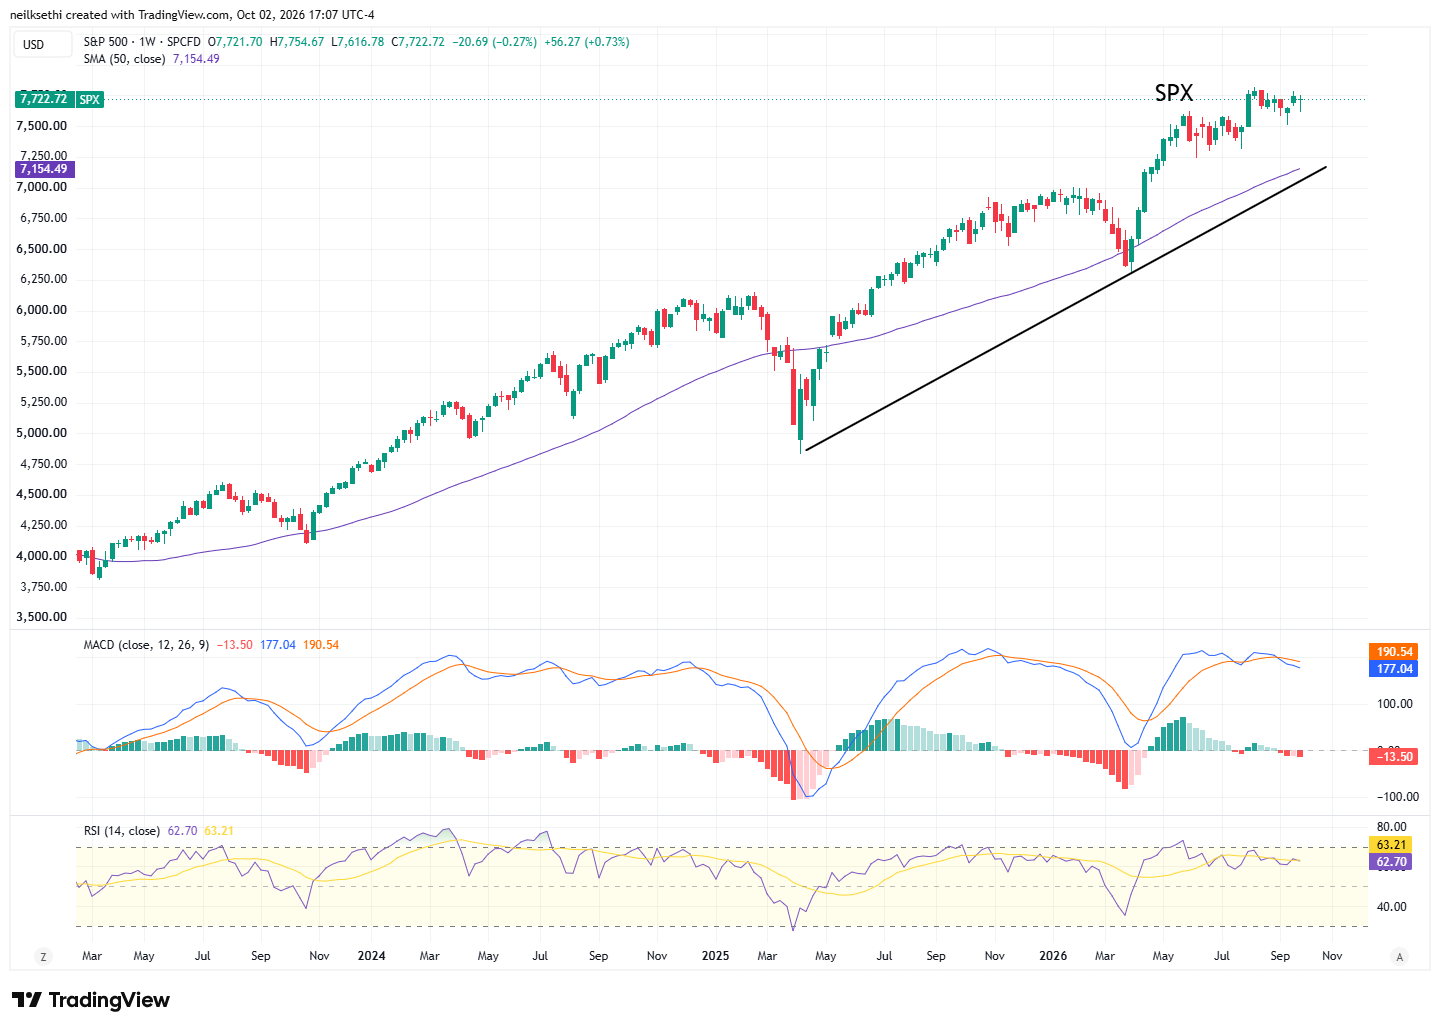
Weekly chart weaker with weekly MACD still negative although RSI is above 60. Most importantly, though, remains above a rising 50-week moving average (WMA) which to me means it remains in a medium-term uptrend.
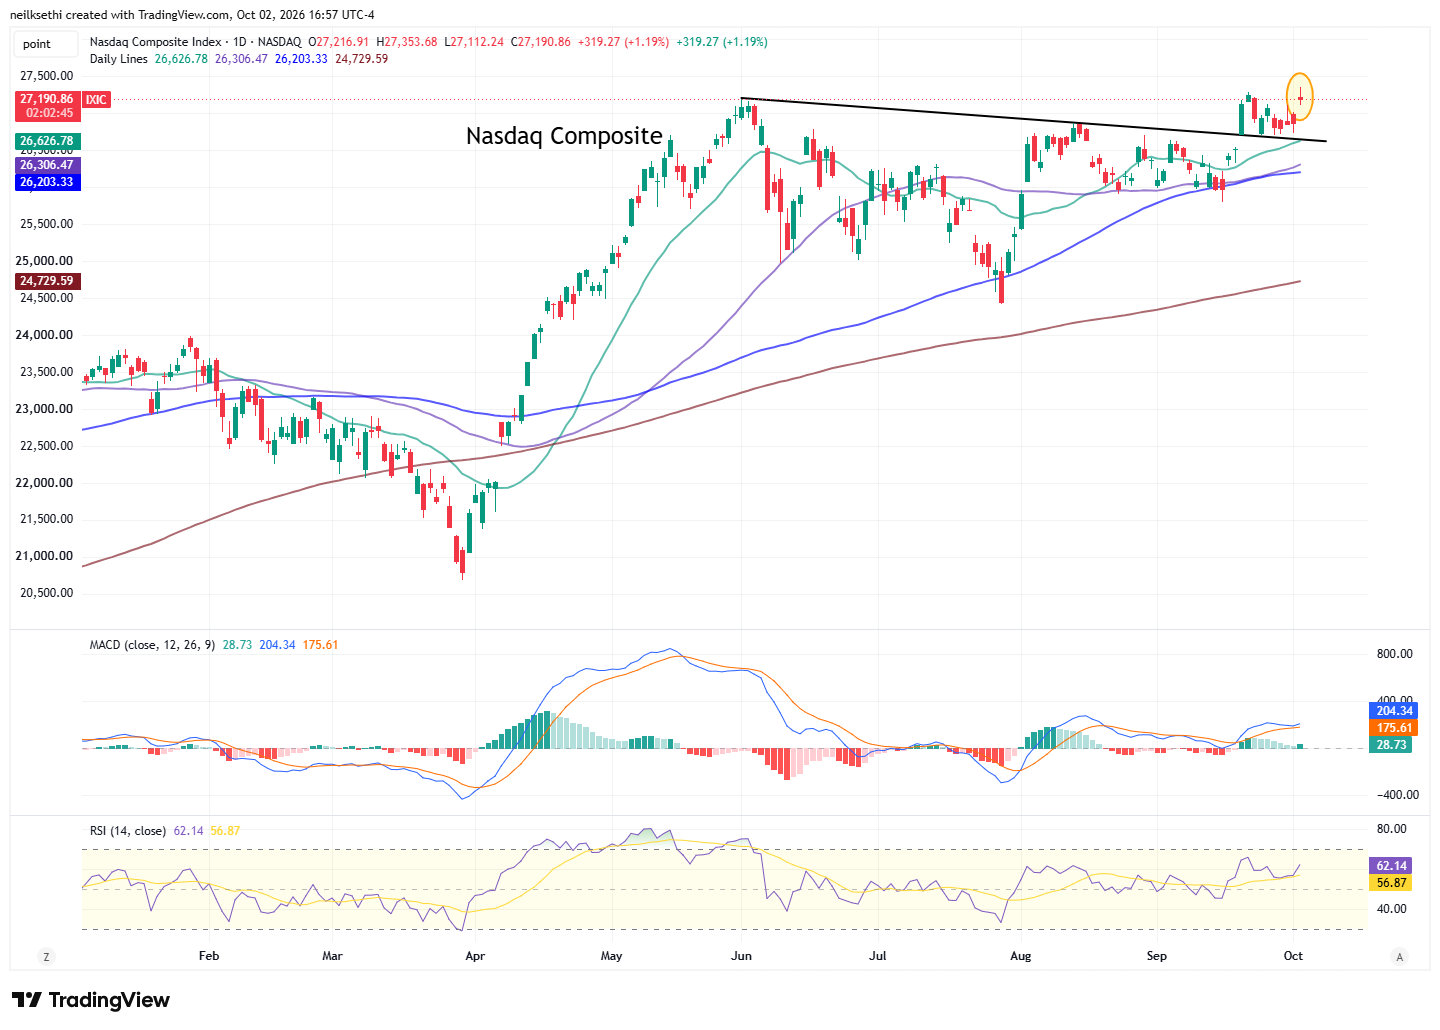
Nasdaq Composite jumped to an all-time high before falling back. Daily MACD and RSI are positive here.
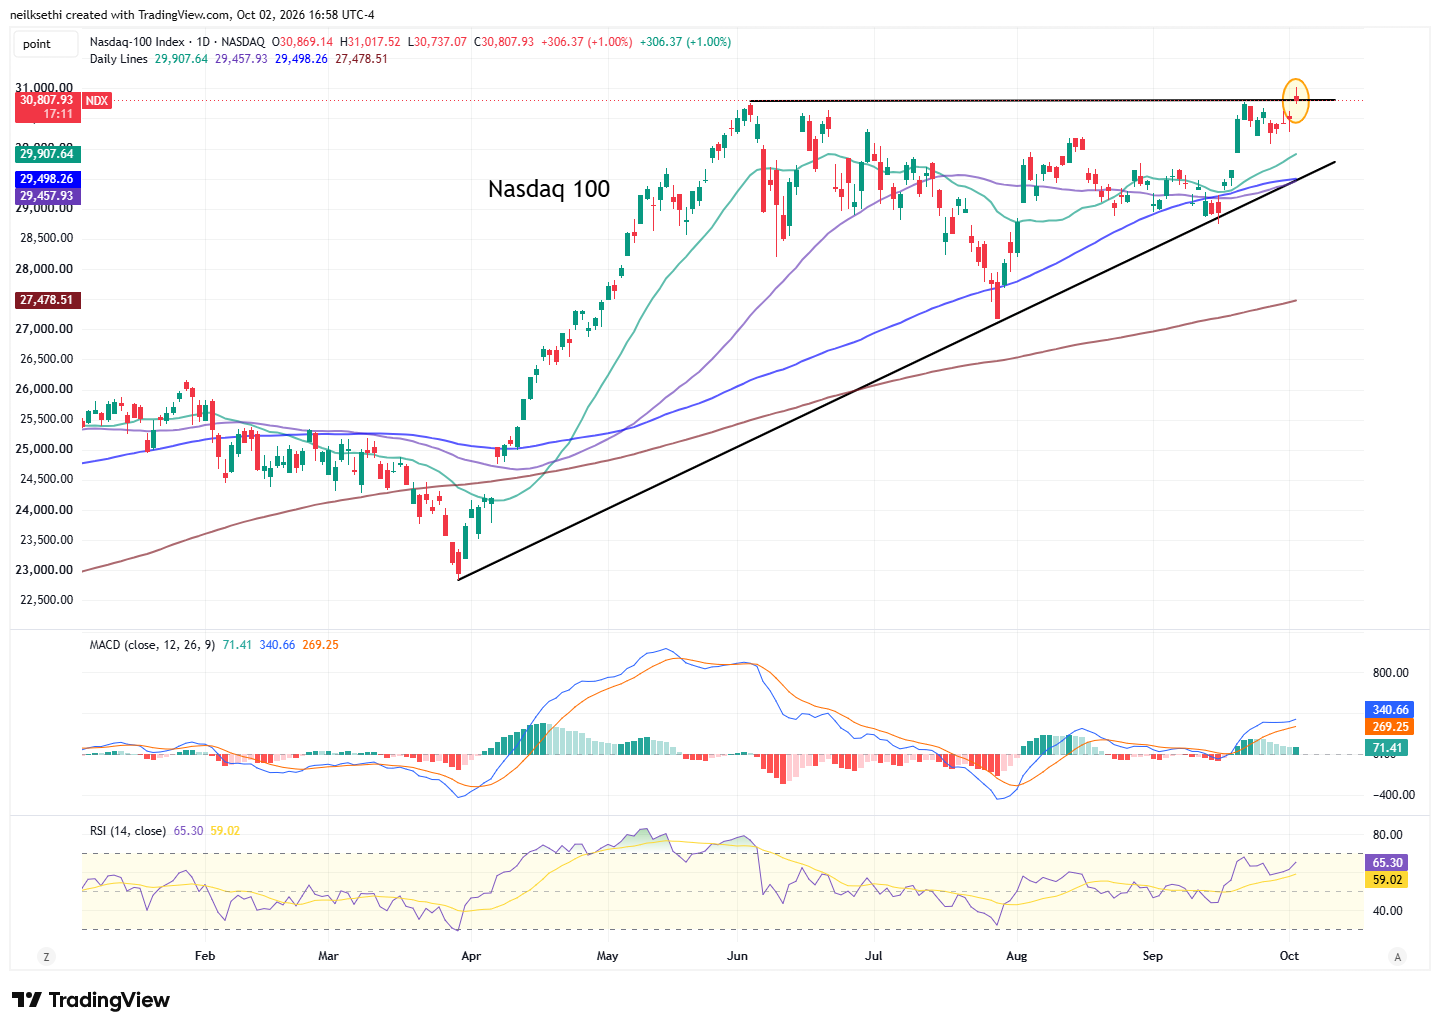
The Nasdaq-100 (QQQ) also hit an all-time high but was able to hold above through the close. Daily MACD and RSI even more positive here.
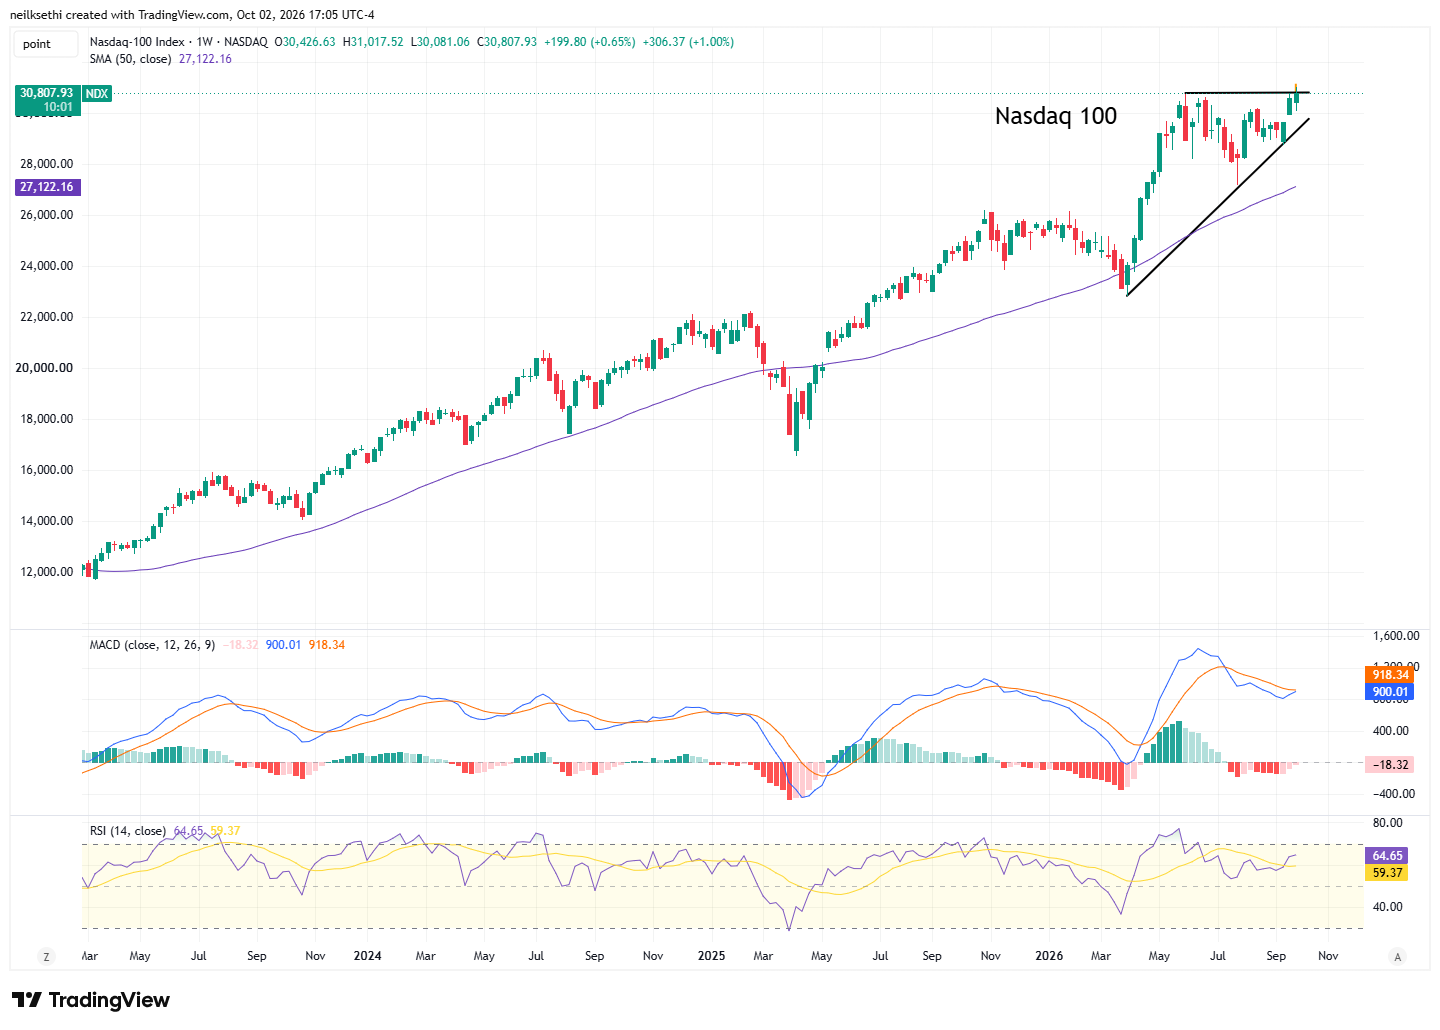
Weekly chart the strongest with the MACD near a positive cross and the RSI over 60. As with the SPX above a rising 50-WMA.
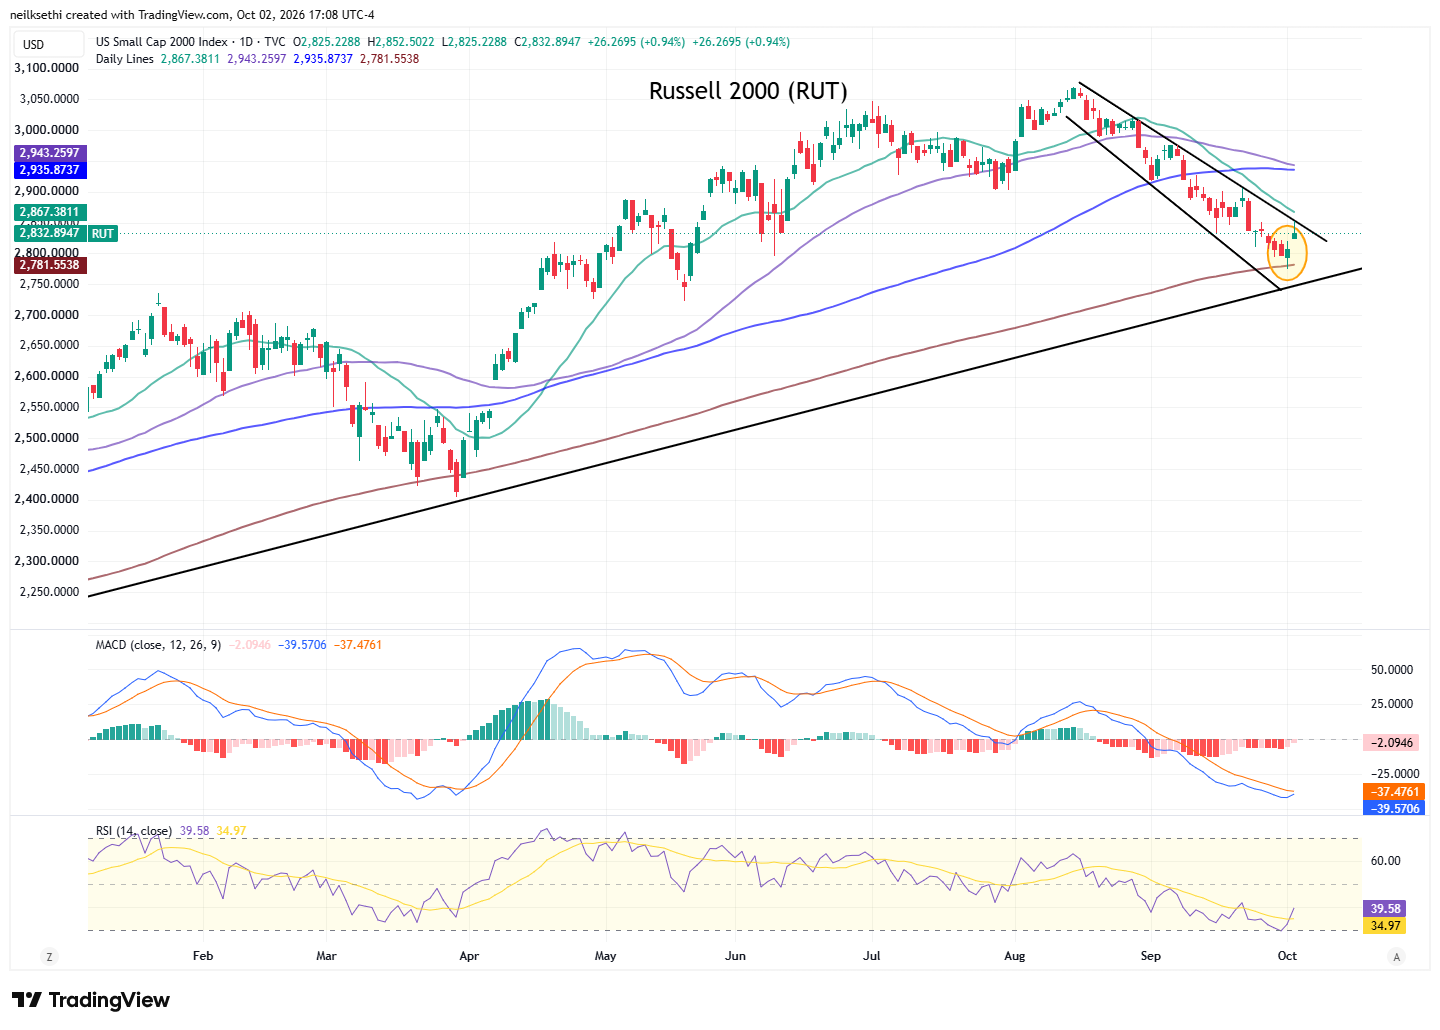
The Russell 2000 (RUT) pushed up to the top of its downtrend channel from its all-time high. Has the 20-DMA just above that, so some resistance it needs to work through. The daily MACD and RSI are improving but not there quite yet.
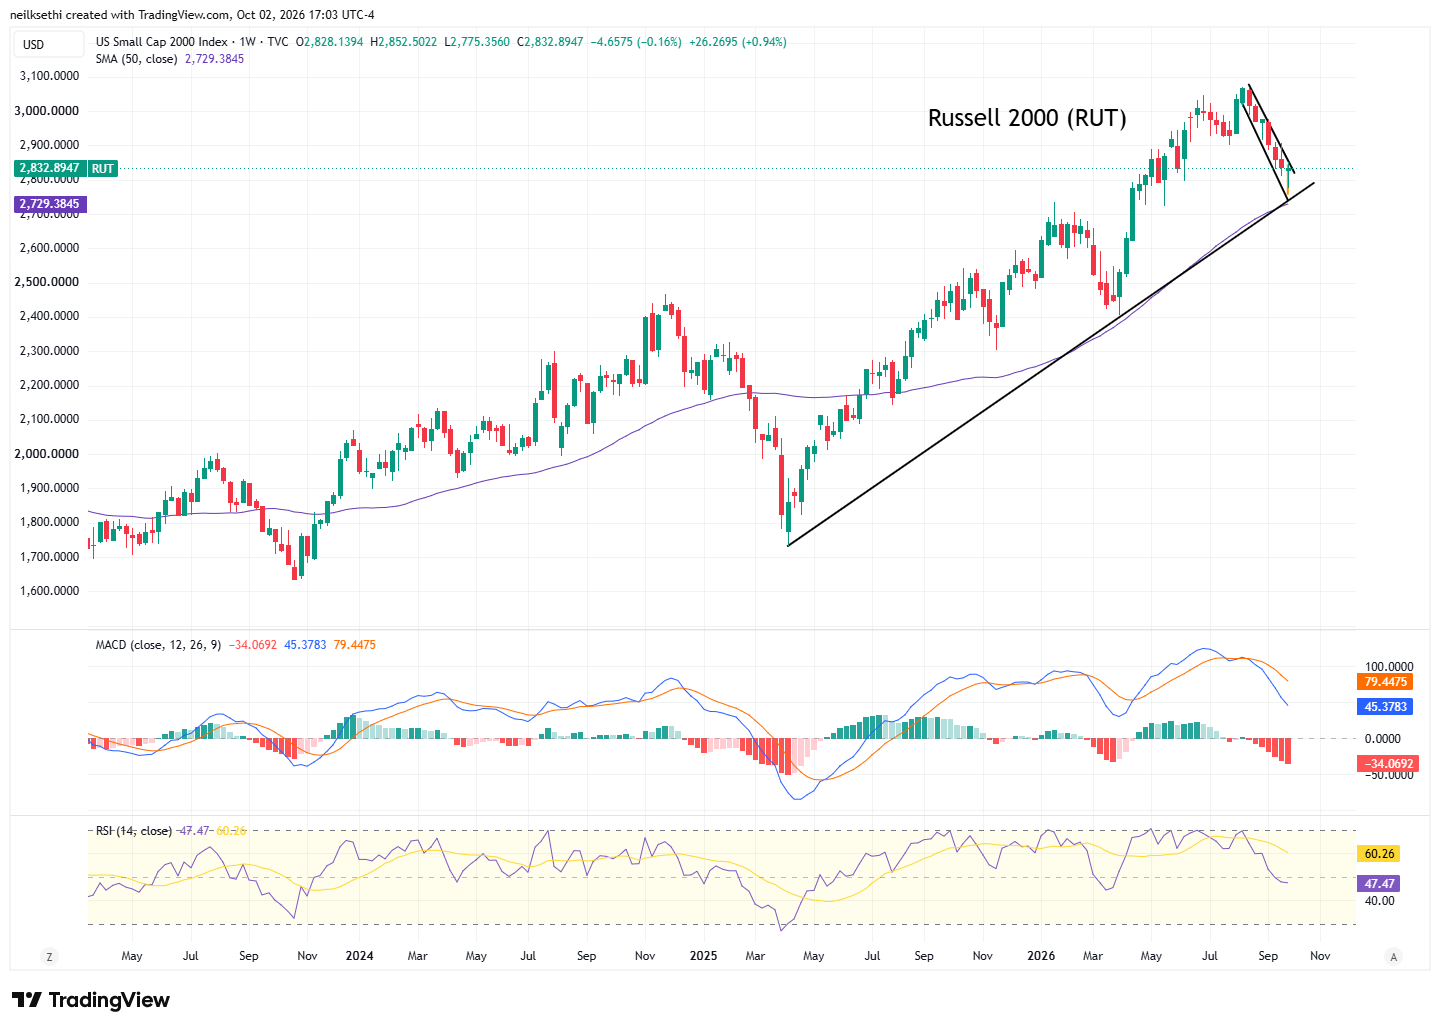
Weekly technicals much further from being supportive but remains above rising 50-WMA.
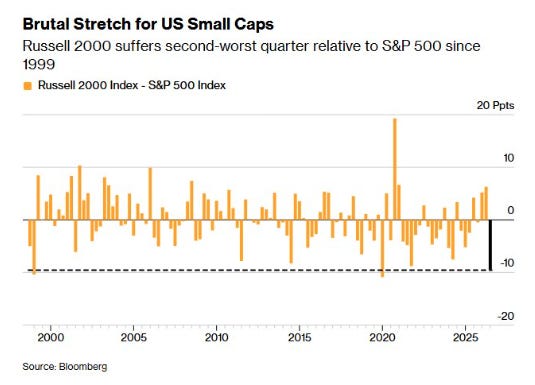
The third quarter for the RUT was the second-worst quarter relative to the S&P 500 since 1999, bested only by the first quarter of 2020, under-performing its larger counterpart by nearly 10 percentage points, Bloomberg data show.
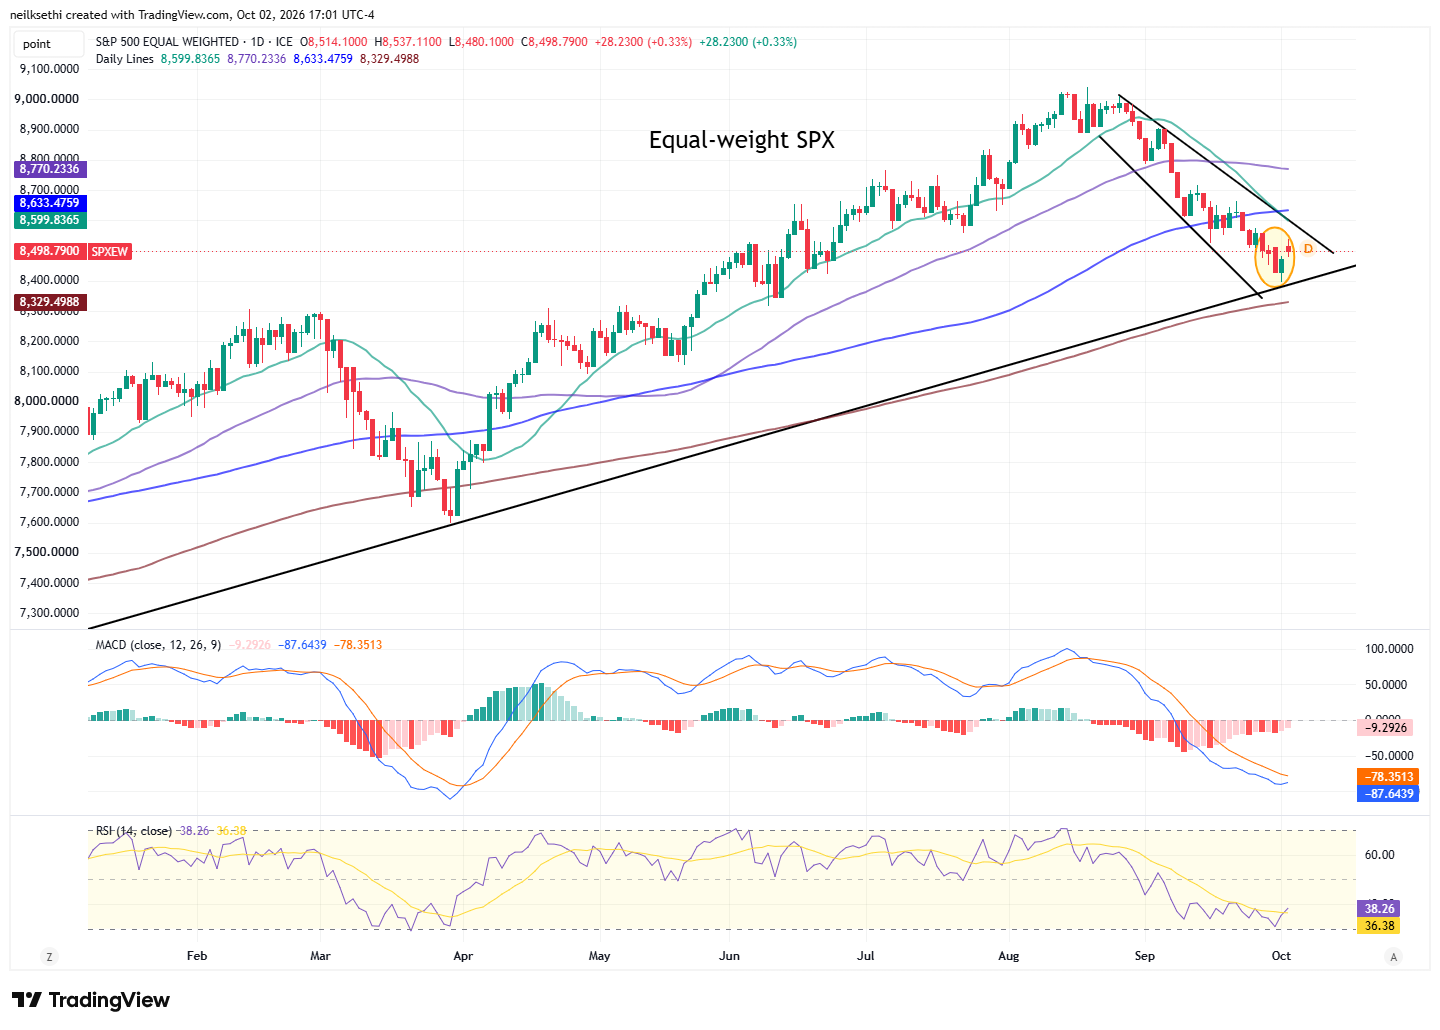
The equal-weighted SPX had the weakest gain of the bunch.Like the RUT daily MACD and RSI are weak but as mentioned Thursday the RSI has inflected higher from around the 30 area. Has more room to get to the top of its downtrend channel.
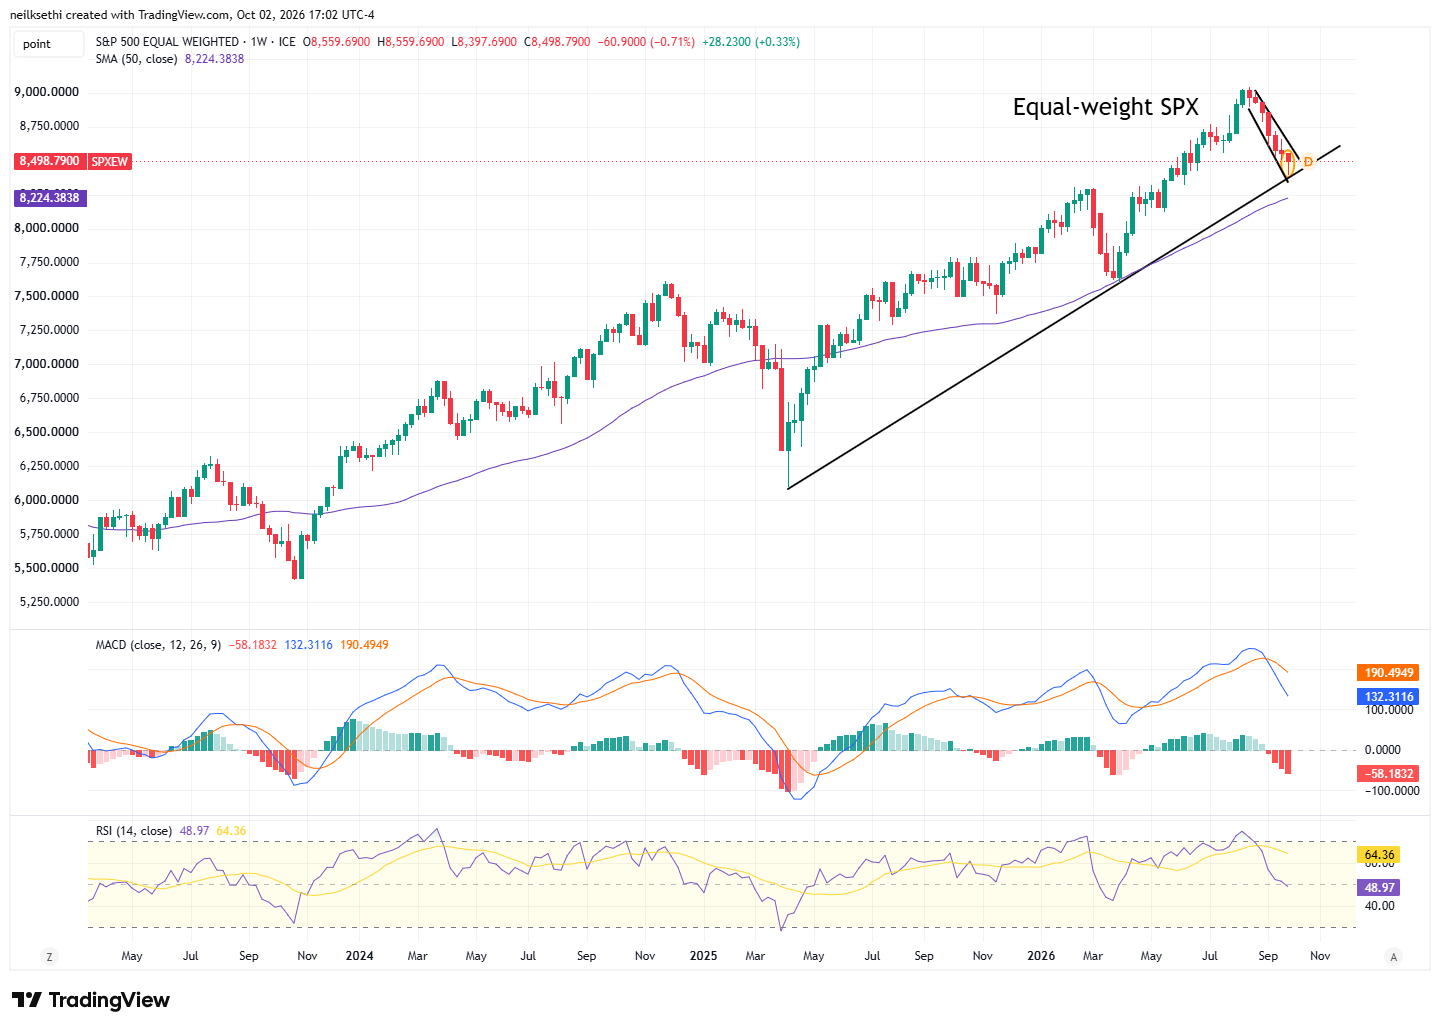
Like the RUT, weekly technicals even weaker. Is above rising 50-WMA though.
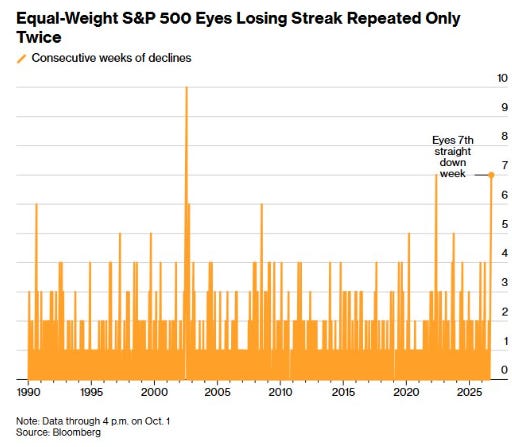
It was also the 7th straight weekly decline for the SPXE, something that’s happened only twice before — in the bear markets of 2002 and 2022.
Treasury yields rose across the curve in a very surprising bear flattening (shorter yields rising more) despite near term rate hike bets being reduced (as 2027 rate hike bets were oddly raised):
The 2-year Treasury initially fell 8 basis points following the weak NFP print, but would recover that and more to end up 4 basis points (including the after-hours). They ended down 3 basis points on the week.
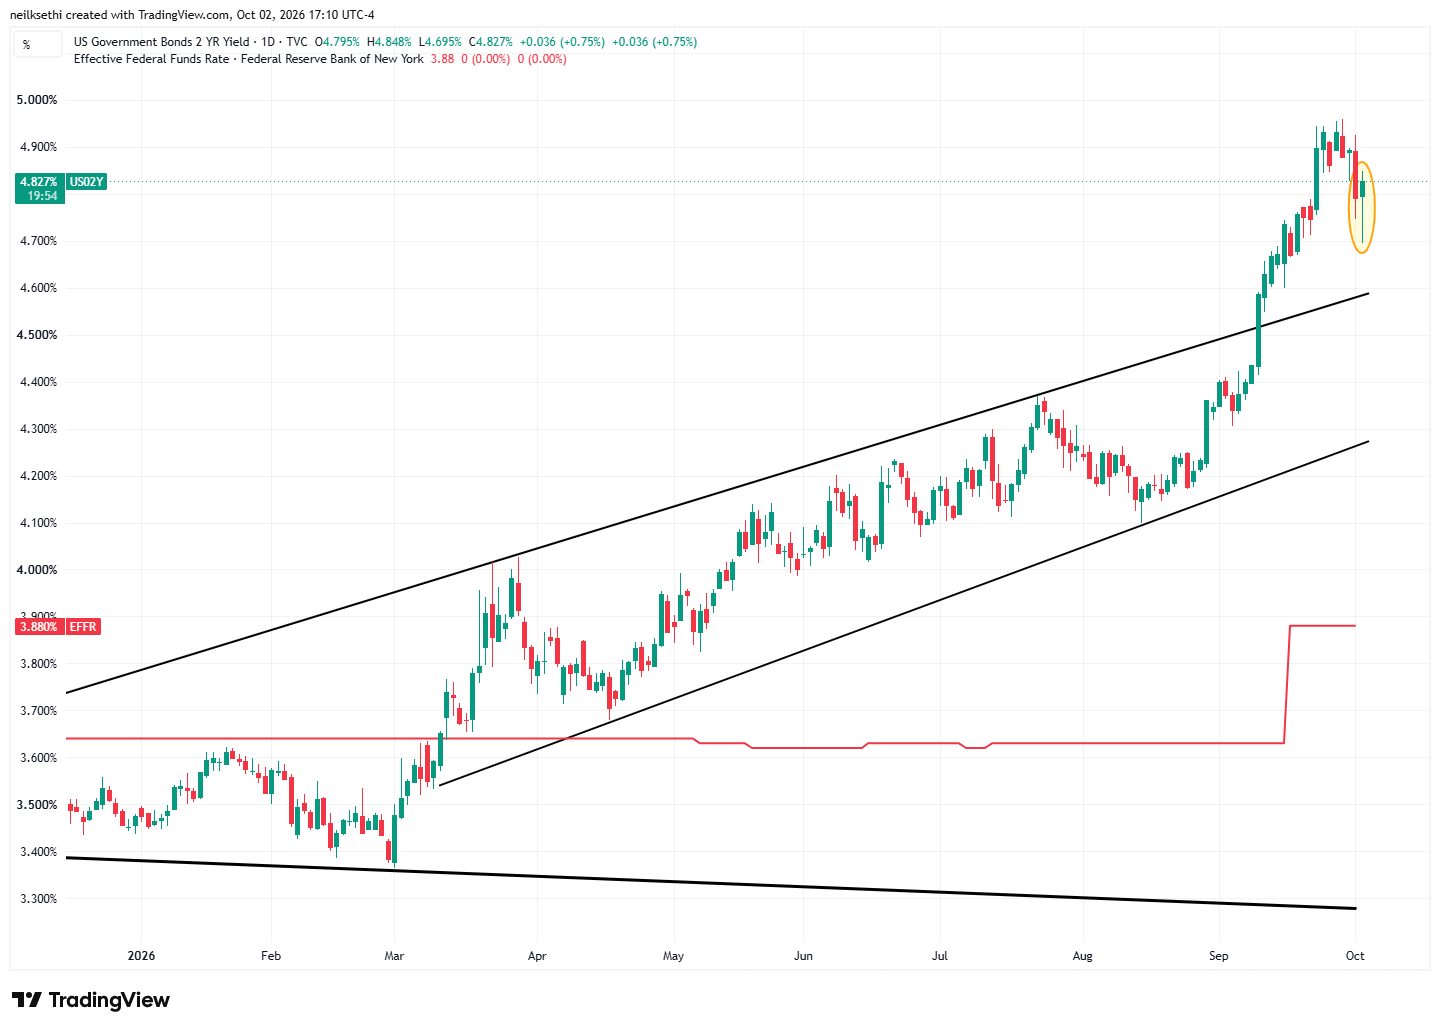
It is ~106 basis points above the Effective Fed Funds rate, so still screaming for (at least a couple) more rate hikes.
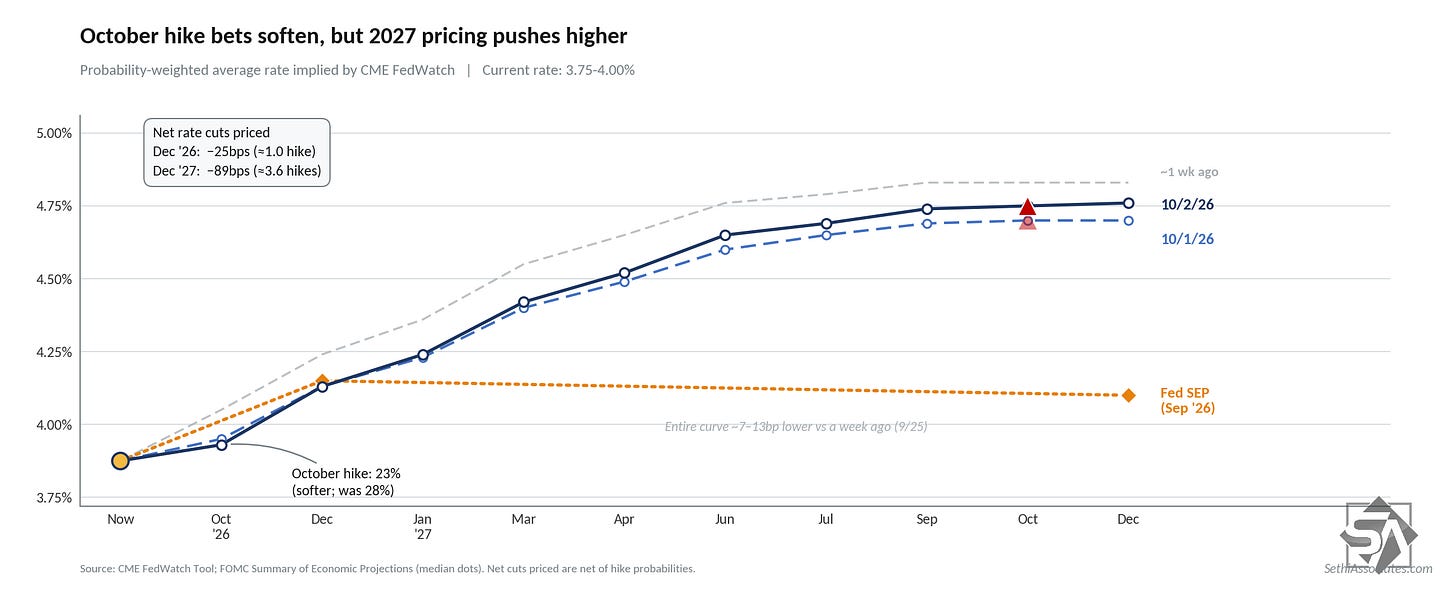
In that regard, we saw October rate hike bets soften to just a 16% chance of a hike immediately after the NFP print before edging back to 23% (still down from ~70% last week), with now just an 18% chance of two hikes this year. But while 2027 pricing initially softened to ~74 basis points of hikes through December, by the end of the day that was back up to 89 basis points. While down from nearly 100 a week ago (faint line on chart), that is still a surprise to me.
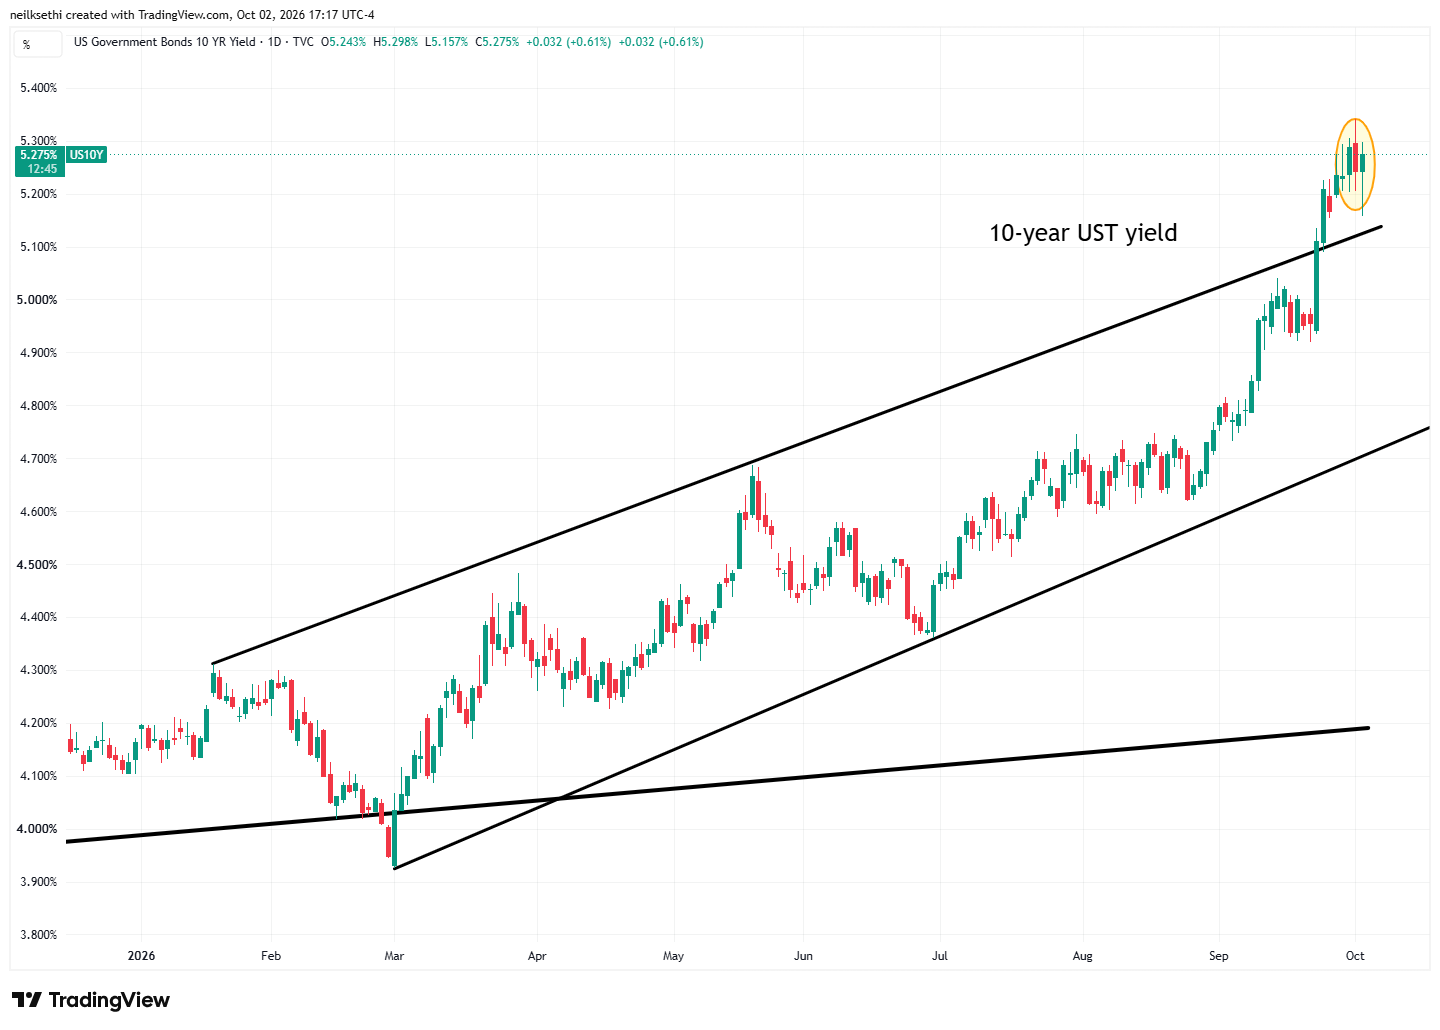
10-year yields were also down 8 basis points after NFP before rebounding to finish up three at 5.27% (including after-hours). They are just two basis points from the highest close since 2002. They were up 11 basis points on the week.
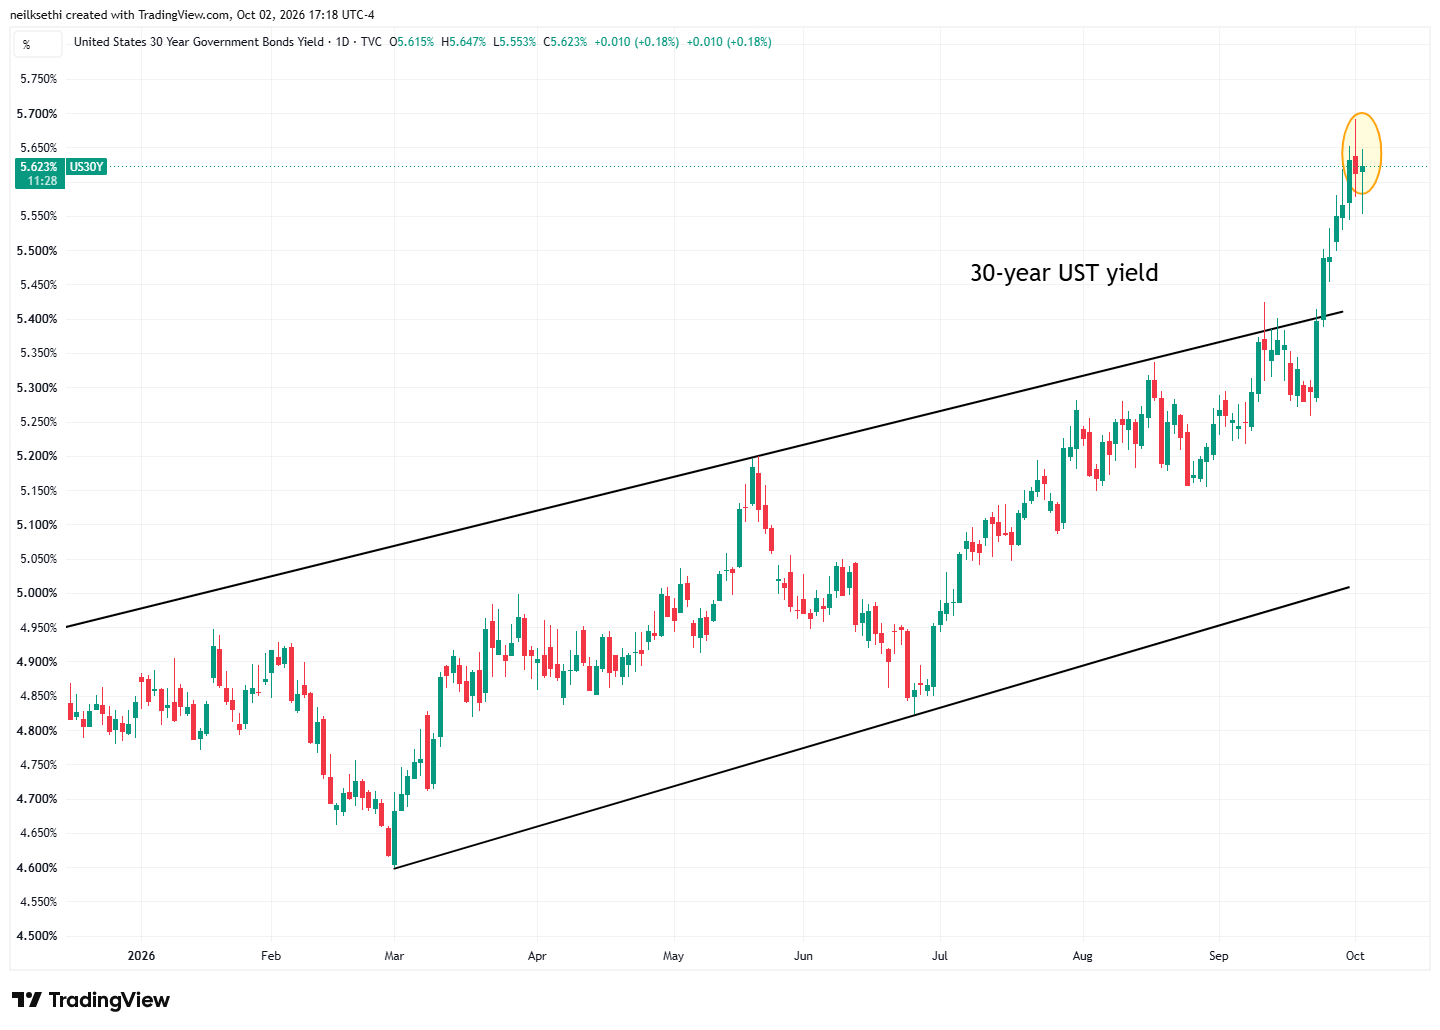
30-year yields were not down as much during the session and didn’t end up as much as well adding one basis point to 5.62%. Also just below the highest close since May 2002, up 13 basis points on the week.
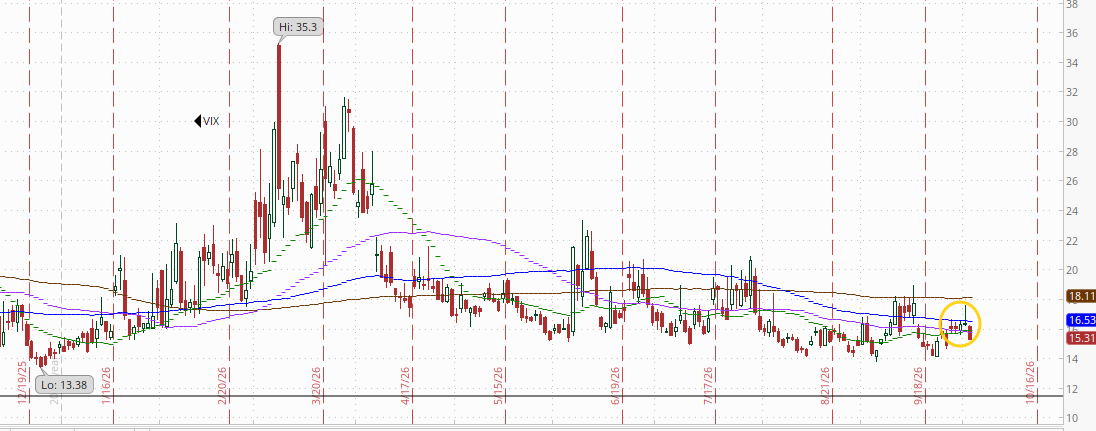
VIX fell back to 15.3. That’s consistent with ~0.96% average daily moves in the SPX over the next 30 days.
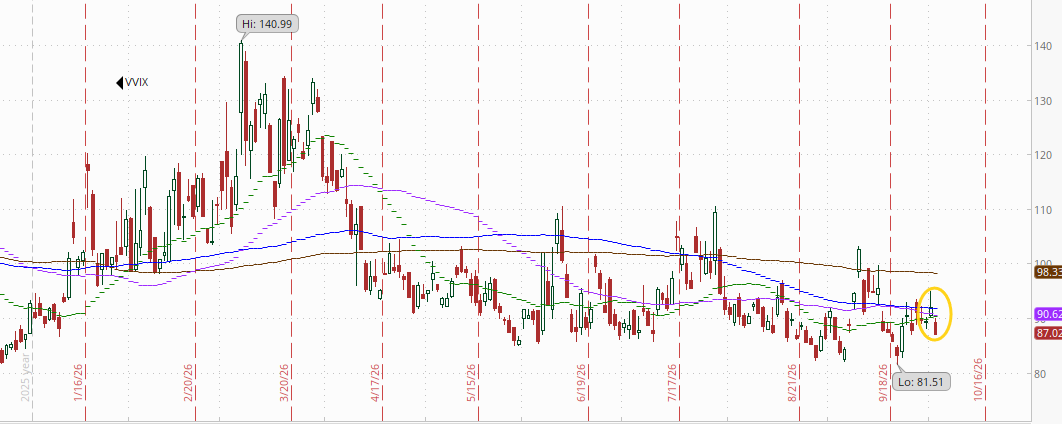
The VVIX (VIX of the VIX) fell to 87.0, also remaining very subdued.
The current level is consistent with “moderate” daily moves in the VIX over the next 30 days (historically, normal is 80-100). Above 100 is the level flagged by Charlie McElligott as indicating higher stress.
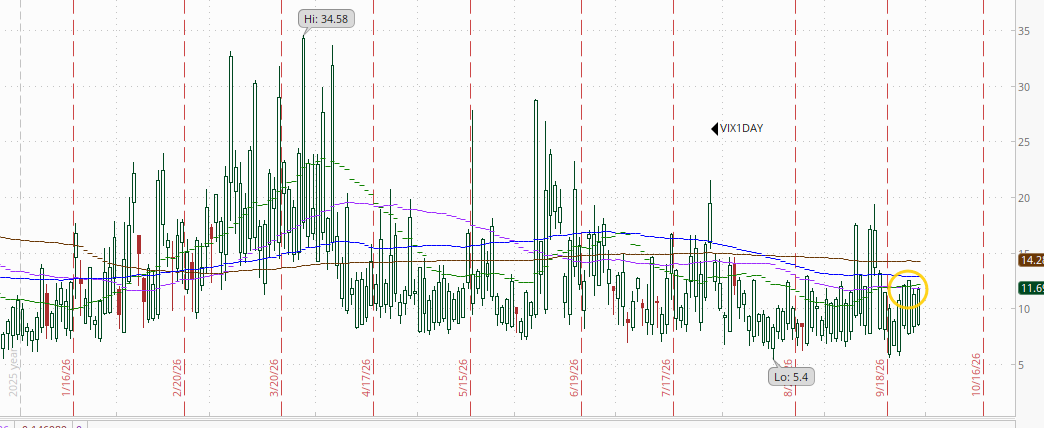
1-day VIX little changed for a fourth session at 11.7 so not getting really any “weekend premium”. Coming after no rise for NFP it seems traders have become very comfortable (complacent?) with event risk. The current reading isconsistent with a move of 0.73% in the SPX next session.
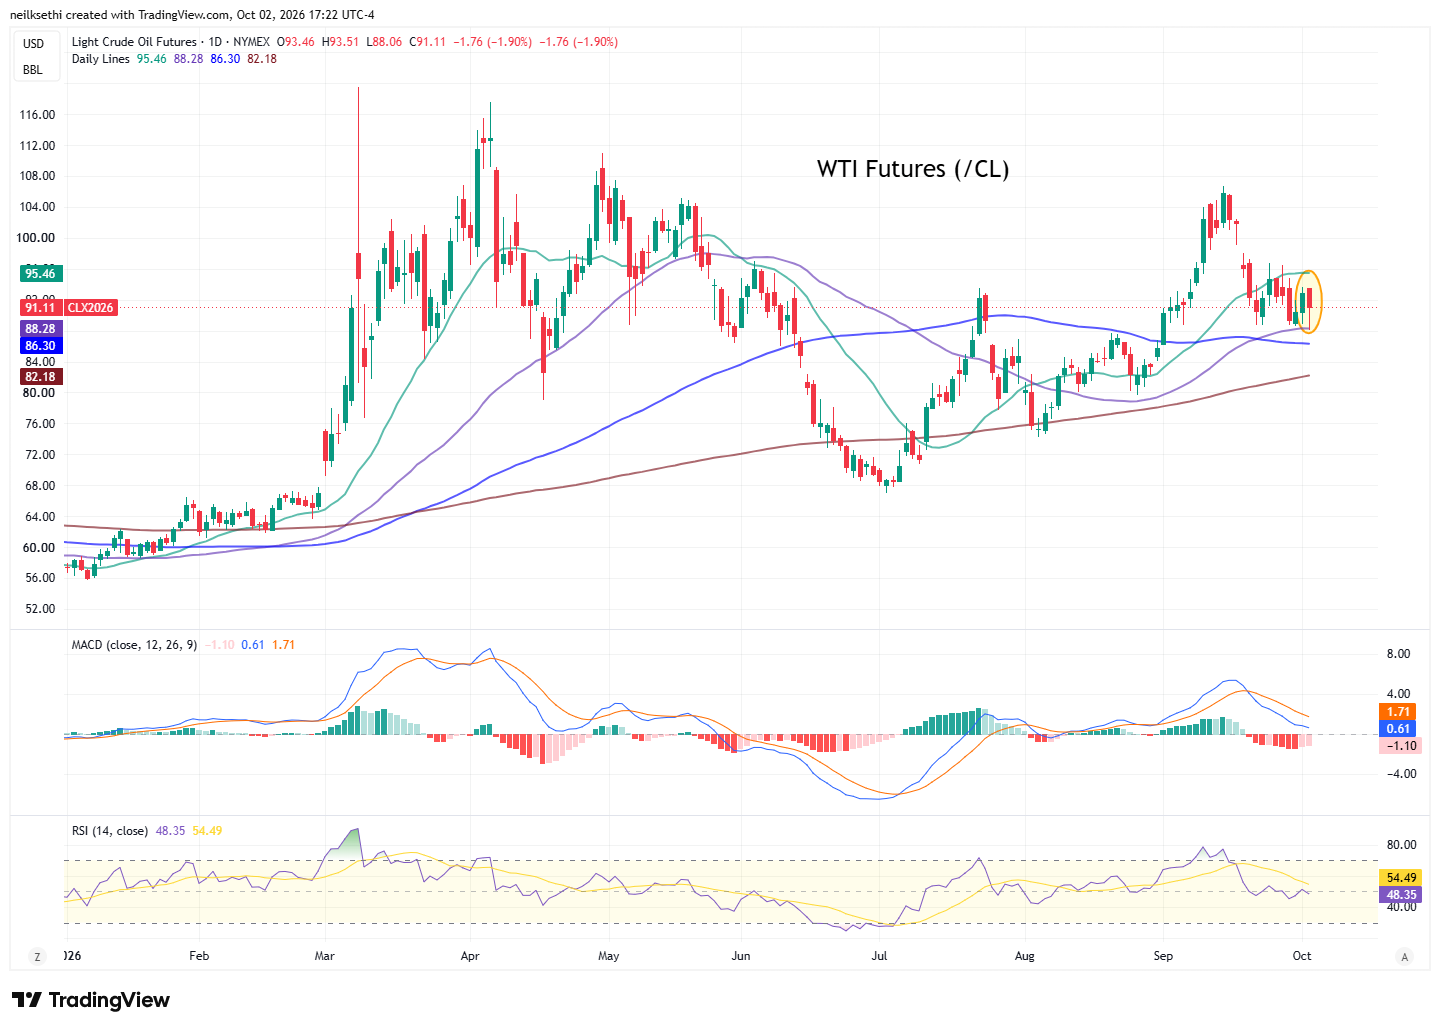
WTI futures (/CL) fell back around 2% (including after-hours) after the news of the G7 petroleum and products release, but did find support at the 50-DMA.
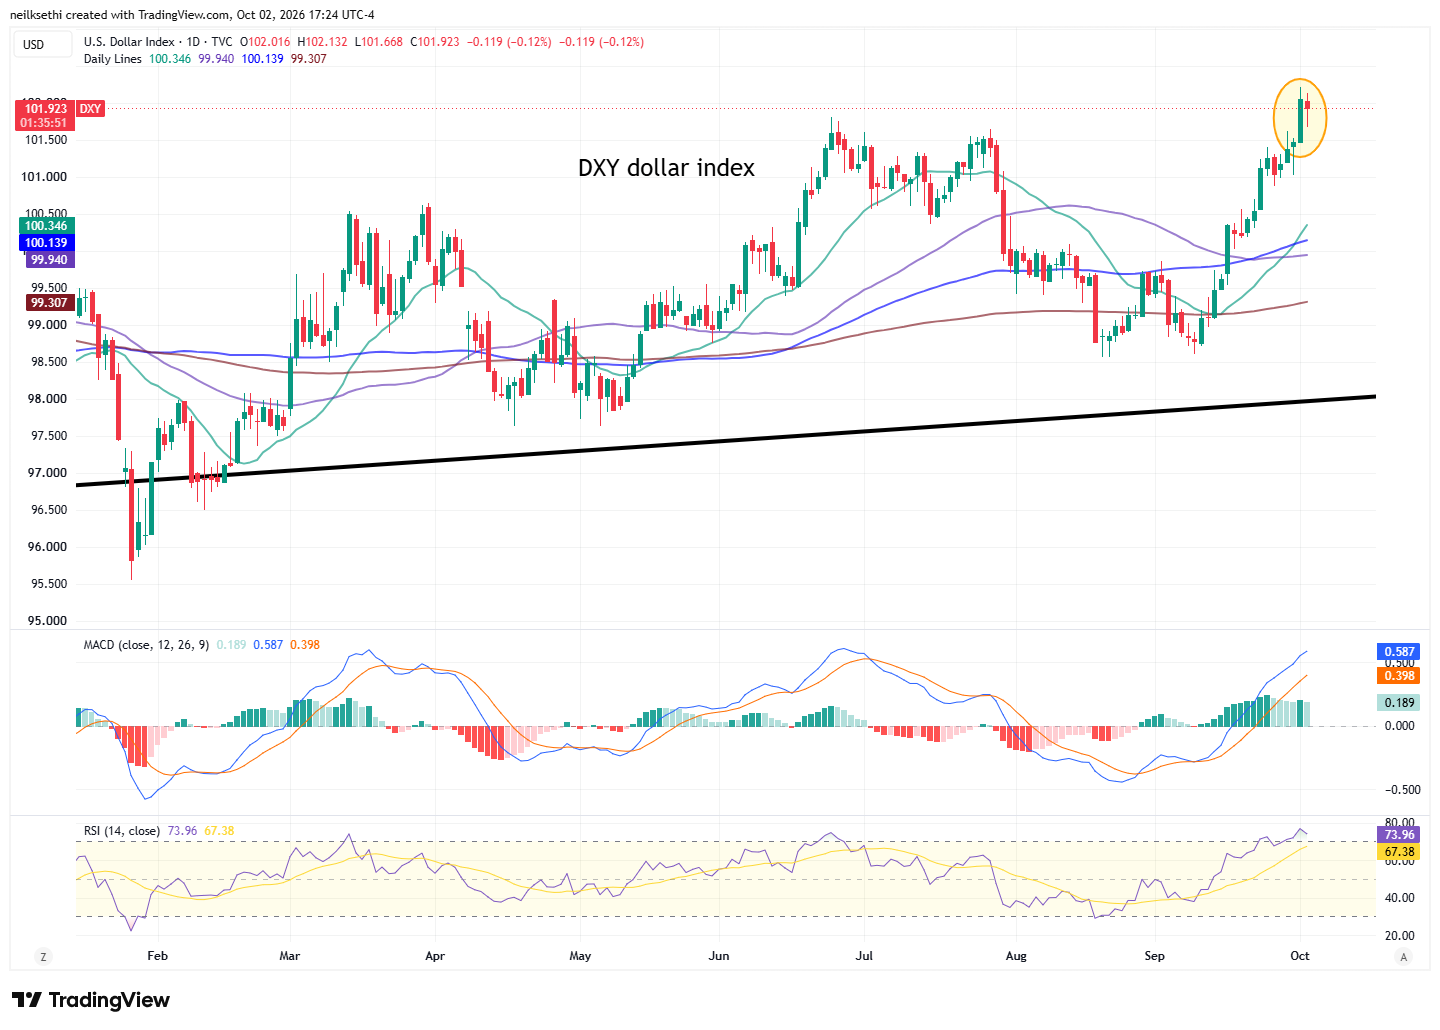
The DXY dollar index (which is fixed weighted with a heavy (57%) weighting vs the euro), eased back despite the rise in yields after shooting to the highest close since April 2025 on Thursday (which came after its best month since June).
As I mentioned two weeks ago “The daily MACD remains positive and the RSI is above 60 so it continues to have strong technical support.” I mentioned Thursday “This opens up a run higher, although it’s the most overbought since September 2023.” Perhaps it is needing to work off that overbought reading.
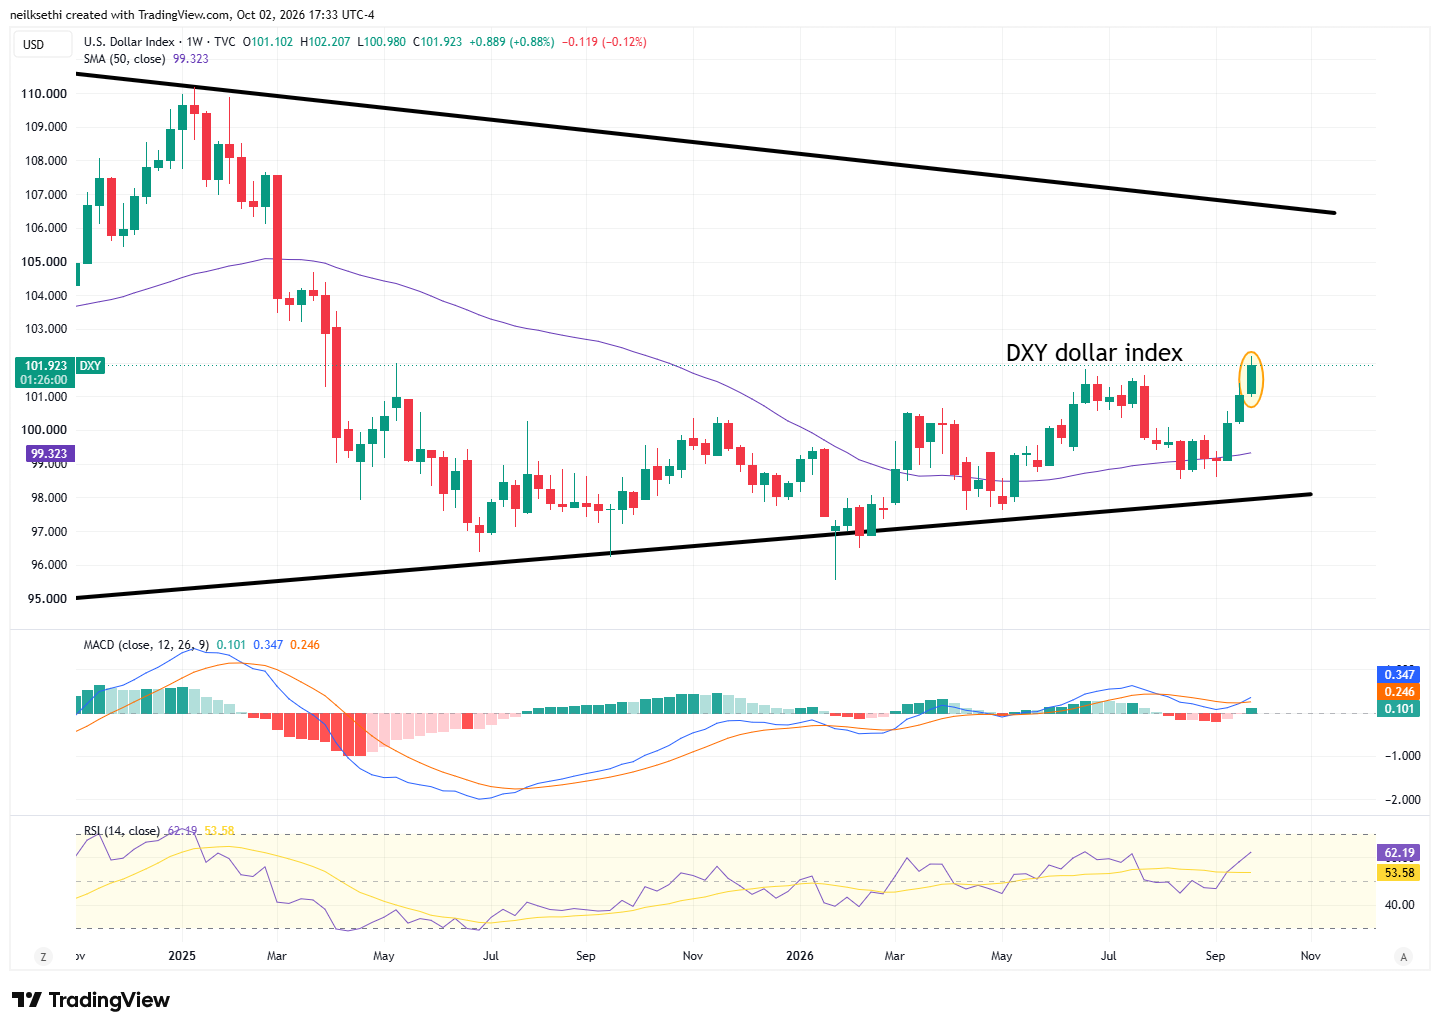
I had mentioned the weekly chart last week as turning more bullish, and that has just extended. It remains above a now upward sloping 50-WMA, weekly MACD is more positive, and RSI is over 60.
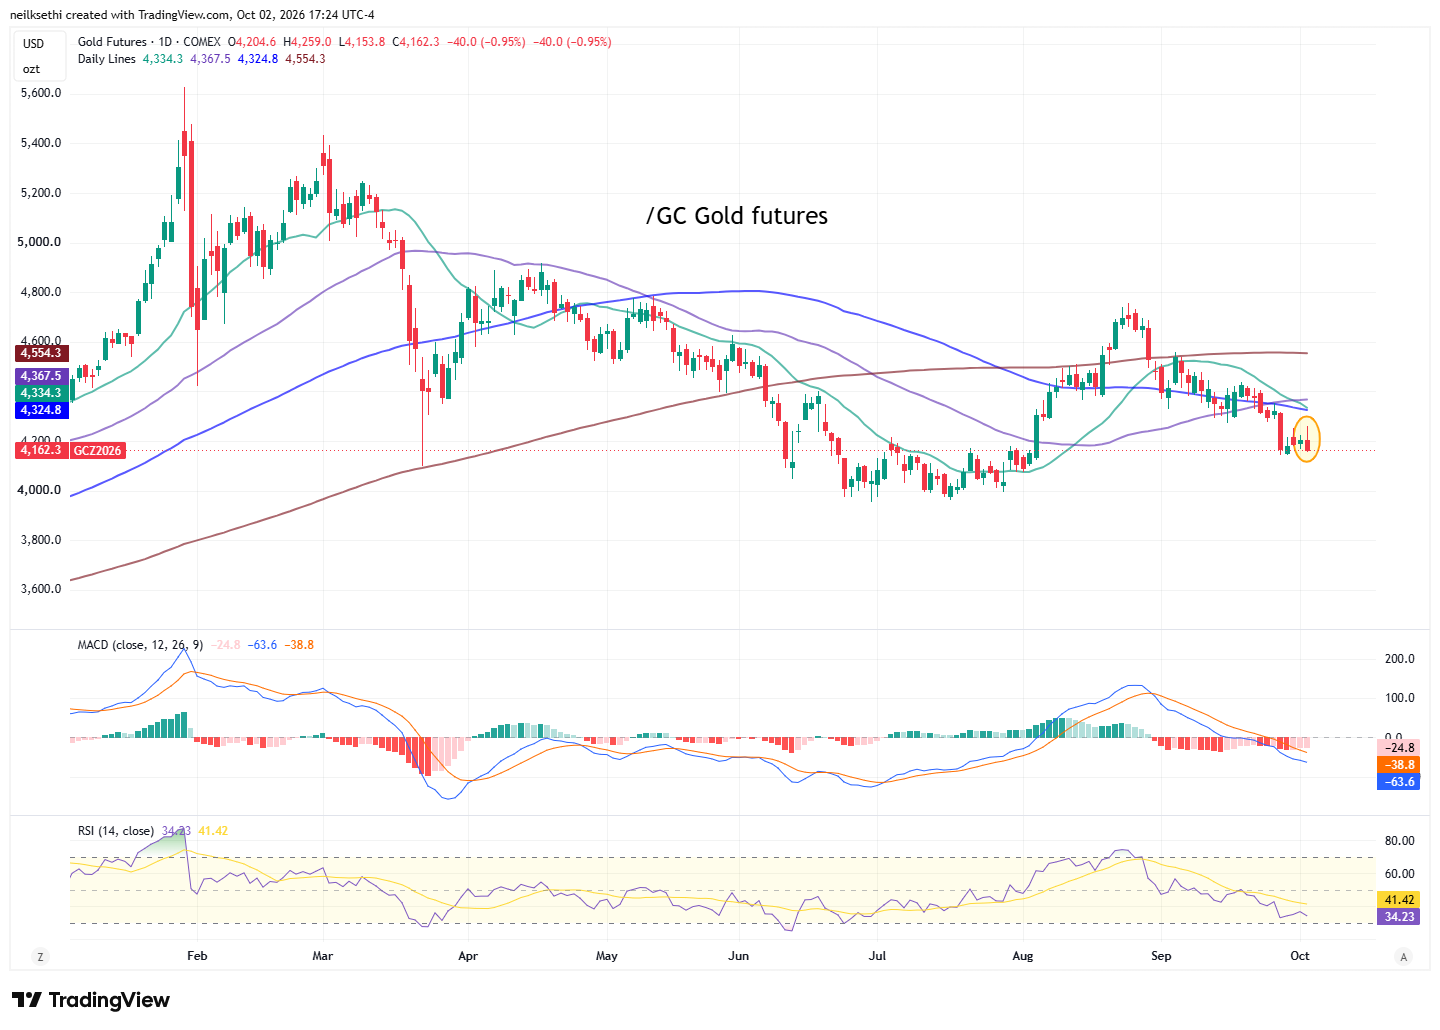
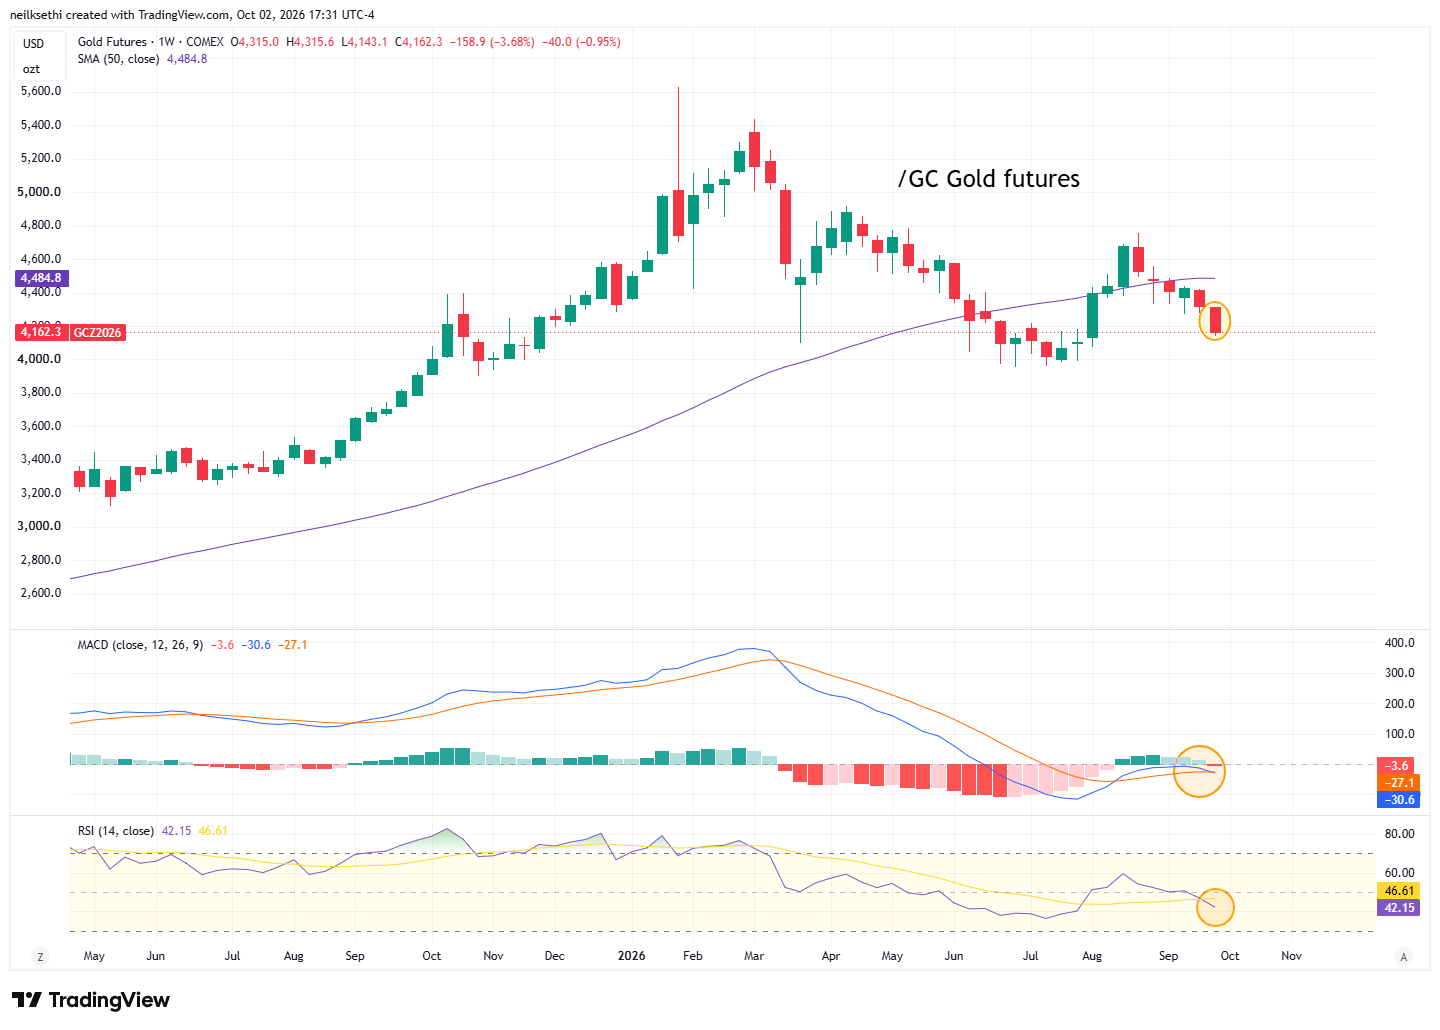
Gold futures (/GC) continue to stabilize although closed right at the bottom of this week’s range. As I said earlier this week, “the daily MACD remains negative and the RSI is under 40 so it’s going to take some time.” Needs to hold that low.
Weekly chart remains weak. Lowest close since July, below 50-WMA (although that is not yet falling), weekly MACD has slipped negative, and RSI is near 40.
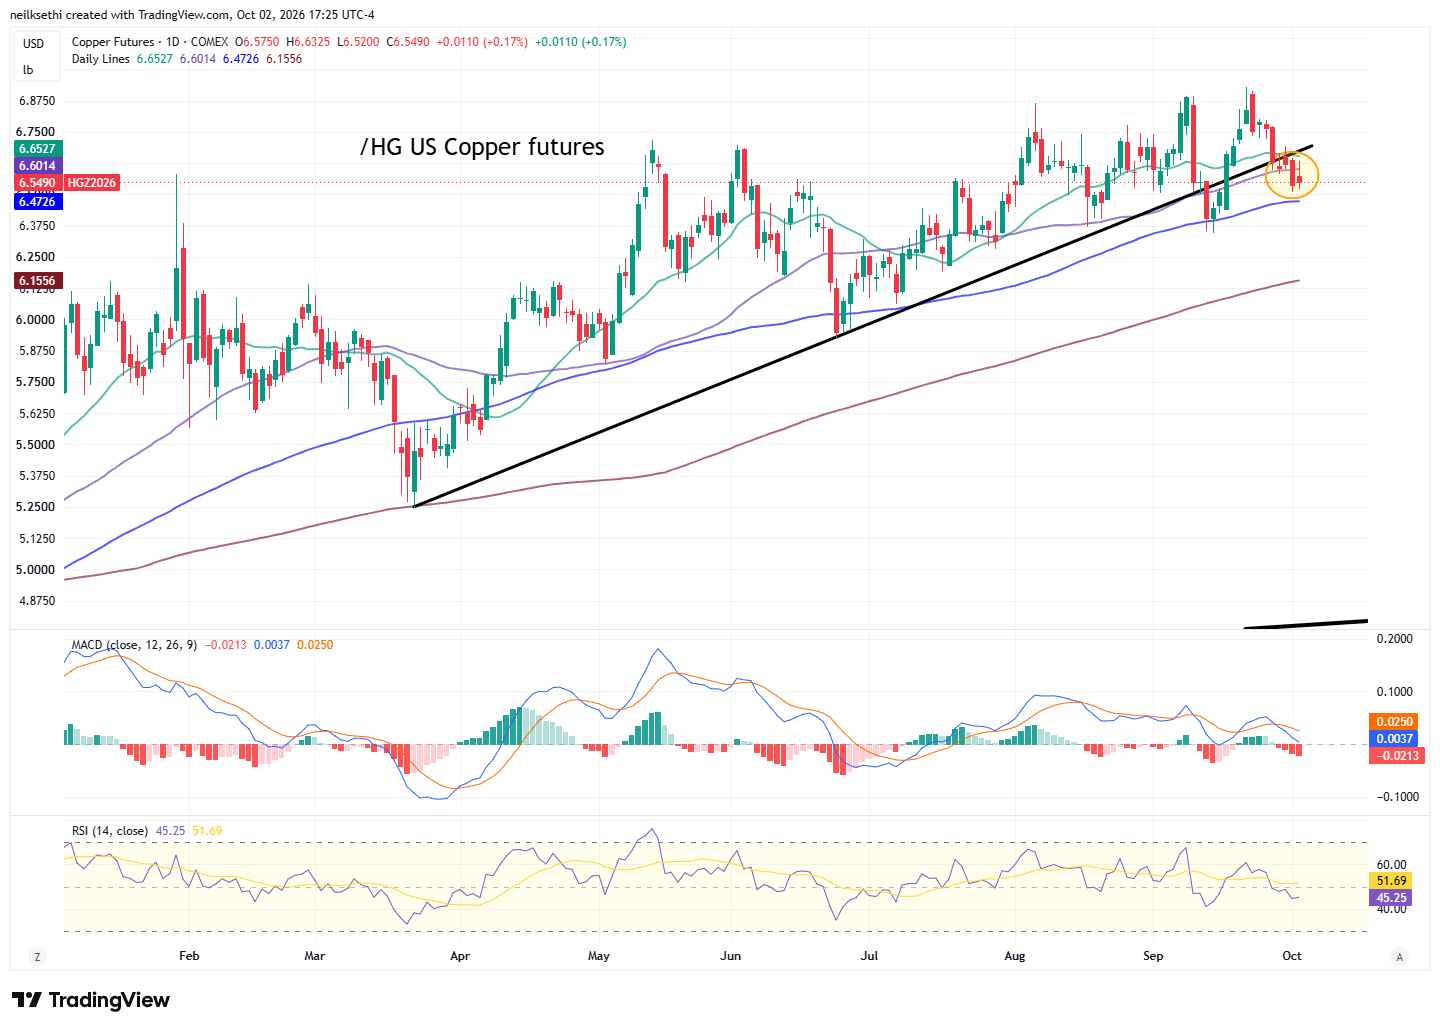
Again despite the strength in the AI-trade today, US copper futures (/HG) not able to make any progress holding above the 100-DMA. As noted Tuesday the daily technicals have now softened to negative. As I said then “Given it made its stand at the start of the month at the 100-DMA, I’m going to give it that room again this time.”
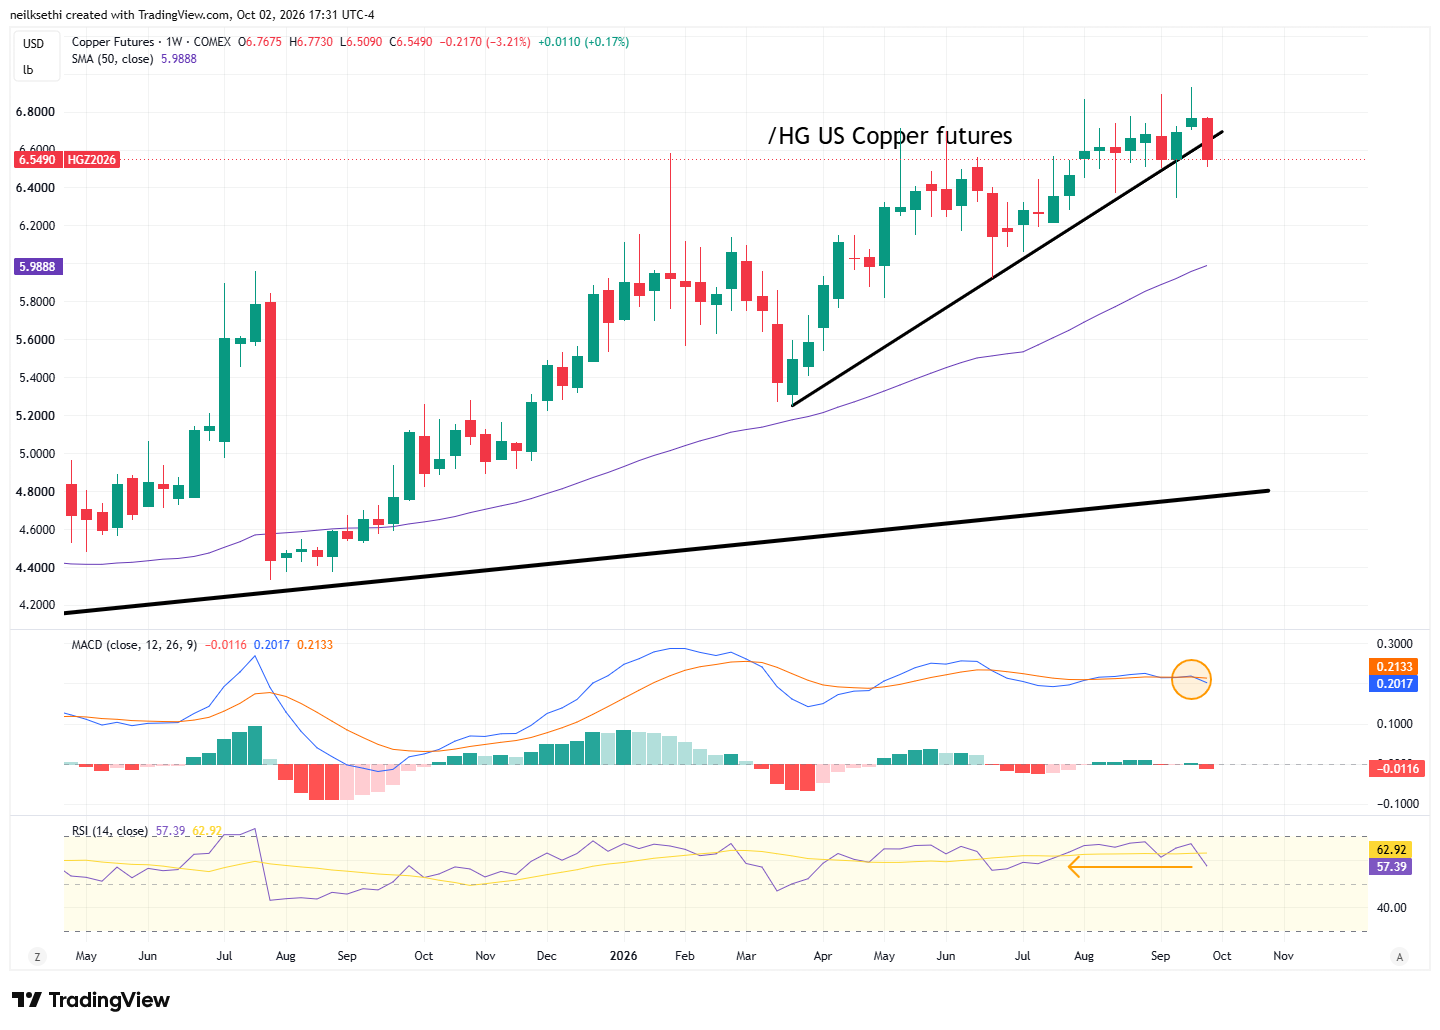
Weekly chart also starting to slip. It remains above its rising 50-WMA but a lot of room to fall to it. Weekly MACD has slipped negative while the RSI is above 50 but the weakest since July.
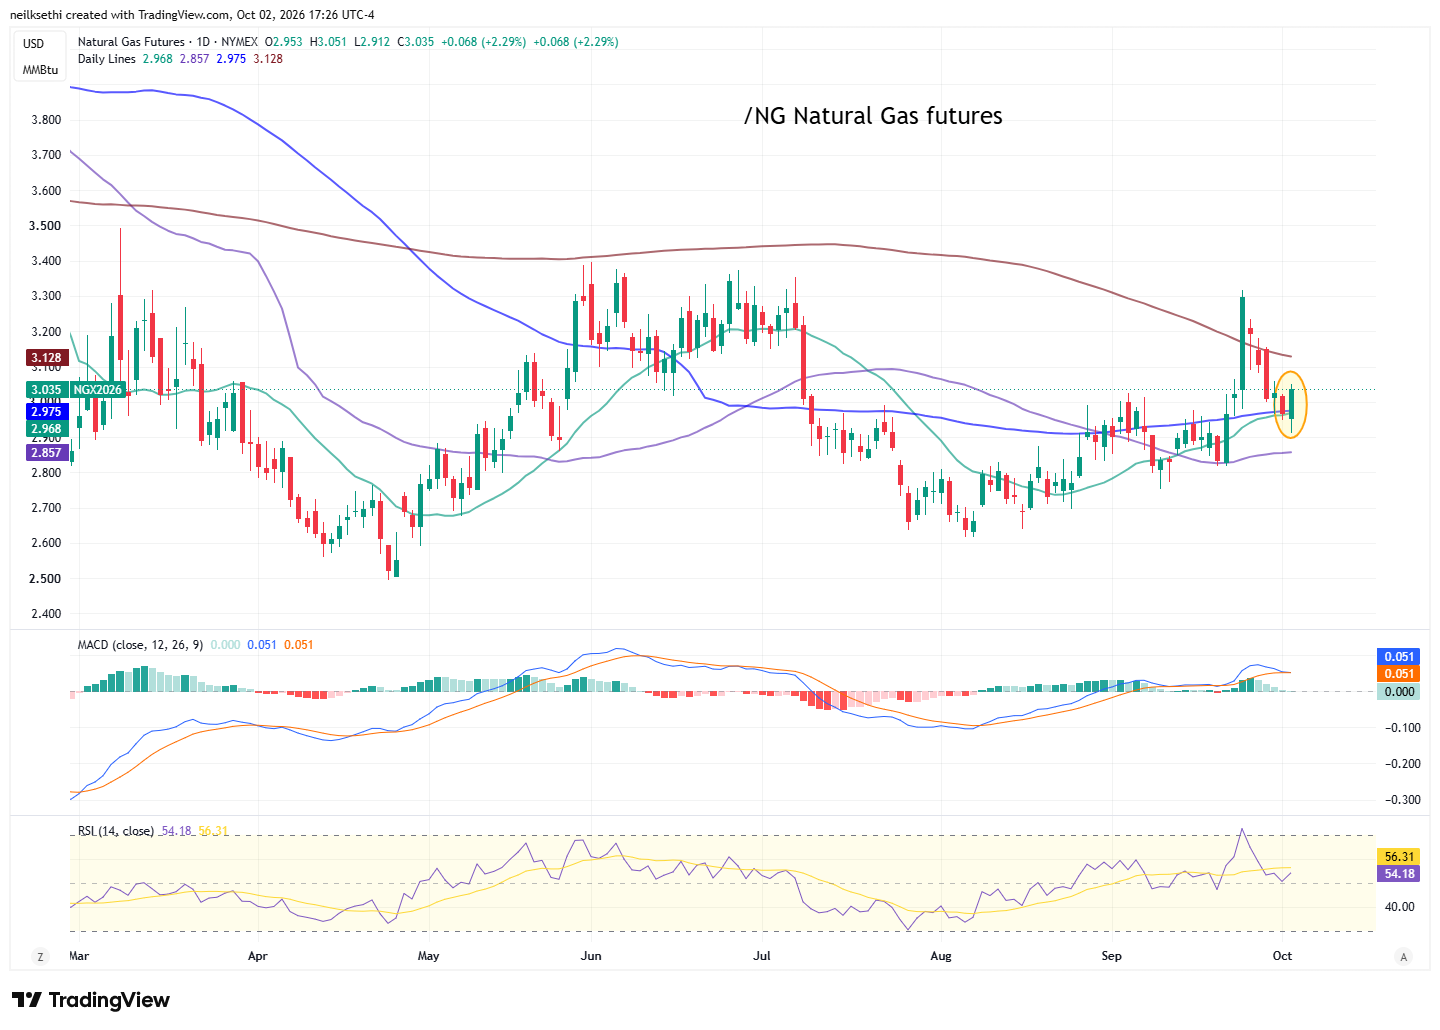
US natural gas futures (/NG) got a rare green day this week but overall in the middle of what is now a larger trading range stretching back to March.
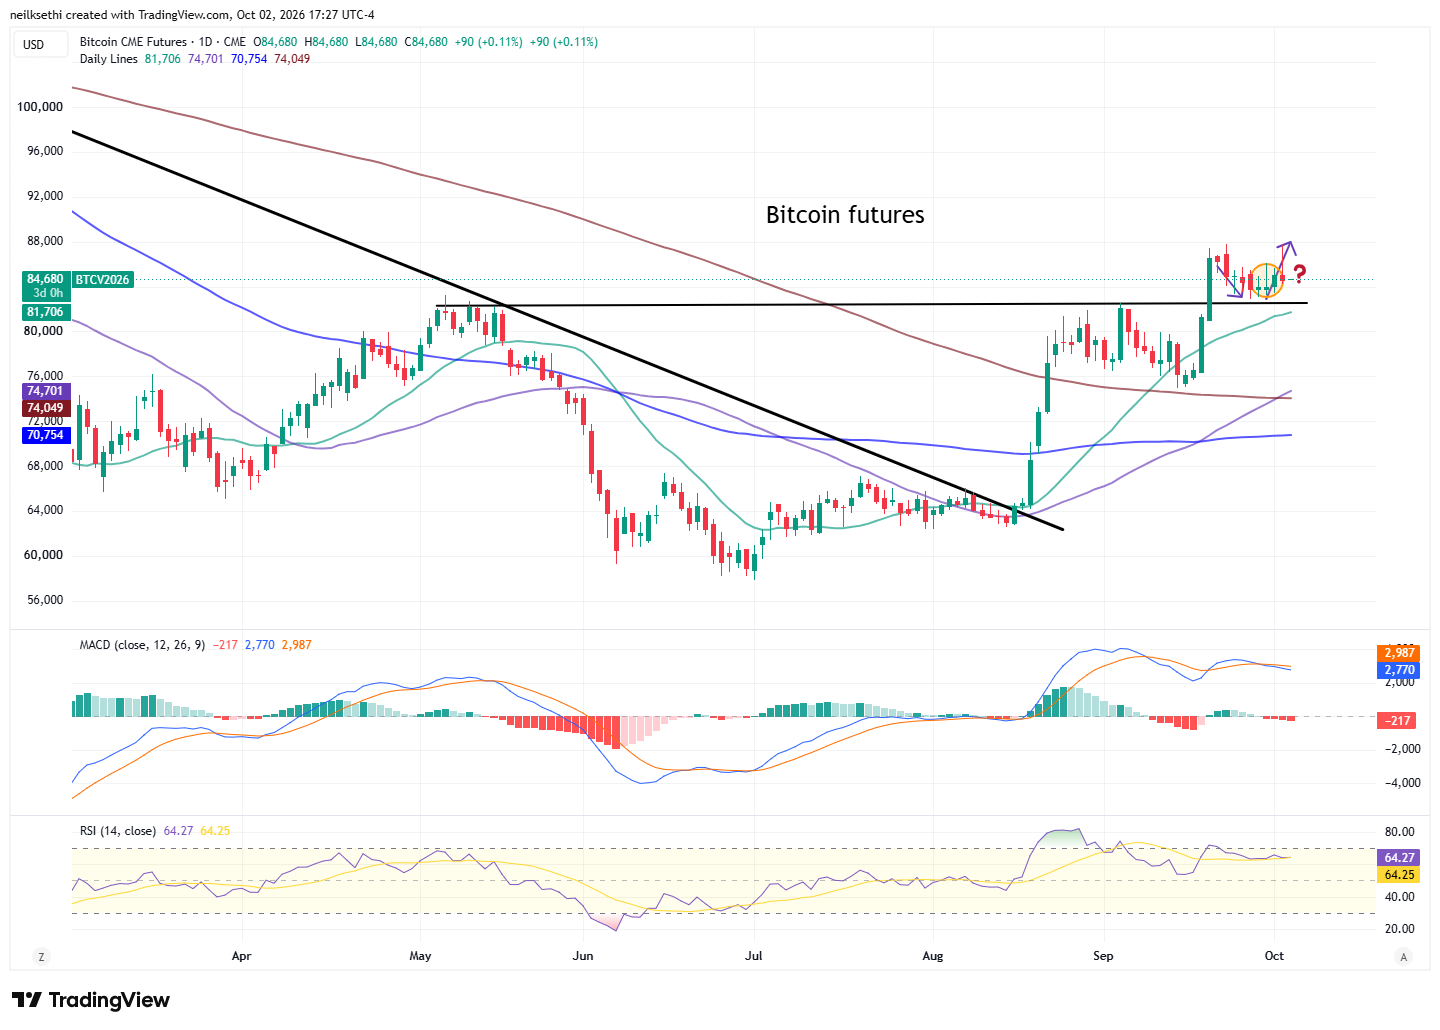
Bitcoin futures were again up over 1% before falling back to end little changed, but for now keeping alive the “potential path” (for bulls) I laid out last Wednesday (in purple). Daily MACD has slipped negative while the RSI remains solidly positive for now.
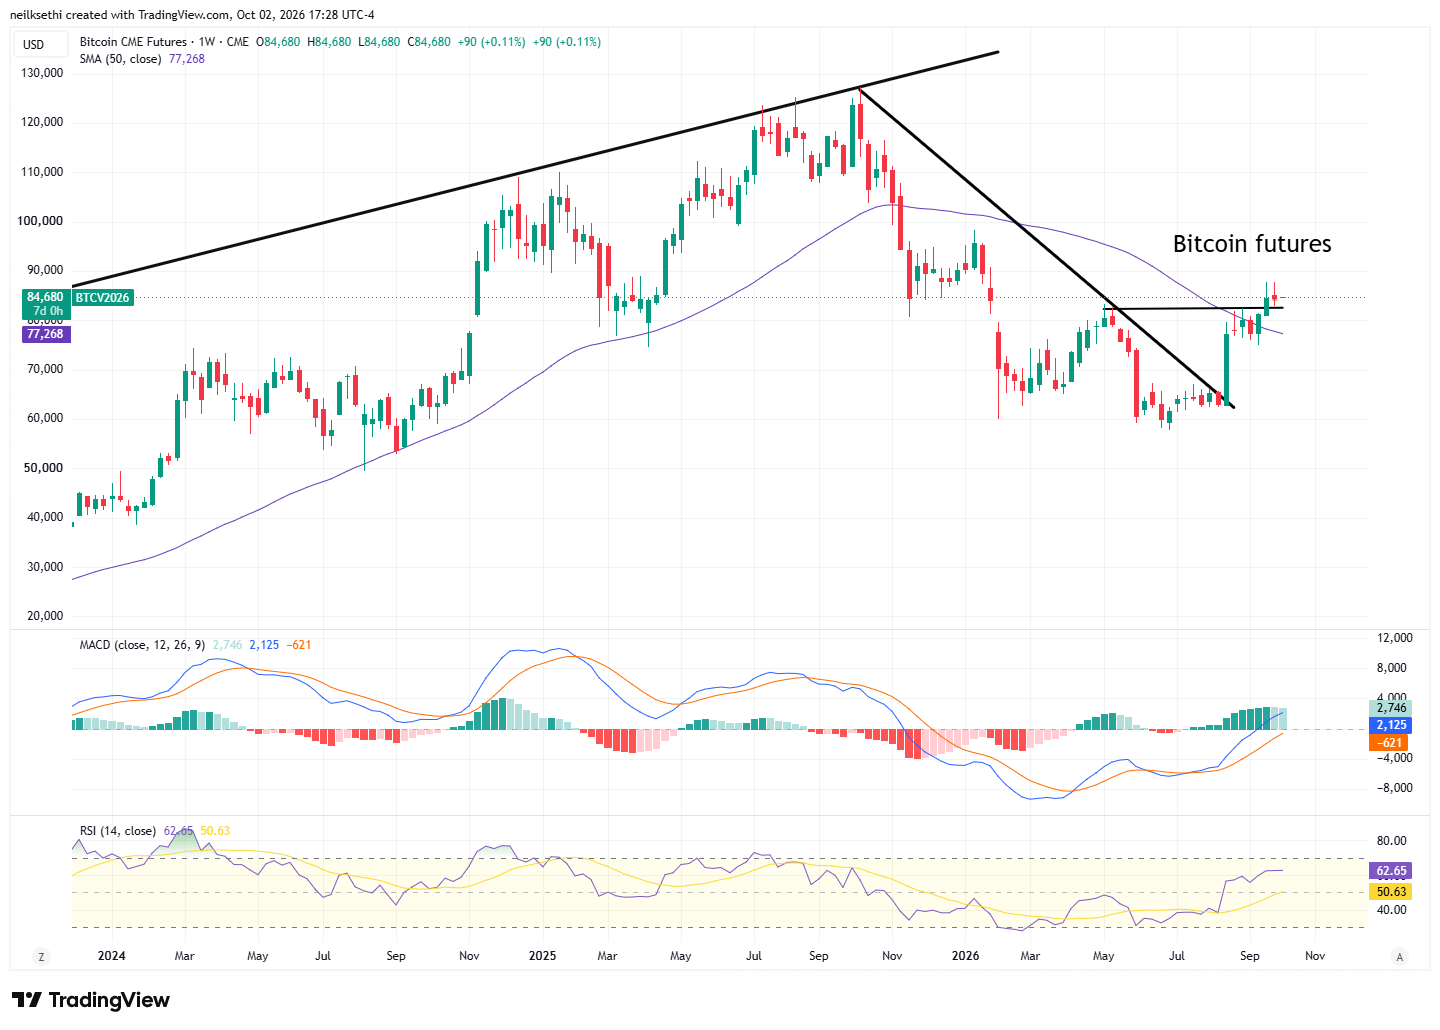
Weekly chart with really just the falling 50-WMA the issue. It’s above it though with solidly positive weekly MACD and RSI.
More From TheStreet Pro:
- Stephen Guilfoyle – Diesel Dilemma, Betting on Banks, Storm Clouds Over Iran?
- Chris Versace – Oil Falls, Jobs Miss and Yields Slip: 8 Key Items Shaping the Stock Market Friday
- James “Rev Shark” DePorre –
- Peter Tchir – Those Jobs Numbers? Looks Like the Joke’s on Us.
- Bob Byrne – Why Fast AI Chips Still Have to Wait
Miscellaneous:
Wrap-Up – A Reason For Hope (Maybe I Should Just Change That to the Name of This Section Permanently)?
I said yesterday:
And while it’s early days, we at least broke the streak of higher yields, lower stocks we saw the last three sessions with both bonds and stocks rallying (or at least moving higher) together. And we did also get a second day of bounceback in the Tech/AI trade. Too soon to call these trends, but let’s at least call them a good start.
Big day tomorrow with the employment situation report, although I think a little heat was taken out with the back-to-back comments from Williams and Jefferson implying an October rate hike is unlikely (making this data point less important). However, a big surprise to the downside could catalyze that larger pullback in yields I’ve been insisting is coming. Not exactly sure how equities would react.
And we did in fact get a “big surprise to the downside” with the 29,000 payroll growth below every single Bloomberg estimate and wage growth below all but one. And that did, initially, see yields pull back, but a curious thing happened not long after. They came back up. There was no obvious catalyst, so that leads me to believe the momentum behind the short bonds trade (or perhaps the lack of momentum behind the long bonds trade with Goldman characterizing bonds as “bidless” today) is more powerful than even a notable miss on what has traditionally been the most important economic report we get.
But that doesn’t mean I’ve given up on my “we should be close to a big pullback in yields” theory. Just that it may take longer to play out.
We’ll see what we get next week with very little economic data (the services PMIs Monday have the potential to move markets in a light week I suppose) leaving Fed minutes and Treasury auctions as potential bond market catalysts. But otherwise we’ll get a fairly clean look at whether traders are willing to push the rates trade any further.
But in terms of “how equities would react,” the answer is quite well. We continue to see Tech performing well consistent with my Week Ahead note, which I don’t see any reason to fade at this point, but we also got a second day of broader gains as well.
I said Thursday “Too soon to call these trends, but let’s at least call them a good start,” and that continues today.
More on Sunday.
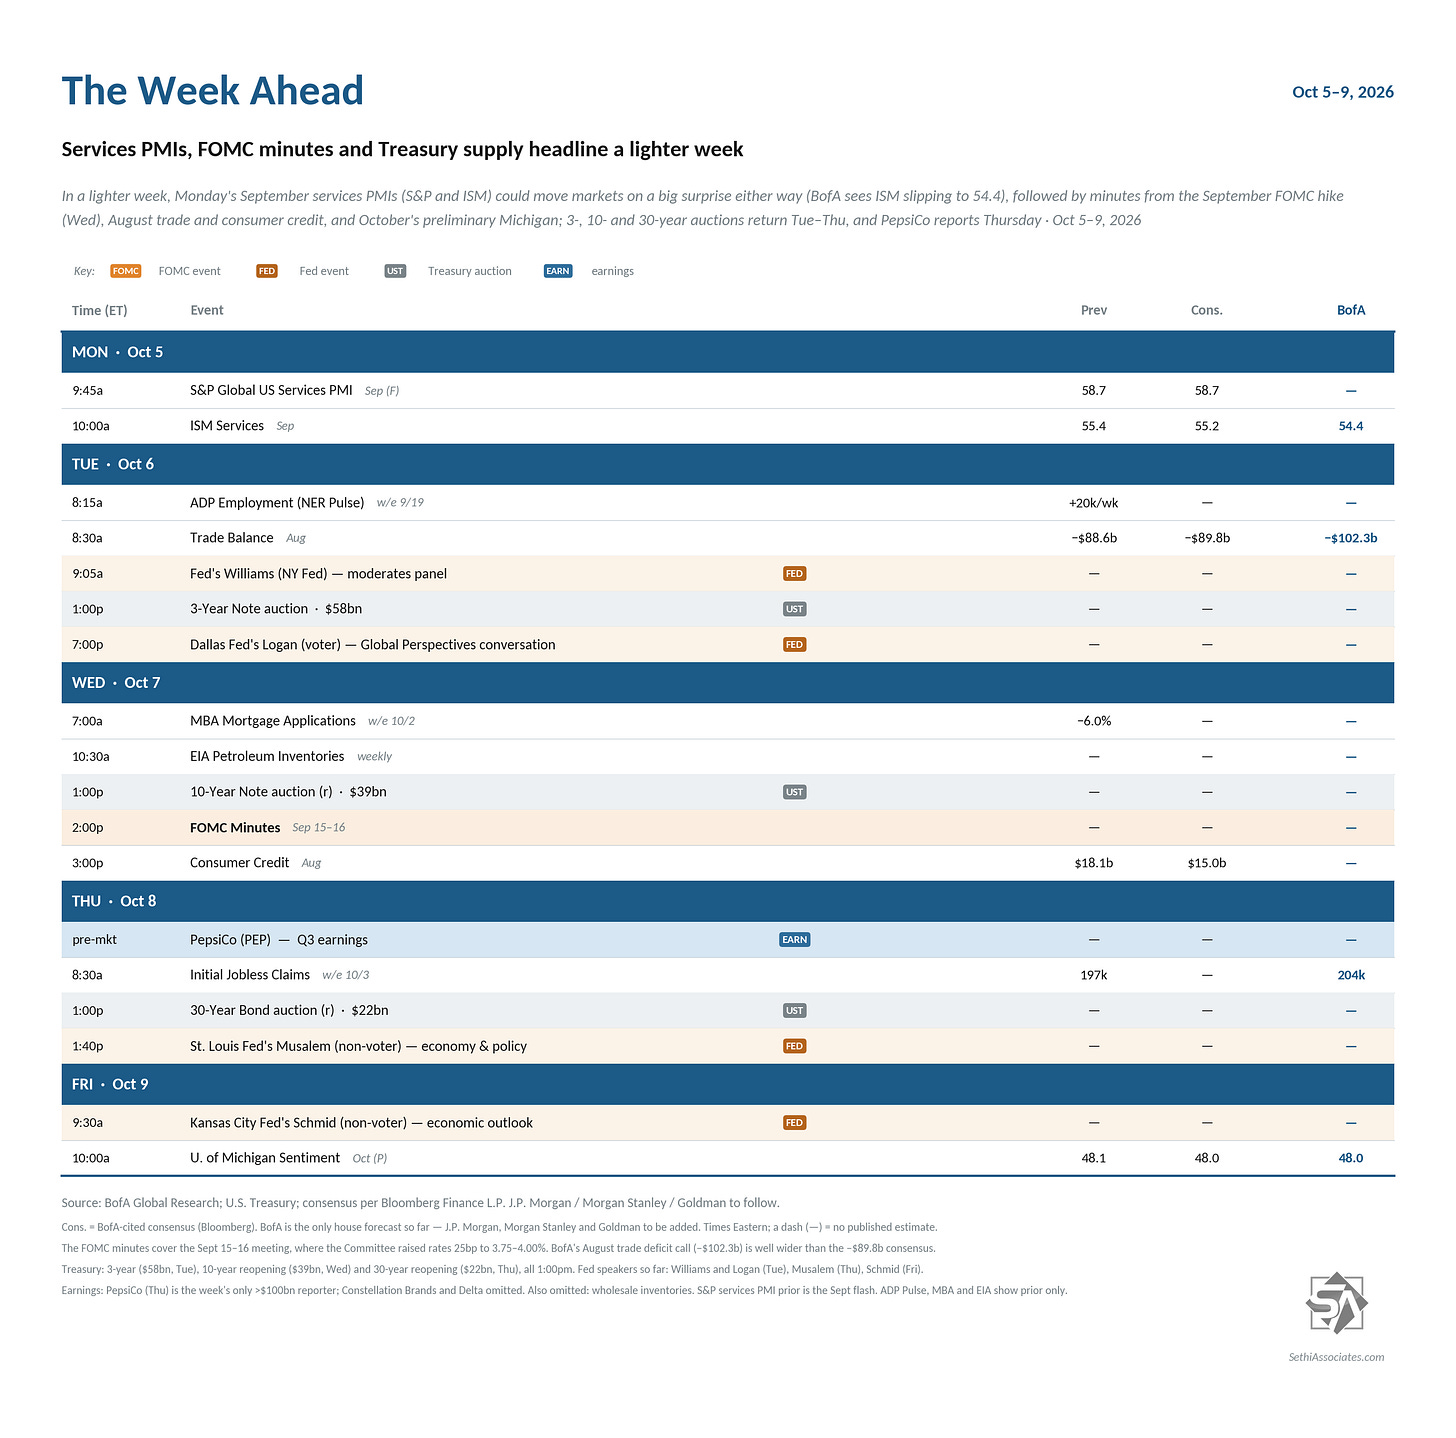
The Week Ahead – A Chance To Catch Our Breath
US economic data next week is light before picking back up the following week. The headline is I guess the final services PMIs Monday. We’ll also get August trade balance, consumer credit, wholesale trade, October preliminary UMich consumer sentiment, and the normal weekly reports (ADP, weekly unemployment claims, etc.).
Fed speakers light with currently just regional Fed presidents Williams, Logan, and Musalem on the calendar, all of whom we heard from last week. More importantly Wednesday we’ll get the minutes from the September meeting. While a bit stale, they always give good color on where the Fed’s collective head was at.
Non-Bill (>1yr in maturity) US Treasury auctions pick back up with 3, 10, and 30-year auctions Tues, Wed, and Thurs respectively.
As we await the unofficial start to Q3 earnings October 13th with JPMorgan, we’ll get just three SPX components reporting next week Constellation Brands (STZ), PepsiCo (PEP), and Delta Air Lines (DAL).
At the time of publication, Sethi was long NVDA, SPCX, , QQQ, SPY, RSP, IWM, CPER, IBIT, and numerous equities in the energy sector.
As a reminder comments are encouraged. If they are directed at me, please put @NeilSethi in front.



