September Payrolls Miss Every Estimate, Wage Growth Slowest Since 2021
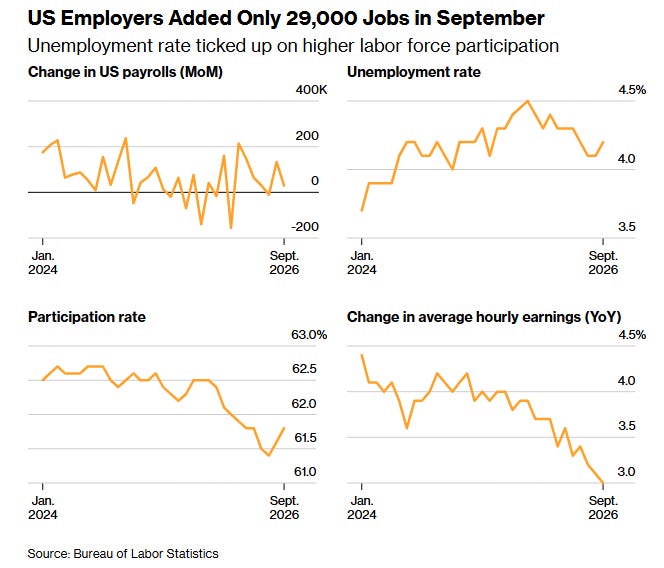
Payrolls rose just 29,000 with 60,000 in downward revisions, but household employment jumped 406,000.
You've reached your free article limit
You've read 0 of 1 free Pro articles.

As a reminder, there are two surveys in this release. One is a survey of employers that asks how many people they paid in the survey week (this is where the headline “jobs” number and wage and workweek information comes from). The other is a survey of households where they ask if people had a job in the survey week and other similar questions (if no job, were they looking for work, etc.). Because of the different populations surveyed and the different questions there can be very different answers. The household survey is much more volatile with a smaller survey size. Many also consider it less reliable.
Executive Summary
- Nonfarm payrolls rose just 29,000 in September, below every estimate in a Bloomberg survey (consensus 90,000), and July and August were revised down a combined 60,000, putting July back in negative territory.
- The 3-month average held at a revised 51,000, roughly the breakeven pace per Goldman Sachs, while the 6-month average slowed to 66,000. Private payrolls rose 46,000, the least since July, versus 81,000 expected.
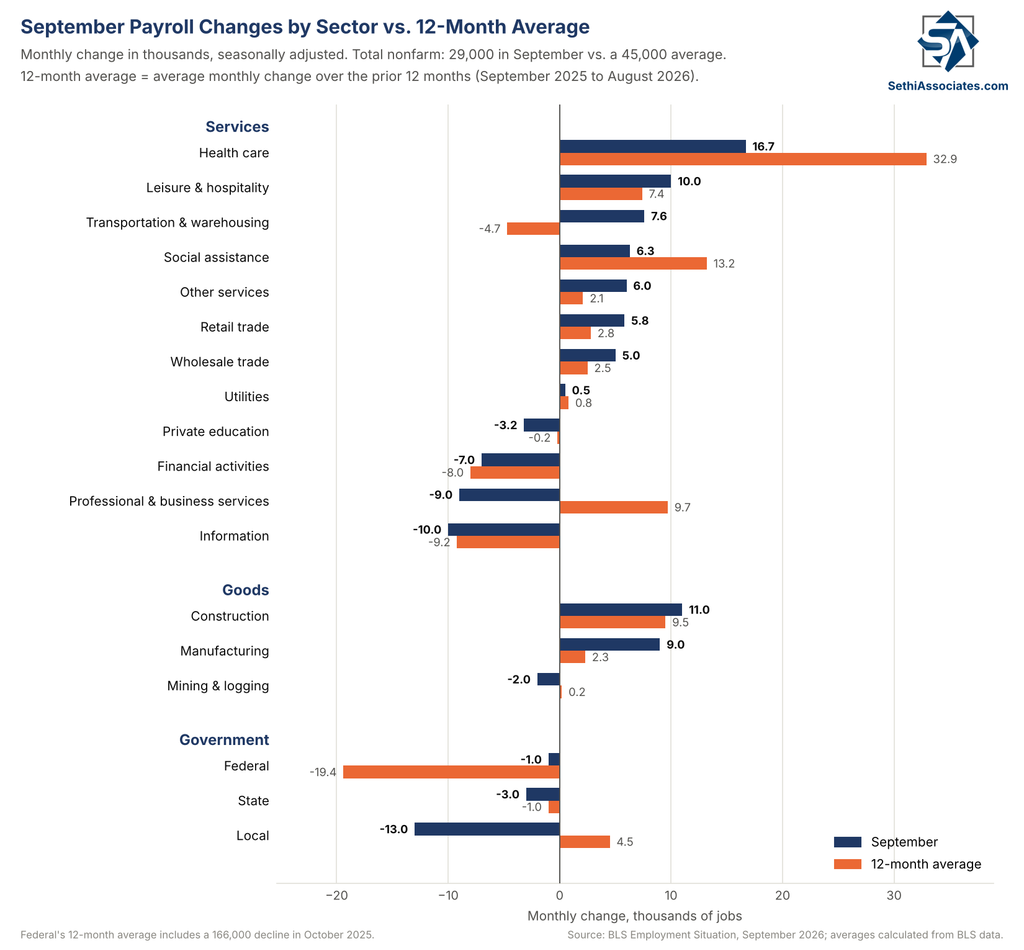
- Health care (16,700, about half its 12-month average), construction (11,000, a seventh straight gain to another record) and manufacturing (9,000, a fourth straight gain led by non-residential) added jobs, while information, financial activities, professional and business services and government declined, and the breadth of hiring fell to 49.0%, the lowest since October 2025.
- The household survey was stronger: employment rose 406,000 and the labor force 485,000, each the second-largest gain after August since January 2025’s benchmark revision, lifting participation to 61.8%, and prime-age participation to 83.7%, both the best since May.
- With more people looking for work, the unemployment rate rose to 4.2%, though by just 0.034 percentage point unrounded to 4.175%, the highest since June, but U-6 fell to 7.6%, the lowest since January 2025.
- Average hourly earnings rose just 0.13% month-over-month, the least since December, and 3.02% year-over-year, the slowest since May 2021.
- Aggregate weekly payrolls (total private-sector take-home pay) rose just 0.19%, the weakest since July, and 4.18% year-over-year. As of August, real take-home pay was up just 0.89% year-over-year.
- Traders cut the odds of an October Fed rate hike to 20% from 28%, pulling the 2-year yield down about 8 basis points and the 10-year also 8 basis points, but yields have since recovered.
Now let’s take a deeper look with lots (and lots) more details, metrics, charts and analyst commentary.
This post looks at the big picture of the Employment Situation report with a focus on jobs and incomes. My favorite metric for the economy from this report is at the end of this piece (aggregate weekly payrolls or total private worker take-home pay), so be sure you get down to it.
Employer’s Survey
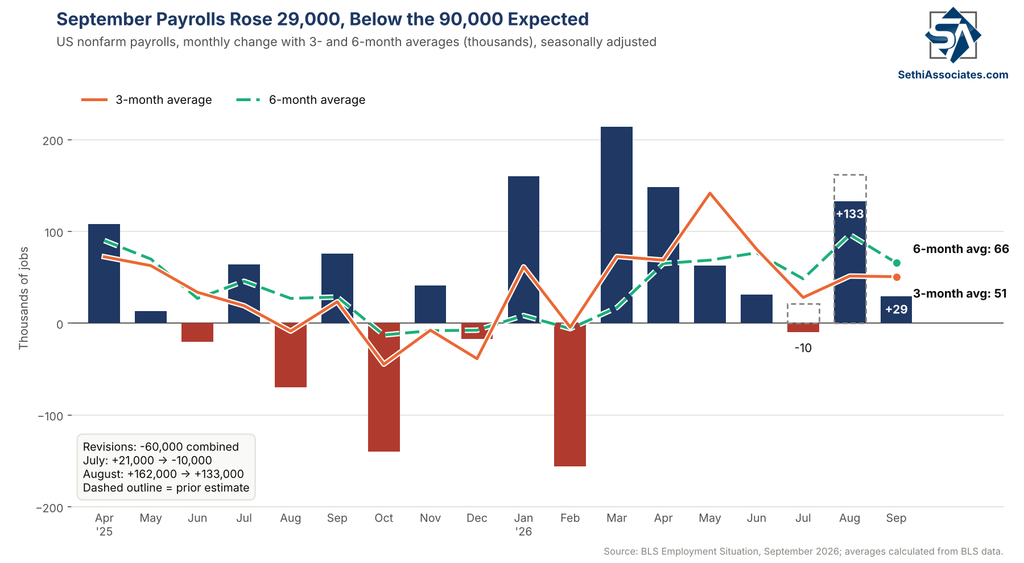
From the employer survey, September nonfarm payrolls rose just 29,000, less than a third of the 90,000 expected and below every estimate in a Bloomberg survey (the lowest was 35,000). It was also well below the 45,000 average monthly gain of the prior 12 months. Goldman Sachs noted that “today’s report continues the pattern of September payroll growth underperformance when Labor Day is later in the month, as it was this year.”
Revisions to the prior two months were also unfavorable, subtracting 60,000, with July revised down 31,000 to a loss of 10,000 (from a gain of 21,000), putting it back in negative territory, and August revised down 29,000 to 133,000 (from 162,000). The 3-month average was unchanged at a revised 51,000 (71,000 before revisions), and the 6-month average slowed to 66,000 from a revised 97,000. For the year, payrolls have averaged 68,000 a month, while private-sector hiring has averaged 70,000 a month in 2026, well above the 25,000 average of 2025 but below the 85,000 of 2024.
Goldman: “both the three-month average of payroll growth and our estimate of the underlying pace of job growth based on the payroll and household surveys stand at 51k, roughly our estimate of the breakeven pace.”
In looking at the composition, services sectors added 28,000 after a downwardly revised 55,000 in August (from 86,000), with health care again the largest contributor.
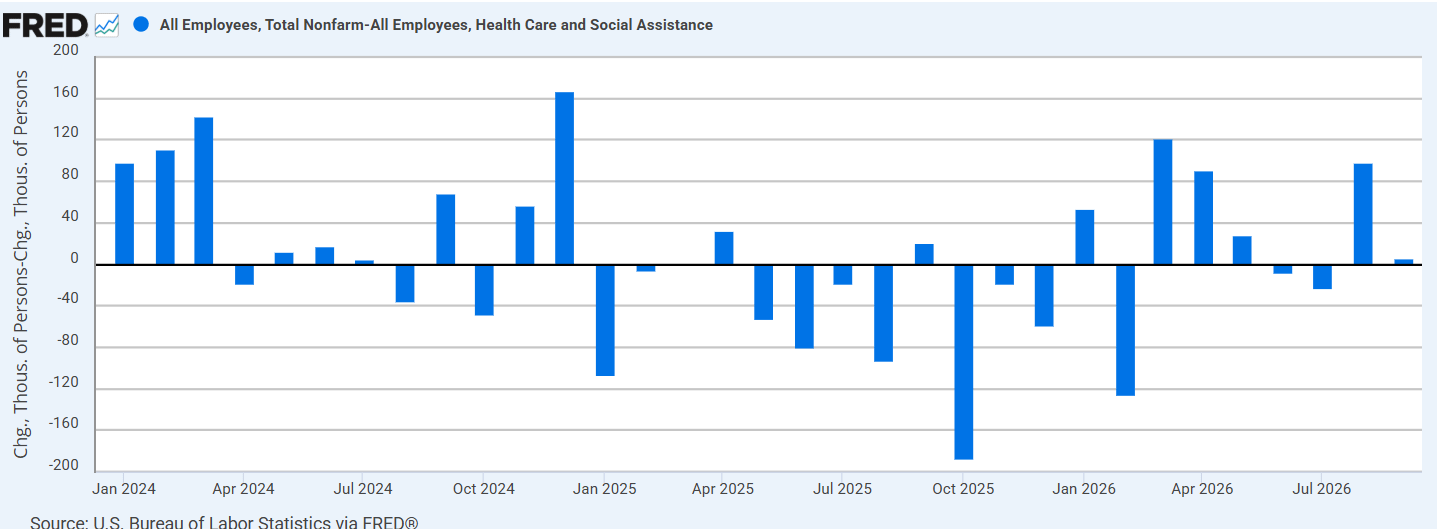
- Health care and social assistance added 23,000 combined, but health care at 16,700 was about half its 33,000 average of the prior 12 months (August was revised up to 24,400 from 12,900), with ambulatory health care services up 13,400 and hospitals up 12,000, while nursing and residential care facilities lost 8,700. Social assistance added 6,300.
- Leisure and hospitality added 10,000 after a downwardly revised 37,000 in August (from 62,000), with food services and drinking places up 10,800 after a downwardly revised 33,800 (from 59,200).
- Transportation and warehousing added 7,600, retail trade 5,800 and wholesale trade 5,000. Other services added 6,000.
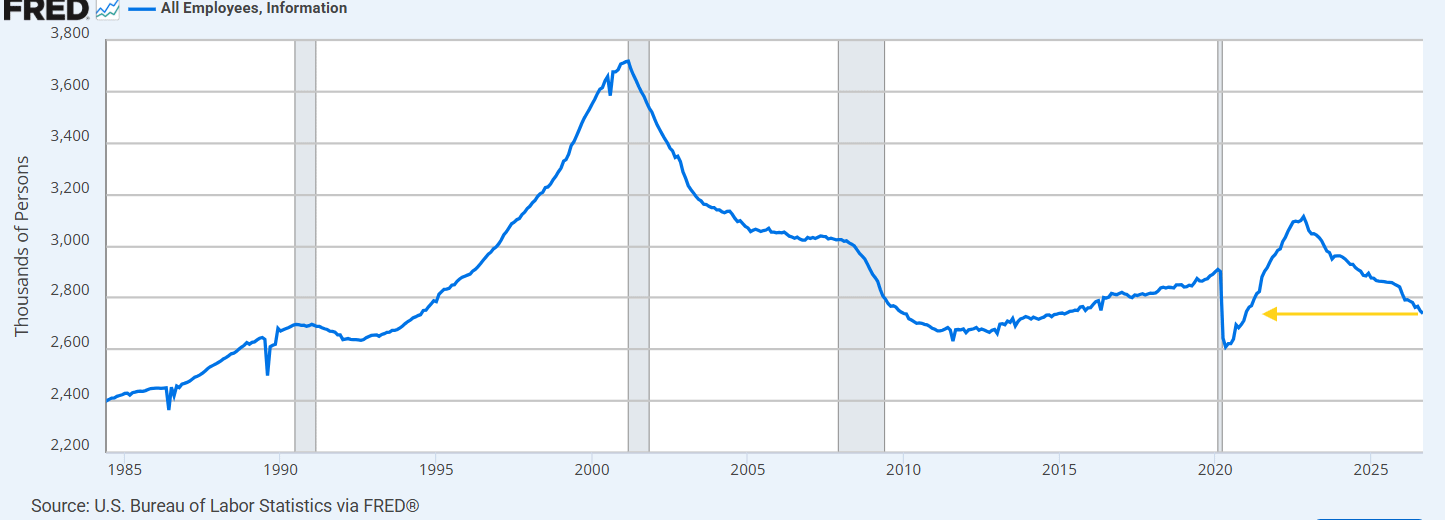
- On the negative side, information fell 10,000 after a revised decline of 18,000 in August, with publishing down 4,000 and broadcasting and content providers down 3,000. At 2.739 million, the least since December 2020, it is now down 376,000 from its November 2022 peak (chart).
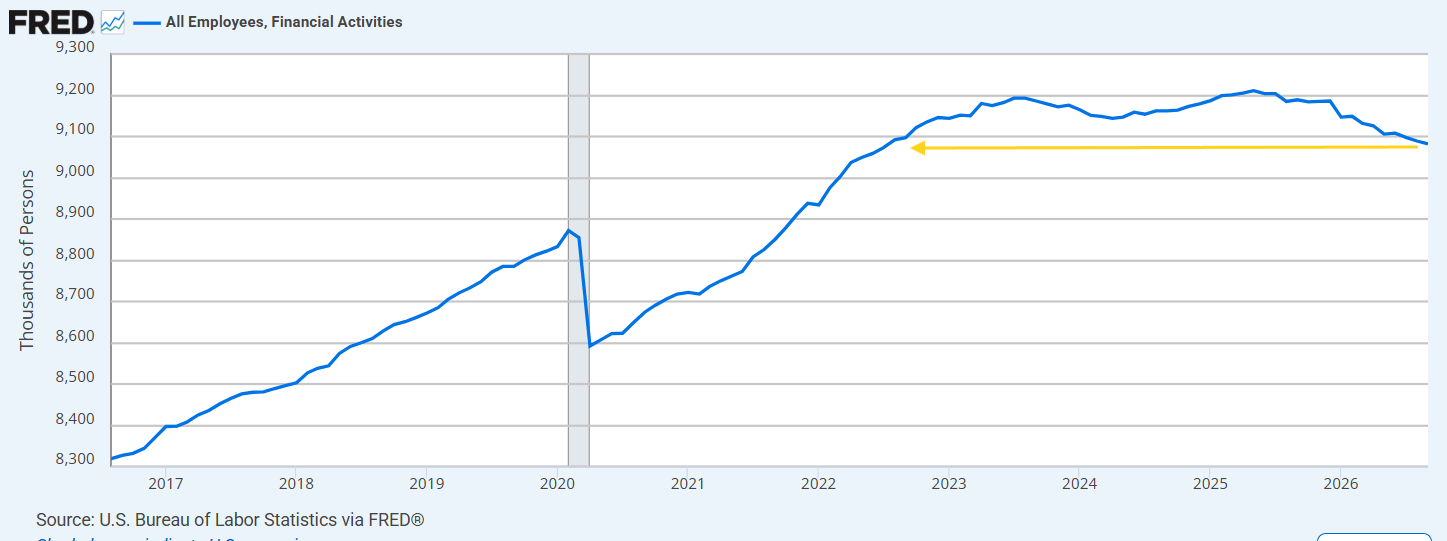
- Financial activities fell 7,000, a third straight decline, to 9.082 million, the least since July 2022, and is now down 129,000 from its May 2025 peak (chart), but note it’s not Wall Street. Of that 129,000, 90,000 of that is insurance carriers and related activities, per the BLS.
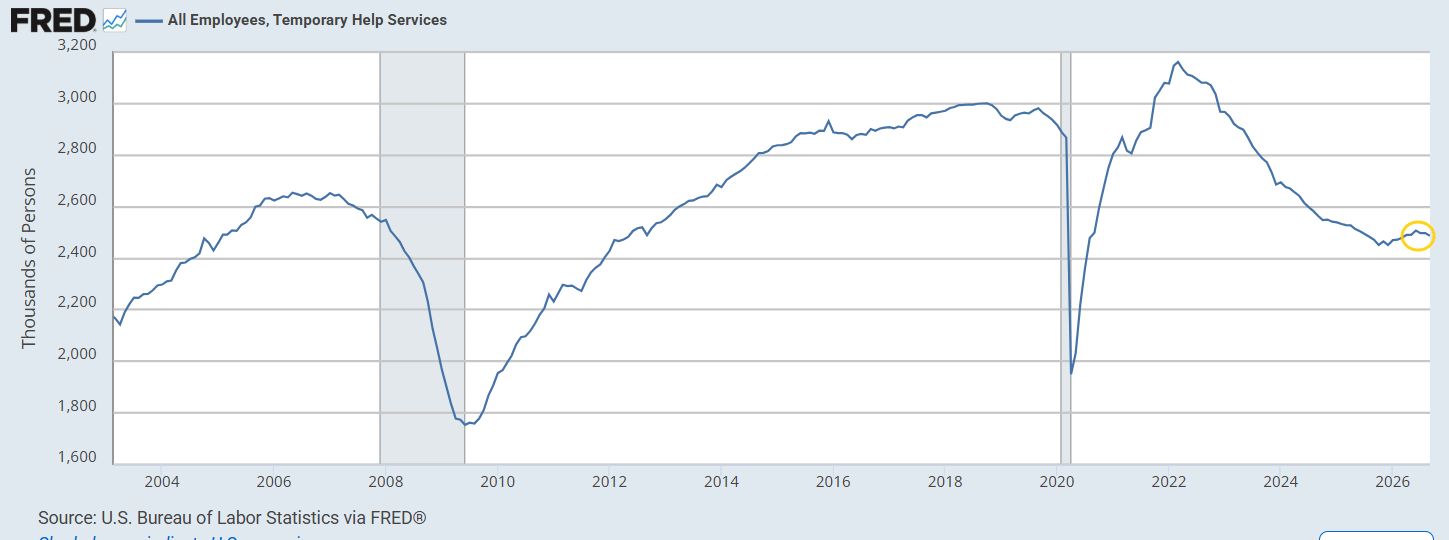
- Professional and business services fell 9,000 after a revised decline of 5,000 in August (from a gain of 10,000), with temporary help services down 10,900 to 2.487 million, the lowest since March, and continuing a pullback from a local peak in June (chart). Revisions now show temp help, a leading indicator, falling 10,000 in July (from a gain of 5,200) and adding just 200 in August (from 6,800). Information, financial activities and professional and business services are among the industries Bloomberg describes as most exposed to artificial intelligence.
Goods sectors added 18,000 after a downwardly revised 34,000 in August (from 41,000).
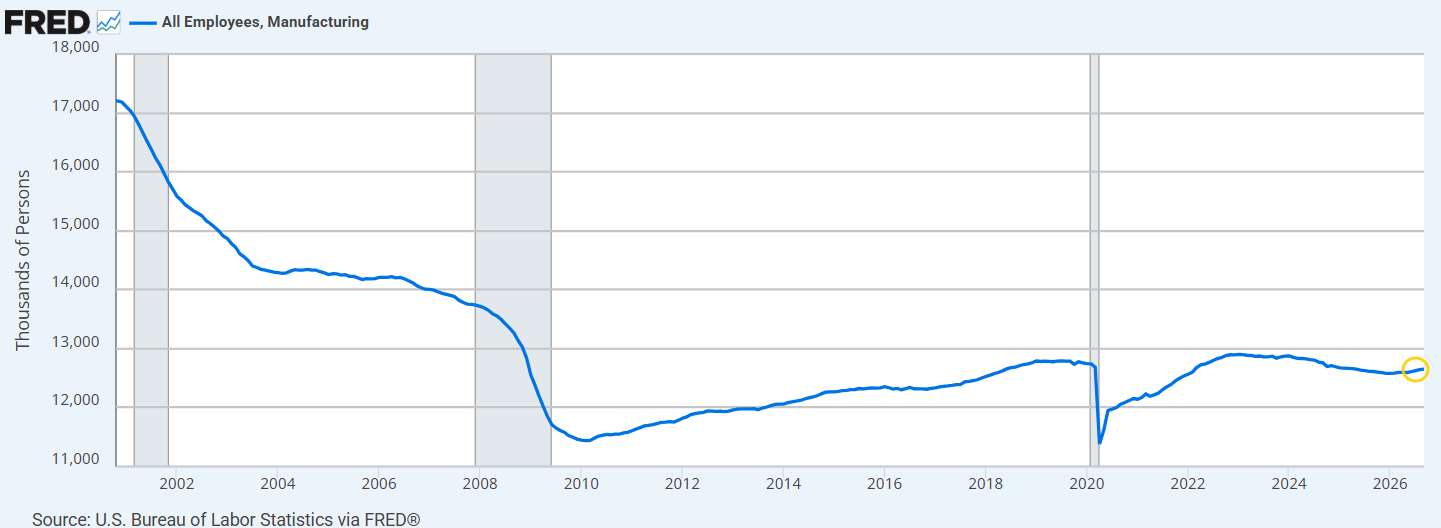
- Manufacturing added 9,000, a fourth straight gain though the smallest of the streak, to 12.652 million, the highest since April 2025, and is now up 72,000 since its recent low in December 2025, although overall in a narrow range since late 2021 (chart). Plastics and rubber products and machinery each added about 5,000.
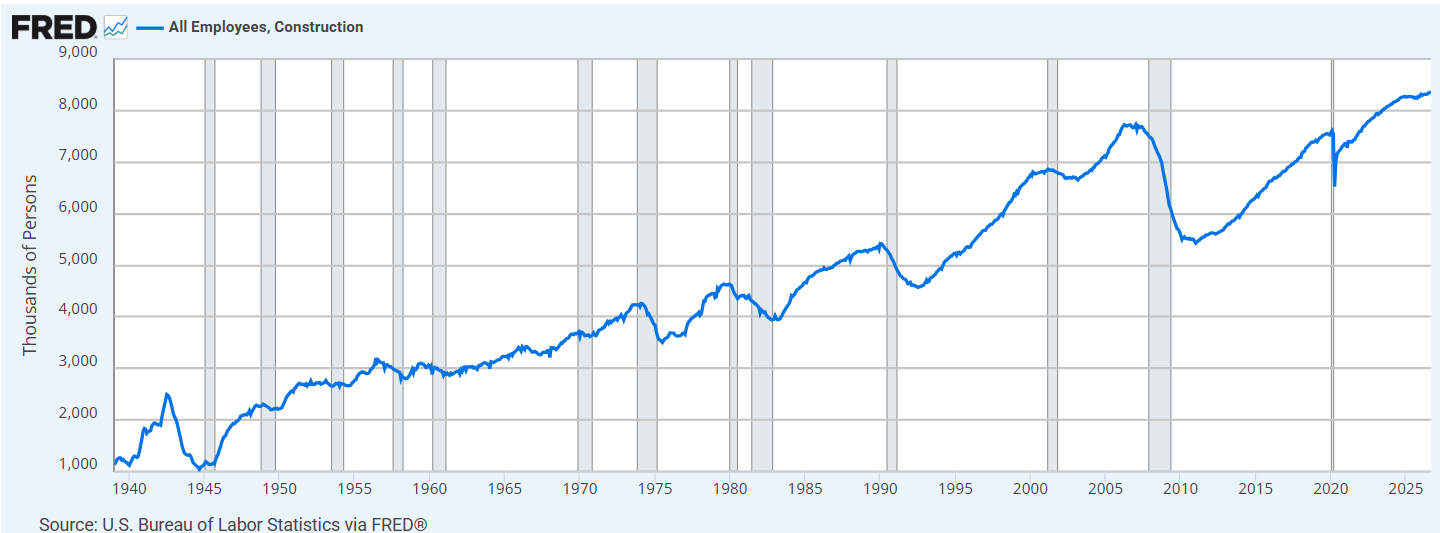
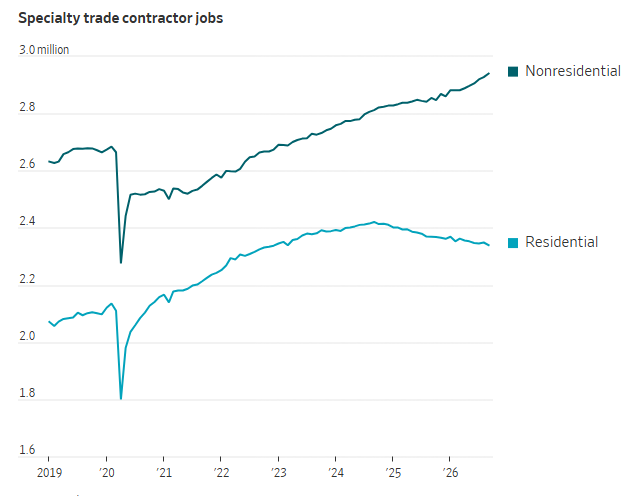
- Construction added 11,000, the seventh straight monthly gain, to another all-time high of 8.364 million (chart), just above its 10,000 average of the prior 12 months. Nonresidential specialty trade contractors added 12,300, also to an all-time high (chart), while residential specialty trade contractors lost 7,900 extending a split that began in 2024.
- Mining and logging lost 2,000.
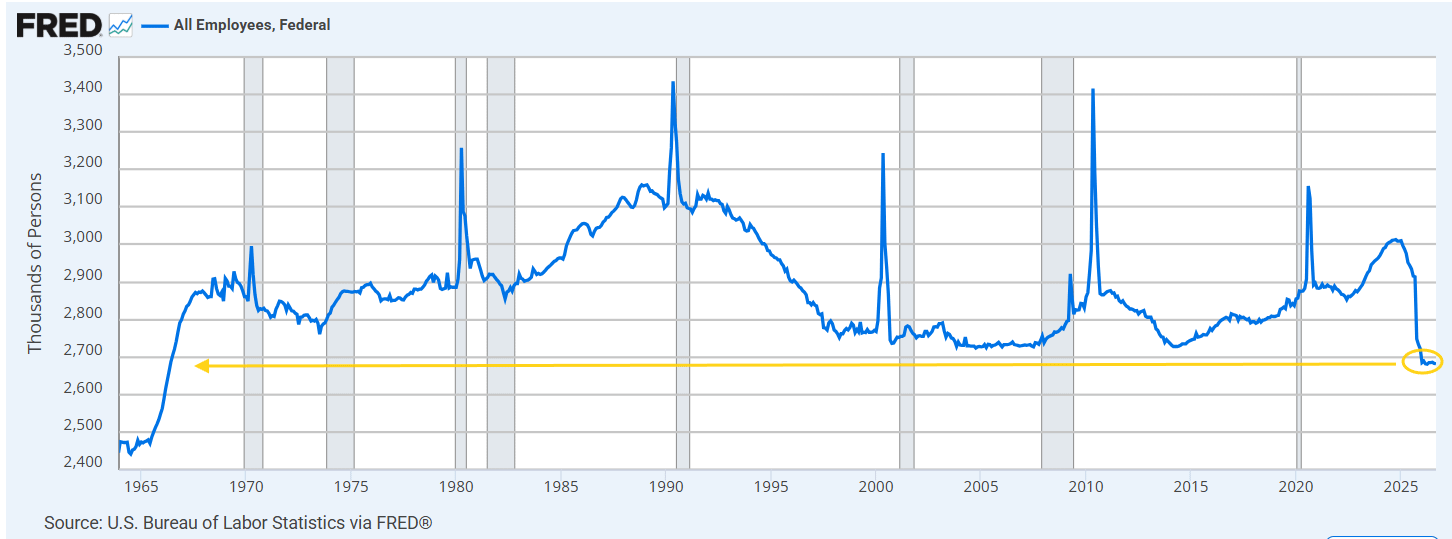
Government lost 17,000 after a revised gain of 44,000 in August (from 35,000), led by local government down 13,000 (down 10,600 excluding education). State government fell 3,000, and federal fell another 1,000 to 2.682 million, just above April’s 2.681 million, which remains the least since May 1966, and is now down 331,000, or 11.0%, from its October 2024 peak (chart). August was revised up to 2.683 million from 2.674 million.
Private payrolls rose 46,000, the least since July, versus 81,000 expected, after a downwardly revised 89,000 in August (from 127,000). The 3-month private average rose to 54,000 from a revised 48,000 through August.
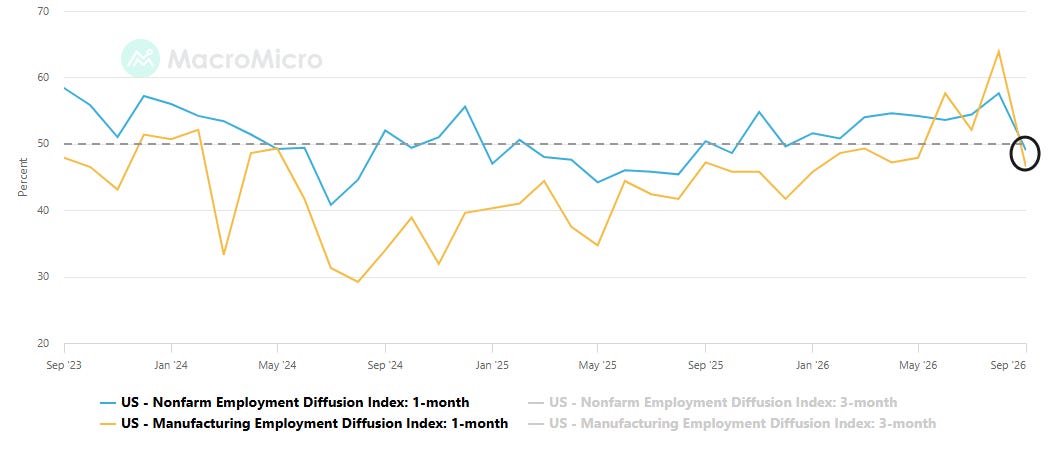
The breadth of hiring (the diffusion index, the percentage of industries with employment increasing plus half of industries with employment unchanged) fell to 49.0%, the lowest since October 2025, from an upwardly revised 57.6% in August, the best since October 2022, and for manufacturing to 46.5%, the least since January, from an upwardly revised 63.9%, which was the best since October 2022.
Household Survey
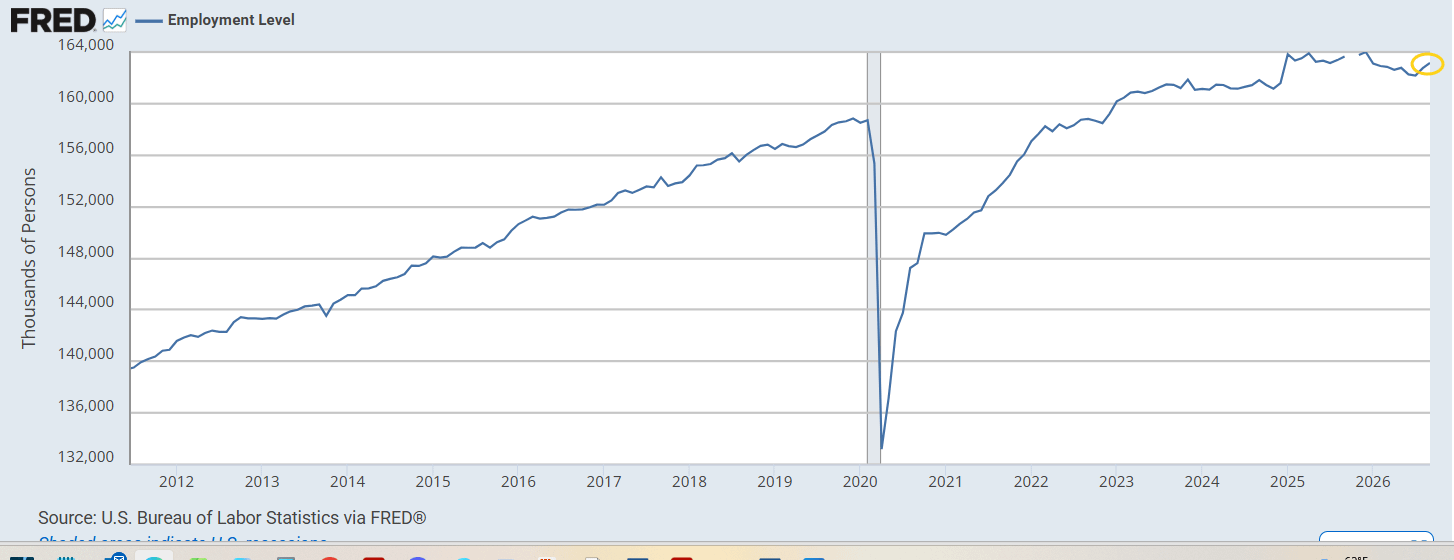
Turning to the household survey, the picture was again stronger than the payroll data. The number of employed persons rose 406,000, the second-largest gain (after August) since January 2025’s benchmark revision, lifting total employment to 163.152 million, the highest since January.
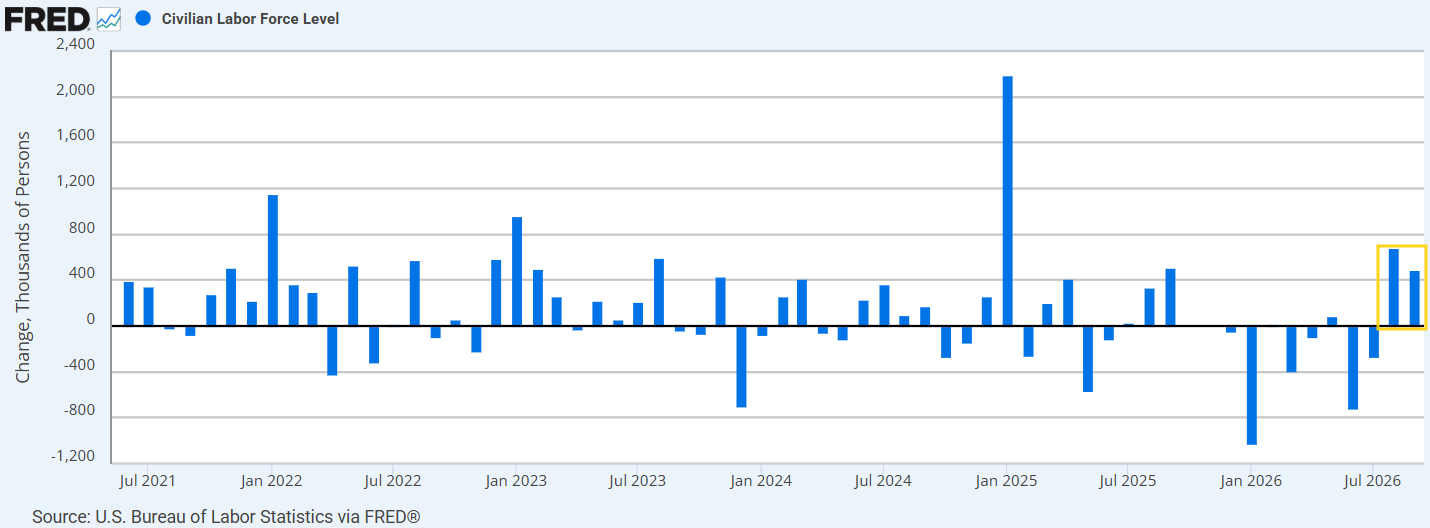
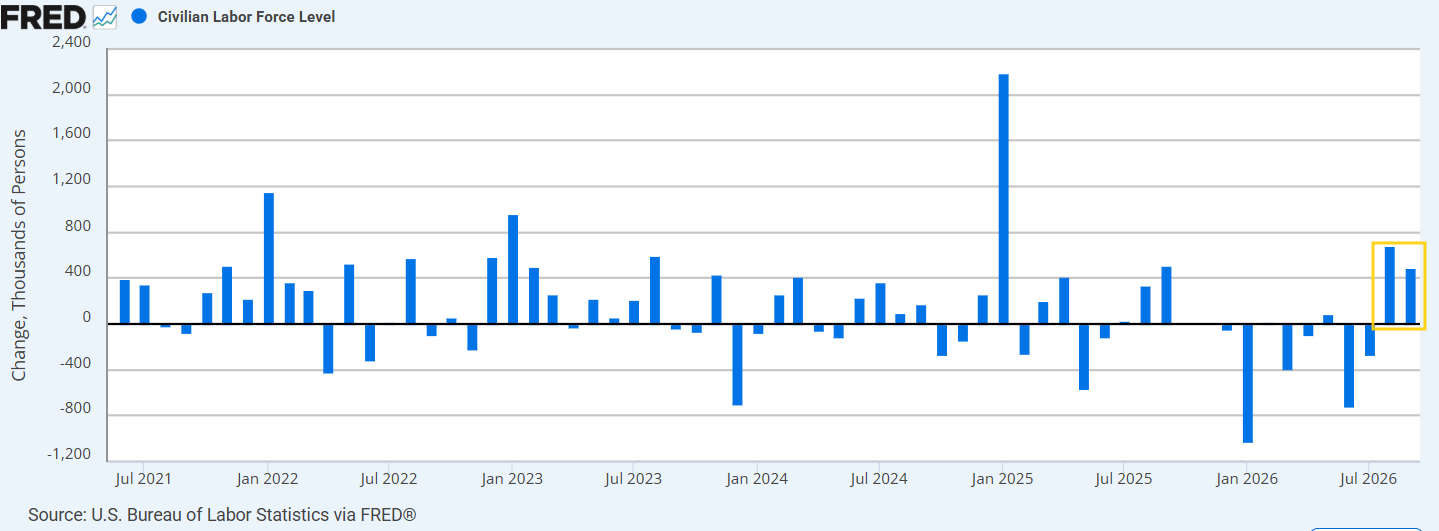
But the labor force grew even more, rising 485,000 to 170.262 million, like with the number of employed the second highest since January’s benchmark revision after August.
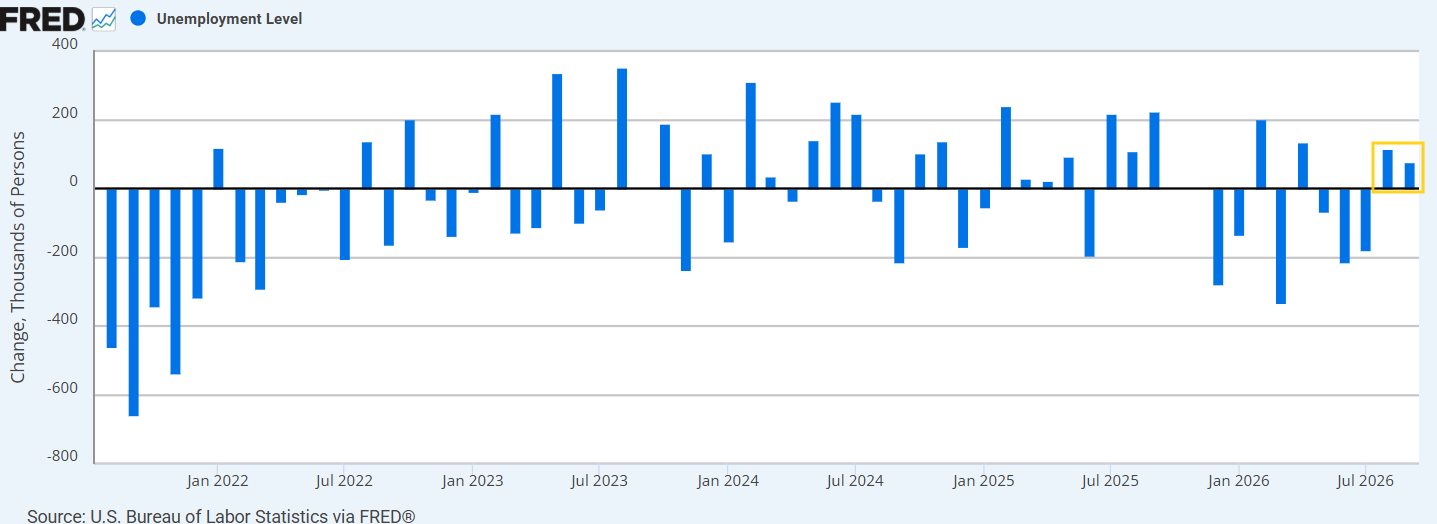
With growth in the labor force again exceeding employment, the number of unemployed rose 78,000 to 7.109 million, the most since May, a second straight increase.
That pushed the unemployment rate up to 4.2% rounded (on an unrounded basis though it rose just 0.034 percentage point to 4.175%, the highest since June, from 4.141% in August).
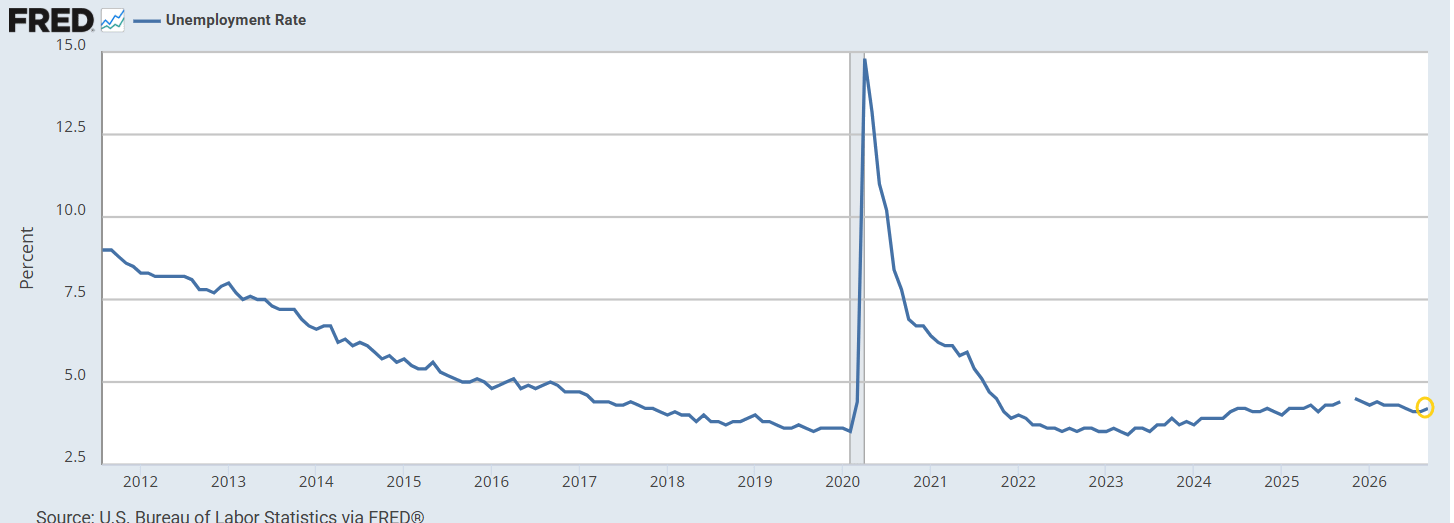
By group, Black unemployment jumped a full percentage point to 7.0%, the highest since April, while Asian unemployment fell to 2.9%, the lowest since April 2024, and the White (3.6%) and Hispanic (4.7%) rates edged lower.
With the jump in the labor force, the labor force participation rate rose another two-tenths to 61.8%, the highest since May (61.79% unrounded, up from 61.64%), it remains 0.3 percentage point below its January level.
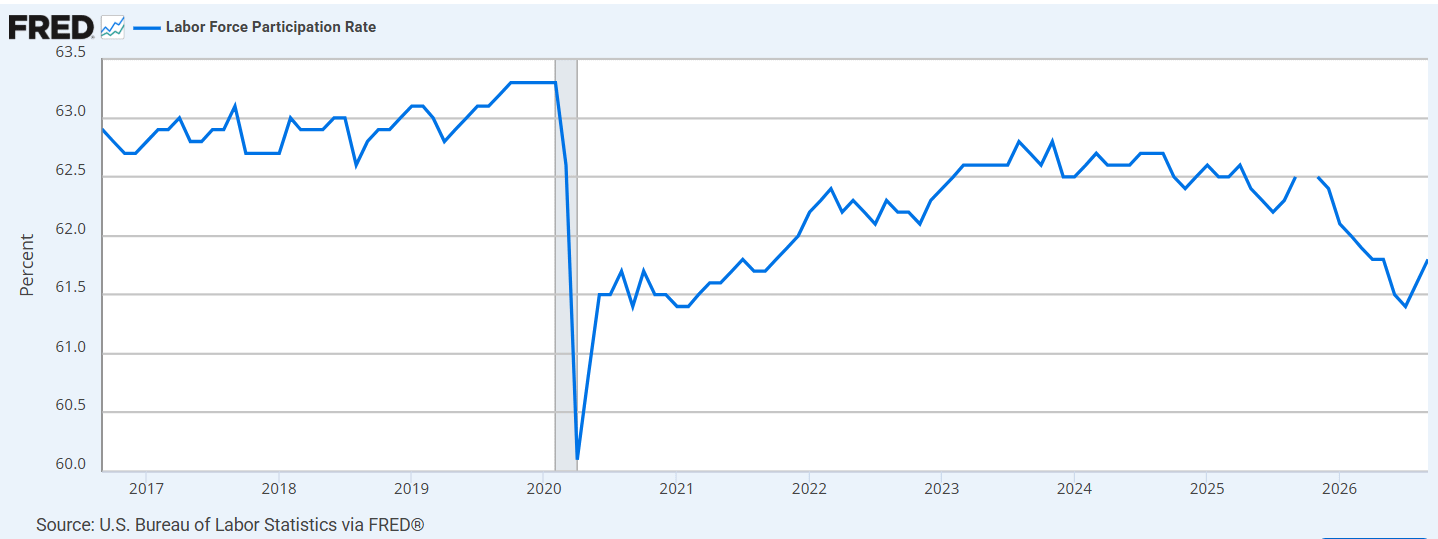
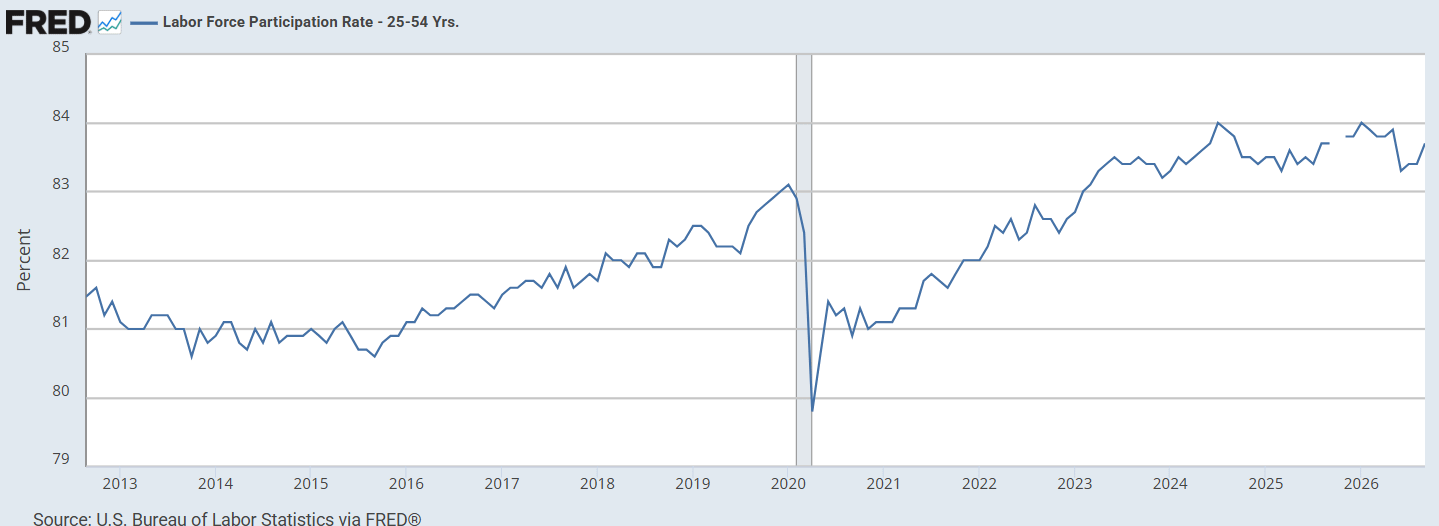
Goldman said the rise was driven by a 0.9 percentage point increase in participation among 16- to 24-year-olds, likely reflecting residual seasonality, and a 0.5 percentage point increase among 35- to 44-year-olds with prime-age (25-54) participation at 83.7%, the best since May.
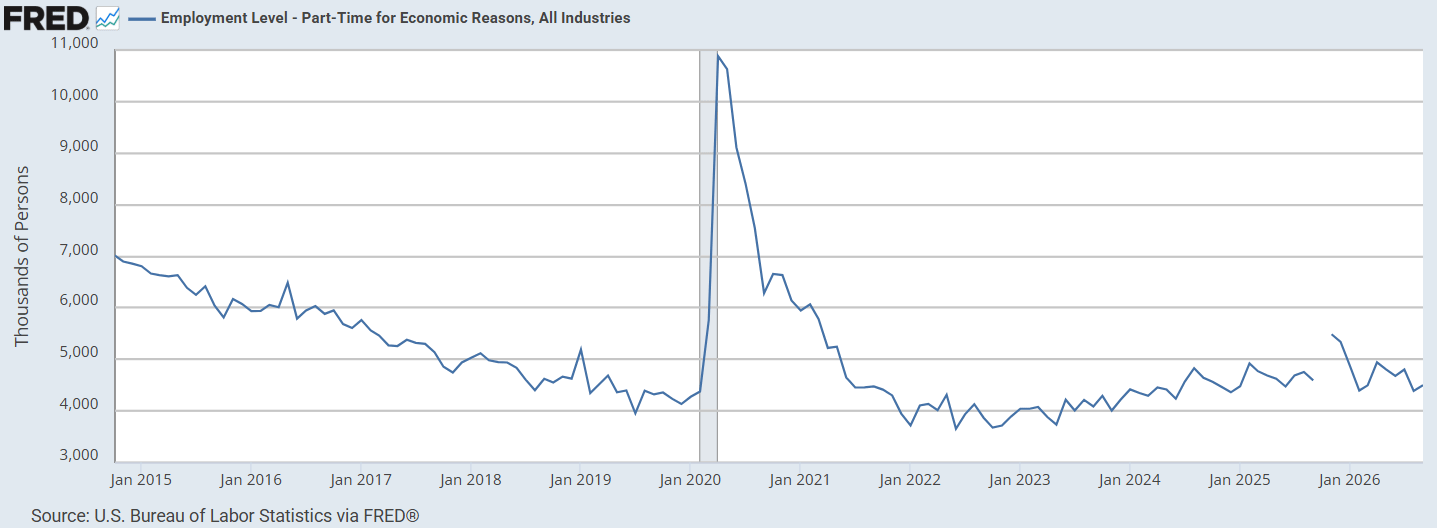
Part-time employment for economic reasons rose 111,000 to 4.501 million, but only after plunging 414,000 in August to 4.390 million, the lowest since June 2024.
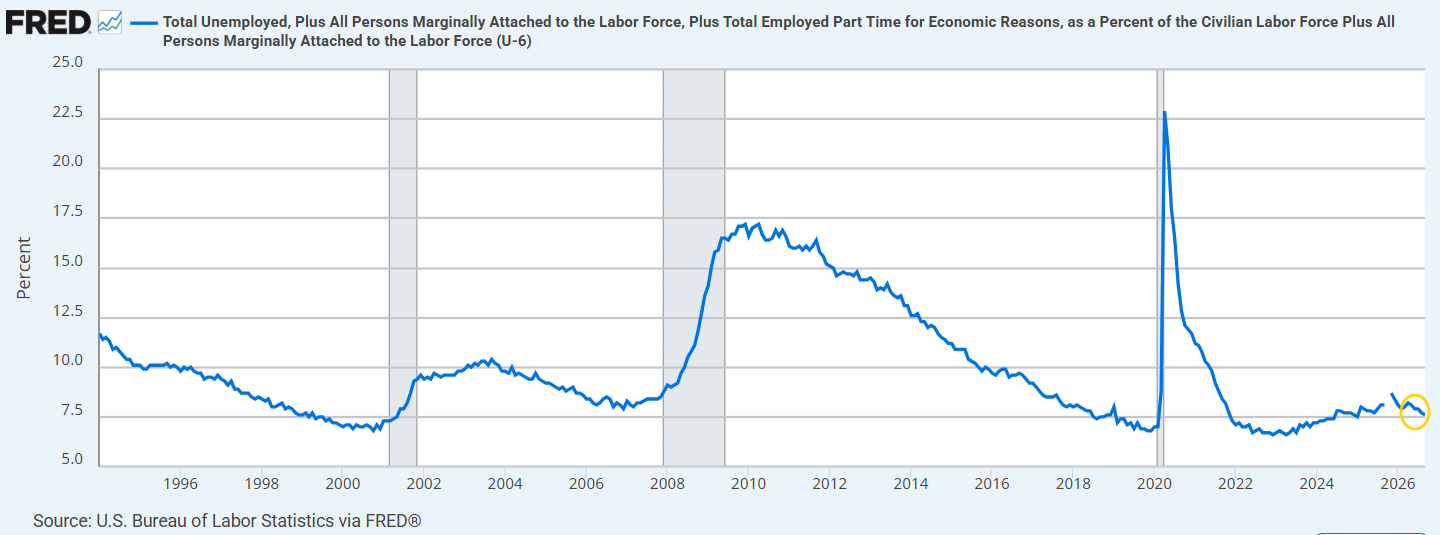
The U-6 broader unemployment measure fell a tenth to 7.6%, the lowest since January 2025 (chart). Discouraged workers edged down to 414,000, and marginally attached workers fell 236,000 to 1.468 million.
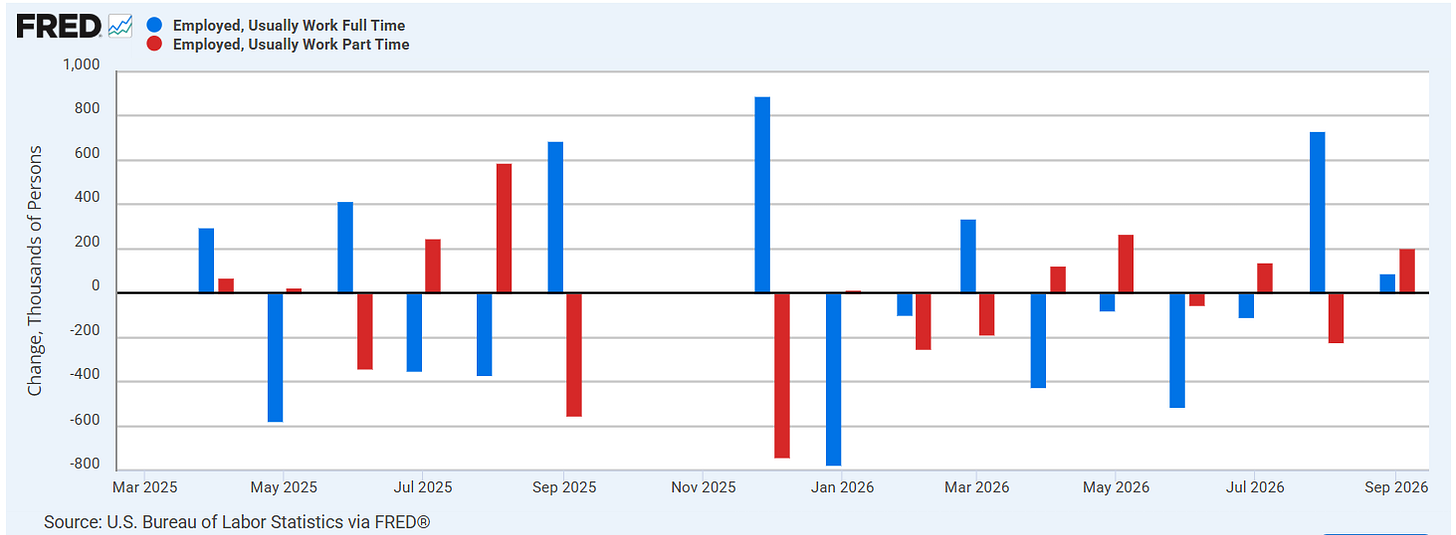
In the full-time/part-time split, full-time workers rose 88,000, a second straight gain, while part-time workers rose 205,000, the most since May.
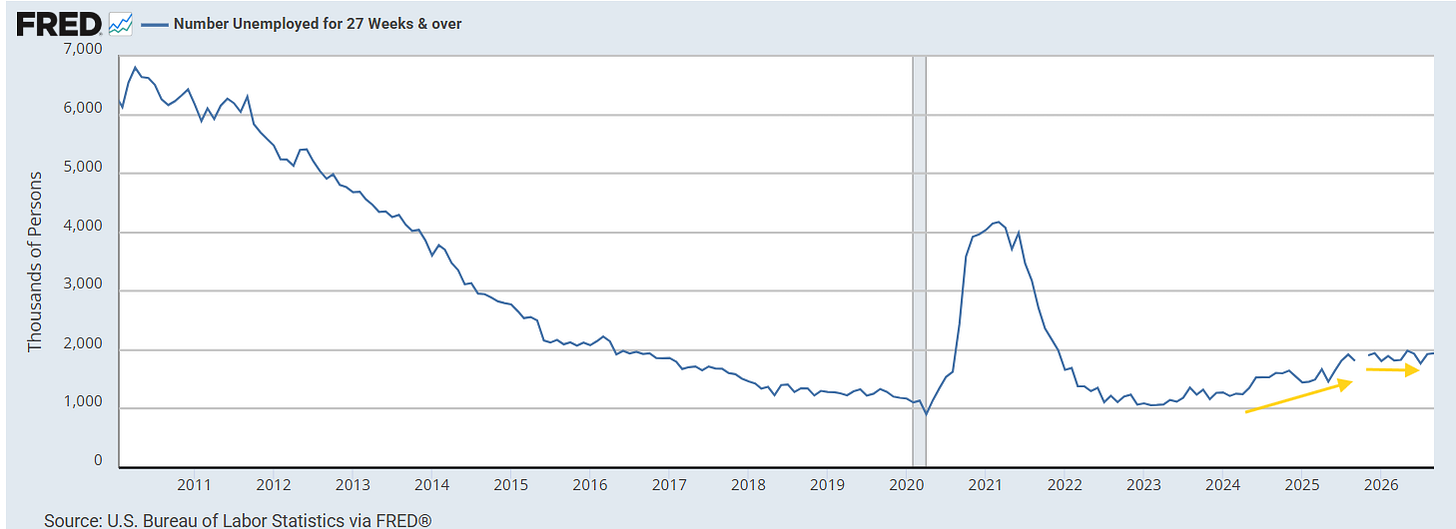
On unemployment duration, those unemployed 27 weeks or longer rose 14,000 to 1.944 million, the most since May, but little changed over the past year, representing 27.1% of all unemployed.
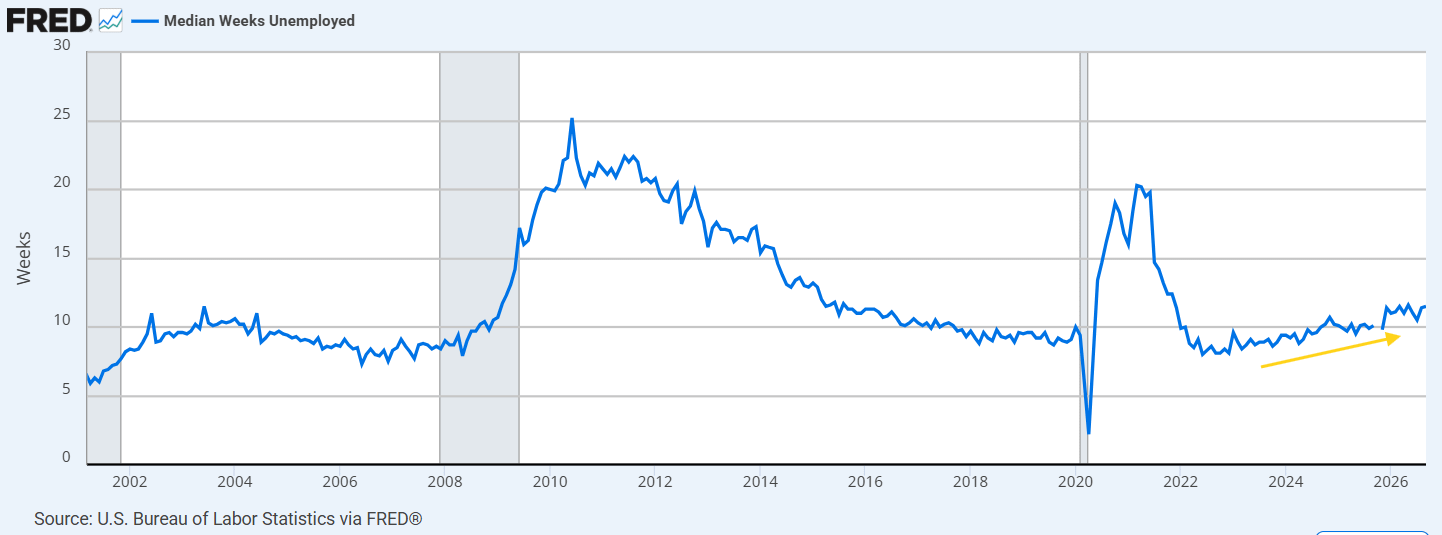
The median duration of unemployment edged up to 11.5 weeks, the longest since May.
Incomes
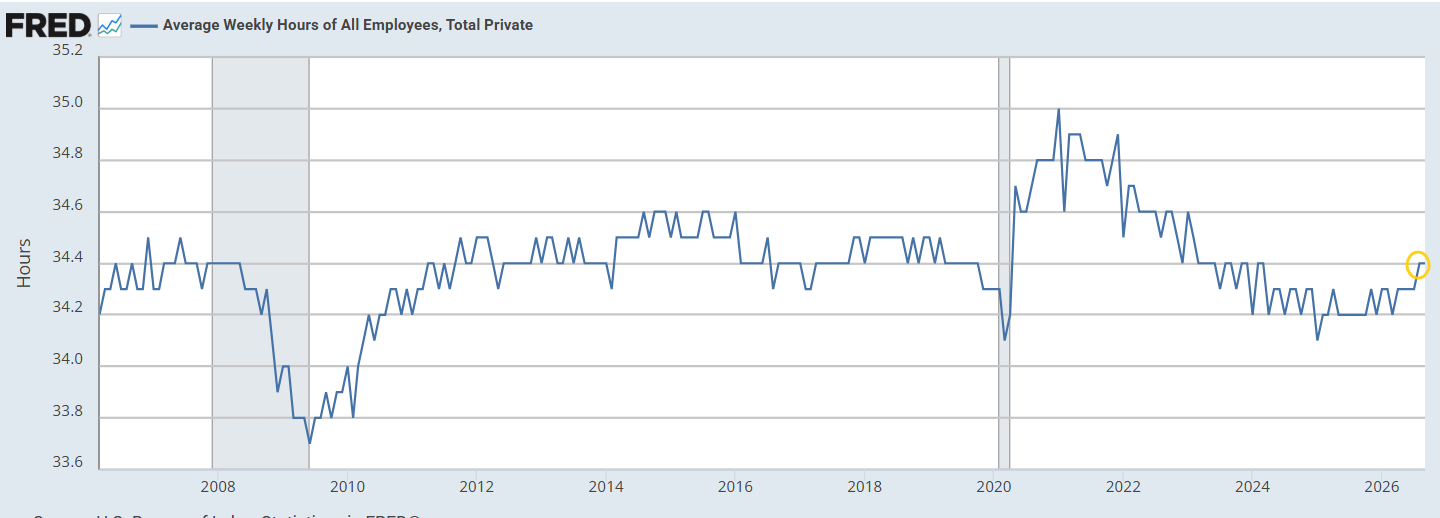
The average workweek was unchanged at 34.4 hours, holding at the highest since March 2024 (chart), though still below the pre-pandemic 10-year average.
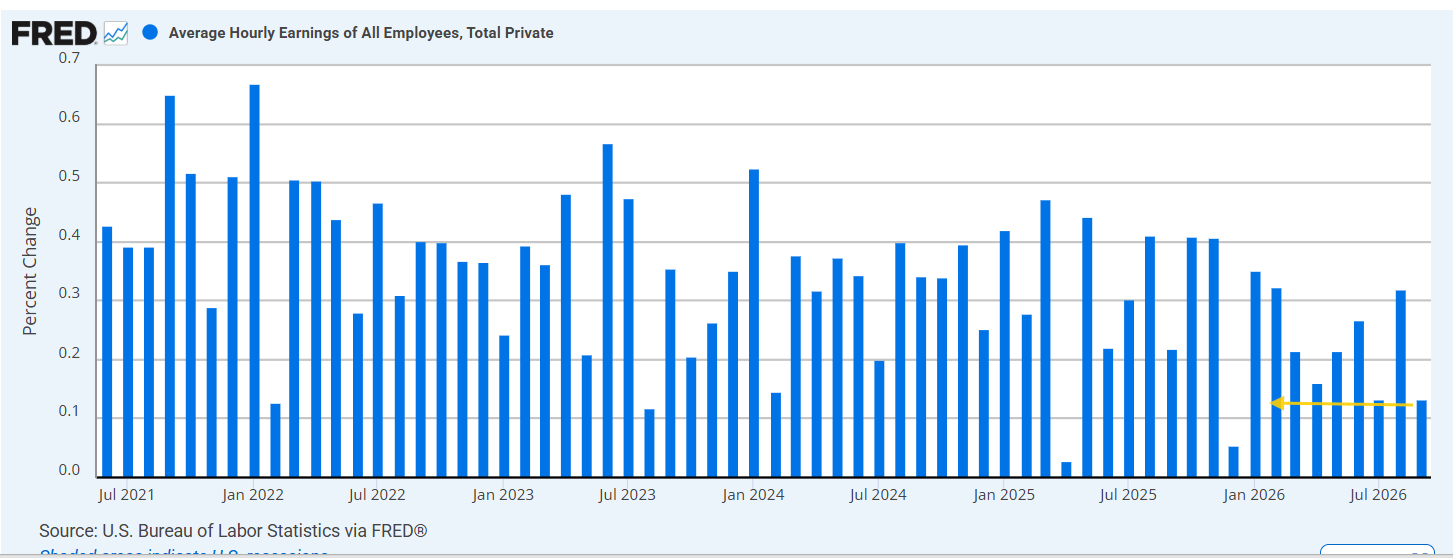
Average hourly earnings rose just 0.132% month-over-month (5 cents to $37.81), the least since December, well below the 0.3% consensus, but after an upwardly revised 0.32% in August. Per Bloomberg, only one of 58 economists in its survey had a forecast as low as 0.1%.
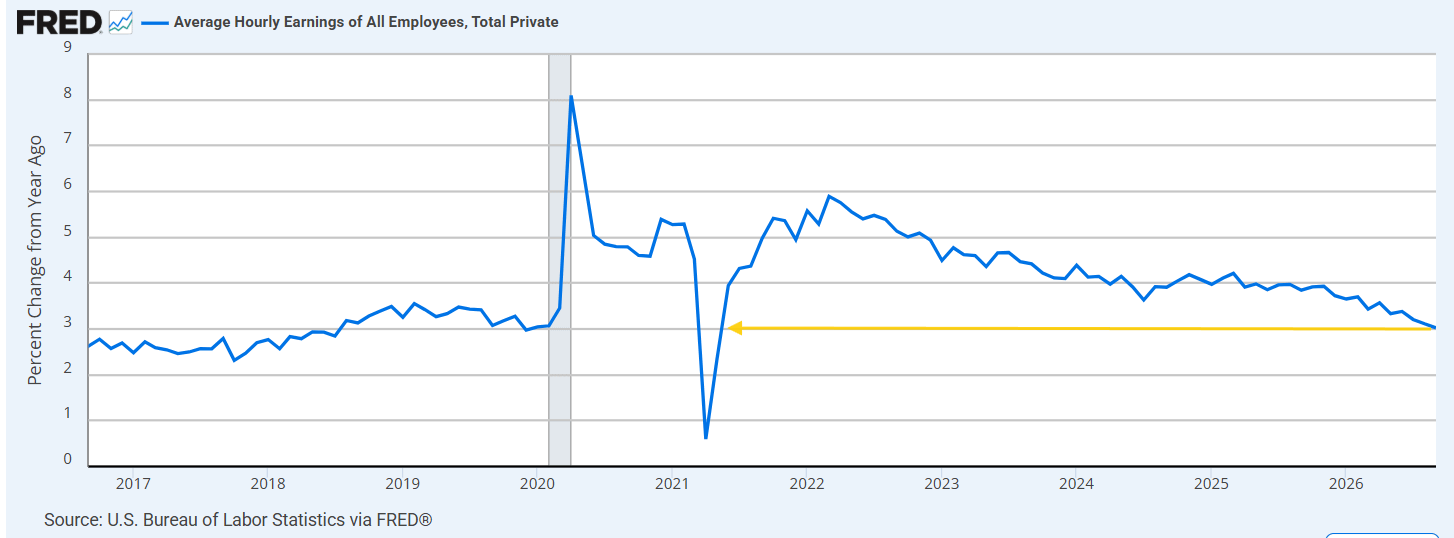
From a year ago, average hourly earnings decelerated again to 3.02%, the slowest since May 2021, from 3.11% in August.
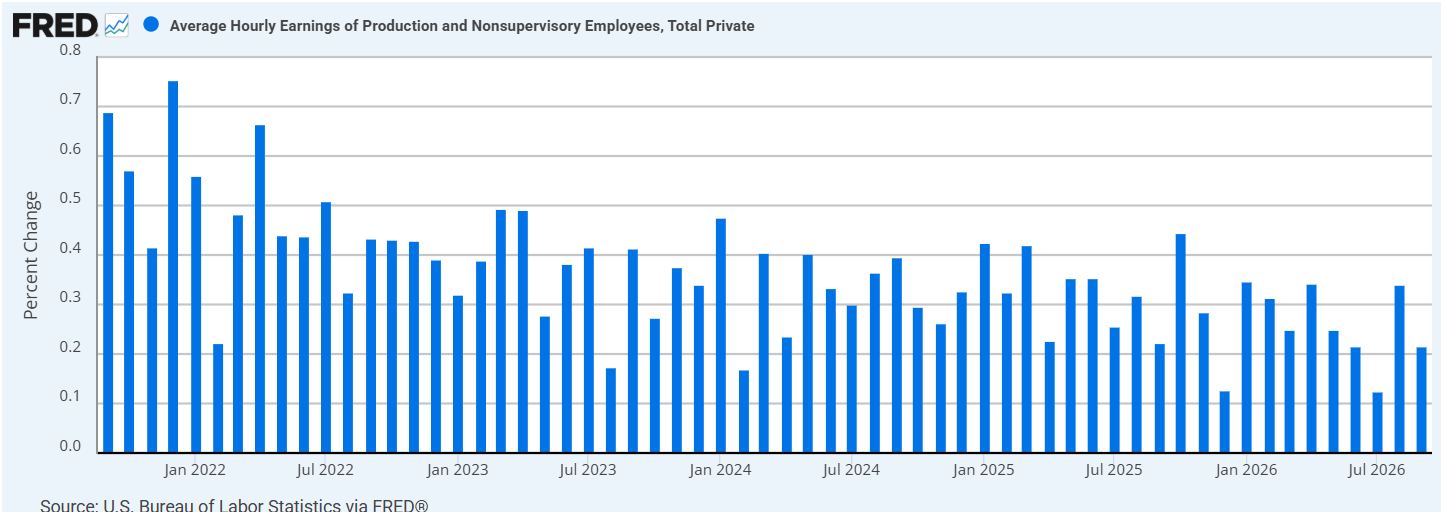
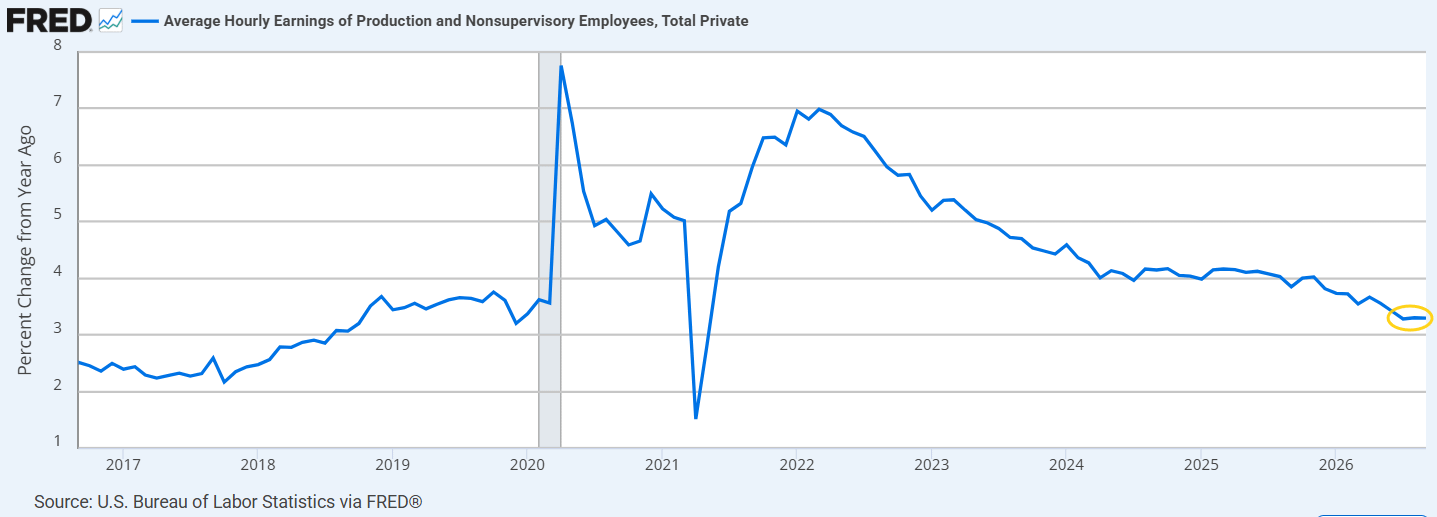
For production and nonsupervisory employees, earnings were firmer at 0.22% month-over-month and 3.30% year-over-year.
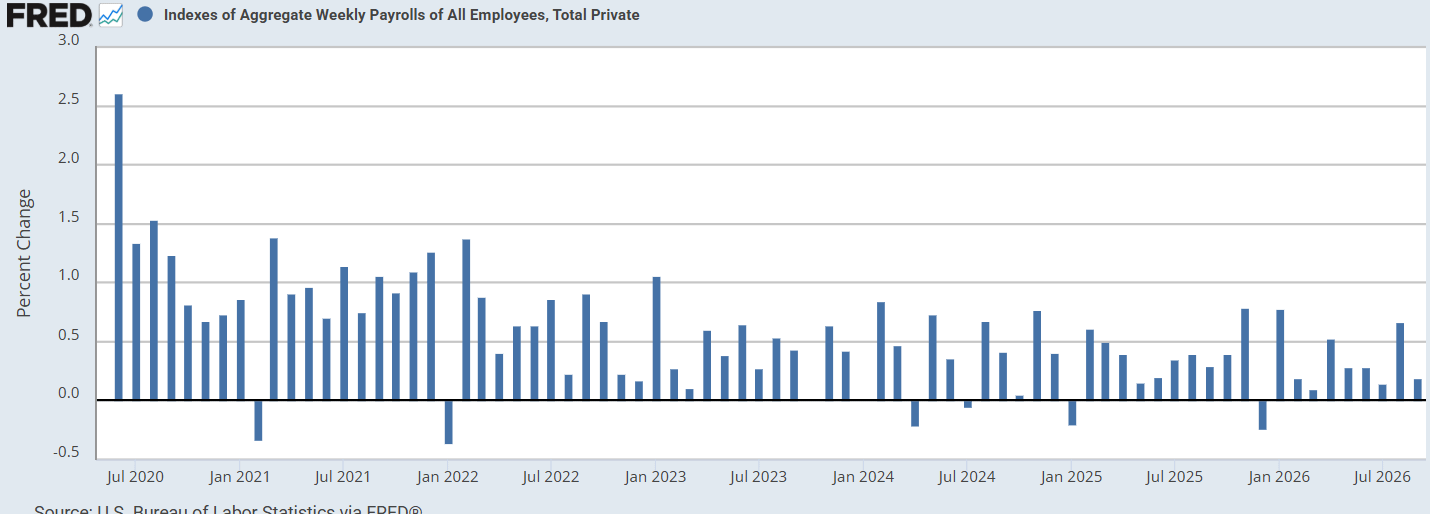
Putting together the smaller payroll gain, the unchanged workweek and the soft hourly earnings, the index of aggregate weekly payrolls* — which I consider among the most important metrics from this report as it represents the total take-home income of private employees — rose just 0.19% month-over-month, the weakest since July, down sharply from August’s 0.67%.
*The number represents aggregate take-home income for all workers (it is just total number of jobs × hourly earnings × workweek; Nick Timiraos calls it “a good monthly proxy for nominal income growth and correlates well with nominal GDP growth”).
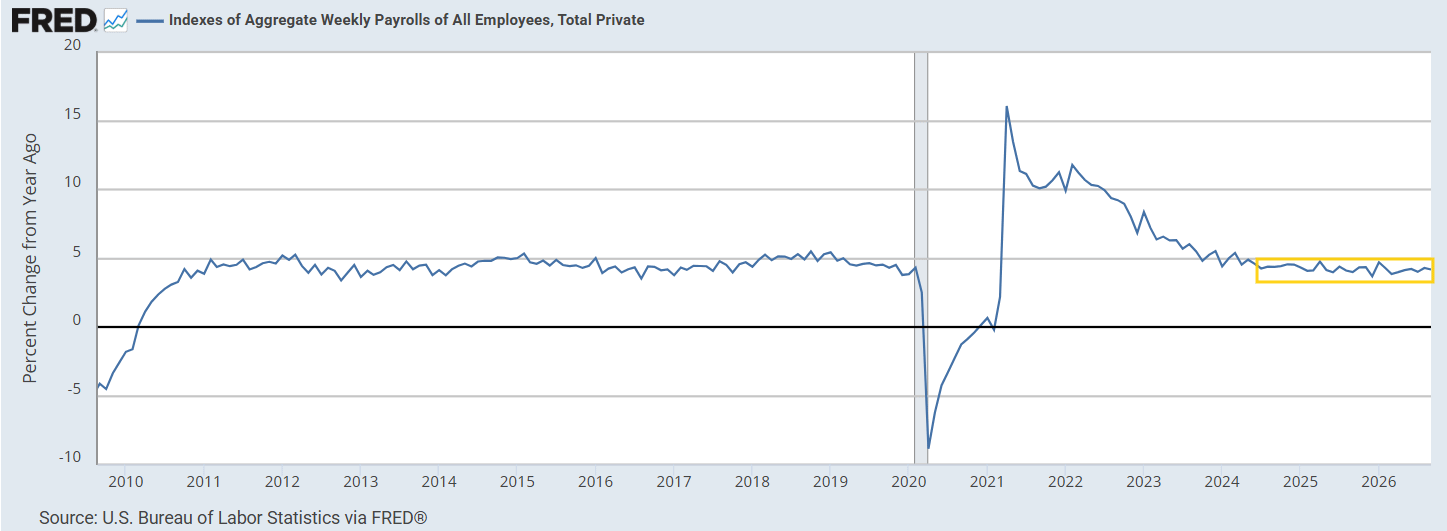
The year-over-year rate has remained stable the past two years in September coming in at 4.18% from a revised 4.29% in August (4.34% before revisions).
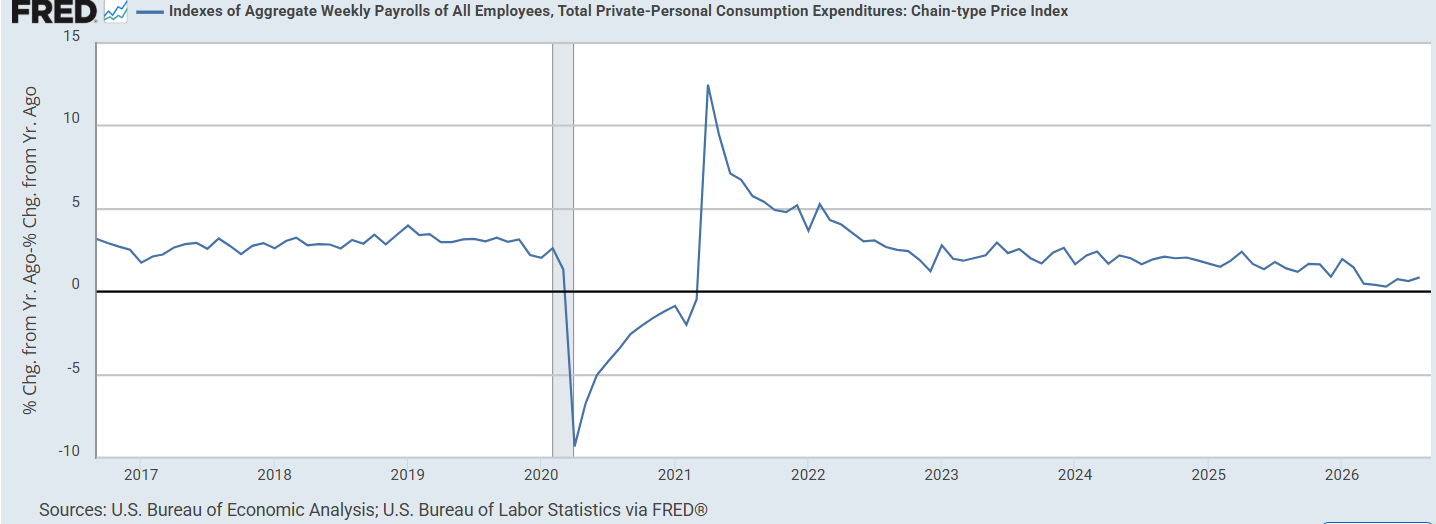
On a nominal basis that remains consistent with the 10-year pre-pandemic average, but with inflation running well above those levels the real figure is significantly lower — as of August, with CPI at 3.4% year-over-year, real aggregate weekly payrolls were running at just 0.89% year-over-year (we’ll get the September CPI report on Oct. 14).
Market Reaction
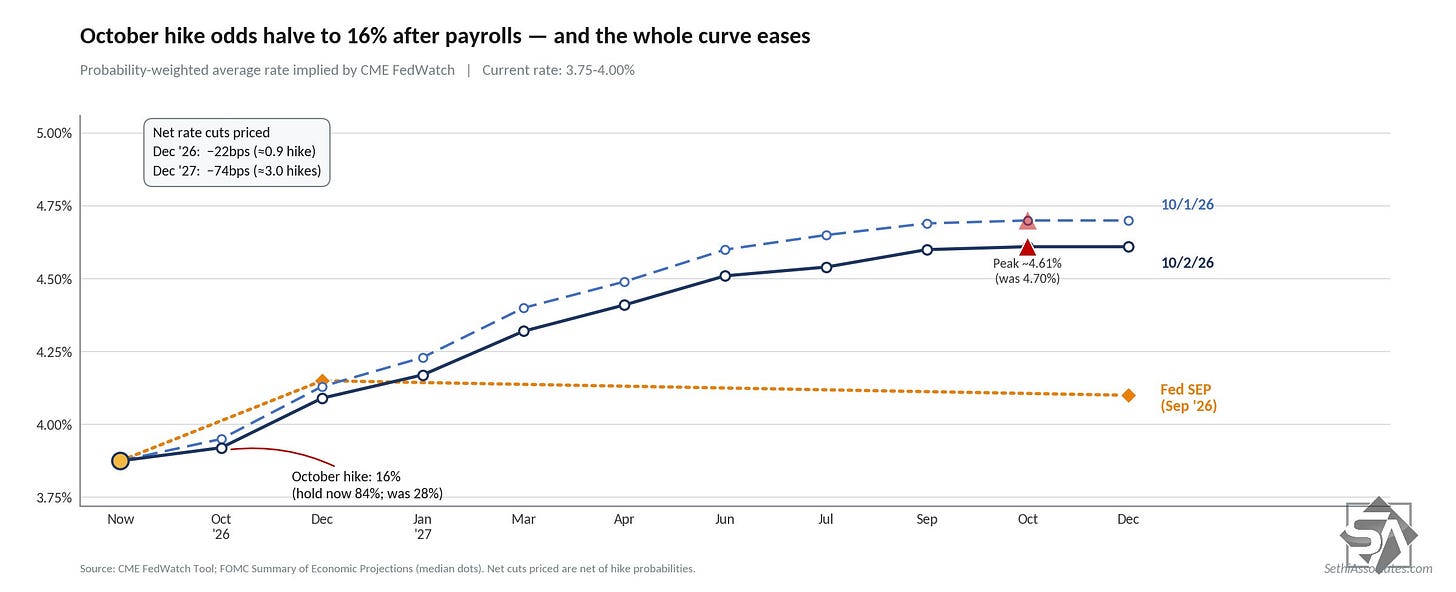
Following NFP, pricing for an October FOMC hike fell to 16% (from 28% Thursday) with a 2026 hike now down to 75% or 22 basis points priced. 2027 also softened with now less than three hikes (total) priced from here through the end of next year (74bps vs 82). Since then, though, the 2027 rate hike bets have been put back in while October remains at just 20%.
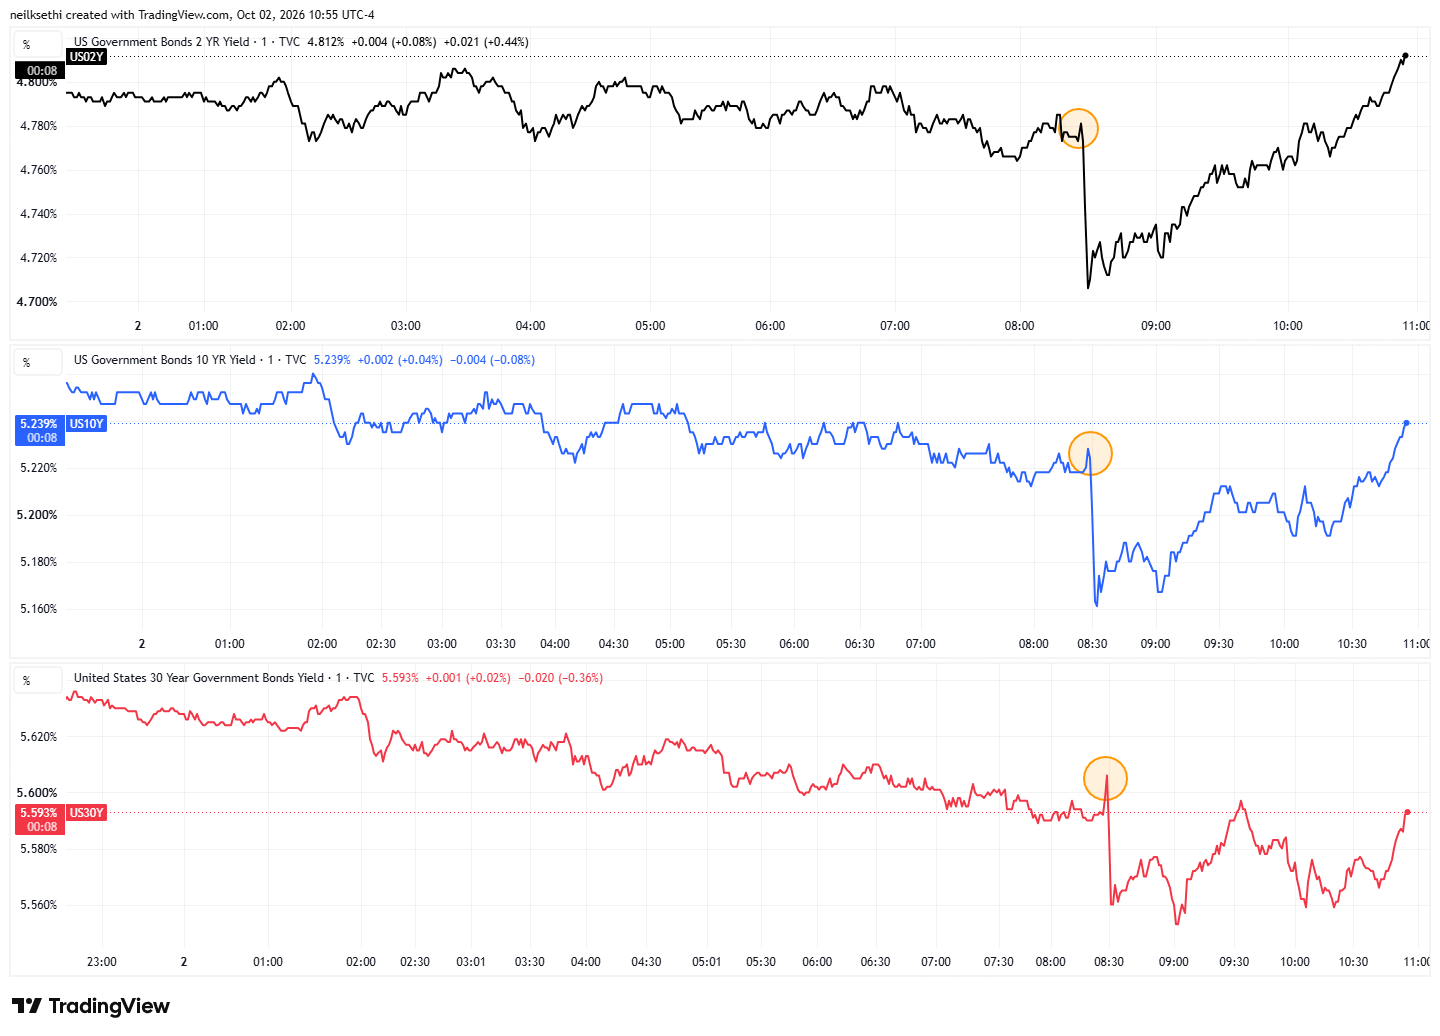
That initial drop in Fed rate hike expectations pulled the 2-year yield down about 8 basis points but since then the market has recovered all of that (top panel) and is actually trading higher (in yield). The 10-year also has recovered all of its initial about 8 basis point drop, and the 30-year is lower by just one basis point.
Analyst Reactions
- Bloomberg Economics: “The labor market is stuck in low-hiring mode, and the drivers of job growth are shifting. Education, which typically provides a big September boost, turned to a drag as state and local governments face a budgetary squeeze. Meanwhile, trade, transportation and utilities are showing signs of improvement after a prolonged downturn. That mix — along with our early tracking of cooler September core CPI — doesn’t strengthen the case for another rate hike. We continue to expect the Fed to hold rates steady for the rest of the year.” — Anna Wong
- Thomas Simons, chief US economist at Jefferies: “For the Fed, this number should be the nail in the coffin for an October hike. … It now looks more likely that the policymakers emphasizing that they have some more time before another hike is needed will remain patient.”
- Adam Schickling, senior economist at Vanguard: “Hiring is subdued, layoffs remain remarkably low, and month-to-month payroll figures are likely to keep sending mixed signals. The underlying story is still a low-hire, low-fire labor market. … This report strengthens the case for the Federal Reserve to remain patient.”
- Christopher Hodge, Natixis: “This data won’t shift the broader decision making calculus for the Fed as inflation remains the supreme concern, but with wages lower and the jobs picture a bit less rosy, it certainly decreases the urgency to hike in October.”
- Ira Jersey, chief US interest-rate strategist at Bloomberg Intelligence: “When unemployment rises due to higher participation rate, it’s good because the workforce grew, but the tepid job growth makes a Fed October pause much more likely.”
- Will Hoffman, Bloomberg Intelligence: “The miss in this morning’s labor data is eroding near-term rate-hike odds. With now only 4 bps of hikes priced for the October meeting, and 22 bps priced for December, the ‘no urgency’ stance of recent Fed speak will likely be reflected in short rates until data shifts the macro picture again.”
- Ian Lyngen, head of US interest rate strategy at BMO Capital Markets: “Treasuries were richer ahead of the data, and the market has subsequently rallied further. The front-end (2s/3s) of the curve is leading the move as it is clearly a monetary policy story.”
- ZeroHedge: “Overall, this was a mixed report, with the Household Survey painting a much stronger picture than Establishment (hence unemployment rate higher).”
- From the WSJ:
- “Weaker payrolls, softer wage growth and a higher unemployment rate all point to a labor market that’s cooling rather than reaccelerating. That should take some steam out of Treasury yields and reduce the urgency for the Fed to act,” said Seema Shah, chief global strategist at Principal Asset Management.
- “The unemployment rate ticking up to 4.2% warrants close attention, as rising joblessness in tandem with softer hiring could signal that the Fed’s tightening cycle may at some point constrain economic activity more meaningfully than anticipated,” said Jerry Tempelman, VP of economic and fixed income research at Mutual of America Capital Management.
- “This is the low-hire, low-fire labor market we have been talking about…the market treated it as Goldilocks: not too hot, not too cold,” said Ken Mahoney, CEO of Mahoney Asset Management.
- “While the weak payrolls number perhaps creates less urgency for the Fed, inflation remains the primary concern. This has the potential to slow down the pace of Fed rates hikes, but higher rates remains the broad theme,” said Larry Holzenthaler, senior portfolio manager at Catalyst Funds.
- “The labor market is simmering, not boiling,” said Jeff Schulze, head investment strategist at the Franklin Templeton Institute.
