Invest in Nike? Only With Your Money.
Bottom fishers beware. Same old Nike.
You've reached your free article limit
You've read 0 of 1 free Pro articles.
When will the shares of Nike (NKE) return the company to its former glory? Good question.
Not soon is my tale from last night’s earnings release. Let’s explore.
For Nike’s fiscal first quarter, the company posted GAAP EPS of $0.48 on revenue of $11.213 billion. While the bottom-line result actually did beat expectations, the top-line number not only fell short of consensus, but reflected a year-over-year decline of 4.2%.
This was the seventh quarter in the past ten where Nike posted negative sales “growth” from the comparable period a year prior. This was also the twelfth consecutive quarter where Nike posted sales growth of 2% or less.
CEO Elliott Hill commented in the press release, “The Sport Offense is driving measurable progress across our performance business, and we introduced Pace to help us accelerate and scale that momentum across NIKE. We have more work to do in NIKE Sportswear, Jordan Brand and Greater China, and we’re taking deliberate actions to strengthen those businesses the right way for the long-term.”
Wait. What? That doesn’t sound very confident. Sounds like a word salad placed in the release because there had to be a comment.
CFO Dave Denton also commented, “We delivered first quarter results consistent with our expectations, supported by improved gross margin and disciplined cost management. As we move forward, we remain focused on strengthening the health of our product portfolio, improving productivity across the enterprise and allocating resources with discipline to support long-term shareholder value.”
At least Denton’s commentary is readable. Still sounds like he was forced to write something, but it is readable.
Operations
As sales decreased by 4.2% to $11.213 billion, the cost of sales decreased 5% to $6.415 billion. This left a gross profit of $4.798 billion (-3%) as gross margin improved to 42.8% from 42.2%. Operating expenses increased, however, as a percentage of revenue, to 34.9% from 34.3%. That left EBIT (earnings before interest & taxes), which is Nike’s measure for operating income, at $907 million, up from $904 million. EBIT margin improved to 8.1% from 7.7%.
Once interest, other income & expenses and taxes are accounted for, Nike’s GAAP net income for the period printed at $712 million, down from $727 million. This works out to $0.48 per fully diluted share, down from $0.49 for the year-ago comparison.
Division Sales Performance
– North America generated revenue of $5.127 billion (+2%).
– Europe, Middle East & Africa generated revenue of $3.176 billion (-5%).
– Greater China generated revenue of $1.18 billion (-22%, -26% in constant currency).
– Asia Pacific & Latin America generated revenue of $1.463 billion (-2%, +/-0% in cc).
Brand Sales Performance
– Nike generated revenue of $10.952 billion (-4%).
– Converse generated revenue of $263 million (-28%).
Nike Branded Business Unit Performance
– Footwear generated revenue of $6.951 billion (-6%).
– Apparel generated revenue of $3.384 billion (+2%).
– Equipment generated revenue of $611 million (-3%).
Guidance
For the full fiscal year, Nike is projecting a contraction in revenue generated in the high-single digits in percentage terms.
The company also took its projection for full-year adjusted earnings per share well below what Wall Street was looking for. Nike sees adjusted EPS of $1.15 to $1.35. The Street was expecting to see something close to $1.67.
This guidance is beyond ugly.
Balance Sheet
Nike ended the period with a cash position of $8.368 billion and inventories of $7.846 billion. That put current assets at $23.673 billion. Current liabilities add up to $11.409 billion, which includes $2 billion in debt maturing within a year. That puts its current and quick ratios at 2.07 and 1.39, respectively, which is still quite healthy.
Total assets amount to $37.794 billion, very little of which is labeled as intangible. Total liabilities less equity comes to $22.574 billion. This includes long-term debt of $5.893 billion. The fact is that Nike can cover its entire debt load out of cash.
This is still a very solid balance sheet.
My Opinion
I do like the balance sheet. Nike does have a strong balance sheet even if it is not quite as strong as it was a year ago. Beyond that, there is very little here for investors to get behind. Margins are higher? Oh, boy. Sales and profits are both lower. The Nike brand is in steep decline.
Cash flows? Who knows? Nike is one of the few firms of this size that doesn’t bother to publish a Statement of Cash Flows with their earnings release. Maybe they are hoping that Wall Street isn’t looking when it files it. The press release did include this beauty… “Cash generated by operations was more than offset by cash dividends and capital expenditures.” Oh joy. How about that guidance?
This corporate execution is about as weak as it gets in large-cap corporate America. I might invest in Nike. With your money. If you stole my girlfriend and I hated your guts. With my money? I’d rather blow it on bubble gum and baseball cards.
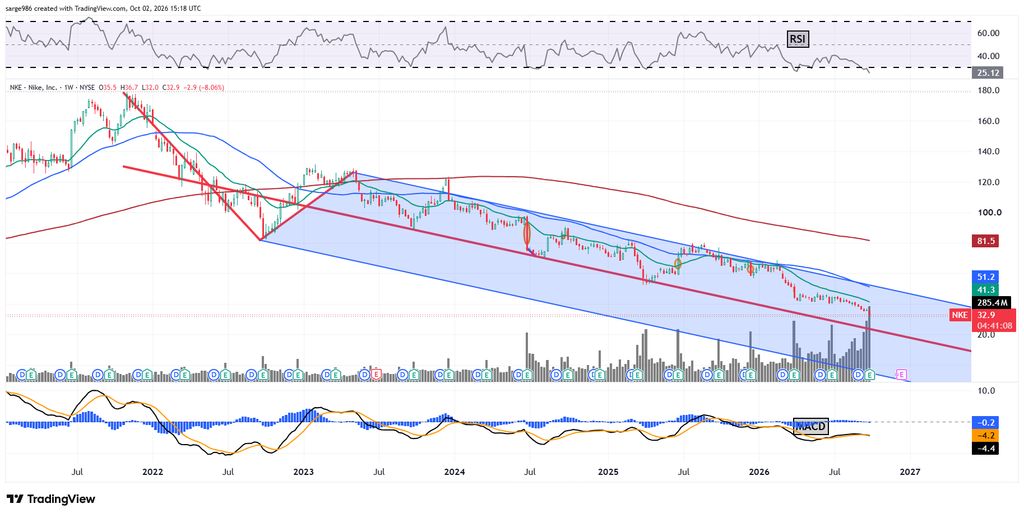
The above weekly chart of NKE displays a Schiff Pitchfork model that shows the five years of heck that shareholders of this stock have been through. Pretty much the past four years fit very neatly into a downward trend that has offered no hope of escape.
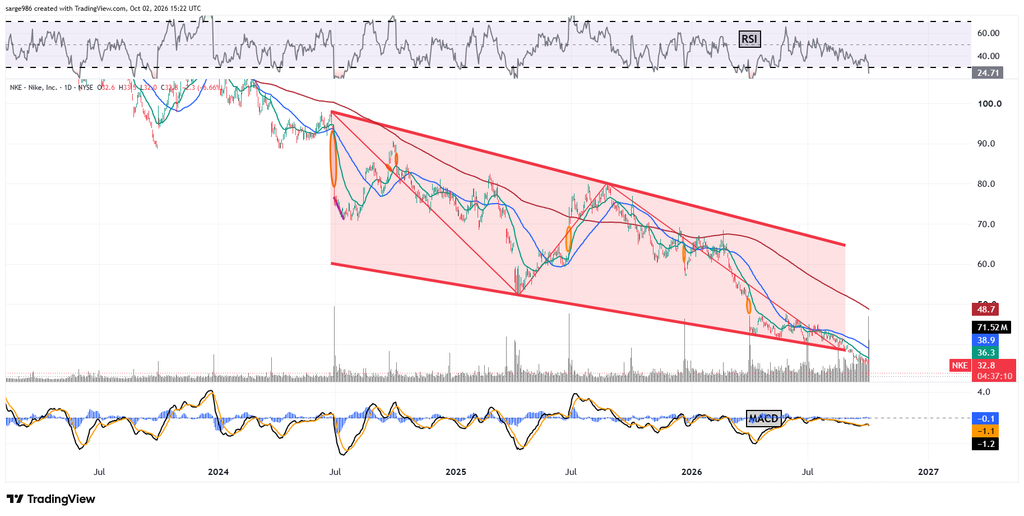
On the daily chart, NKE has what looks to be a Falling Wedge in place for more than two years now. That’s a pattern of bullish reversal. Usually. Look where the stock is. At the bottom trend line. As we know, patterns that produce wrong-way breakouts often do so with extreme violence.
Bottom fishers beware. I would wait until support had been established if I were you. I am not you.
At the time of publication, Guilfoyle had no positions in any securities mentioned.
