Flat Durable Goods Orders Mask Robust Business CapEx
A drop in transportation orders offset another month of strong core orders.
You've reached your free article limit
You've read 0 of 1 free Pro articles.
- US Durable Goods Orders (M/M) Aug P: -0.02% (est -0.3%; prev 1.1%; prev R +0.86%)
- Durables Ex-Transportation (M/M): +0.31% (est 0.6%; prev R +0.70%)
- Cap Goods Orders Nondef Ex Air (M/M): +1.59% (est 0.6%; prev R +0.59%)
- Cap Goods Ship Nondef Ex Air (M/M): +0.58% (est 0.8%; prev R +1.43%
- Headline durable goods orders were essentially unchanged in August at -0.02%, better than the -0.3% decline expected, after an upwardly revised +0.86% in July. They are up +8.48% year-over-year.
- The flat headline was due to transportation, which fell -0.65%: nondefense aircraft (mostly Boeing orders) dropped -4.30% after a +12.00% July jump and are -19.55% year-over-year, while motor vehicles slipped -0.59%, the largest drop since April 2025.
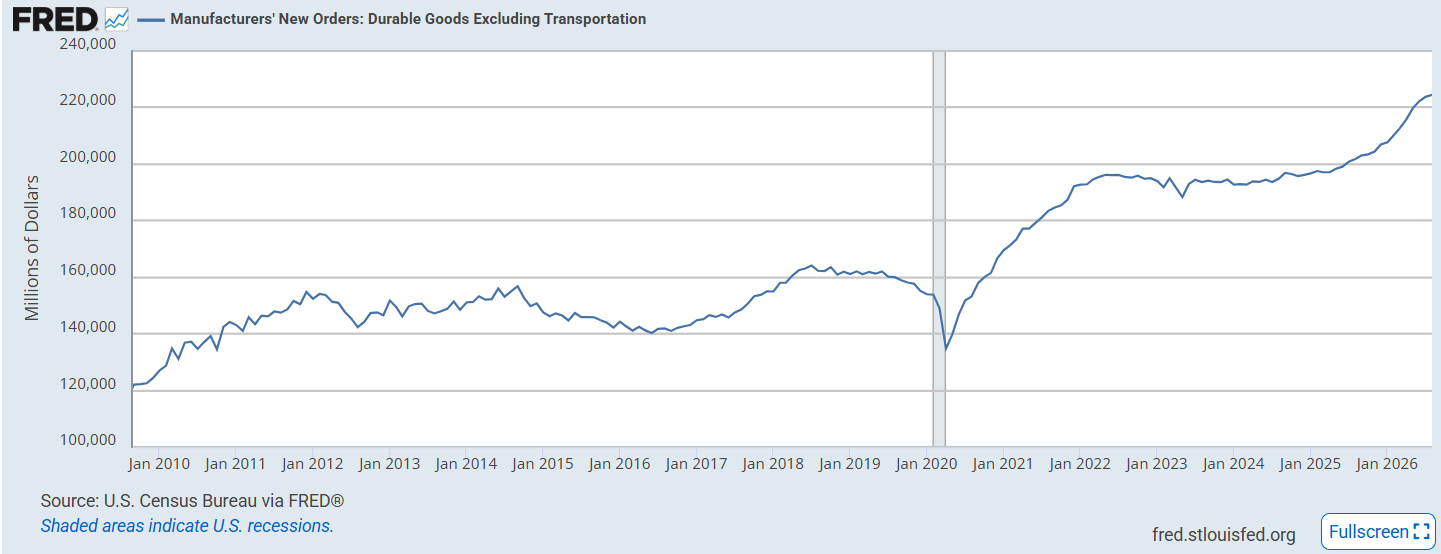
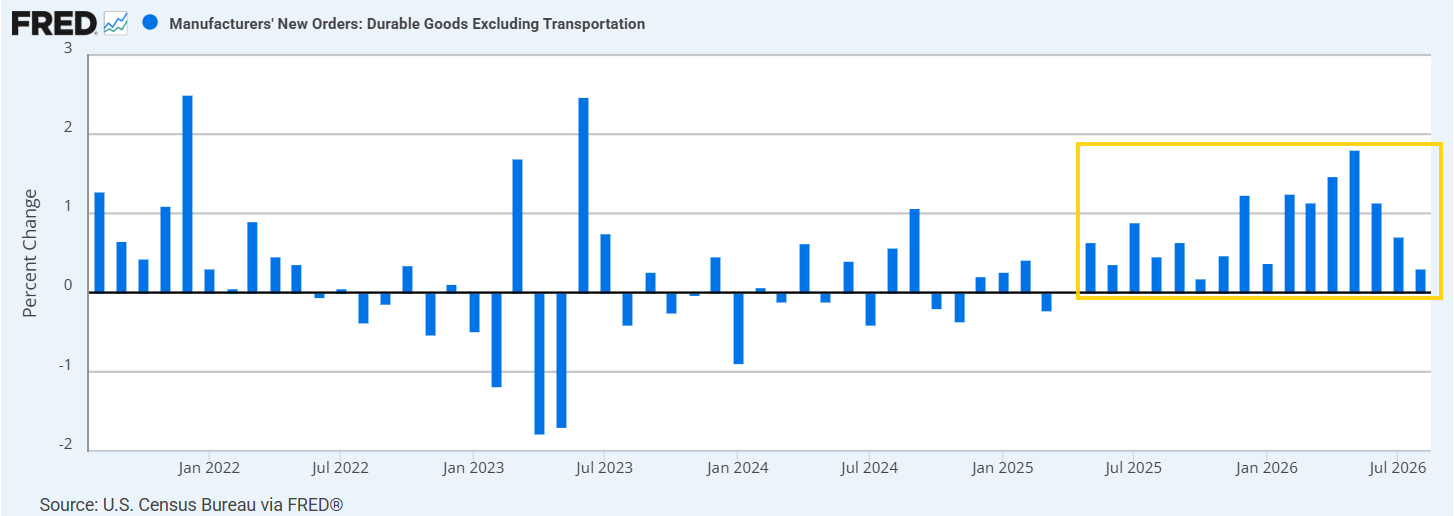
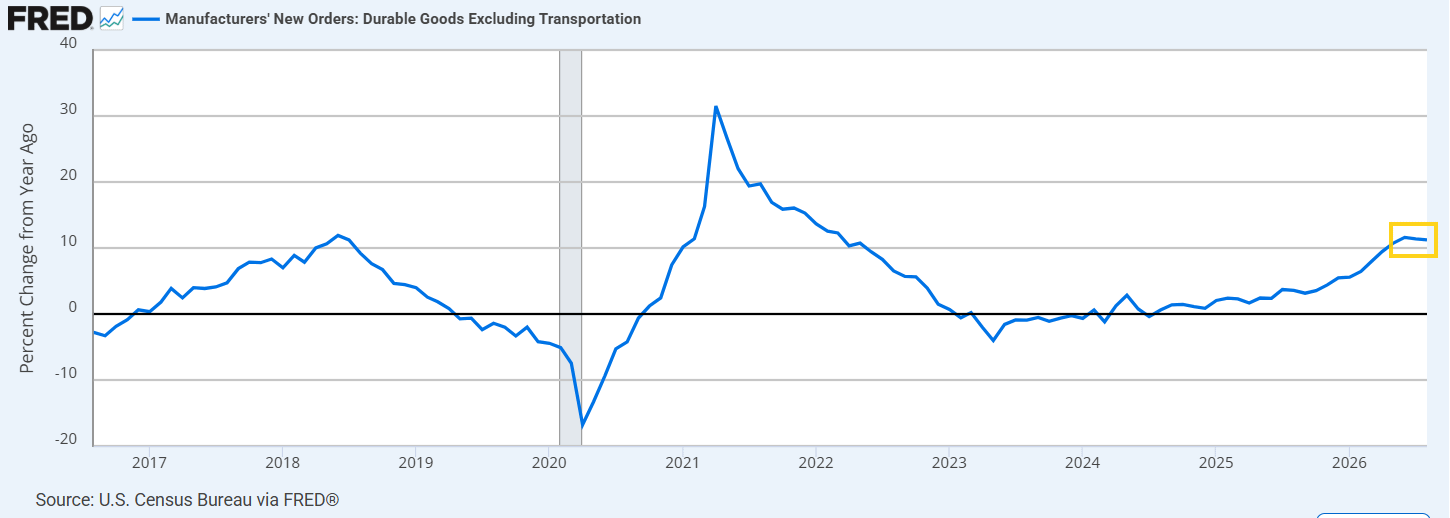
- Orders excluding transportation rose +0.31%, half the +0.6% expected, but that is a 17th consecutive monthly increase, leaving them up +11.2% year-over-year and at an all-time high.
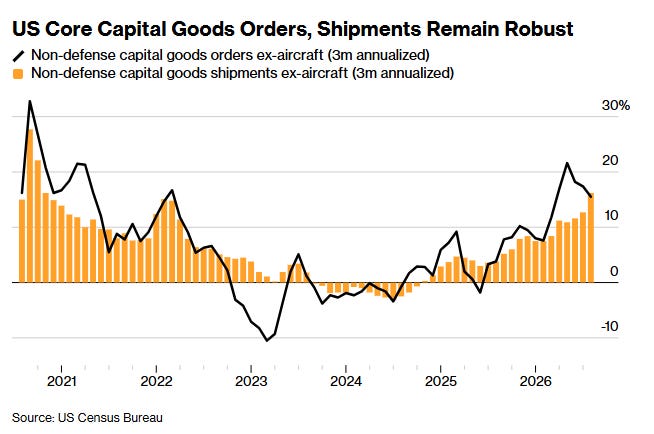
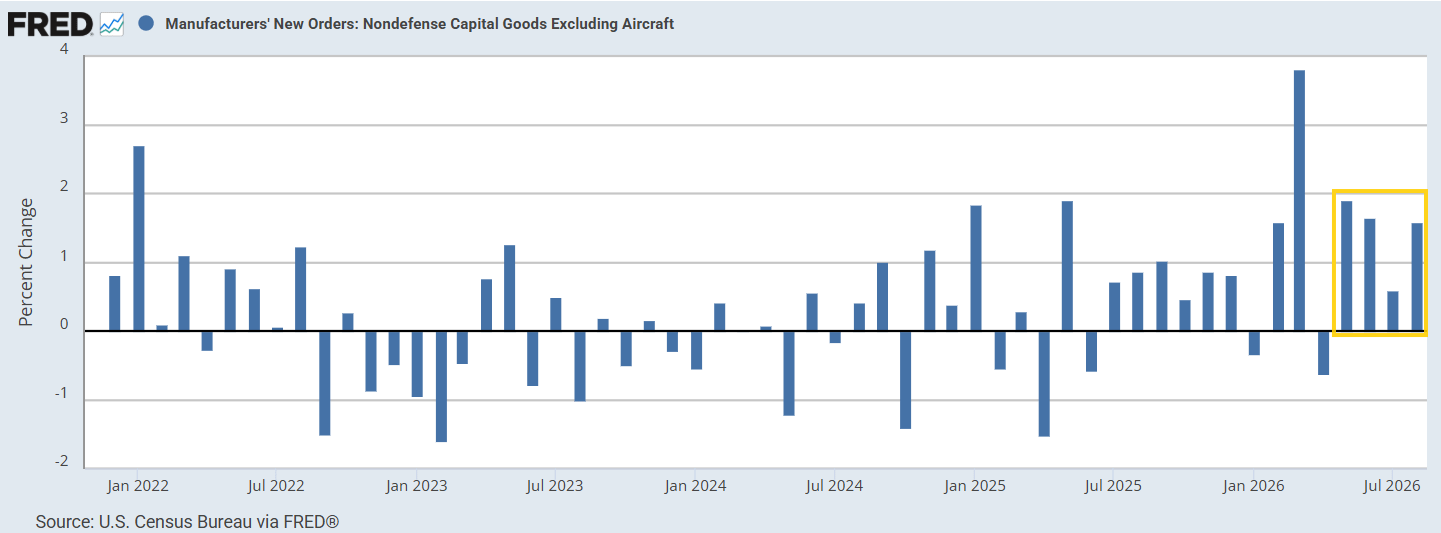
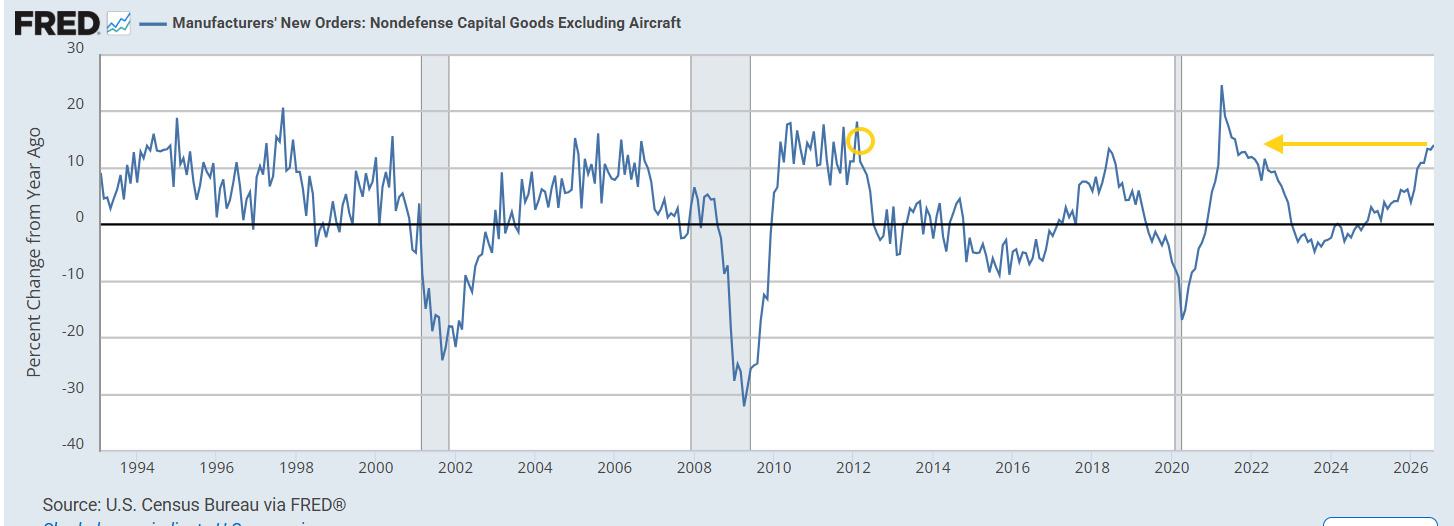
- Core capital goods orders — excluding aircraft and defense, a proxy for business capital expenditure plans — rose +1.59%, nearly triple the +0.6% expected, and are up +14.09% year-over-year, the strongest since August 2021.
- Core capital goods shipments, which feed the equipment investment line of gross domestic product, rose +0.58% versus +0.8% expected, but July was revised up to +1.43%. That is a seventh straight monthly gain, up +11.39% year-over-year, the best since February 2022, and at an all-time high.
- Backlogs rose +0.61% to $1.61 trillion, a 17th straight monthly increase and an all-time high, up +8.8% year-over-year — and up +0.87% excluding transportation, so not just Boeing.
Headline durable goods orders (goods meant to last longer than three years) are very noisy because of the outsized impact aircraft orders (both non-defense (mostly Boeing) and defense) have given their size, and was the story in August — the headline went nowhere, masking gains underneath. The data are from the Census Bureau’s advance report. Figures are seasonally adjusted but not adjusted for inflation.
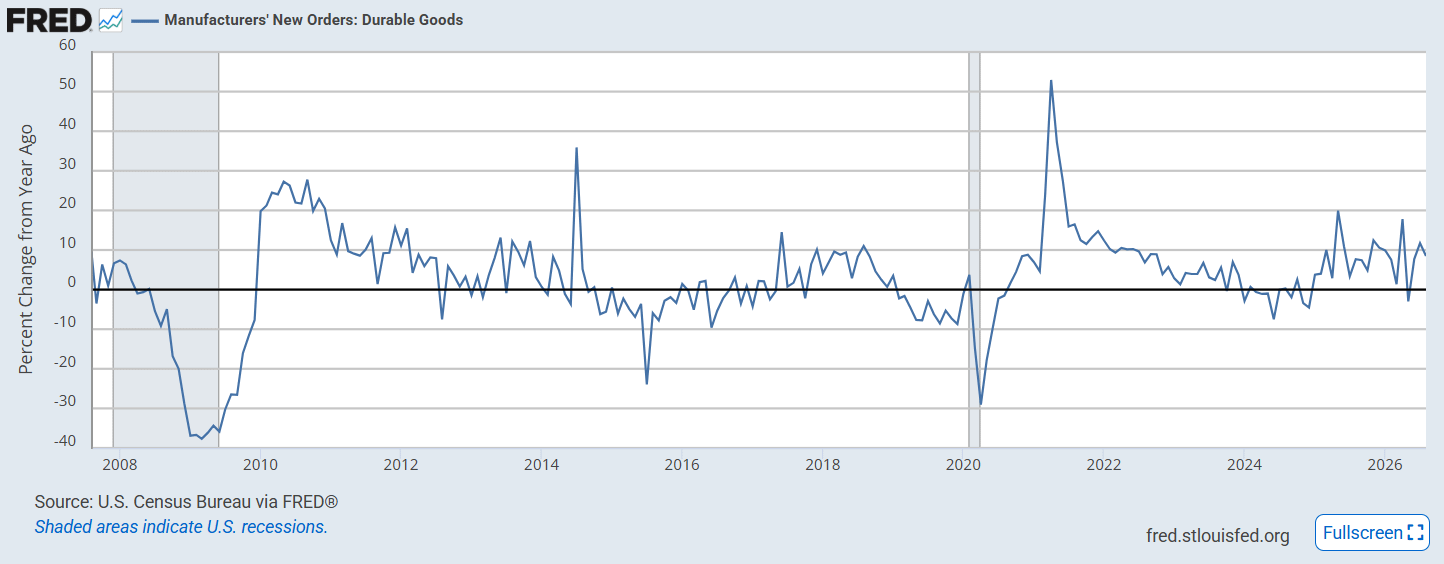
New orders were essentially unchanged in August at -0.02%, better than the -0.3% decline expected, after an upwardly revised +0.86% in July.
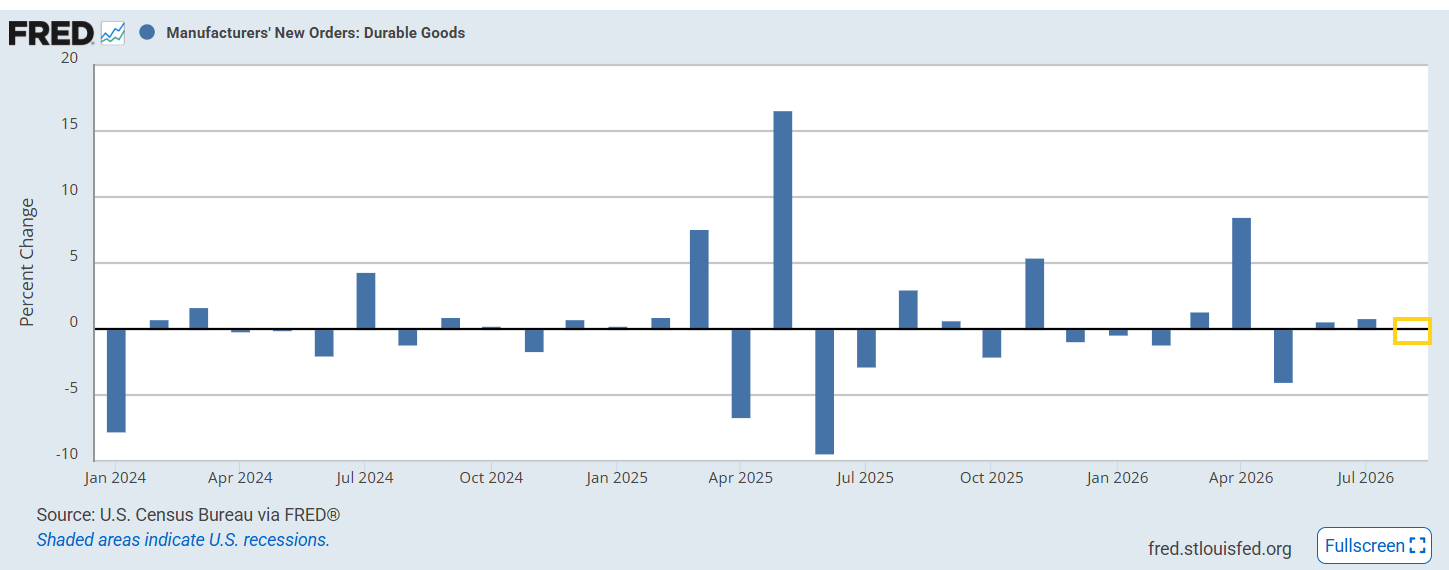
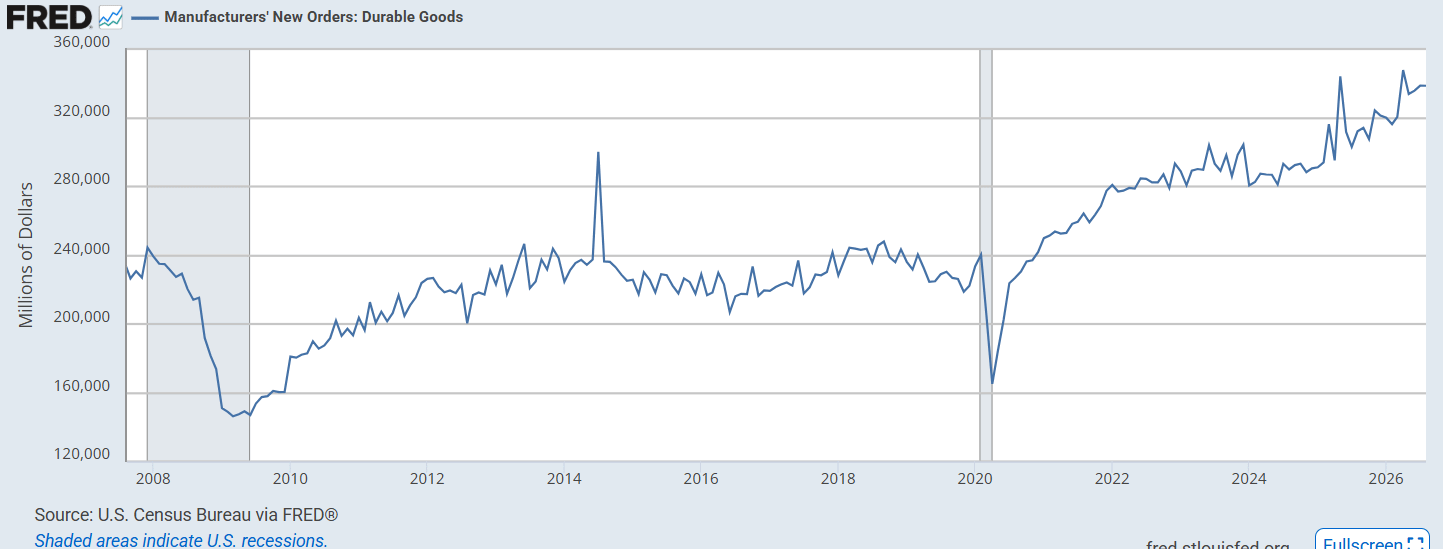
They are up +8.48% y/y.
Headline shipments (which are more often looked at by economists as they strip out noise from cancelled or otherwise unfulfilled orders and also due to the very long lead times for many durable goods) fell -0.22% after +0.93% in July (FRED doesn’t have advance shipments charts – we’ll get the final numbers next week with the factory orders report that includes nondurable goods, and I will do an update then).
Transportation Drove the Flat Headline
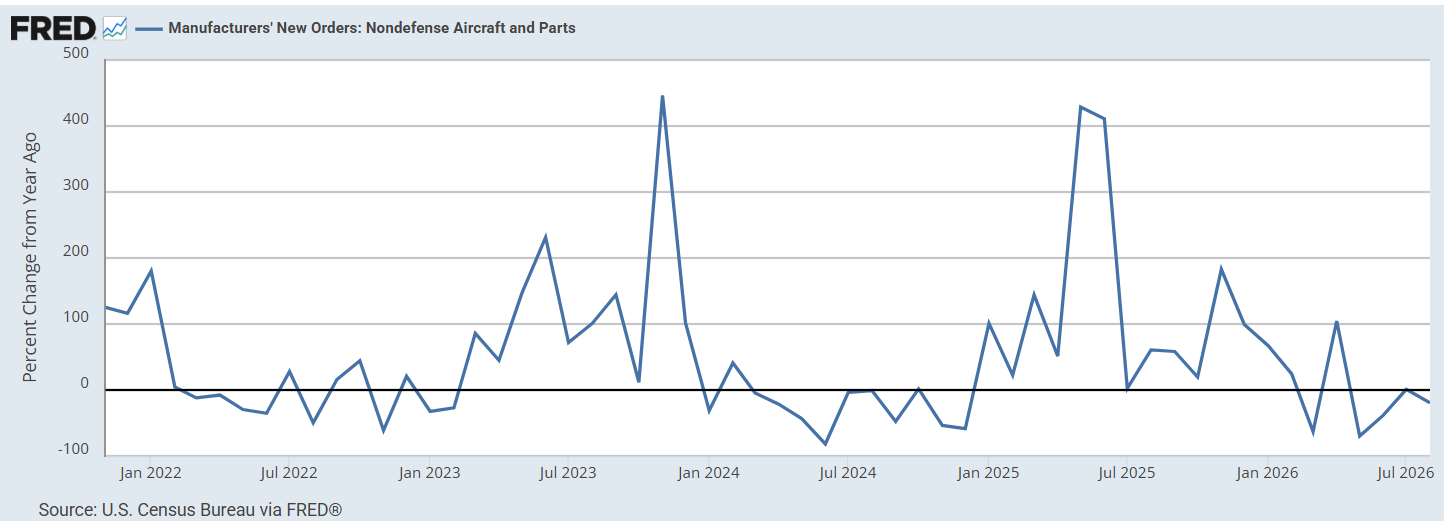
Transportation equipment orders fell -0.65%. Within that, nondefense aircraft and parts — almost entirely Boeing (BA) orders — dropped -4.30% (chart) after a +12.00% jump in July. You can see from the chart how lumpy they are. Defense aircraft and parts rose 5.87%.
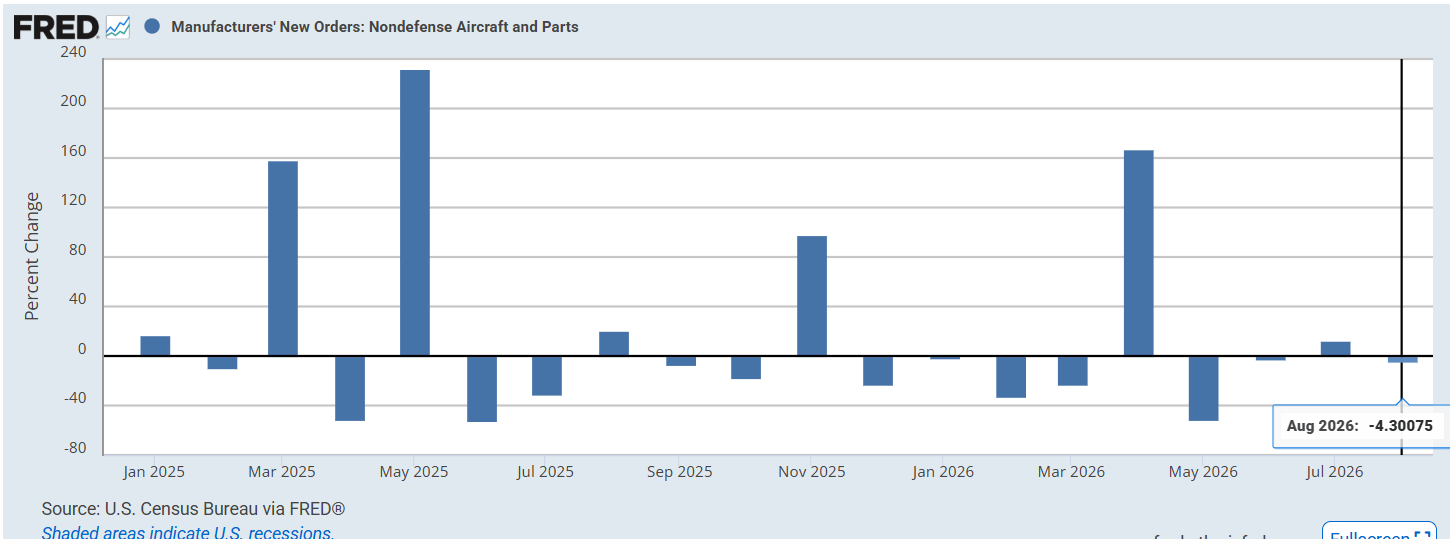
Nondefense aircraft and parts are -19.55% y/y.
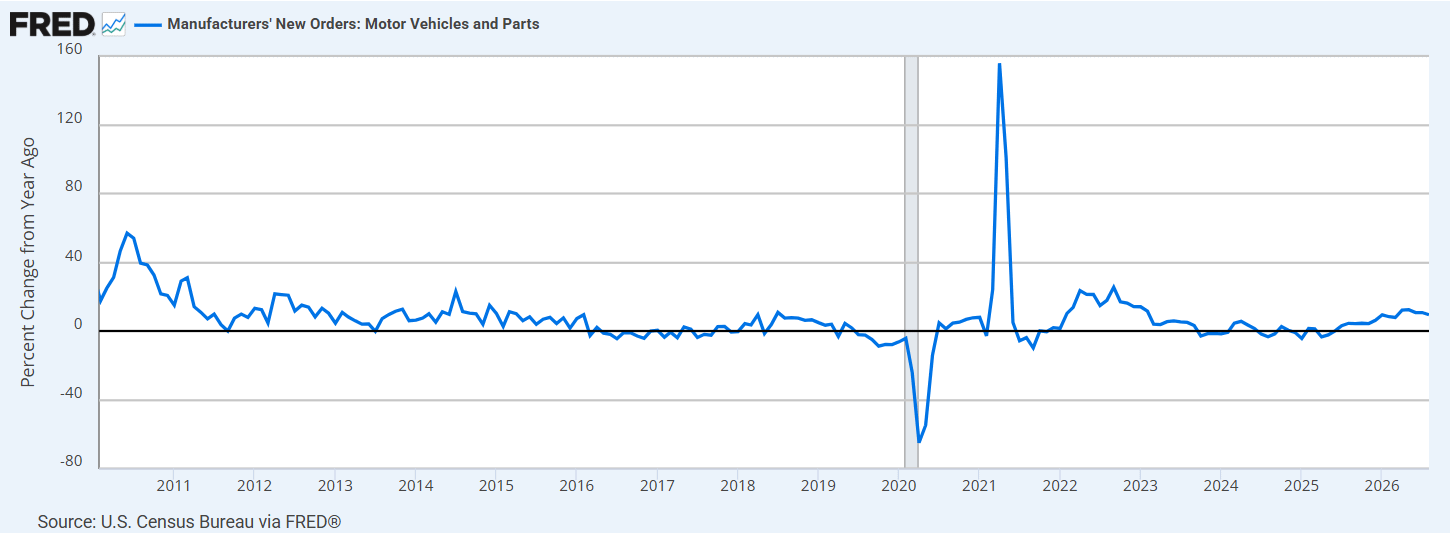
Motor vehicles and parts, the largest component of transportation orders and normally far less volatile, slipped -0.59%, the largest drop since April 2025 (the month of liberation day), after a +0.77% July gain.
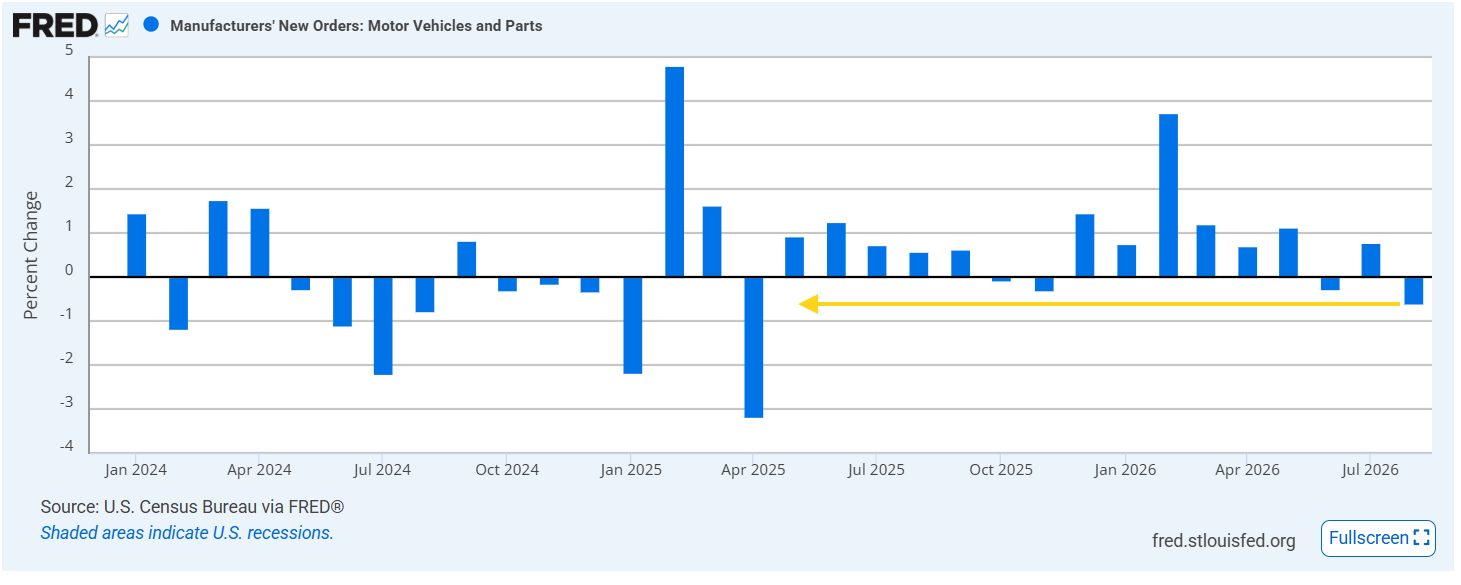
They are +9.45% y/y.
Excluding Transportation, a Softer but Still Positive Read
Orders excluding transportation rose +0.31%, half the +0.6% expected, but after an upwardly revised 0.70% in July. That is the 17th consecutive monthly increase, leaving them up 11.2% year-over-year.
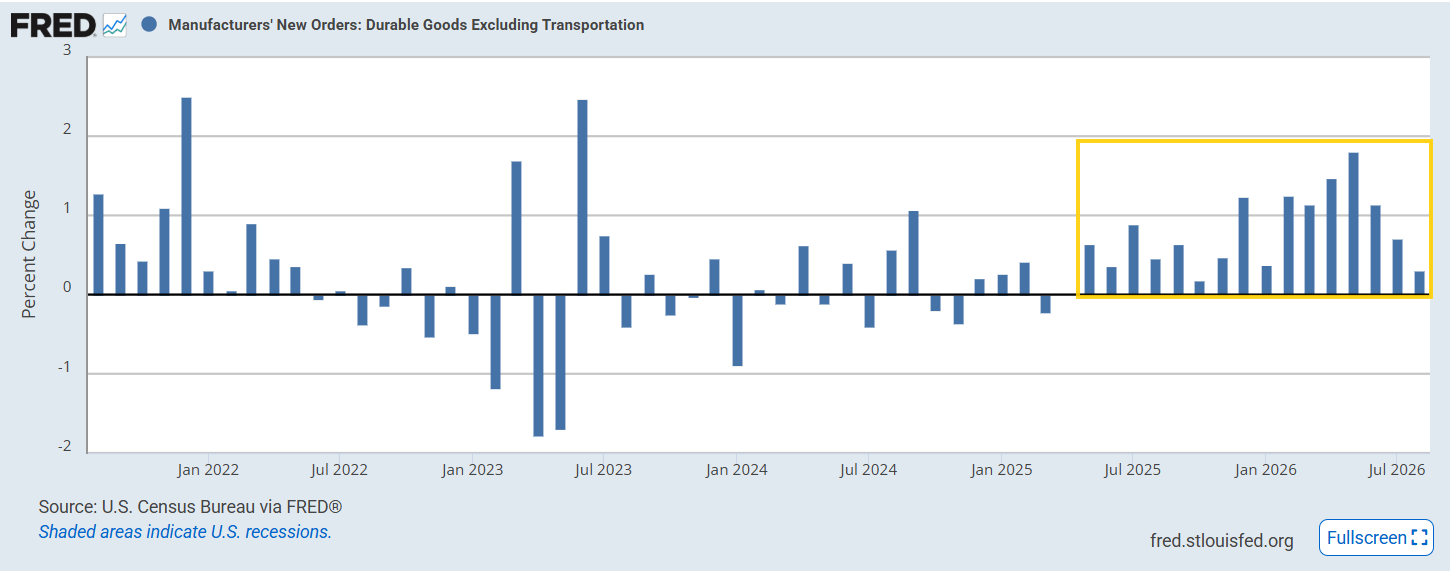
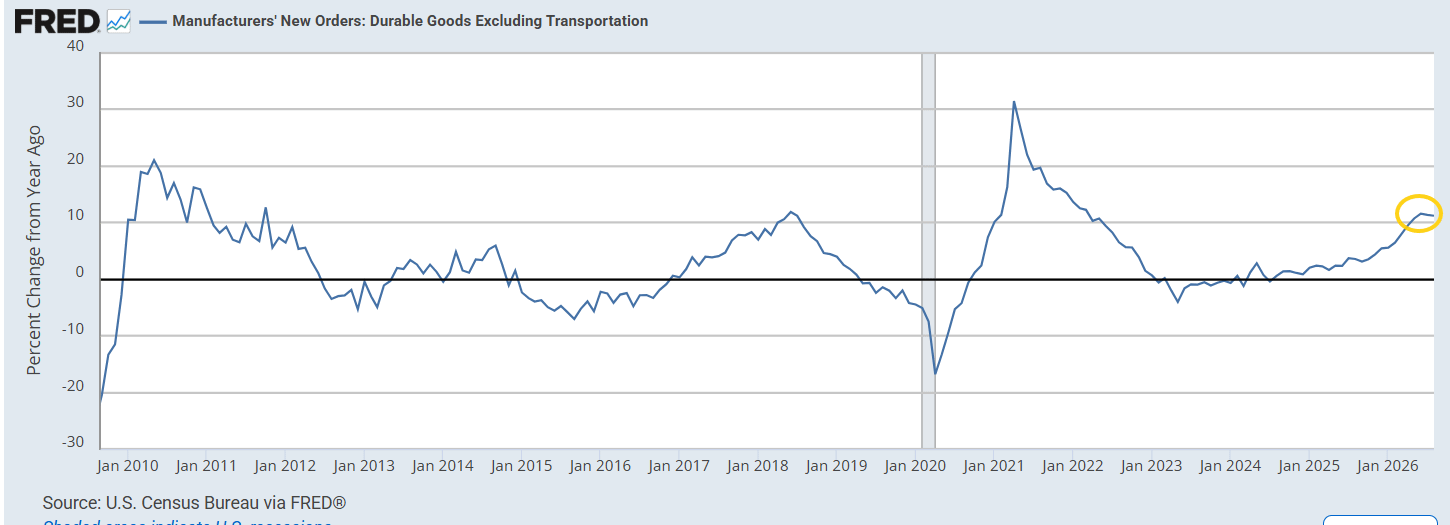
They are at an all-time high.
Core Capital Goods Orders Were the Bigger Story
Strip out aircraft and defense — the two lumpiest categories — and what remains is called core capital goods and is considered a good proxy for business capital expenditure plans.
Here the story was very positive. Core capital goods orders rose +1.59%, nearly triple the 0.6% expected, after an upwardly revised 0.59% gain in July (initially reported as flat). That’s the third month in the last four of capital goods orders at that level or higher.
They are now up a huge +14.09% y/y, the strongest since August 2021 (boosted by fiscal stimulus and price increases). Before that you have to go back to February 2012 for numbers this strong.
Core capital goods shipments, which for the reasons noted earlier are used for GDP purposes — they feed directly into the equipment investment line of the gross domestic product accounts — rose +0.58% less though than the +0.8% expected, but mostly due to an upward revision to July to +1.43% in July (initially +1.2%). That’s the seventh straight month of gains.
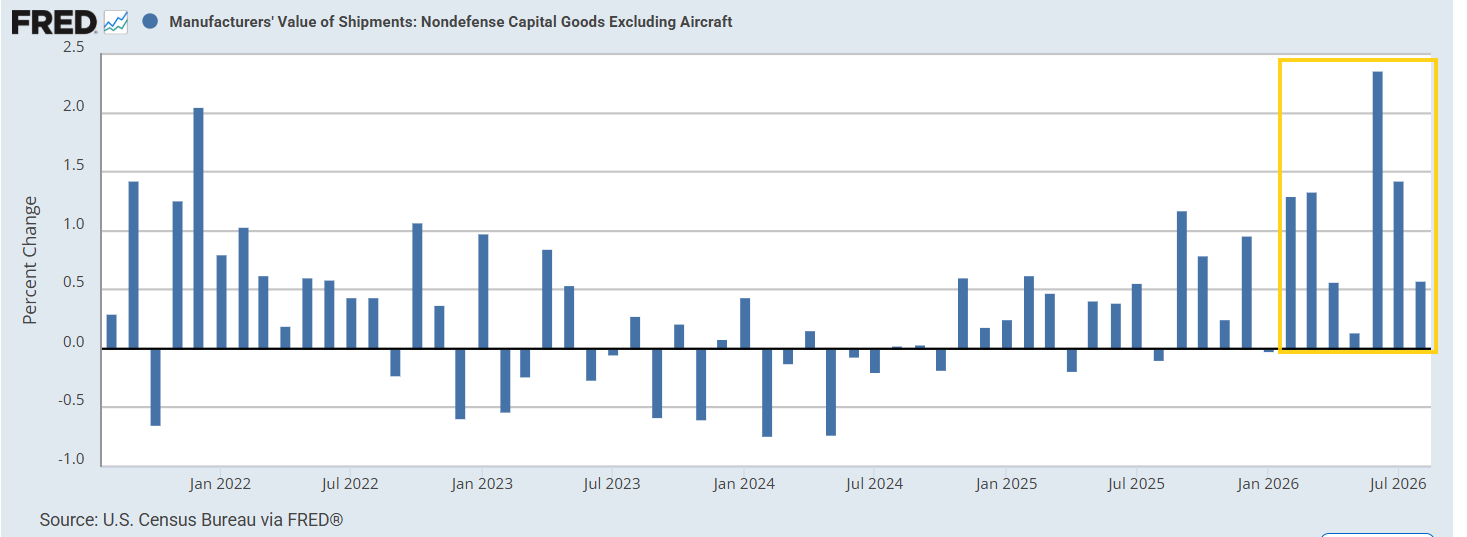
They are up +11.39% y/y the best since February 2022.
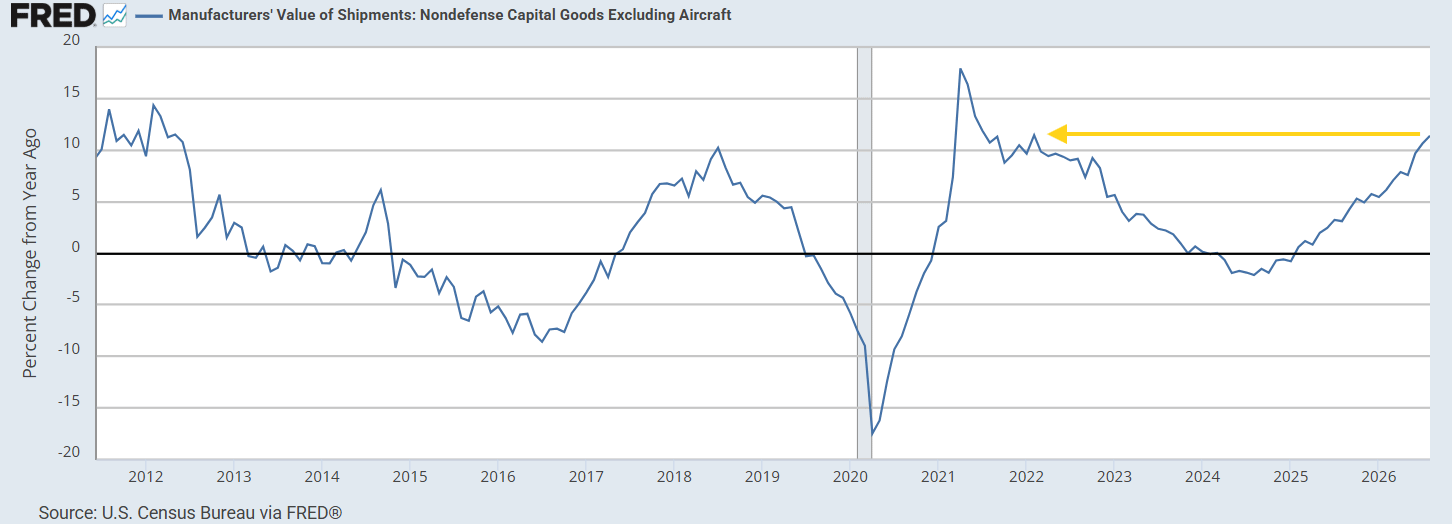
And are easily at an all-time high.
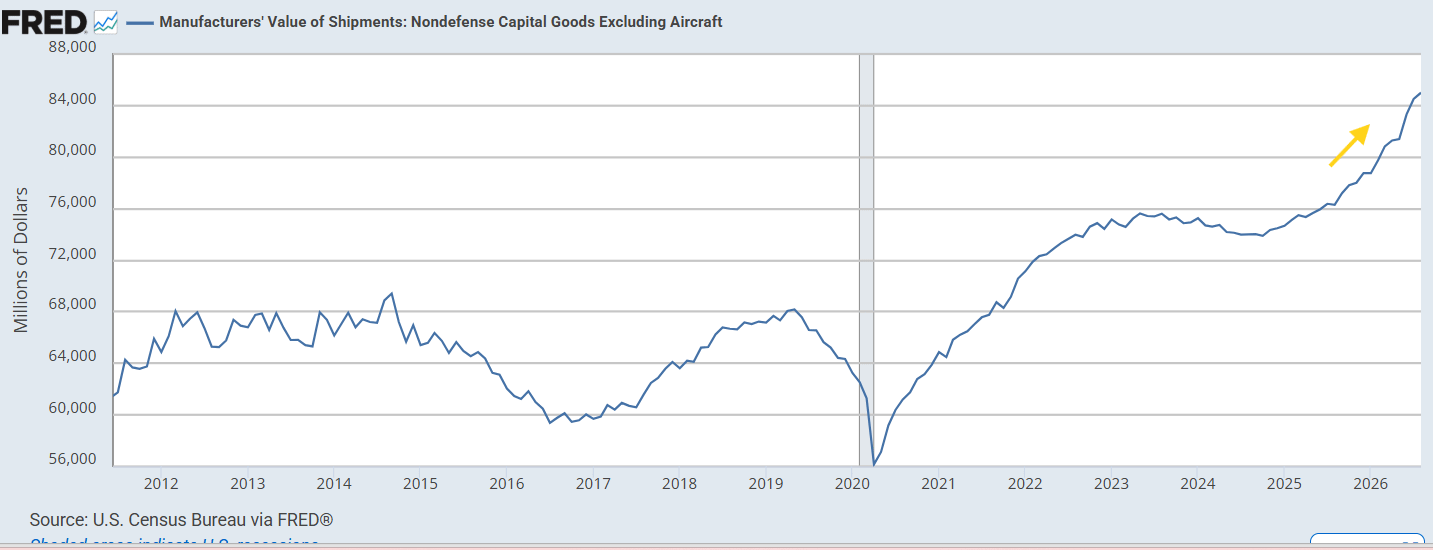
“Core orders and shipments suggest equipment spending will make a solid contribution to third-quarter GDP growth. AI-related spending, alongside a more favorable tax environment, continues to sustain investment momentum.” — Eliza Winger, BBG economist
Leaders and Laggards
Gains were broad outside of transportation. Primary metals rose 1.20%, machinery 1.13%, electrical equipment, appliances and components 1.07%, and computers and related products 1.50%. Communications equipment added 0.31%.
Computers and electronic products as a whole were flat at -0.01%, and fabricated metal products fell 1.32% — the main soft spot outside transportation. Defense capital goods orders declined 1.48%.
Backlogs Keep Building
Unfilled orders rose +0.61%, the 17th straight month of increases, to $1.61 trillion, an all time-high, and are up 8.8% year-over-year.
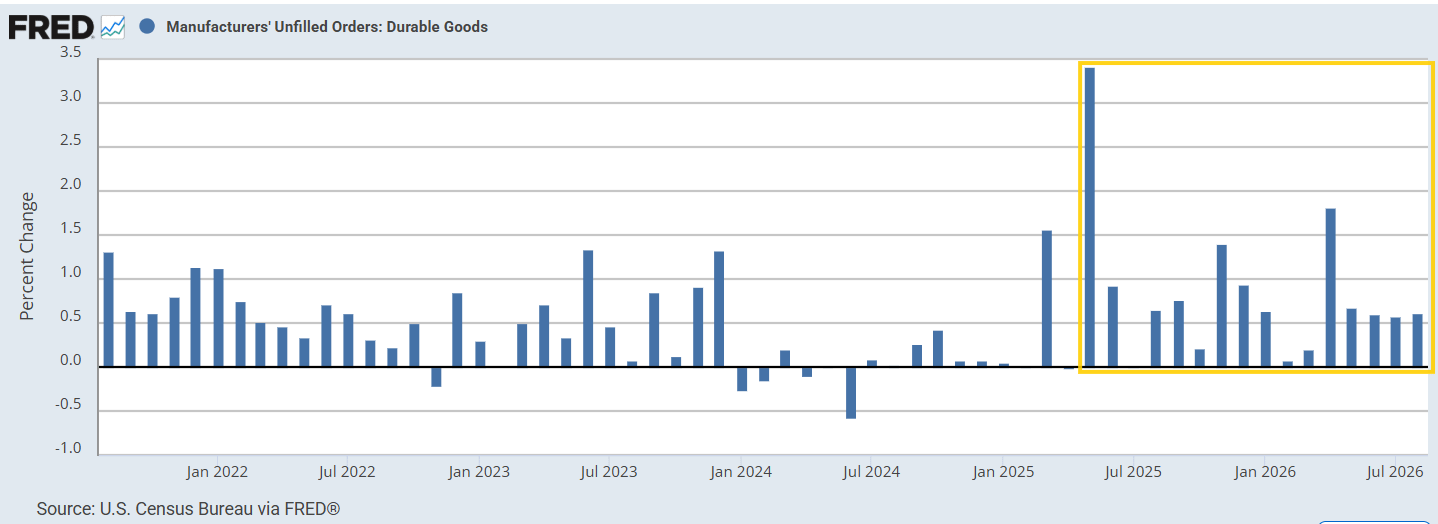
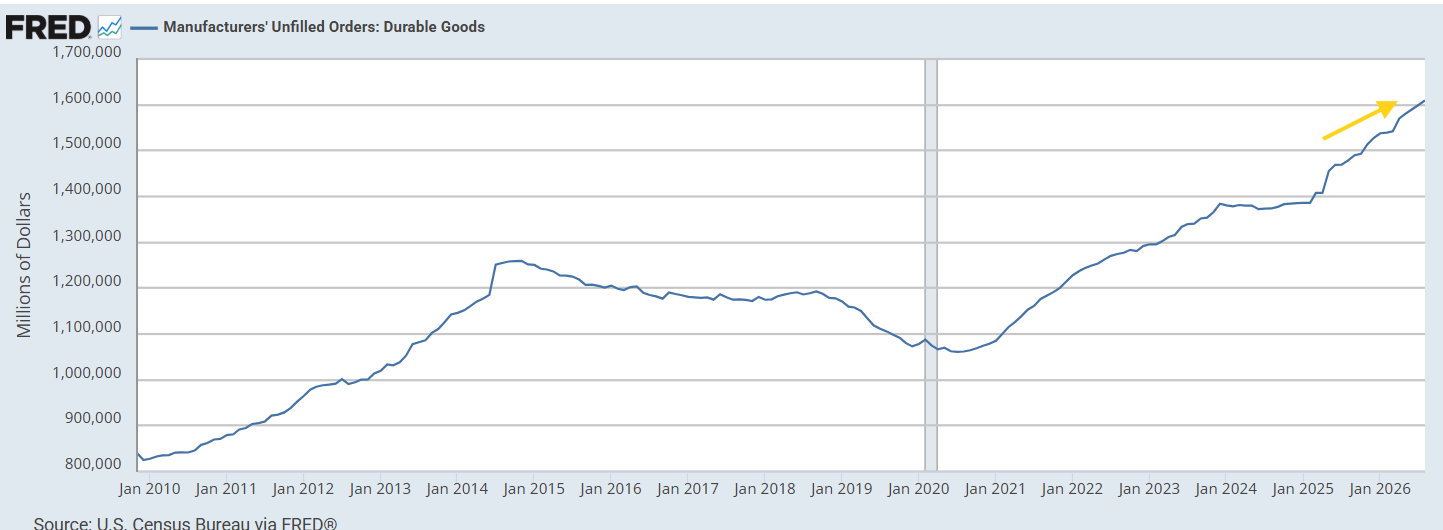
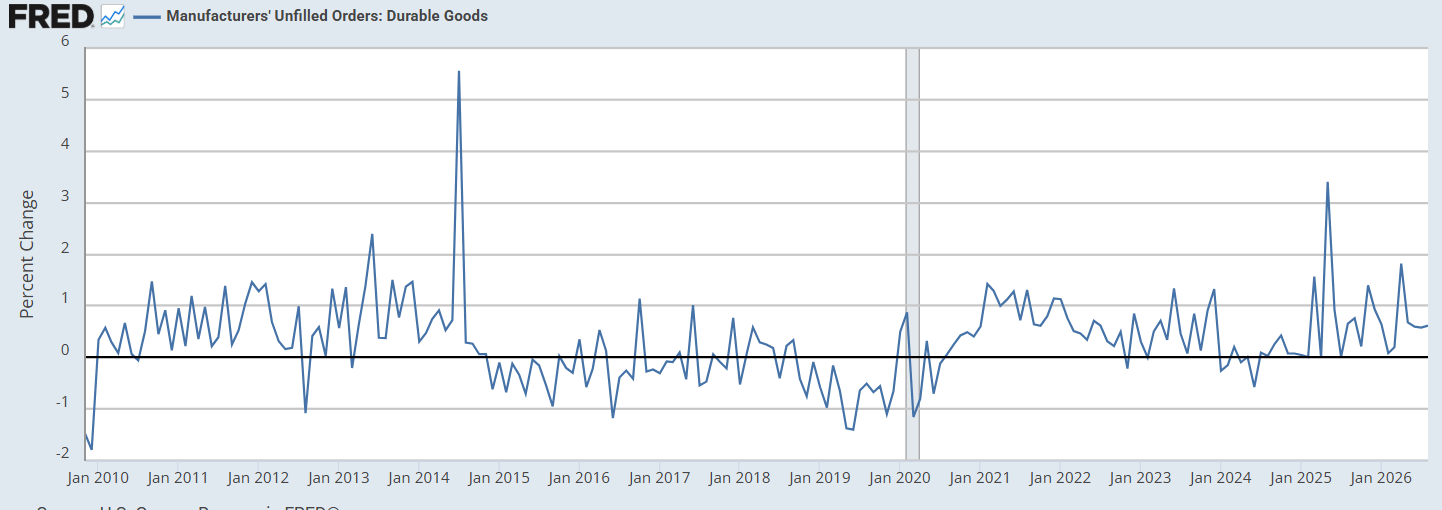
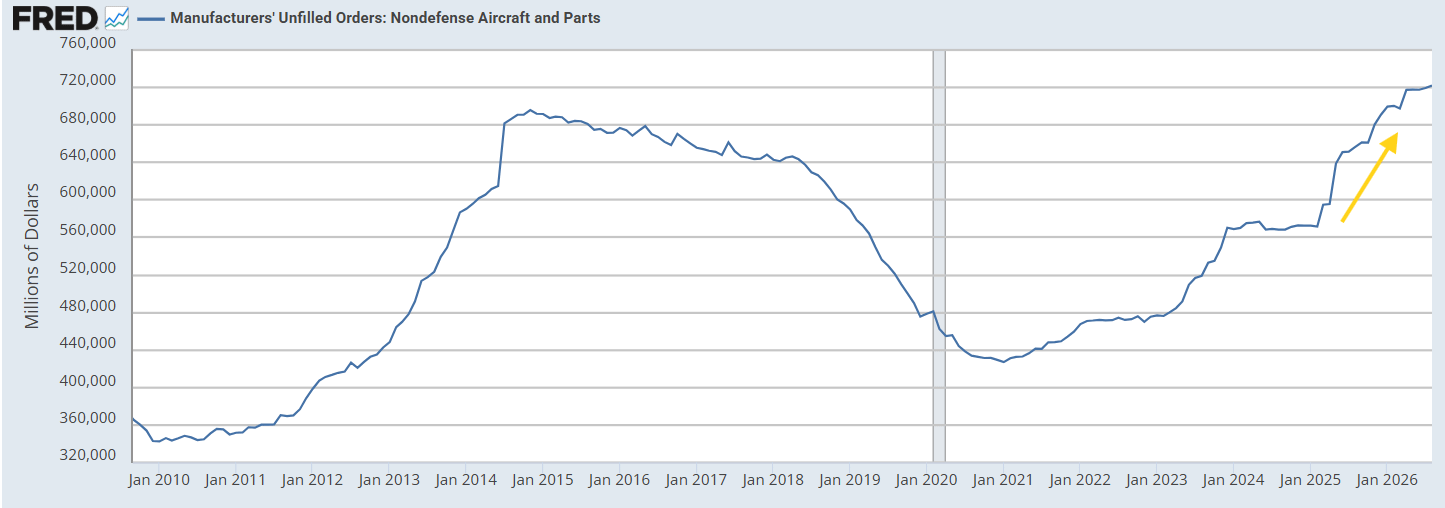
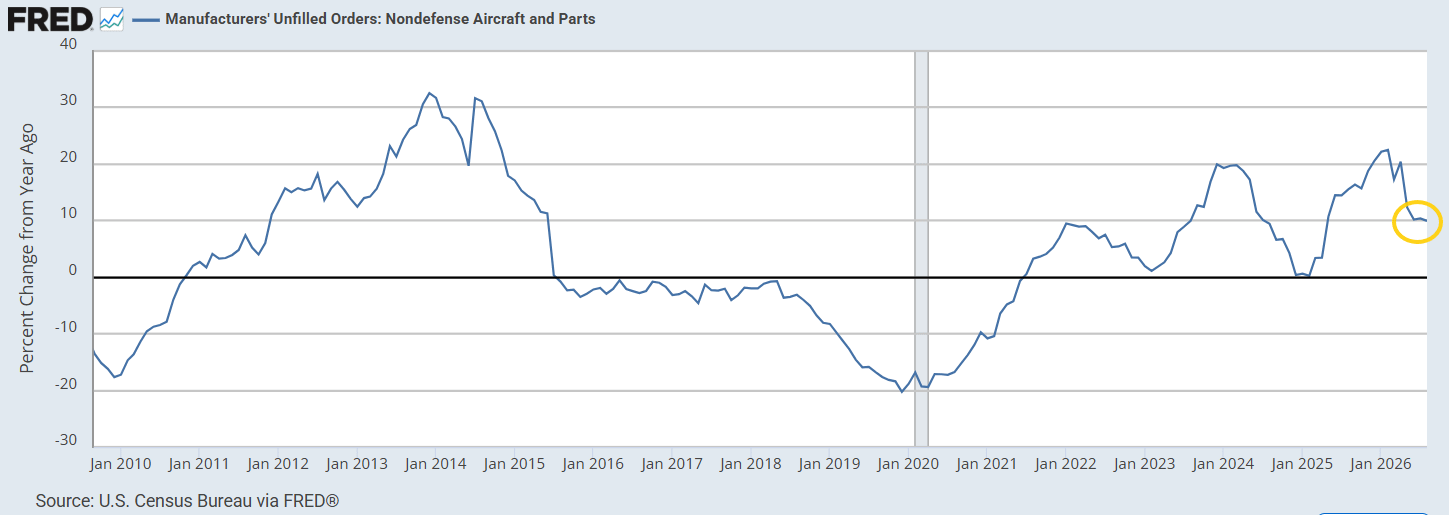
The backlog build is supportive of future production, though a large share of it remains Boeing’s order book — nondefense aircraft backlogs are up 9.9% year-over-year at an all-time high, although the growth has been slowing since peaking in February.
But even excluding transportation, backlogs rose +0.87%, also the 17th month of increases, and are up +7.2%.
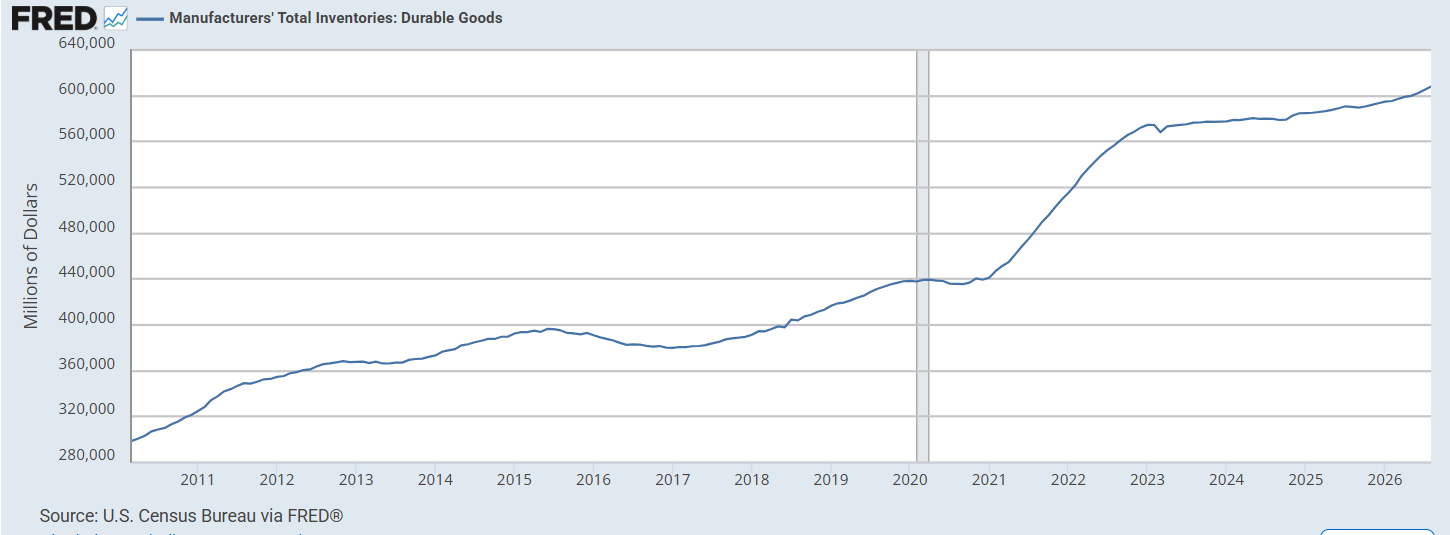
Inventories rose +0.50% m/m and are up +3.0% y/y also at an all-time high.