Weekly Roundup: Waiting for the Market to Show Its Hand
During a volatile week, we updated the Portfolio’s shopping list, and locked in a sizable tech gain.
You've reached your free article limit
You've read 0 of 1 free Pro articles.
The last two weeks of September have a history of being dour ones for the market, but so far that hasn’t been the case despite the rebound in oil prices and 10-year Treasury yields moving beyond the 5% level. While its tempting to put some capital to work and do some shopping, with several unknowns in play, we’re opting to remain on the sidelines for now. Subject to developments in the coming days, we may choose to selectively make some moves, using oversold stock conditions to do so.
In listening to friend of the Portfolio, Helene Meisler, the number of stocks making new lows has continued to grow and market breadth is terrible. What we realize is that while fear and uncertainty are back in the driver’s seat, they aren’t yet at levels that point to a compelling risk-to-reward tradeoff. That has us tracking key support levels for both the S&P 500 and Nasdaq Composite, which are below current levels, as well as the market oscillators.
For some, that may make for rather frustrating days, but we would rather put Portfolio capital to work as some of these known unknowns become known and digested by the market. That includes what comes next between the U.S. and Iran, announcements stemming from the meeting between President Trump and China President Xi Jinping, and upcoming September economic data from ISM, ADP, and the Department of Labor. We will also be on watch for negative earnings pre-announcements and their causes, and what that could signal for the larger earnings season as companies contend with rising input costs and more difficulty passing them through to customers.
Is it possible that we may give up a few dollars across those stocks on our shopping list? Of course, but, in our view, we would rather make higher conviction moves rather than simply saying “we are doing something.” In our effort to teach members how to be better investors, one of the lessons is knowing when to act, when to wait for uncertainty to clear, and when to be patient.
Being patient doesn’t mean we are sitting around twiddling our thumbs, however. Instead, we are assessing newer data and pertinent information. For example, comments from McDonald’s (MCD), Stitch Fix (SFIX), and even from Darden Restaurants (DRI) are fostering concerns about consumer spending. We’ve talked quite a bit about inflation pressures and what’s driving them, so we’ll refrain from repeating them here, but we will say that in such an environment we’ll play the long game with our holdings in Costco (COST) and TJX (TJX).
We’ll also continue to collect real world signals. For example, despite the growing concern over the consumer stemming from higher gas and diesel prices, while picking up my son from the airport ahead of our daughter’s wedding this weekend, it was impossible to locate a parking spot at Dulles International Airport. When I mentioned this to Bob Lang, he shared that San Diego International Airport was jumping earlier this week. Anecdotally, that tells us folks are still spending on traveling, and mixed with a differentiated membership business model, we’re looking to pick up more shares of oversold American Express (AXP). And so on.
Should findings from Citadel Securities that in midterm election years the market tends to trough near September 30 prove out, we will want to be ready. However, as we discussed this week, given the slate of September economic data late next week and the following one, it’s possible that trough may not emerge until sometime in October. Still, given the multiple factors in play cited above, we will remain vigilant.
Enjoy your weekend. I’ll be back with you on Tuesday as we get ready for the upcoming EPS All-Stars reconstitution (more on that below) and the wave of September economic data (also more on that below). See you back here, bright and early on Tuesday.
Catching Up on the Portfolio This Week
With one day to go in the trading week, the Pro Portfolio regained some of the ground we lost last week against the S&P 500, leaving us up just over 1 percentage point over the S&P 500’s year-to-date gain. With just a few trading days left in the month, we’ll have a more detailed review of the Portfolio’s September performance in the upcoming Monthly Roundup that will likely be published either October 2 or October 5.
Before that monthly update, we will reconstitute the Portfolio’s EPS All-Stars strategy and upsize each of the basket’s constituents to 1% of the Portfolio’s assets. This will conclude the quarterly cadence of position-size increases. In terms of the upcoming reconstitution, on September 30, the Portfolio will exit any current All-Stars that are not staying with us for the final quarter of the year. Ahead of the market open on October 1, we will introduce any new stocks to the basket as well as upsize those that are sticking around. Rest assured, we’ll have detailed alerts spelling out both steps of the reconstitution process.
Now let’s see what others on Wall Street had to say about the Portfolio’s holdings this week:
Monday: Jefferies lowered its price target on Boeing (BA) to $265 from $295 and maintained its Buy rating. Evercore ISI lowered its price target on Welltower (WELL) to $256 from $260 and kept an Outperform rating on the shares. Wells Fargo raised the firm’s price target on Meta Platforms (META) to $796 from $640. Morgan Stanley raised the firm’s price target on Marvell (MRVL) to $268 from $246. Rothschild & Co Redburn raised the firm’s price target on Microsoft (MSFT) to $440 from $400.
Tuesday: Seaport Research initiated coverage of Marvell with a Buy rating and $270 price target. Stifel upgraded Microsoft to Buy from Hold with a price target of $575, up from $530. Oppenheimer raised the firm’s price target on Microsoft to $570 from $515 and reiterated its Outperform rating on the shares. Jefferies raised the firm’s price target on Meta Platforms to $875 from $710. HSBC downgraded Netflix (NFLX) to Hold from Buy.
Wednesday: Truist raised the firm’s price target on American Express (AXP) to $375 from $370 and reiterated a Buy rating. Cantor Fitzgerald raised the firm’s price target on Meta Platforms to $860 from $680 and maintained the firm’s Overweight rating on the shares. KeyBanc raised the firm’s price target on Meta Platforms to $900 from $780.
Thursday: JPMorgan upgraded Welltower to Overweight from Neutral with a $260 price target. Citizens raised the firm’s price target on Meta Platforms to $885 from $770. JPMorgan raised the firm’s price target on Meta Platforms to $920 from $820.
Key Global Economic Readings
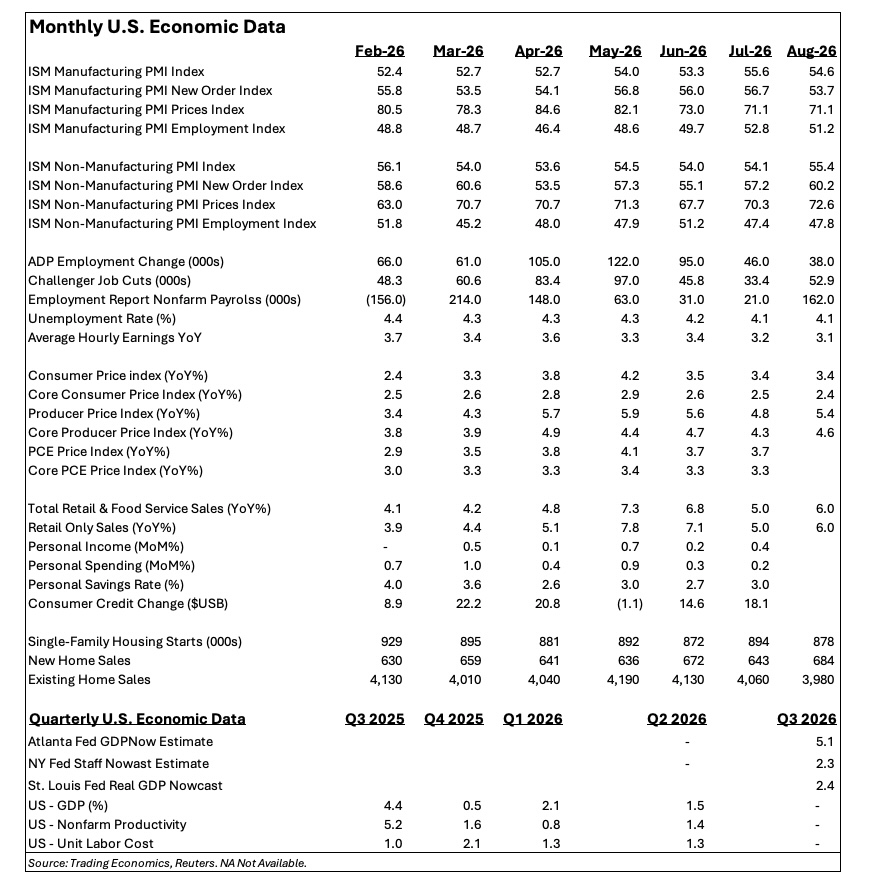
Chart of the Week: The 2-Year Treasury Yield
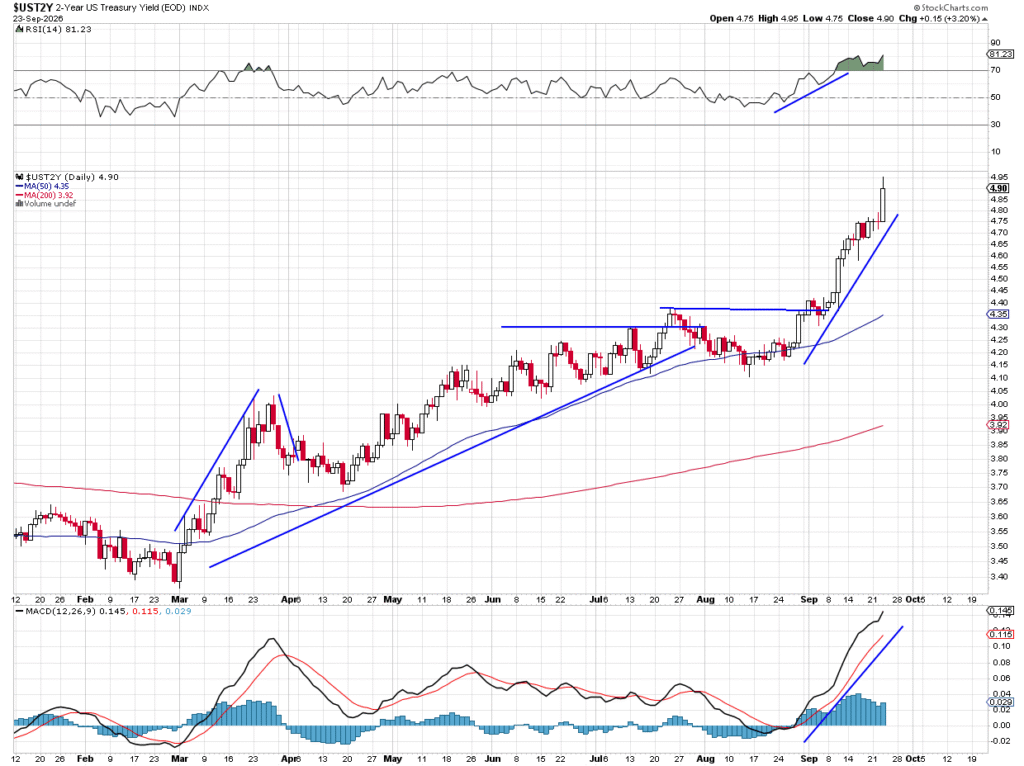
Yields have been the big story for markets in 2026, other than the rising price of crude oil. Bonds have been sold indiscriminately since the start of the Iran war. You can see this here with 2-year U.S. Treasury yields. From a low of 3.95% to a peak recently at 5.11% there is nothing bullish about higher yields for the stock market. The most sensitive group to higher rates, of course, is small-cap stocks, the Russell 2000 (IWM), which has fallen on hard times and looks destined to test its 200-day moving average.
But why are yields rising? There are a few reasons. Bond investors abhor inflation, and even though the Fed raised rates recently it was not enough to satisfy the “inflationistas,” that group obsessed with predicting inflation. The only tool the Fed really has is monetary policy, moving rates. With the 2-year now about 1.4% above the Fed funds rate the market is screaming for more rate hikes, else it believes inflation will spiral out of control. The fear is palpable and real, with oil prices up sharply all year long
We recently noted the strong correlation between yields and crude oil, both rising and falling together. We again see this relationship in real time and that has/will hurt equities.
The 2-year yield is one we look at because of its sensitivity to the Fed Funds rate. The 2-year basically tells us where the Fed Funds rates are likely to be in two years as estimated by the market, but things always change due to policy decisions. Apparently 2-year bond investors were not impressed by a ¼ point hike and decided to sell bonds. Stock investors were not pleased, either.
The chart shows a massive breakout after carving the right side of the base. The MACD is overbought but continues to rise, RSI is overbought too, but the strength in yield is very solid and could continue toward 5.5% before heading lower.
One thing is certain, this strong bull trend in yield is not good for our economy, so something must change.
Other charts we shared with you this week were:
Monday, September 21: Why the Nasdaq 100 Could Be the Next Leader
Tuesday, September 22: Apple (AAPL) – Apple’s Bullishness Can’t Be Ignored
Wednesday, September 23: Meta Platforms (META) – Meta’s Amazing Move Has Stock Peering Toward the $800s
Thursday, September 24: Boeing (BA) – Boeing Needs to Prove It’s Worthy
The Week Ahead
As we near the end of September and the upcoming reconstitution of our EPS All-Stars basket, we’ll be looking to see if factors line up such that findings from Citadel Securities that note market troughs on or around September 30 are on the money this year. Entering October, we will see the usual barrage of economic data, and it will influence not only Q3 2026 GDP expectations but the market’s view on monetary policy.
Following the robust Flash September PMI data from S&P this week, which also showed renewed inflation pressures and added to our concern over margin and EPS downside risk, next week we’ll look to confirm those findings with ISM’s September Manufacturing PMI data and multiple looks at September job creation. One way or another what we learn will refine the market’s expectation for monetary policy as well as the gap between Q3 2026 GDP expectations and the GDPNow model at the Atlanta Fed and those from the New York and St. Louis Feds. You can see those latest figures in our Macro Table above.
Coming into this week, we discussed why developments on the diplomacy front were high on our list. Despite what some are calling fiery presentations to the United Nations General Council this week, Thursday night reports pointed to U.S. and Iranian negotiators in New York exploring a phased path out of war that would involve Tehran reopening the Strait of Hormuz and Washington lifting its economic blockade of Iran.
After what we saw collapse in July, however, the market will be looking not only for a deal but one that has concessions both sides can abide by. A deal before the midterms could benefit Trump, as reopening Hormuz could ease tensions in the Gulf, contain oil prices and help bring down politically sensitive U.S. gasoline prices. Such an outcome would likely help consumer-facing stocks rebound as the forward-looking market views Q3 2026 margin pressure as a bump in the road.
If a deal is not completed until after the midterms, which is possible, it means companies reporting Q3 2026 results will likely base their guidance on current levels of oil, gas, diesel, and other prices. Coming off warnings from several airlines, J.B. Hunt Transport (JBHT) and others, that scenario suggests downside earnings risk.
As we track developments between the U.S. and Iran, we’ll do the same as the two-day meeting between Trump and Xi conclude. Reports on Thursday indicated the trade truce between the U.S. and China was extended by two months, which kicks the can down the road until early January.
Here’s a closer look at the economic data coming at us next week:
U.S.
Monday, September 28
Dallas Fed Manufacturing Index (September) – 10:30 AM ET
Tuesday, September 29
S&P Case-Shiller Home Price Index (July) – 9:00 AM ET
JOLTS Job Openings & Quits (August) – 10:00 AM ET
Consumer Confidence (September) – 10:00 AM ET
Wednesday, September 30
MBA Mortgage Applications Index – Weekly (7:00 AM ET)
ADP Employment Change Report – September (8:15 AM ET)
PCE Price Index (August) – 8:30 AM ET
Personal Income & Spending (August) – 8:30 AM ET
Retail & Wholesale Inventories (August) – 8:30 AM ET
Chicago PMI (September) – 9:45 AM ET
EIA Crude Oil Inventories – Weekly (10:30 AM ET)
Thursday, October 1
Challenger Job Cuts Report (September) – 5:30 AM ET
Initial & Continuing Jobless Claims – Weekly (8:30 AM ET)
S&P Global Final Manufacturing PMI (September) – 9:45 AM ET
ISM Manufacturing PMI (September) – 10:00 AM ET
Construction Spending (August) – 10:00 AM ET
EIA Natural Gas Inventories – Weekly (10:30 AM ET)
Friday, October 2
Employment Report (September) – 8:30 AM ET
Factory Orders (August) – 10:00 AM ET
International
Monday, September 28
China: Industrial Profits (August)
Tuesday, September 29
Japan: Leading Economic Index (July)
UK: Bank of England Consumer Credit (August)
Eurozone: Economic Sentiment & Consumer Confidence (September)
Wednesday, September 30
China: NBS Manufacturing & Non-Manufacturing PMI (September)
China: RatingDog Manufacturing & Services PMI (September)
Germany: Retail Sales (August)
Germany: Import/Export Prices (August)
Germany: Preliminary Inflation Rate (September)
UK: Business Investment, GDP (Q2 2026)
Thursday, October 1
Japan: S&P Global Final Manufacturing PMI (September)
Eurozone: S&P Global Final Manufacturing PMI (September)
UK: S&P Global Final Manufacturing PMI (September)
Friday, October 2
Japan: Consumer Confidence (September)
Eurozone: Flash Inflation Rate (September)
With companies closing their quarterly books this coming Wednesday, we will be on high alert for earnings pre-announcements. Assuming there are some next week or the following one, we will tie them back to the Portfolio’s holdings as best we can.
Looking at the below list of companies reporting, if we had to focus on just one, it would be quarterly results and guidance from Micron (MU). That’s partly because MU shares are in the current EPS All-Stars basket, but also because of the implications for the other holdings we have in the AI and data-center ecosystem. Micron’s comments about capital spending plans will also be something we track given or position in Applied Materials (AMAT).
Here’s a closer look at the earnings reports coming at us next week:
Monday, September 28
Close: Vail Resorts (MTN)
Tuesday, September 29
Open: CarMax (KMX)
Close: Carnival (CCL)
Wednesday, September 30
Open: Cal-Maine Foods (CALM), ConAgra (CAG), Jabil (JBL)
Close: Micron (MU), Progress Software (PRGS)
Thursday, October 1
Open: Accenture (ACN), Acuity (AYI), McCormick & Co. (MKC)
Close: Nike (NKE)
Portfolio Investor Resource Guide
Economic Data: Here’s a List of Links to the Key Economic Data We Closely Watch
Investing Terminology: 16 Key Terms Club Members Should Know
10-Ks: Want to Know About a Stock? Read the Company’s Reports
10-Qs: Unlock the Numbers and Key Information Behind Your Stock With the 10-Q
Income Statement: Our Cheat Sheet to Understanding This Financial Document
Balance Sheet, Cash Flow Statements, and Dividends: How to Know If a Company Is Off-Kilter? Read Its Balance Sheet
Valuation Metrics: Everyone Wants a Value. Here’s How Investors Can Find
Thematic Investing 101 Webinar
Like the Benefits of ETFs? Let’s Talk About Models
The Portfolio Ratings System
1 – Buy Now (BN): Stocks that look compelling to buy right now.
2 – Stockpile (SP): Positions we would add to on pullbacks or a successful test of technical support levels.
3 – Holding Pattern (HP): Stocks we are holding as we wait for a fresh catalyst to make our next move.
4 – Sell (S): Positions we intend to exit.