The One Chart Every Investor Must See Right Now
Investors have plenty to worry about, but attractive gains can be made even in overbought markets.
You've reached your free article limit
You've read 0 of 1 free Pro articles.

Everyone is worried. Worried about inflation, worried about jobs, worried about war, worried about gas and grocery prices.
Should we be worried about the stock market?
Zooming Out
This is the monthly chart of the S&P 500. Looking at a longer-term chart helps to smooth out the market’s volatile swings, and present a clearer, cleaner picture of market direction.
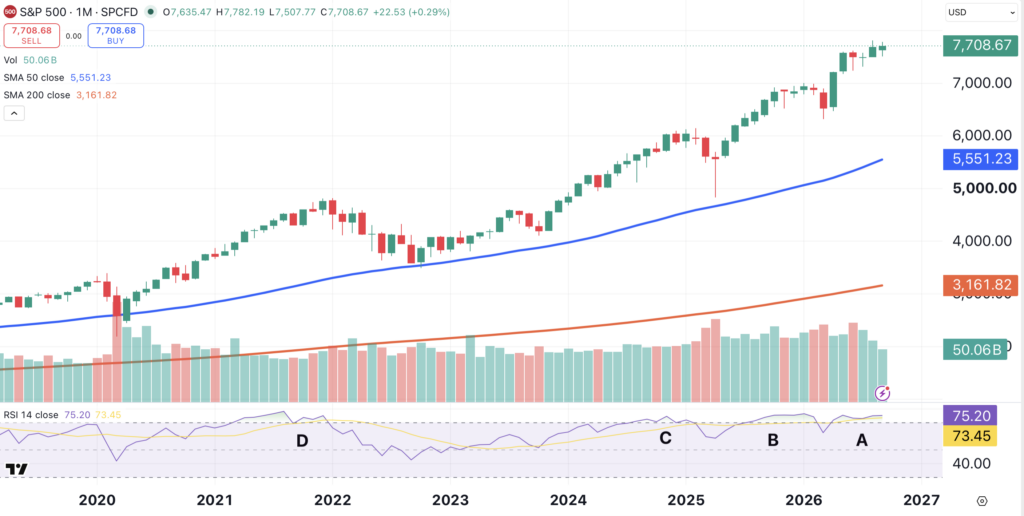
The S&P 500 has gained about 245% since the pandemic lows. Despite a few brushes with euphoria and anxiety, the large-cap index has accomplished this in fairly orderly fashion.
The S&P 500’s 50-month (not day) moving average is not only rising, its ascent is accelerating (blue line). The index’s 200-month moving average (red) is also rising.
Long story short, there’s nothing bearish about this chart.
Is the Market Overbought?
Now trading near 7700, is the S&P 500 overbought? According to the RSI (relative strength indicator), the answer is yes (point A).
It was also overbought last fall, when it traded closer to 6700 (point B). This was also true in the fall of 2024, when the index traded near 6000 (point C). It was even overbought in the fall of 2021 (point D), when the S&P 500 traded in the 4500 area.
This chart demonstrates that outsized gains can be made in an overbought market. Therefore, an overbought reading is nothing to fear.
What About Treasuries?
The big concern this week is Treasury yields, which have skyrocketed. What does this mean for the stock market?
The Treasury market is indicating that interest rates need to be higher. The Fed has once again allowed interest rates to remain too low for too long, and consumers are paying for it, due to inflation.
Why does this keep happening? Until recently, the FOMC seemed to believe that the inflation rate would slow of its own accord.
This misguided line of thinking has led to five consecutive years of an annual CPI inflation above the 2% target rate. The last time annual CPI was rising at less than 2% was in February of 2021. At that time, during the pandemic, consumer prices were rising at an annual rate of 1.7%.
What’s the Solution?
The FOMC raised the Fed funds rate by 25 basis points on September 17. It was the first time the Fed hiked rates since July of 2023.
That’s not enough. The FOMC needs to operate at a faster clip.
The good news? The CME’s FedWatch Tool indicates a 68% chance of a rate increase at the Fed’s October 28 meeting.
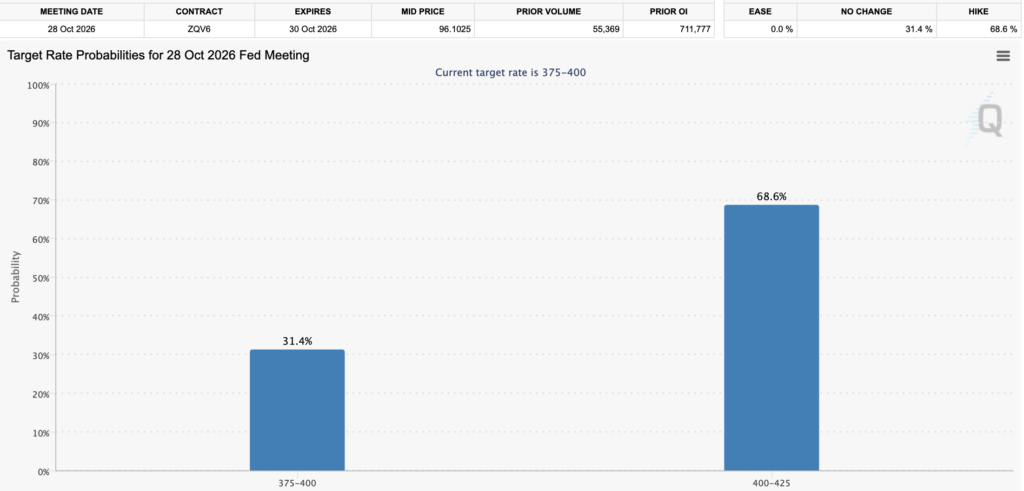
This week, at least three Fed officials indicated that another rate hike is needed. The Philly Fed’s Anna Paulson, the New York Fed’s John Williams, and Fed Governor Michael Barr, all expressed that sentiment. All three are currently voting members of the FOMC.
I’m hoping that last week’s Fed rate increase was the first in a series. The U.S. economy is strong, it needs higher rates, and the Treasury market is screaming about it.
At the time of publication, Ponsi had no positions in any securities mentioned.