OpenAI Revenue Report Sinks AI, but the Rest of the Market Holds Up
An FT report that OpenAI’s revenue is running notably below earlier estimates sent AI shares sharply lower, but beneath the surface most stocks held up as Treasury yields eased and President Trump said the U.S. won’t attack Iran before the midterms.
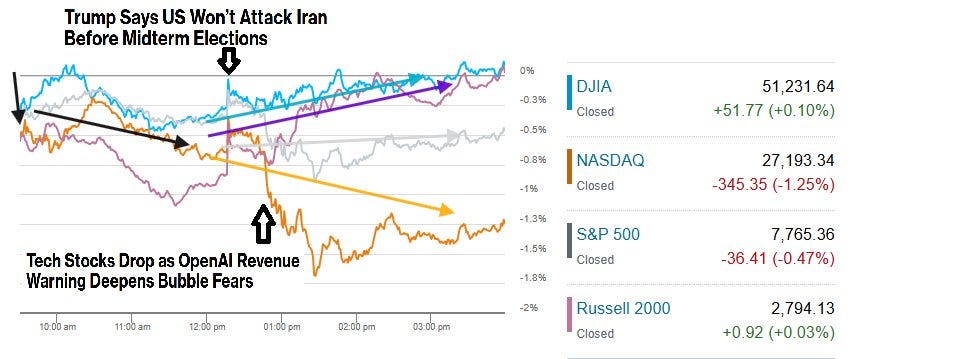
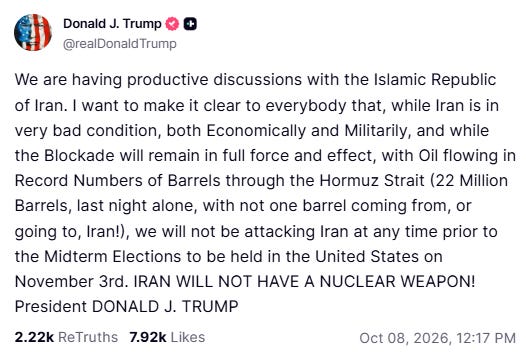
President Trump declared there would be no attacks on Iran before the midterms, catalyzing a rally in markets that took the Russell 2000 and Dow Jones Industrial Average into the green. Tech shares, though, would run into a new headwind soon after Trump’s social media post in the form of a Financial Times report that OpenAI’s annualized revenue is running about $20 billion below earlier estimates. AI-beneficiaries sank, and the Nasdaq fell 1.3%, nearly erasing its gain for the week.
Indices opened Thursday’s session lower again as oil prices rose on continued tanker attacks in the Persian Gulf and Trump’s earlier comments that a deal with Iran wasn’t a priority. They got a boost when Trump posted on social media (post below) that the U.S. won’t attack Iran before the midterm elections. The Dow Jones Industrial Average (+0.1%) and Russell 2000 rode that to small gains. The OpenAI report came out a half hour later pressuring Tech shares and leaving the S&P 500 down 0.5% as just one of the top 10 stocks by market capitalization finished higher.
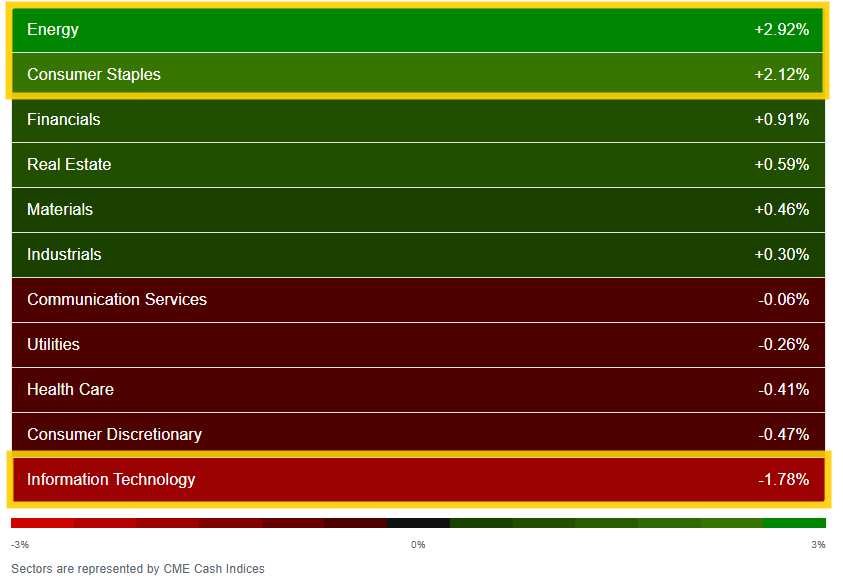
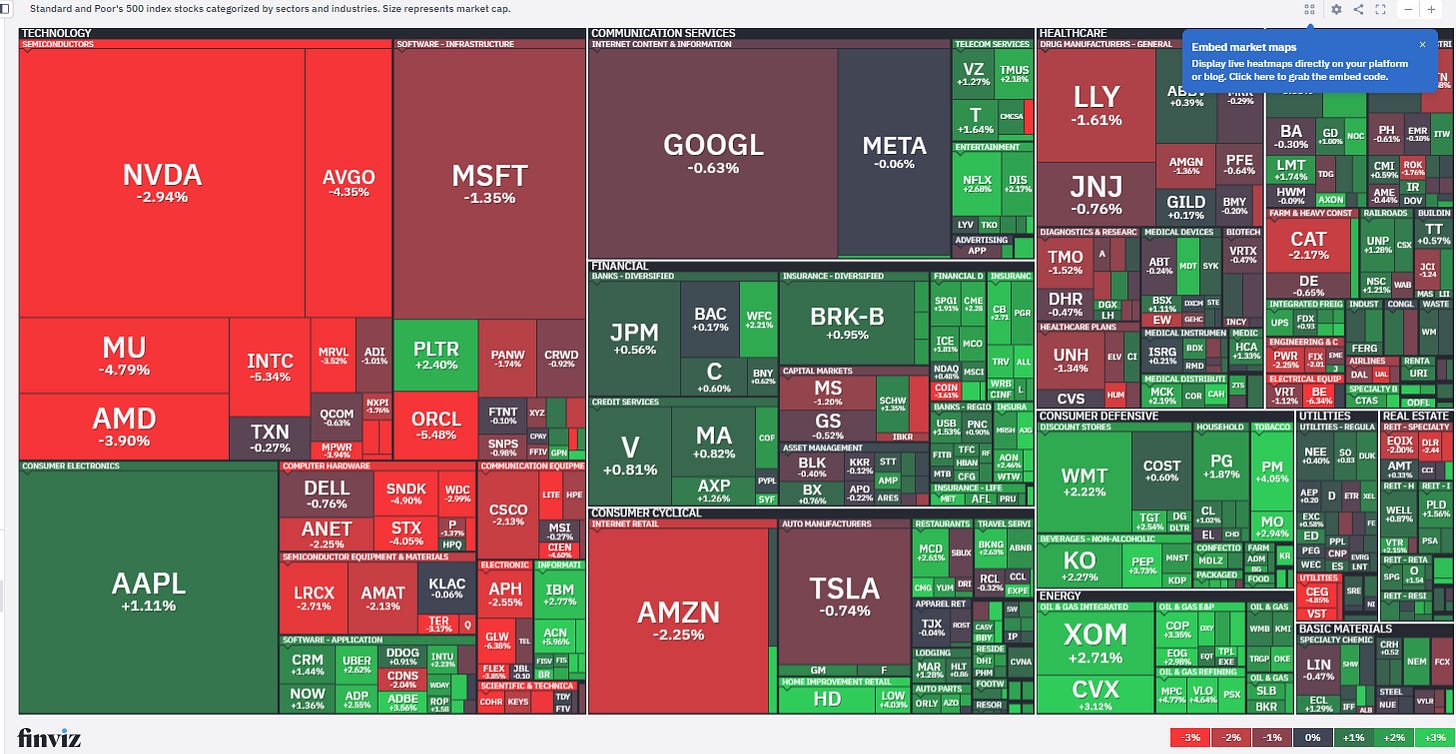
Six of 11 sectors rose though, led by Energy (+2.9%) and Staples (+2.1%). But mega-cap-heavy Tech, about 40% of S&P 500 market cap, fell 1.8%, a hole the index could not escape from. The PHLX Semiconductor Index (SOX) sank 3.4%, and Nvidia (NVDA) fell about 3%.
Oil fell back after Trump’s midterm post, but WTI still settled the cash session up 3.7% at about $91.50. Treasury yields though fell, led by the long end, helped by a solid $22 billion 30-year auction. The 10-year finished down 5bp at 5.23% in the cash session after touching 5.35% earlier.
Fed rate hike expectations were little changed after leading Fed Governor Waller said more hikes will likely be needed but “do not need to come at consecutive meetings.” More on Waller’s comments below. Initial unemployment claims remained below 200,000 for a fourth straight week for the first time since 1969.
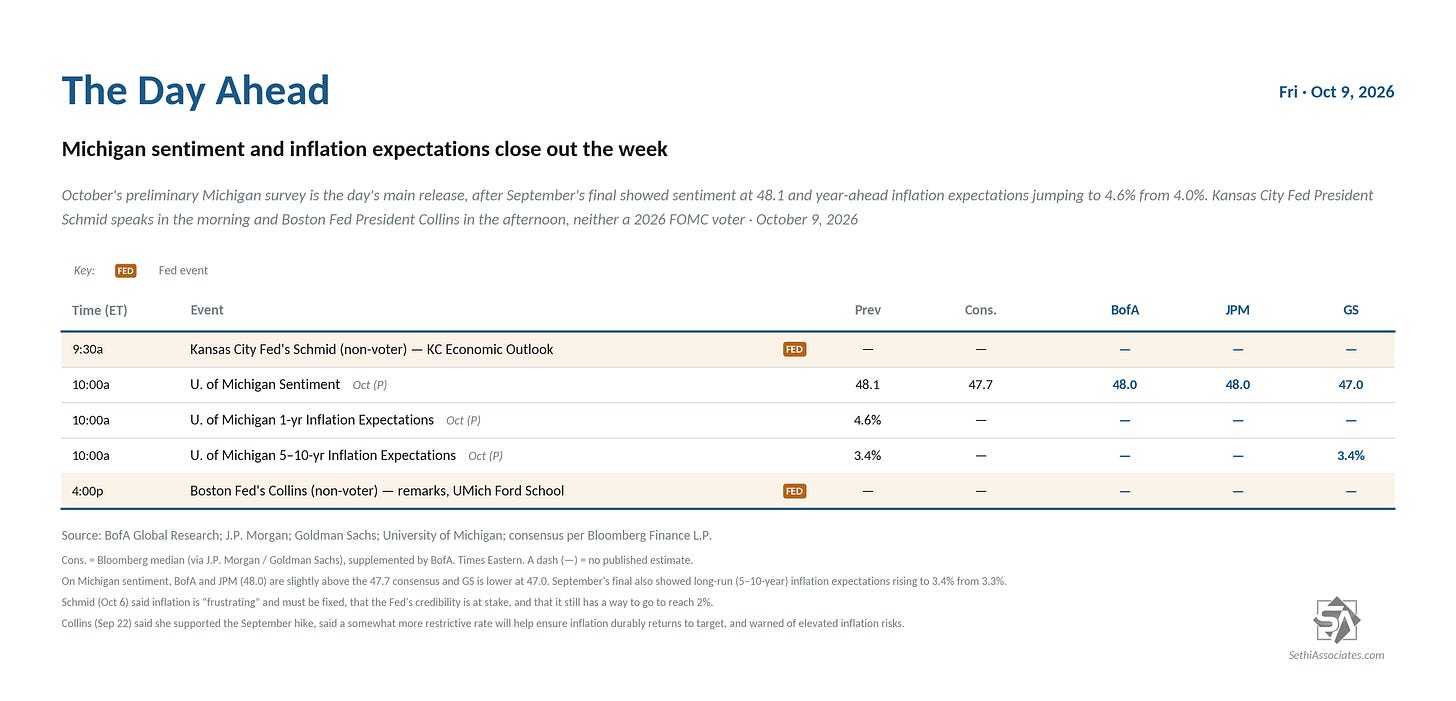
Friday brings an even lighter day with just the preliminary October University of Michigan consumer sentiment survey on the data docket.
Schwab
Market Commentary
Equities:
“Each time oil rebounds, that translates into higher bond yields and pressure on equities, even if they are currently quite resilient,” said Alexandre Baradez, chief market analyst at IG in Paris. “Tech and energy are the main drivers of the US market, so any hint of a slowdown is bound to have an impact.”
“Another morning sees another spike in oil prices on another flare-up in Middle East tensions, producing another rise in bond yields and another dip in stock prices. While the latter has been fairly substantial in Asia, Europe, and US futures, in general it has been the case that fixed income has borne much more of the brunt of oil moves than equities in the United States.” — Cameron Crise, Macro Strategist, Markets Live, Bloomberg.
“The renewed rise in oil prices is intensifying inflation concerns and adding to upward pressure on bond yields,” said Fawad Razaqzada at Forex.com. “With depleted inventories supporting the case for sustained replenishment demand, the long-term direction of oil prices will remain tilted to the upside.”
“If earnings remain strong, and the idea is that they probably will, if expectations are met and/or higher, that is going to sustain this rally — despite the fact that rates are higher,” Courtney Garcia, senior wealth advisor at Payne Capital Management, told CNBC’s “Closing Bell.” “It’s not going to derail the market.”
“Markets may have to climb a renewed wall of worry to set fresh records, but waiting for these concerns to fade could mean missing further gains. We believe investors should focus less on finding a perfect entry point and more on maintaining exposure while managing concentration and timing risks through a disciplined portfolio approach,” Ulrike Hoffmann-Burchardi, CIO of the Americas at UBS, said in a note.
“With stocks being supported by strong earnings growth, companies will need to deliver another solid quarter as macro risks continue to accumulate,” Bret Kenwell at eToro noted. “Interest rates, Treasury yields and inflation are all becoming more prominent market concerns, shifting the burden of proof back to the bulls to keep the rally going.”
Bonds:
“The long end is where investors are demanding the most compensation, consistent with a term-premium/duration-risk story rather than an outright ‘no buyers’ story,” said Tony Miano, global investment strategy analyst at Wells Fargo Investment Institute. “Net takeaway: today’s 30-year result is a curve-steepening signal — long-duration paper absorbing the brunt of the repricing.”
“At the end of the day, I think it’s inflation pressures, primarily driven by energy, that have shifted the Fed’s disposition and have in a lot of ways shifted the long end of the curve as well,” Ross Mayfield, Baird investment strategist told CNBC. “If we announced a deal with Iran tomorrow that was structurally sound and removed a lot of the tensions from the area, and oil dropped from $90 a barrel to $70 a barrel, yields would come down meaningfully.” “We are in the process of the market adjusting to these new yields,” he added. “In a lot of ways, higher yields are reflective of stronger nominal growth and slightly higher inflation, and if that’s the case going forward, then again, it makes the argument that this kind of higher-for-longer or normal-for-longer rate environment is probably here to stay, barring a big recession where the Fed cuts rates to zero.”
Fed:
“Higher interest rates may be doing some of the Fed’s work, where they don’t necessarily need to raise interest rates,” Ameriprise’s Anthony Saglimbene told CNBC. “That might allow them to kind of just staying pat for the rest of the year.” However, he added, “There’s a lot of ifs in that statement, and I think it comes down to where interest rates settle out here over the next few weeks, because the market is already concerned that that’s going to start slowing growth.”
Stock and Sector Breakdown:
Sector breadth improved to six of 11 sectors higher (from three Wednesday) with two finishing up over 2% (Energy and Staples) and all up over 0.2% vs just one Wednesday. But the big difference was while mega-cap-rich Tech (~40% of SPX market cap) was -0.1% Wednesday, it was -1.8% Thursday, dragging down the S&P 500 and Nasdaq. It was the only sector to finish down more than 0.5%.
As noted earlier, the catalyst for the Tech weakness was a report in the Financial Times that OpenAI’s revenue run rate was $50 billion in September, $20 billion lower than previously signaled, exacerbating AI bubble fears. The PHLX Semiconductor Index (SOX) ended down 3.4%. Nvidia (NVDA) -2.9%, Micron (MU) -4.8%, Advanced Micro Devices (AMD) -3.9%, and Tuesday standout Corning (GLW) -6.4% were among notable laggards, the last the second worst performer in the S&P 500 after Coherent (COHR) -9.6%.
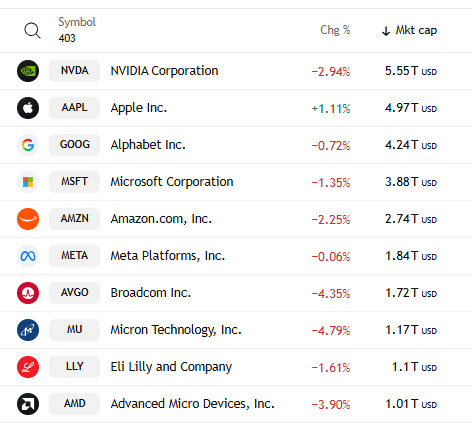
Out of the top 10 components of the SPX, just Apple was higher.
TradingView
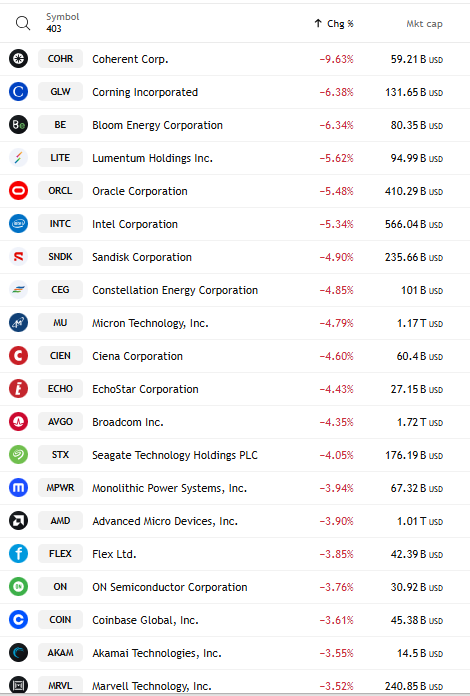
And top 20 losers on the SPX almost all AI-related.
TradingView
The FT was also the catalyst in the opposite direction for shares of Chipotle (CMG) +6.21%, which was the second best performer on the S&P 500 Thursday following reports that coffee chain Starbucks (SBUX) -0.40% explored a takeover of the Mexican food company.
Consumer staples stocks also did well after PepsiCo (PEP) +4.2%, reported third-quarter 2026 financial results that topped Wall Street forecasts. Management attributed the strong results to international sales growth as its North American business continues to struggle resulting in a lowering of full-year guidance. “Our business in North America performed below our expectations and represents a meaningful opportunity for improvement,” said PepsiCo in its earnings release. Coca-Cola (KO) +2.3% rose in sympathy.
CoStar Group (CSGP) +8.0% topped the S&P 500 on no news (a buy rating was reiterated by Needham Tuesday).
After hours Humana (HUM) was up 15% but CVS Health (CVS) down 5% after CMS published the latest Medicare Advantage (Part C) and Part D Star Ratings.
[Note: chart uses futures prices.]
Schwab
The better sector breadth was reflected in a bounce in the number of large SPX winners (up over 3%) to ~40 from 8 Wednesday back to levels from Tuesday/Monday, while the number of large losers (down over 3%) fell to ~20 from ~35 Wednesday (11 and 8 Tuesday/Monday). As mentioned previously, both of these metrics have remained very (extremely?) subdued since the start of August rarely getting above 50 and only once above 100. Very unusual compared to the past couple of years.
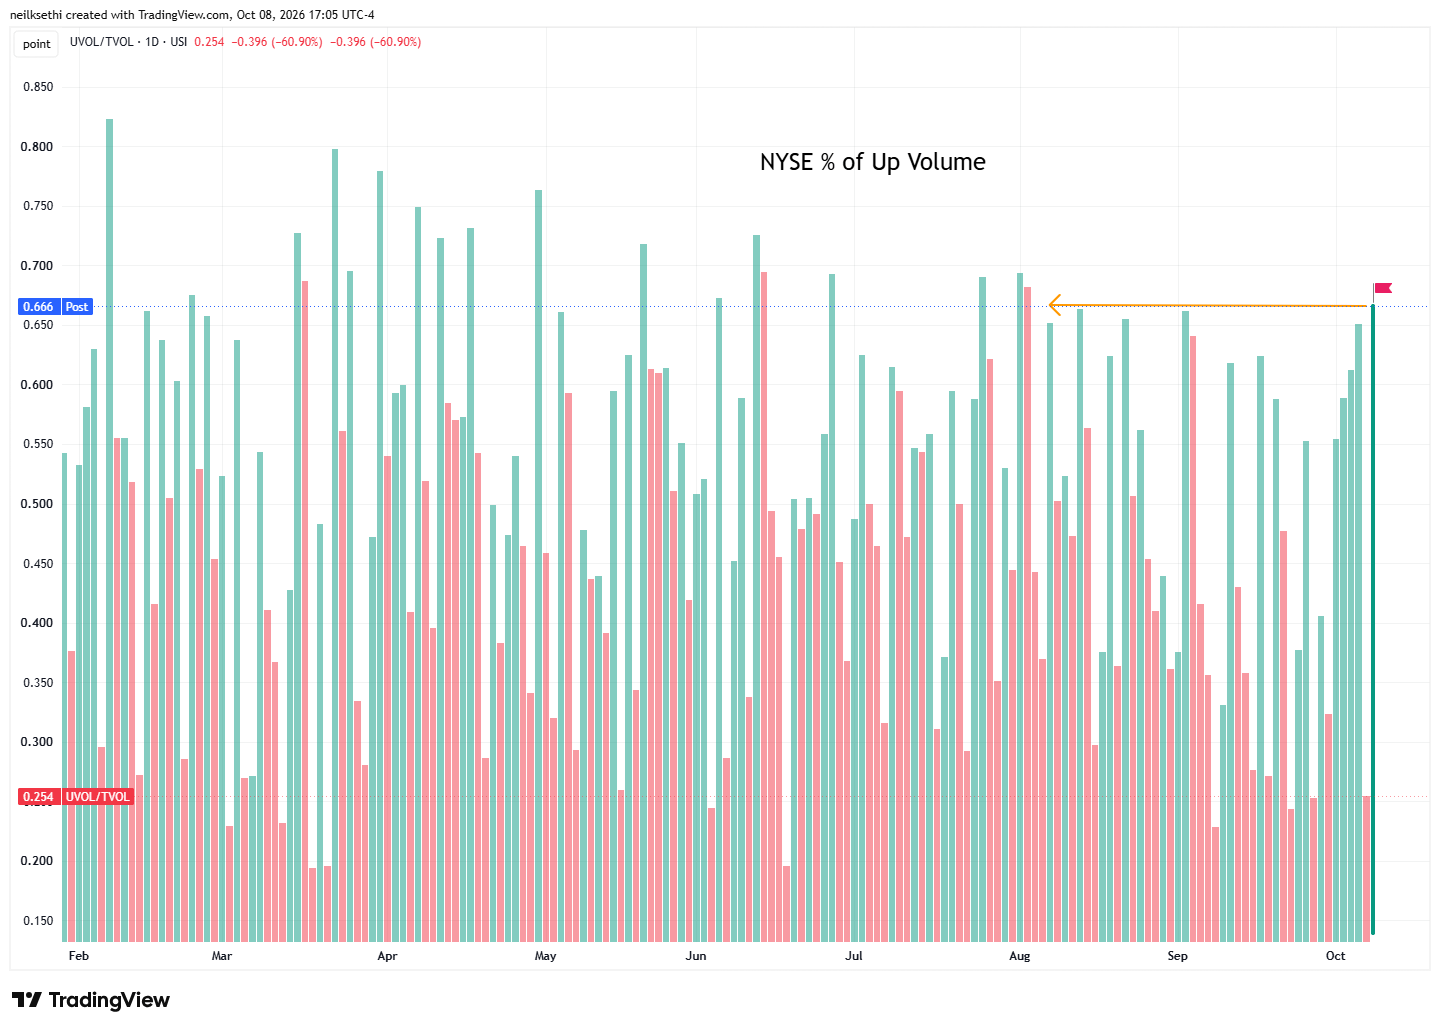
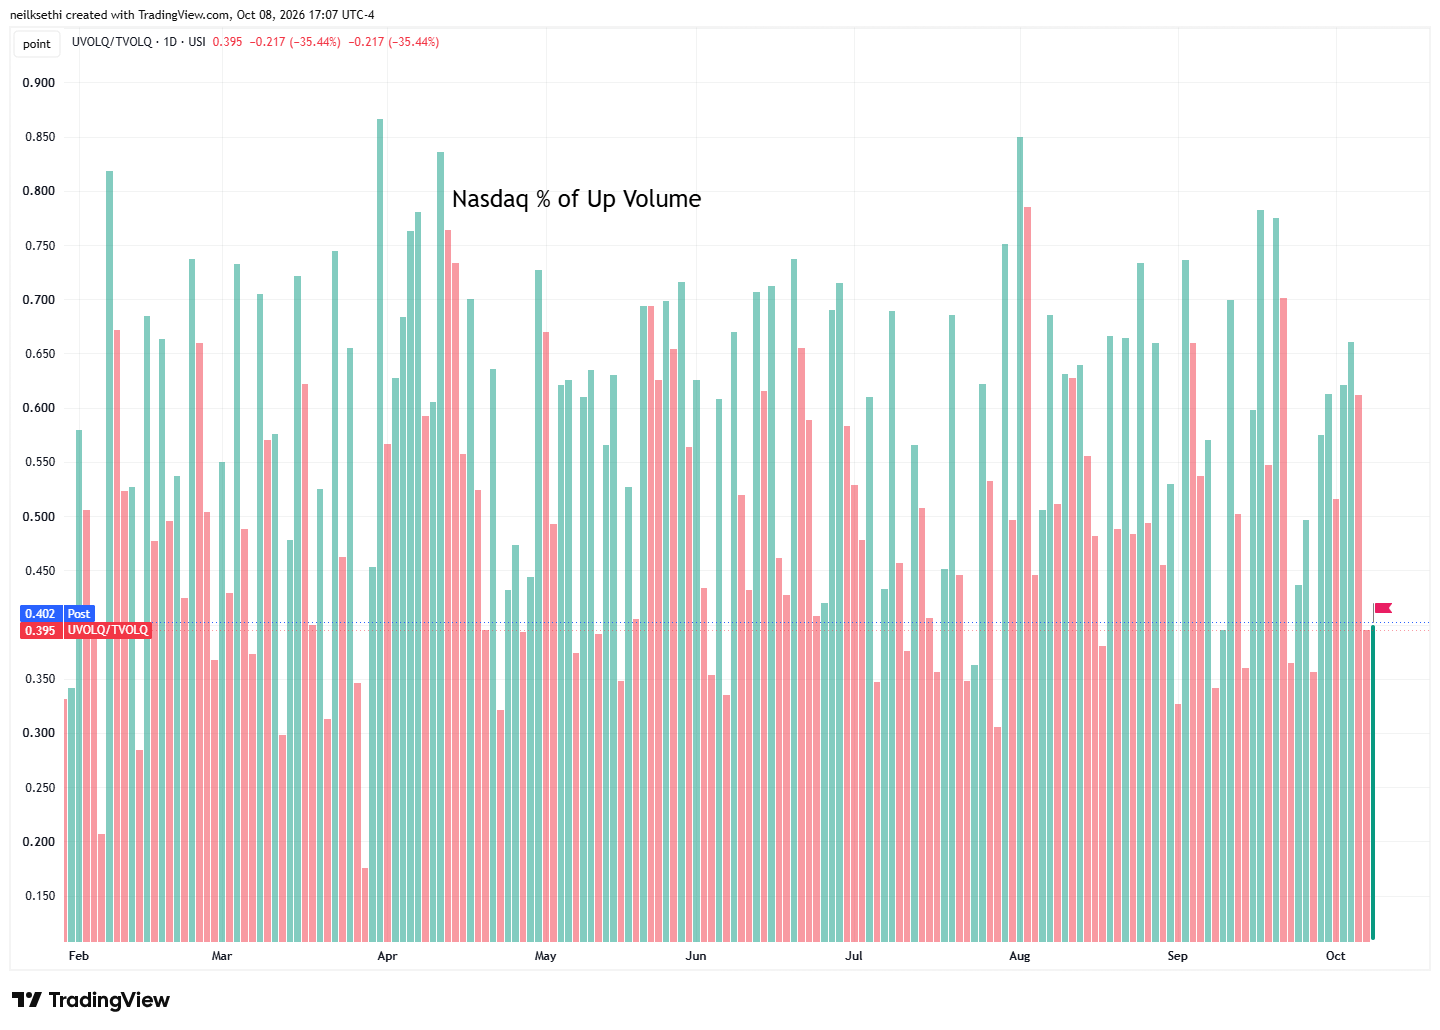
And positive volume also improved with the NYSE up to 66.6% (I know), the best in two months, and the Nasdaq at 40.2%. While the latter is just marginally above Wednesday, the index loss was -1.25% vs -0.22% Wednesday, so a relatively much stronger result.
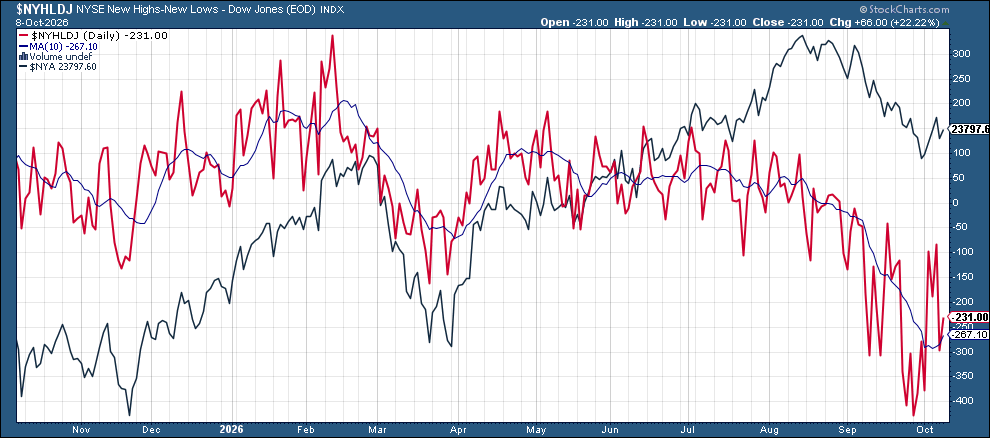
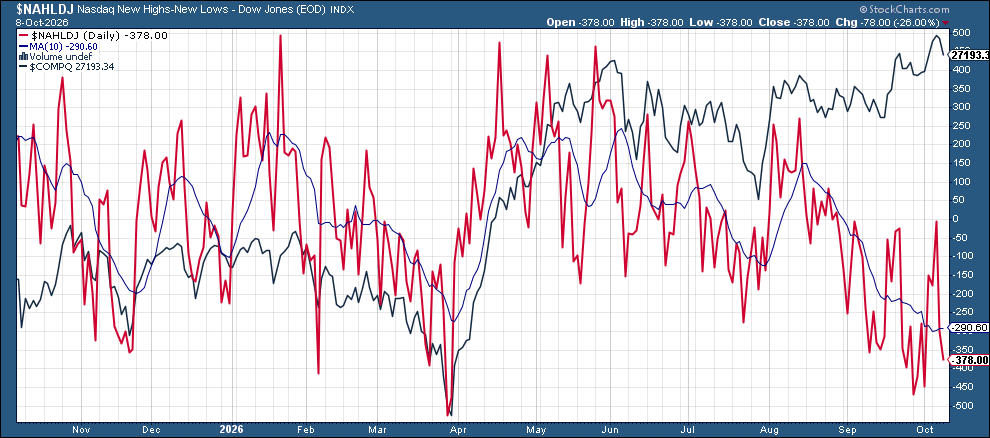
New 52-week highs minus lows, though, were more spotty. The NYSE did improve to -232 from -298, but still a lot more new lows, while the Nasdaq deteriorated to -397, not far from the -451 September 28th, which was the worst since April. And that makes it the 29th straight session that the Nasdaq saw more new 52-week lows than new highs.
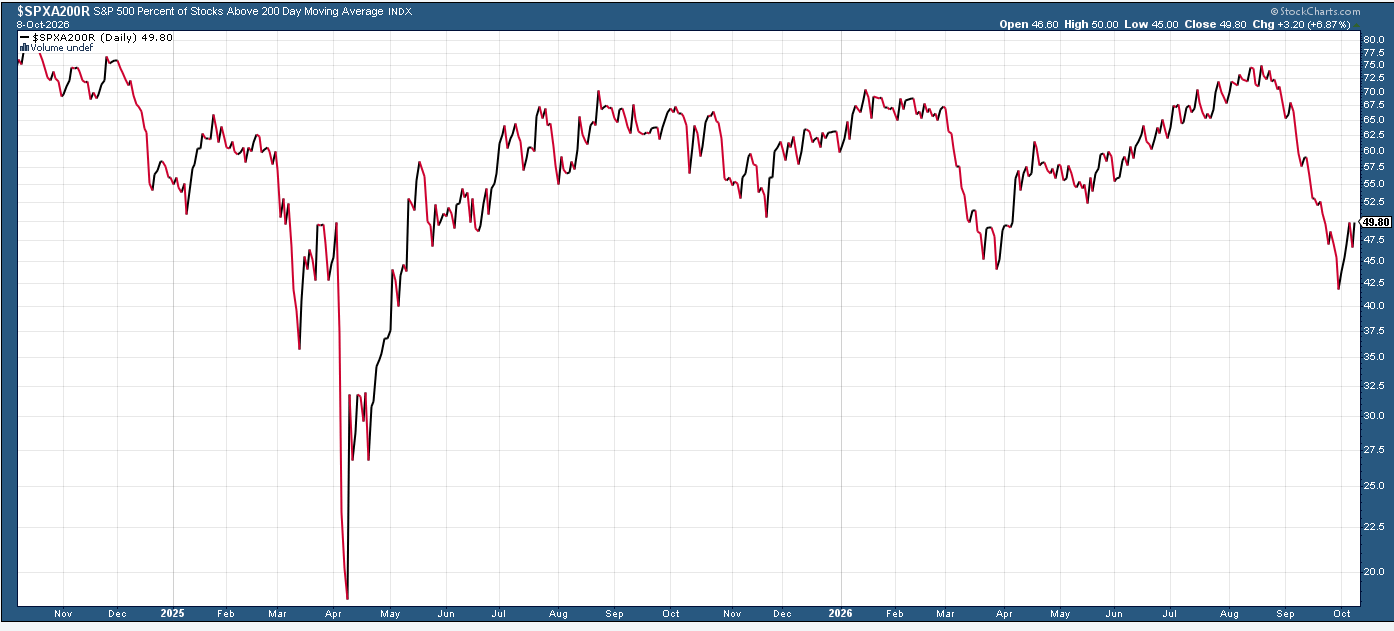
The percentage of S&P 500 stocks trading above their 200-day moving average also didn’t slip (still just a hair under 50% though).
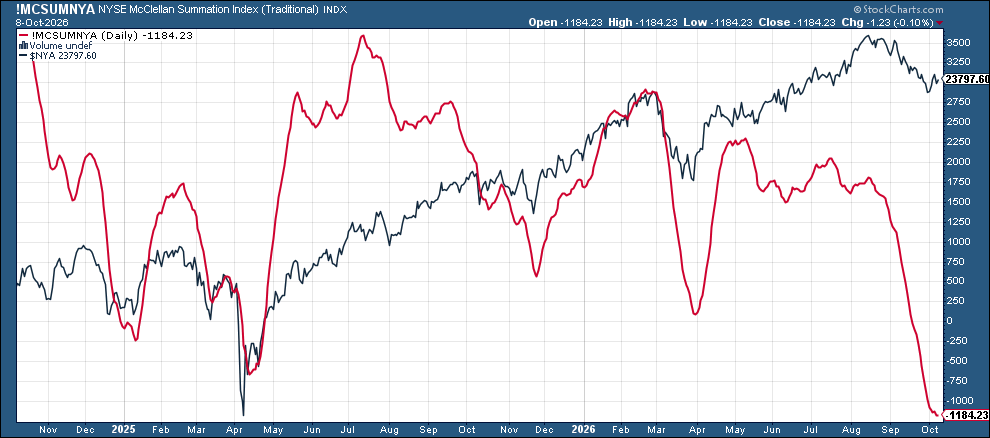
Still waiting for the McClellan Summation Index (red line, broadly whether the typical stock is doing relatively better or worse than the index) to turn higher.
Some Other Stock-Specific Commentary From TheStreet Pro:
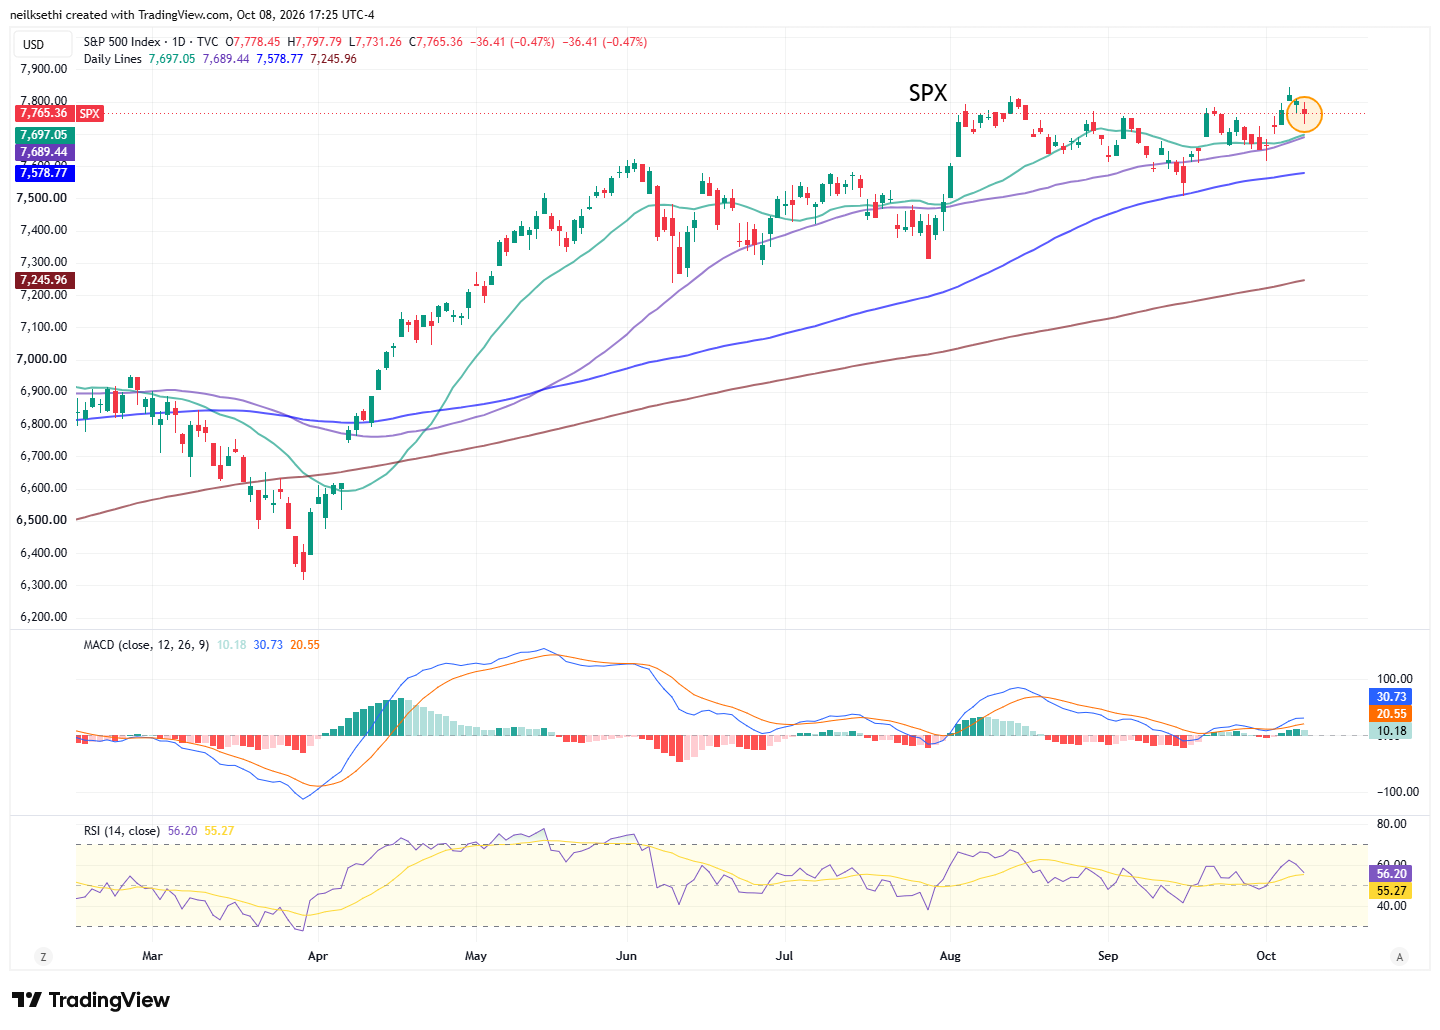
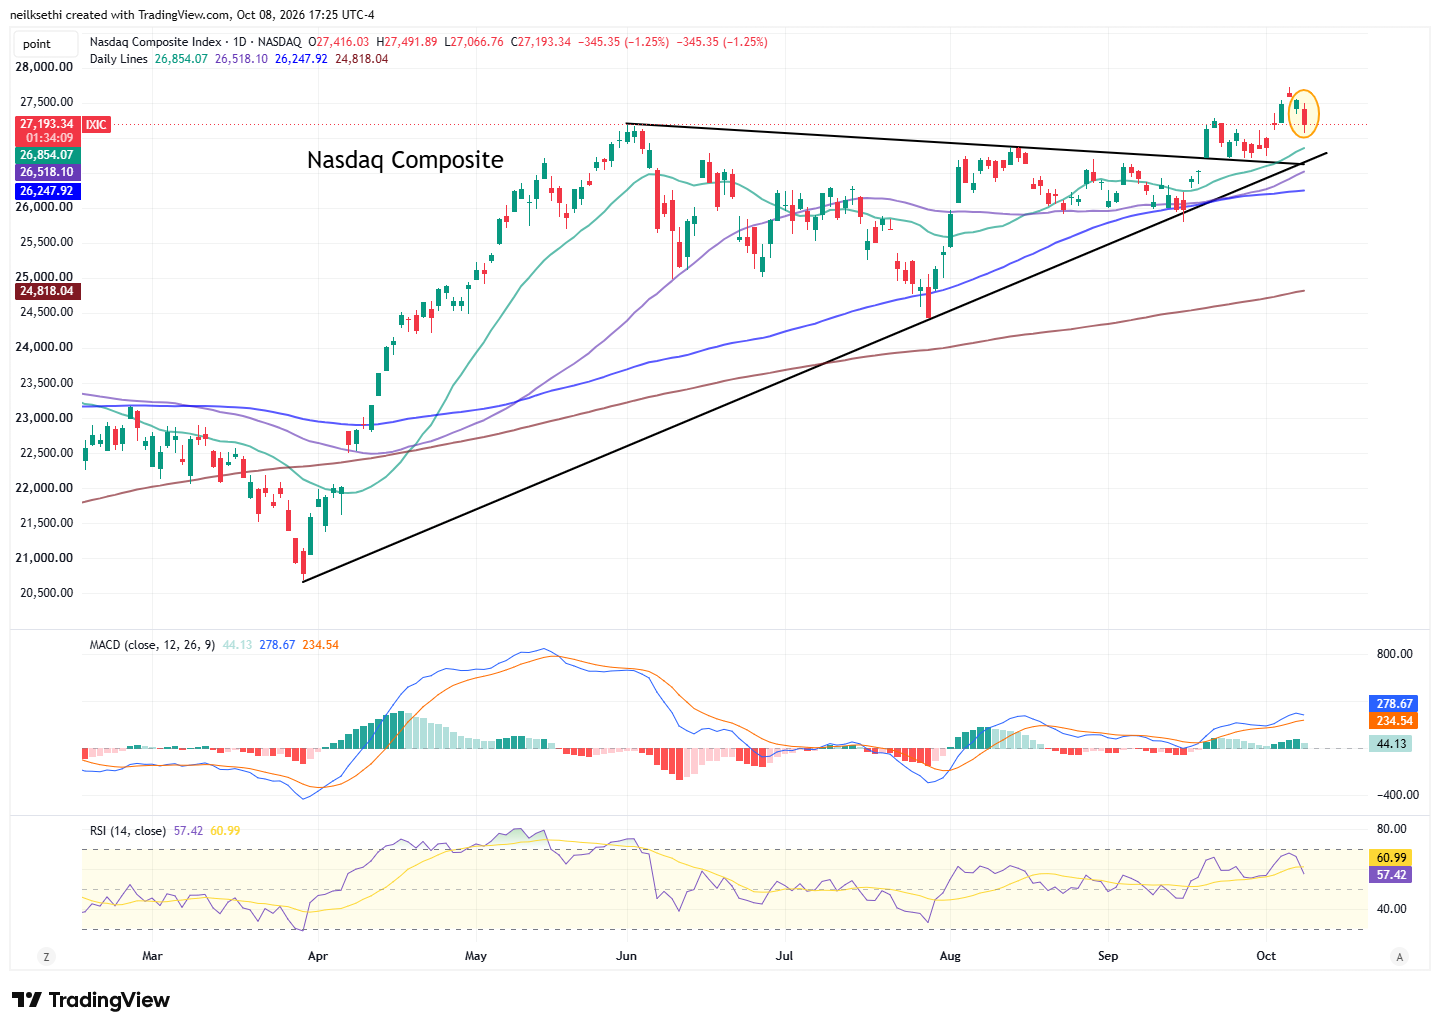
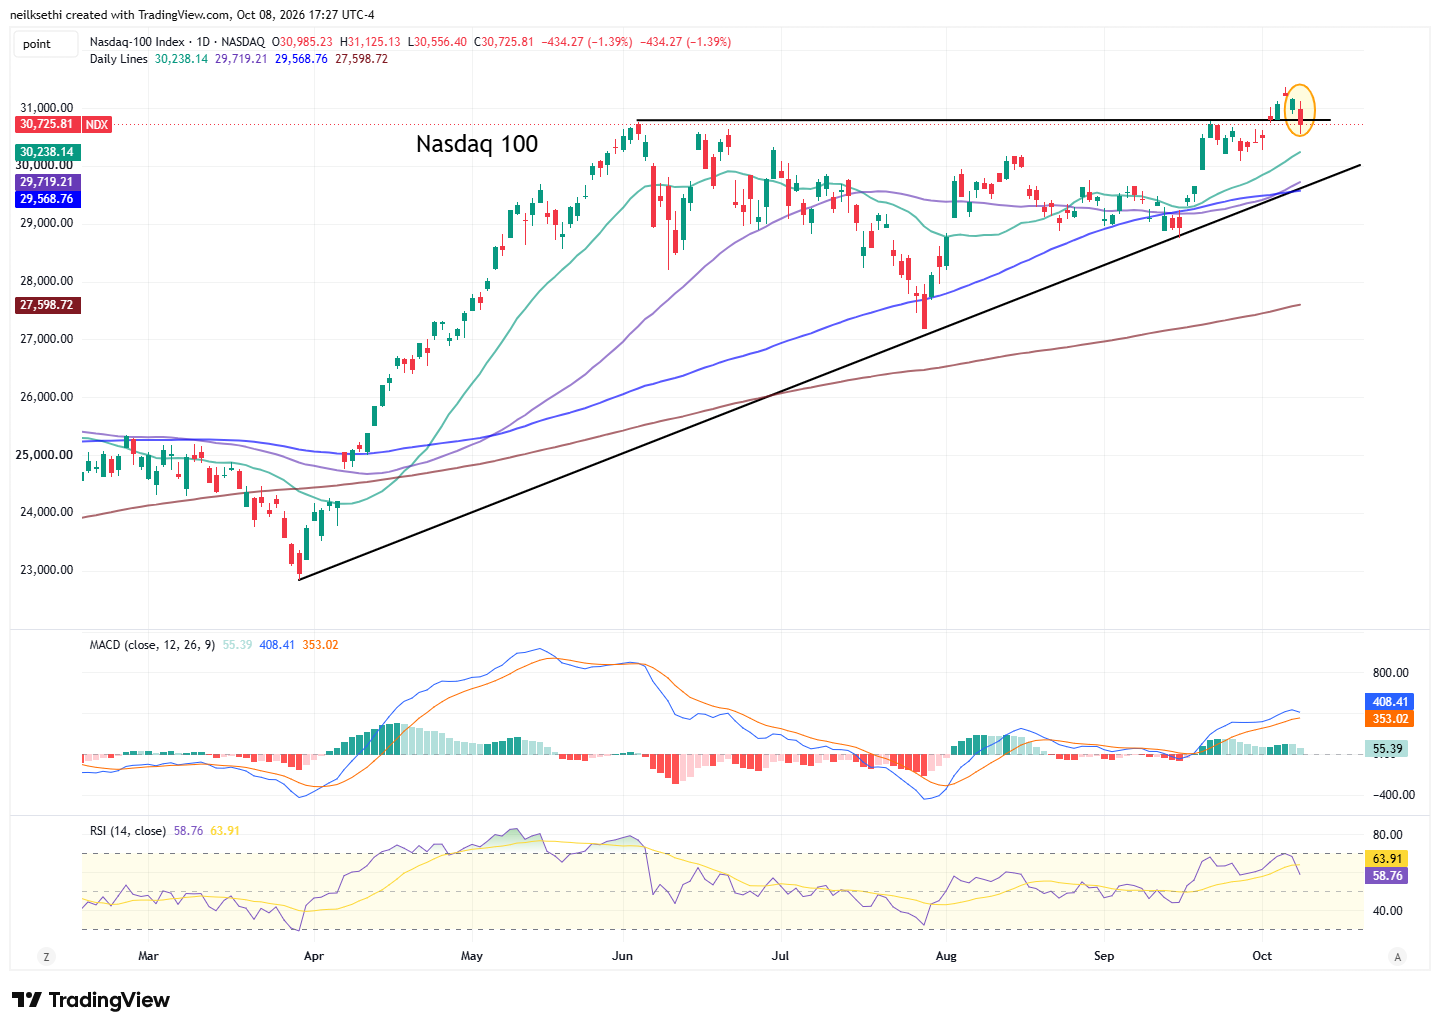
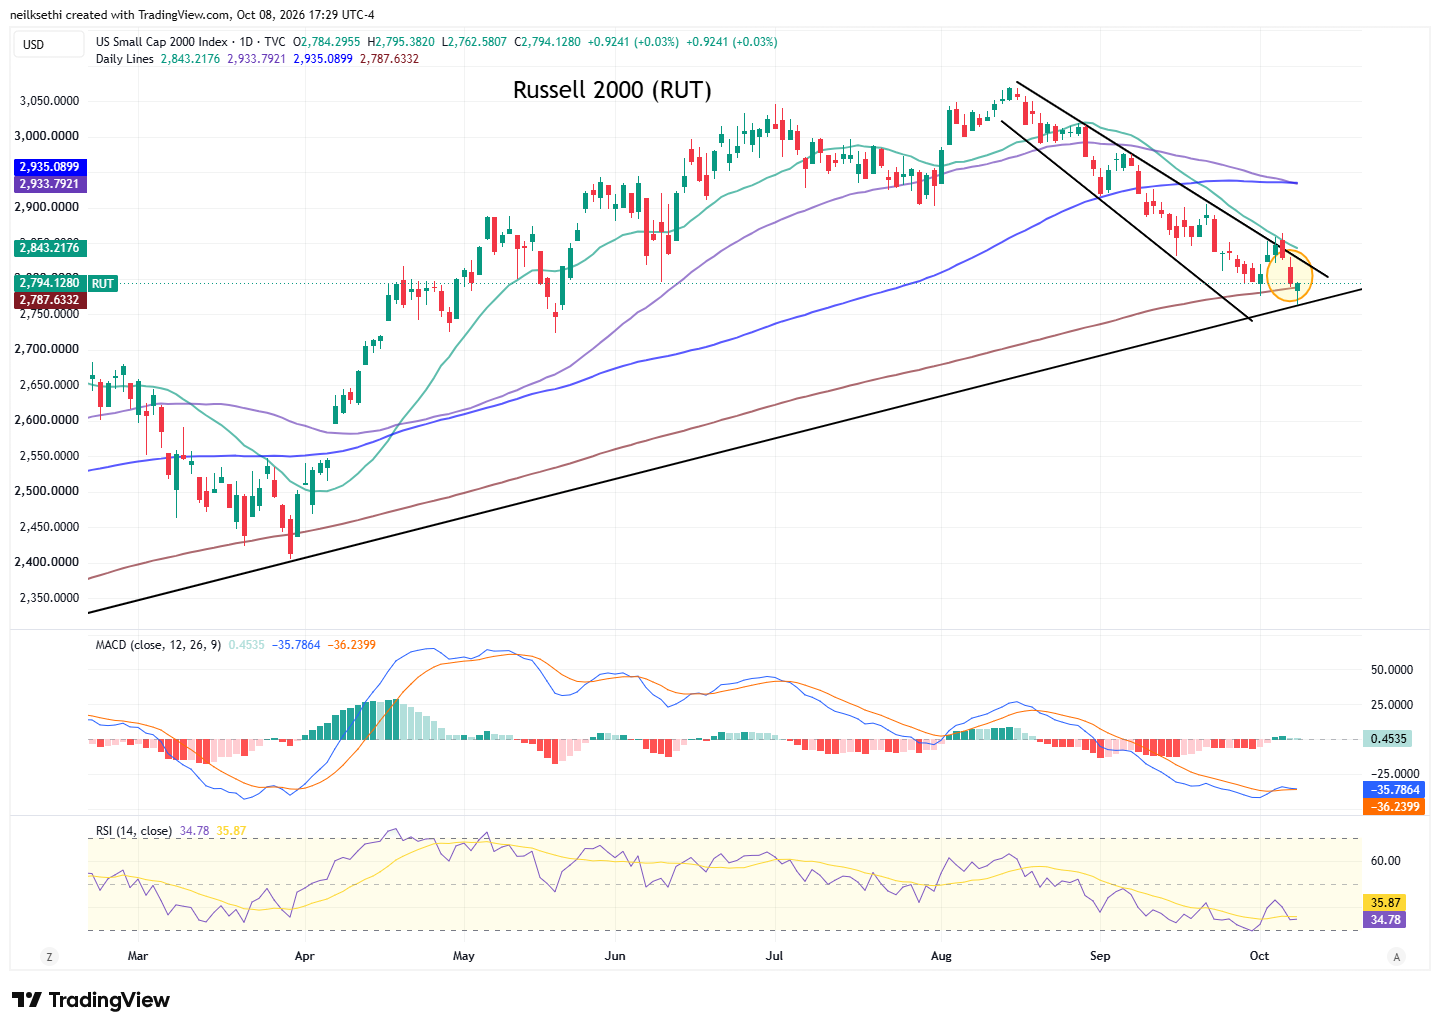
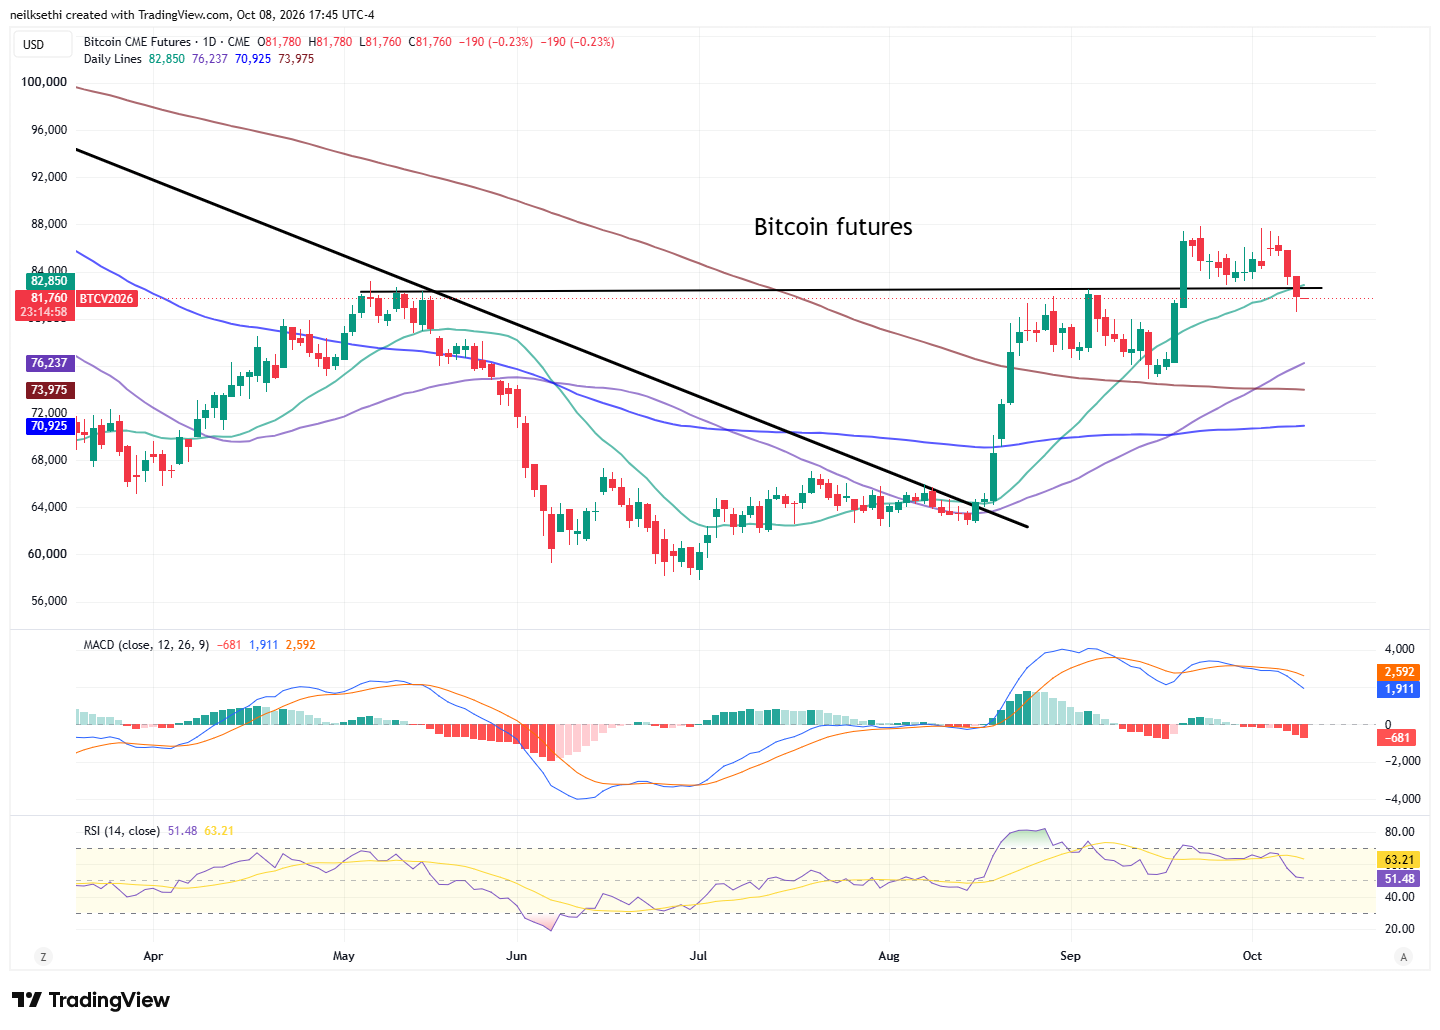
Note on all charts the colored lines are moving averages (the average price over the lookback period — days on the daily charts, weeks on the weekly charts): 20 = green 50 = purple 100 = blue 200 = brown
Exception is monthly charts where blue is 10-month moving average and brown is 20-month moving average.
MACD = Moving average convergence/divergence line, a measure of momentum that compares longer term and shorter term momentum to gauge if a move is strengthening or weakening. This is probably my favorite individual indicator.
RSI = Relative Strength Index (basically what it sounds like) = measures the strength of the move comparing gains to losses over the given lookback window (I use the standard 14 periods).
SPX eased back a second day from its all-time high. The daily MACD and RSI remain positive, and it remains above all moving averages I track.
NasdaqComposite had a similar story.
And theNasdaq 100 (QQQ), like the others falling back under its prior all-time high.
The Russell 2000 (RUT) fell under its 200-DMA but was able to bounce at its trendline from the April 2025 lows. The daily MACD remains neutral, but the RSI under 40.
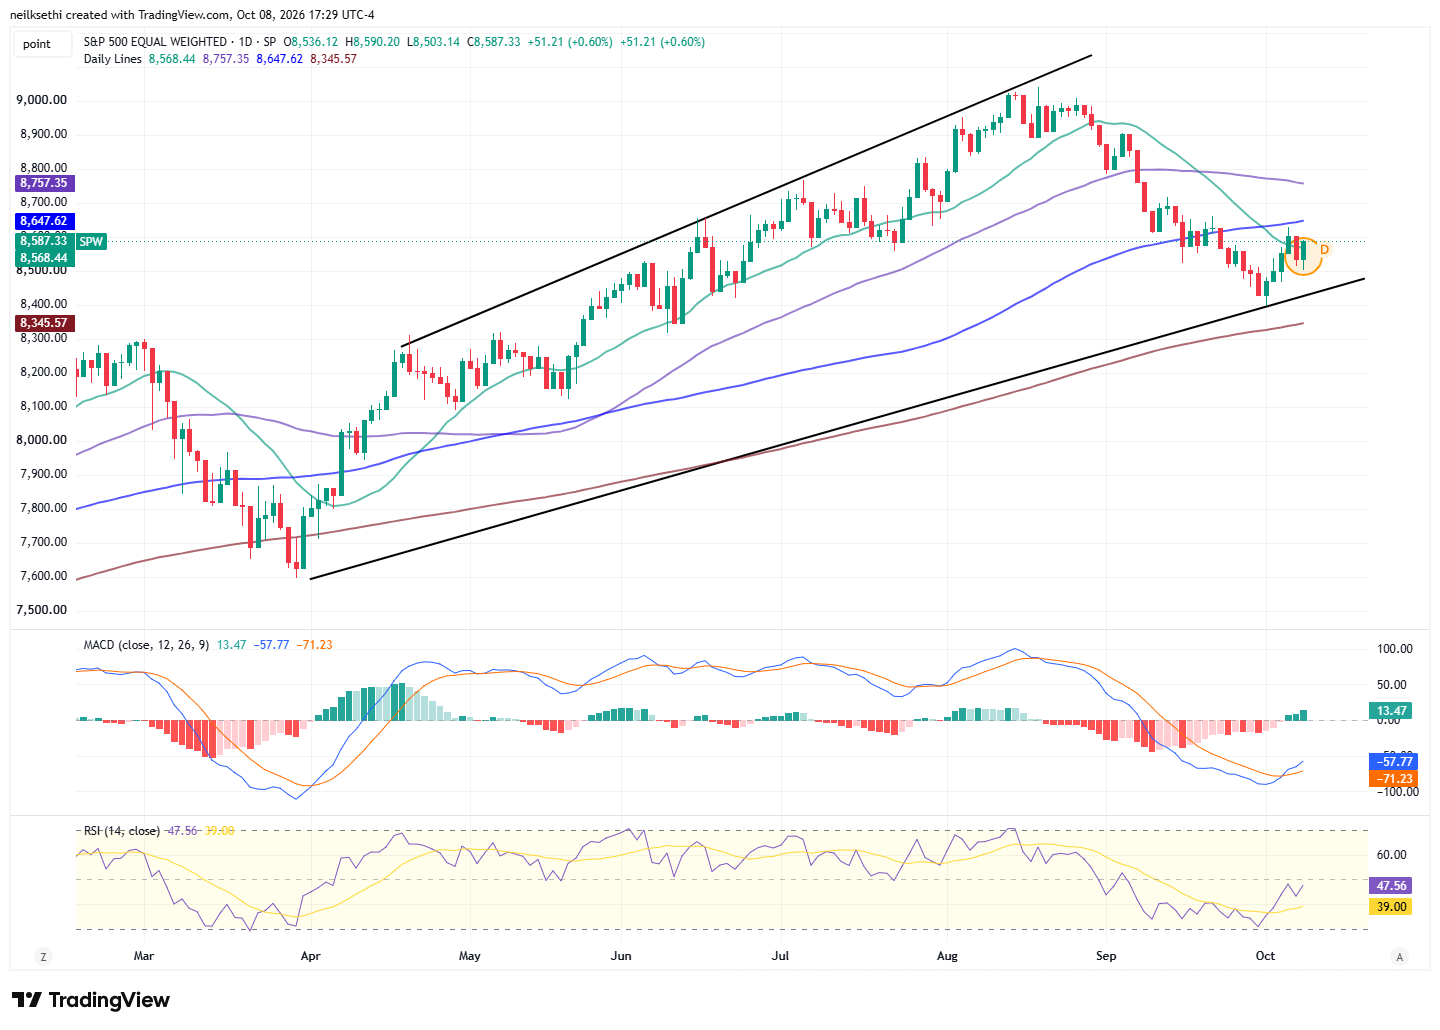
The equal-weighted SPX remains indecisive, not extending after clearing resistance but not falling back to support. It still has a positive MACD, and the RSI is near 50.
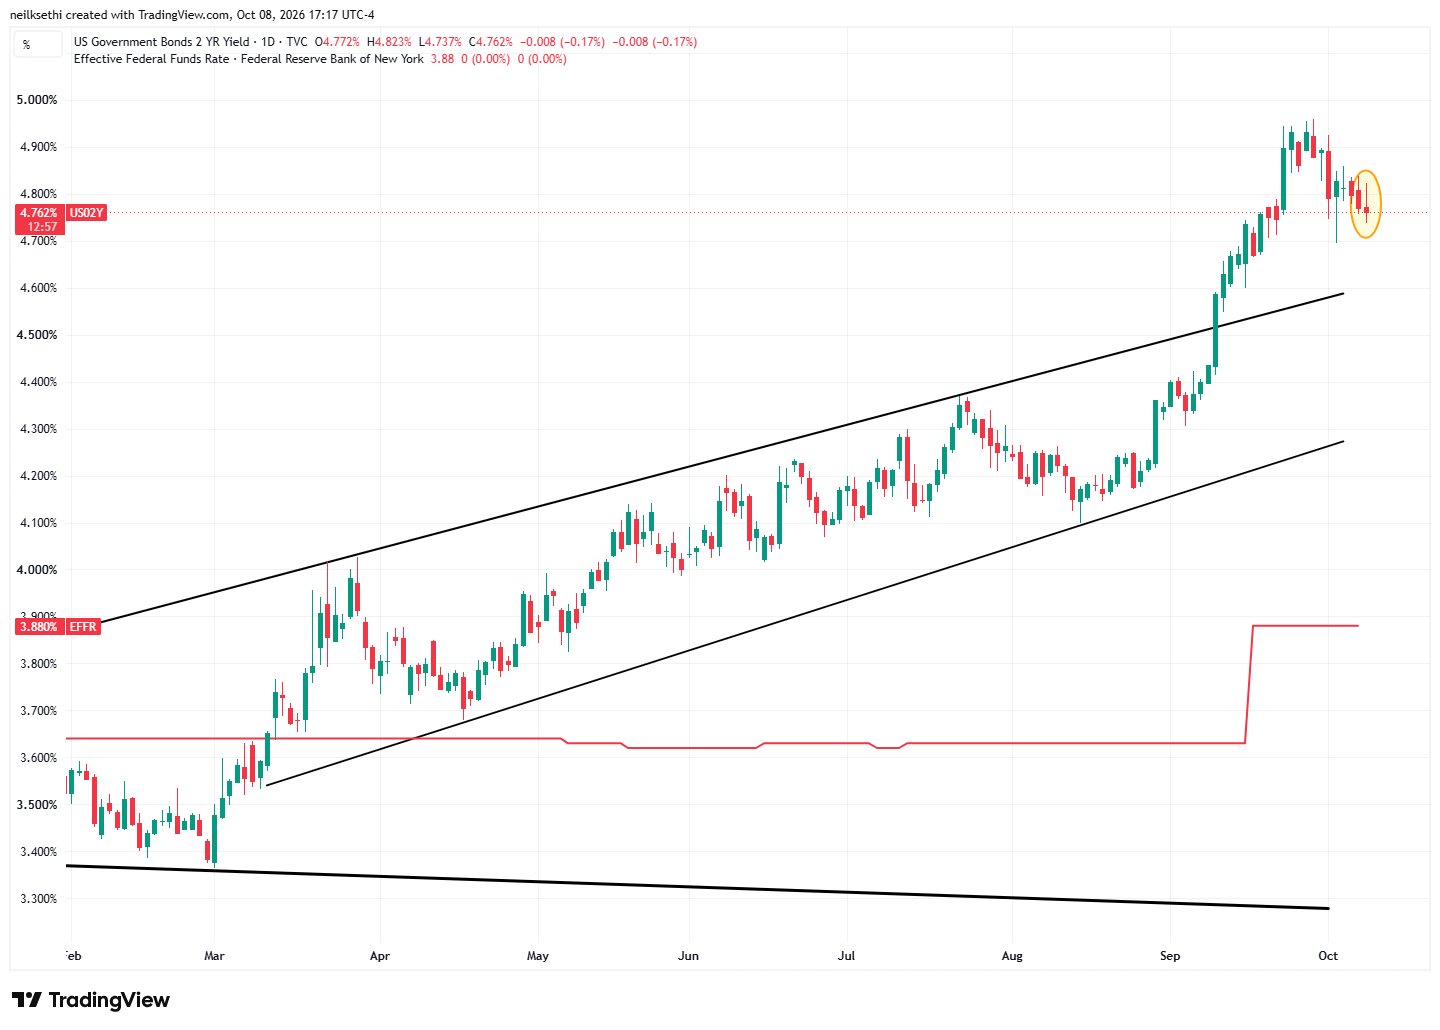
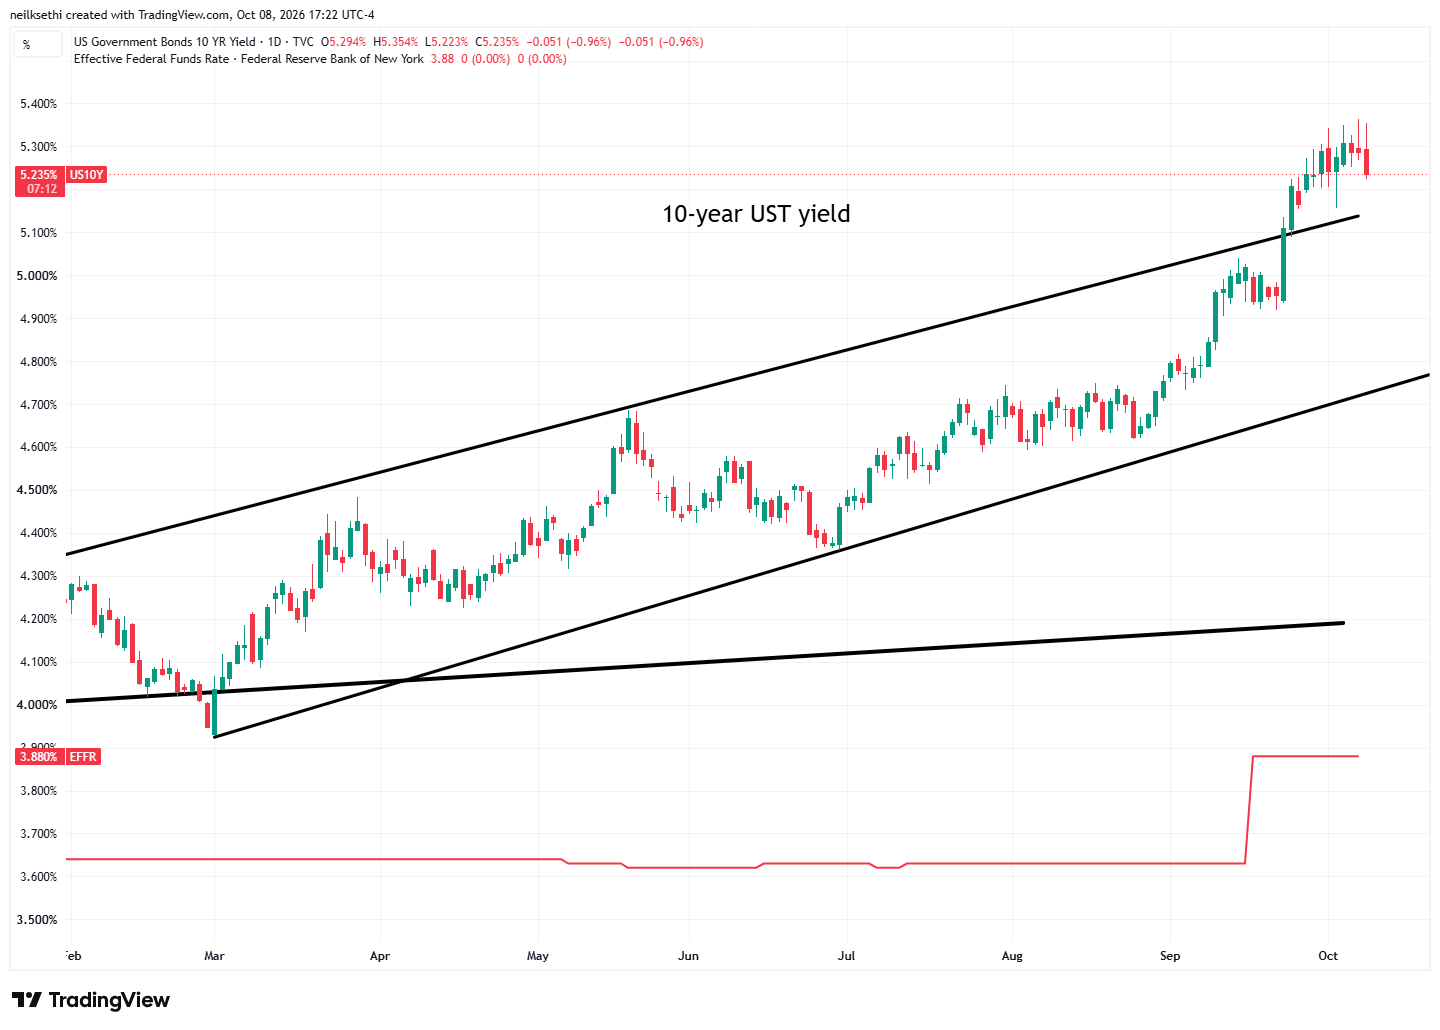
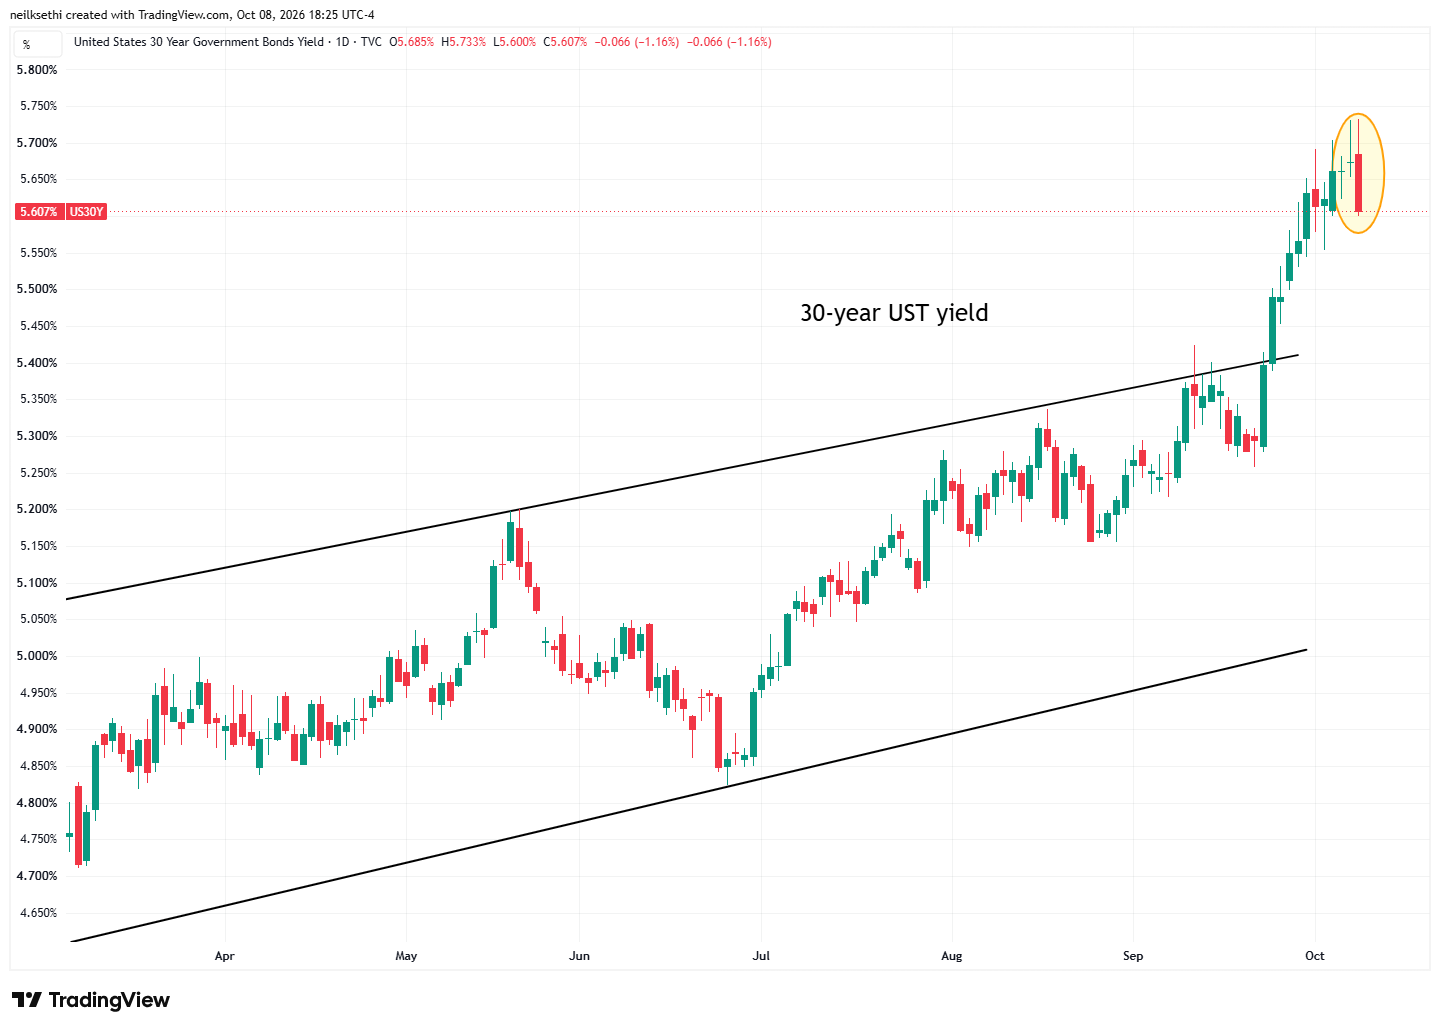
Treasury yields fell across the curve Thursday in a bull flattening (the short end falling less than the long end) after the relatively strong 30-year auction after Wednesday’s historically strong 10-year:
The 2-year Treasury fell around one basis point (including the after-hours) down for a fourth session.
It is still ~88 basis points above the Effective Fed Funds rate, so still calling for (at least a couple) more rate hikes but a little less violently now.
I mentioned in last night’s update that we hadn’t heard from Fed Governor Waller, who, while not a part of the “core” of the Fed, has been a leading voice, often out in front of where the FOMC is headed. In a Thursday speech at the Istanbul Economic Forum in Türkiye (link below), Waller didn’t disappoint, providing further clarity on where things are likely to be headed.
Waller said “I anticipate additional hikes to support a timelier return of inflation to our 2 percent goal. But there is some flexibility about when those hikes will occur. The hikes do not need to come at consecutive meetings, but they should be in place in an acceptable period of time.”
Here’s more detail on what he had to say if you’re interested:
Waller didn’t have much impact on Fed rate hike bets which were little changed with October at 17% and a 14% chance of two hikes this year. 2027 sees ~79 basis points of hikes through next December so slowly softening towards three hikes from here.
10-year yields eased for a third session to 5.24% (including after-hours), now seven basis points from the highest close since 2002 Monday.
30-year yields were down seven basis points to 5.60% (including after-hours), the first drop in a week from Wednesday’s highest close since May 2002.
And on today’s strong but not exceptional 30-year auction:
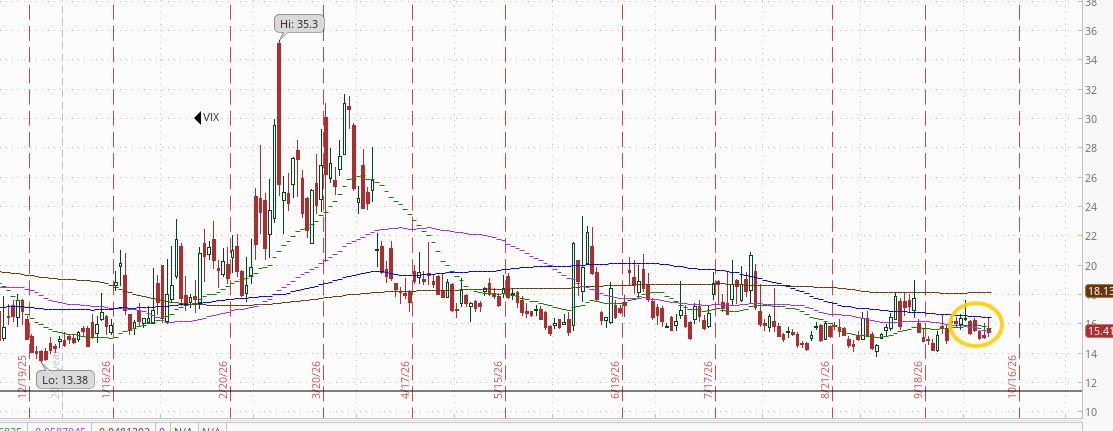
VIX edged higher for a second day to 15.4. That’s consistent with ~0.97% average daily moves in the SPX over the next 30 days.
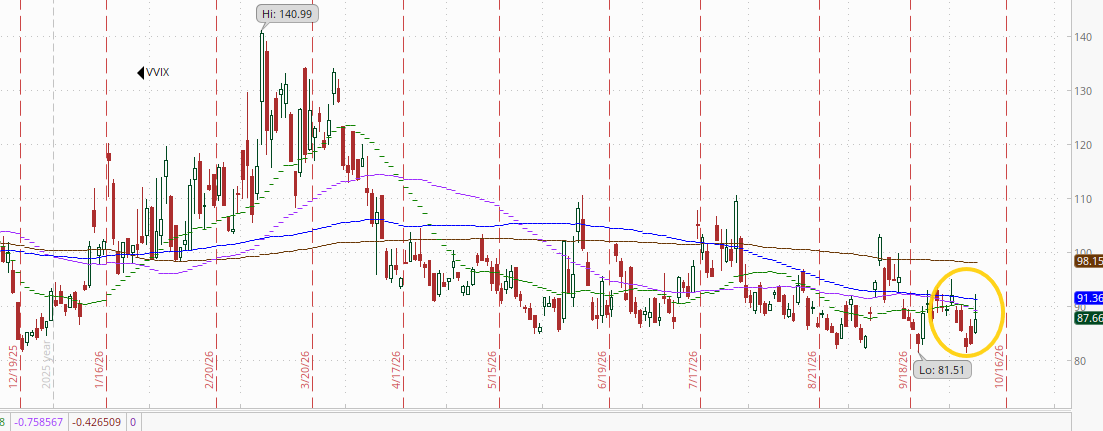
The VVIX (VIX of the VIX) also moved further off the lowest close since December on Tuesday to 87.7.
The current level is consistent with “moderate” daily moves in the VIX over the next 30 days (historically, normal is 80-100, although we haven’t been below 80 since July 2024). Above 100 is the level flagged by Charlie McElligott as indicating higher stress.
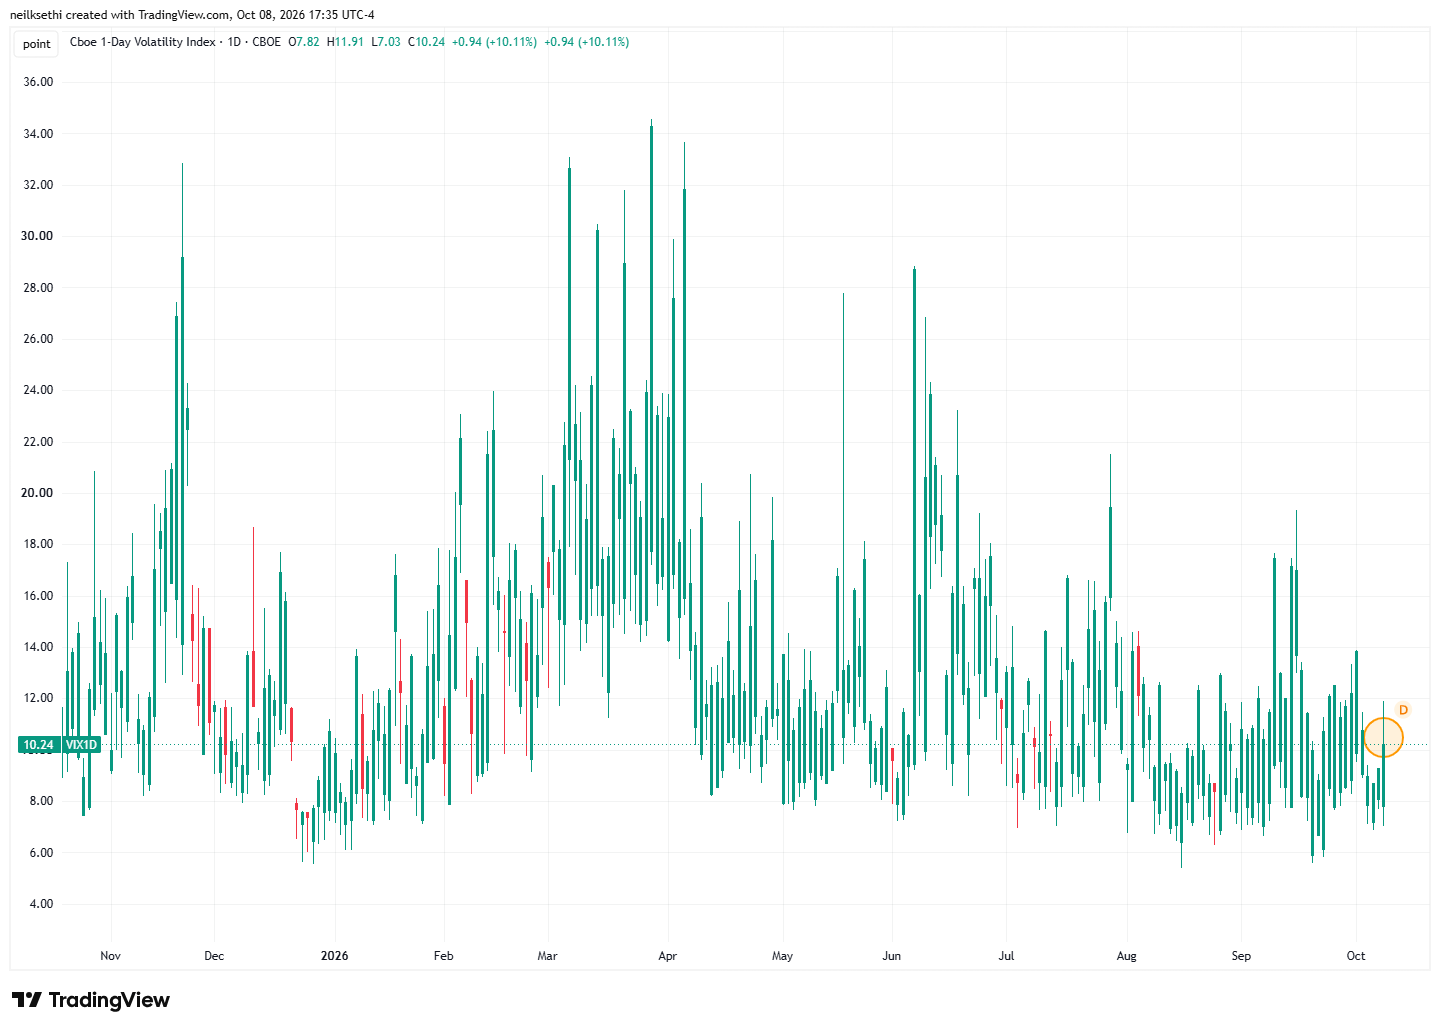
1-day VIX also edged higher to 10.2. The current reading is consistent with a move of 0.65% in the SPX next session.
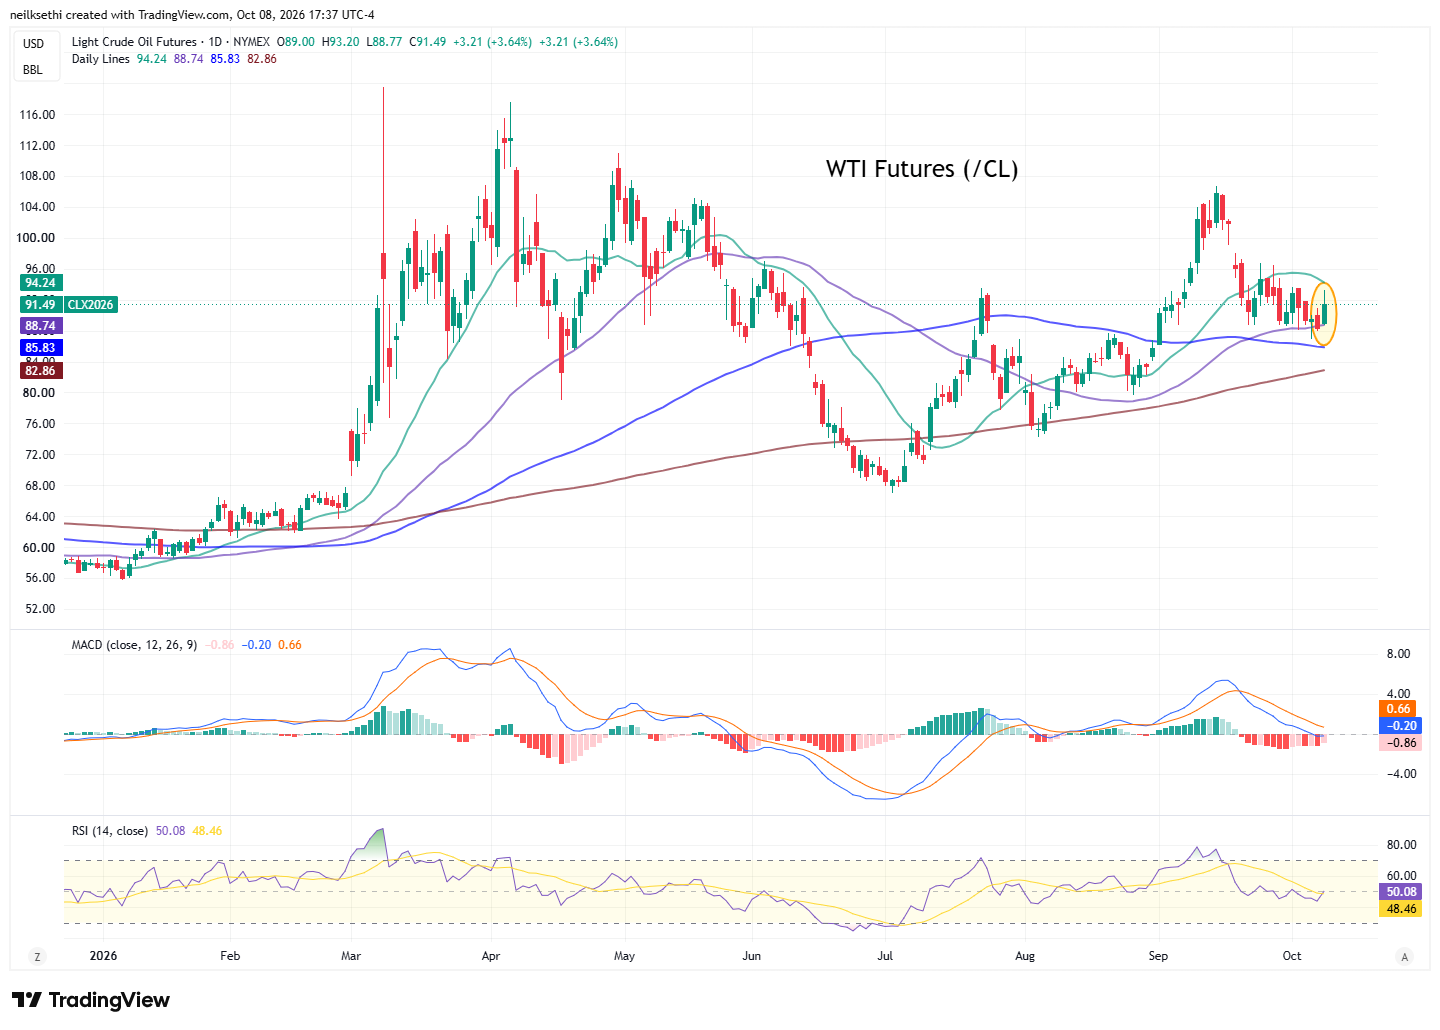
WTI futures (/CL) were up 3.6% (including after-hours) off the lowest close since August Wednesday.
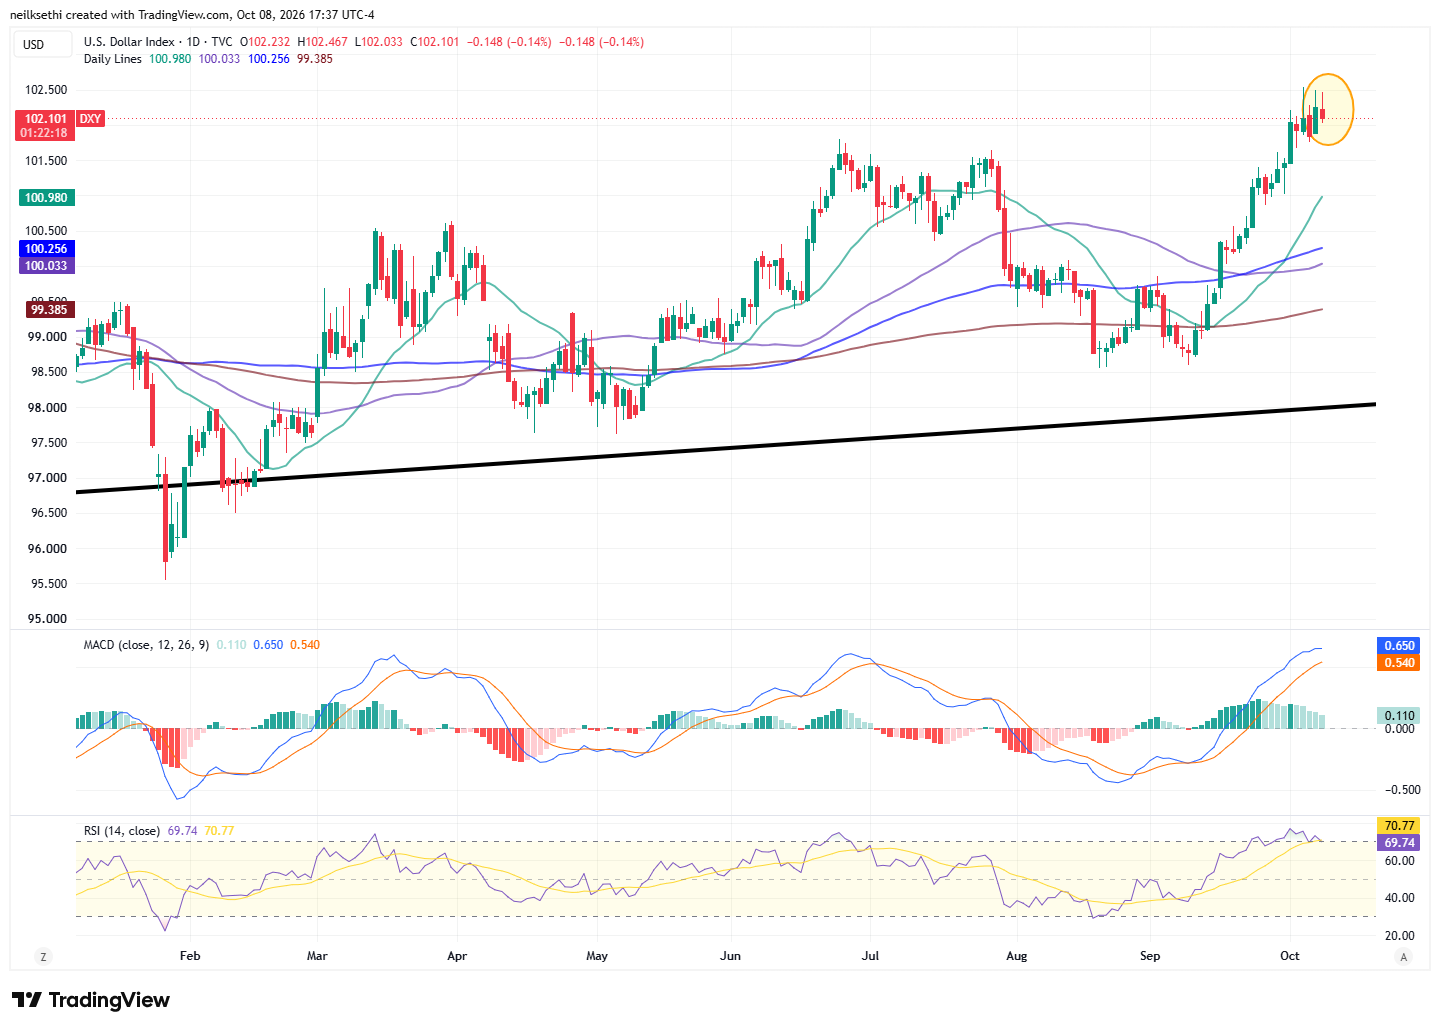
The DXY dollar index (which is fixed weighted with a heavy 57% weighting vs the euro) eased back from the highest close since April 2025 on Wednesday.
As I mentioned three weeks ago “The daily MACD remains positive and the RSI is above 60 so it continues to have strong technical support.” I mentioned Thursday “This opens up a run higher, although it’s the most overbought since September 2023.”
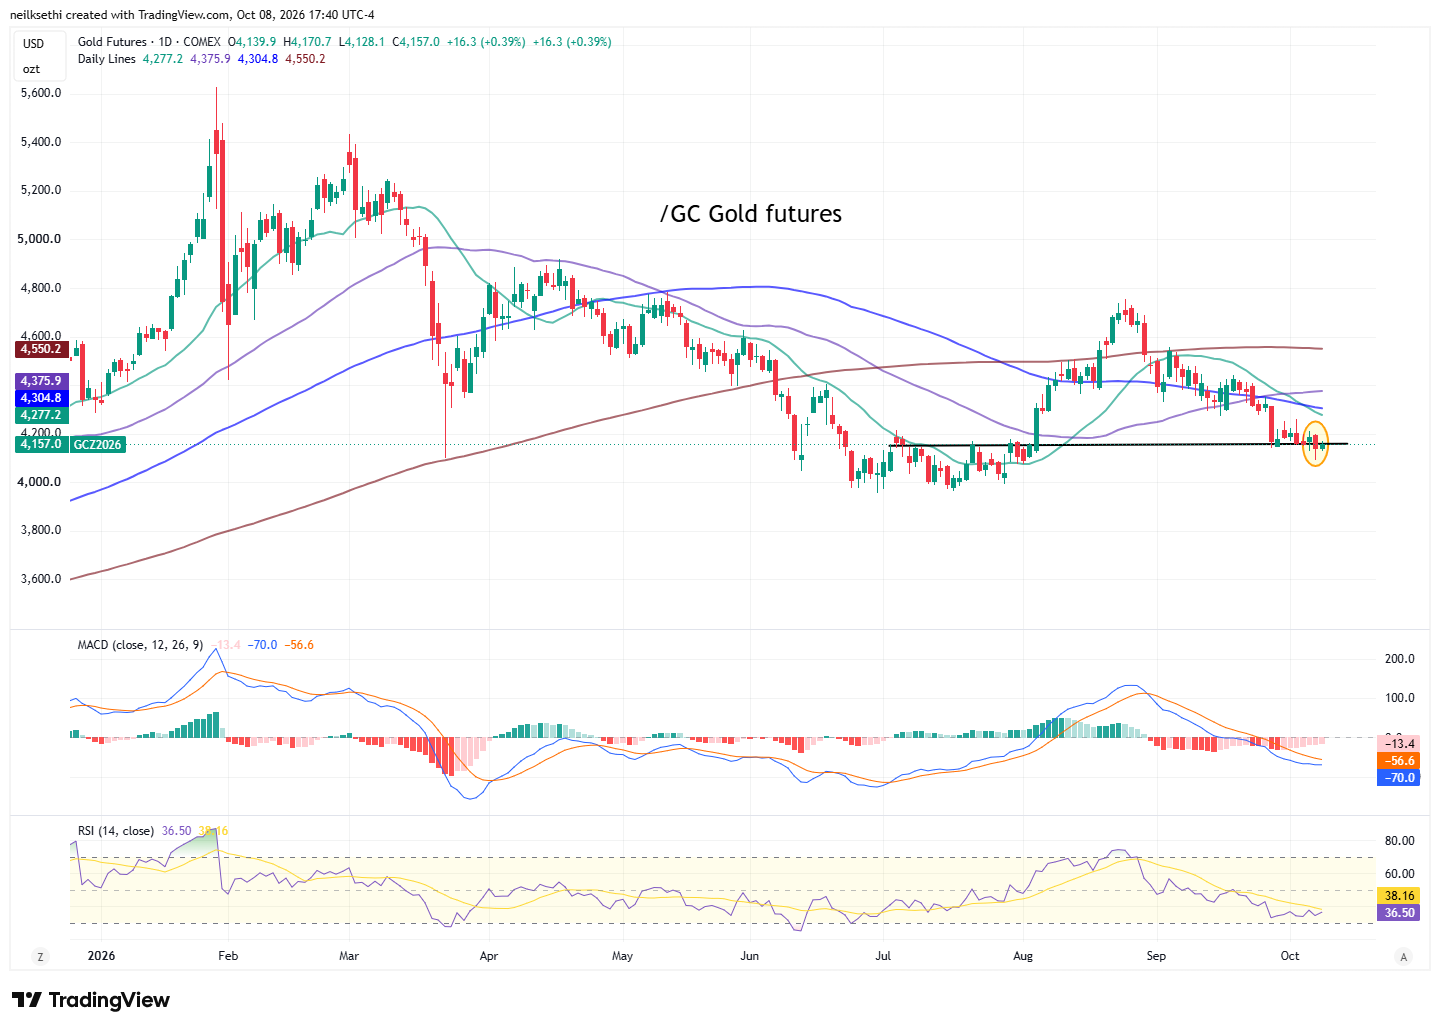
Gold futures (/GC) continue to crack under support, opening up a drop to test the lows of the year around $3,960. The daily MACD remains negative and the RSI is under 40, so that would be consistent with my comment Tuesday “not a lot of confidence that it holds, but you never know.”
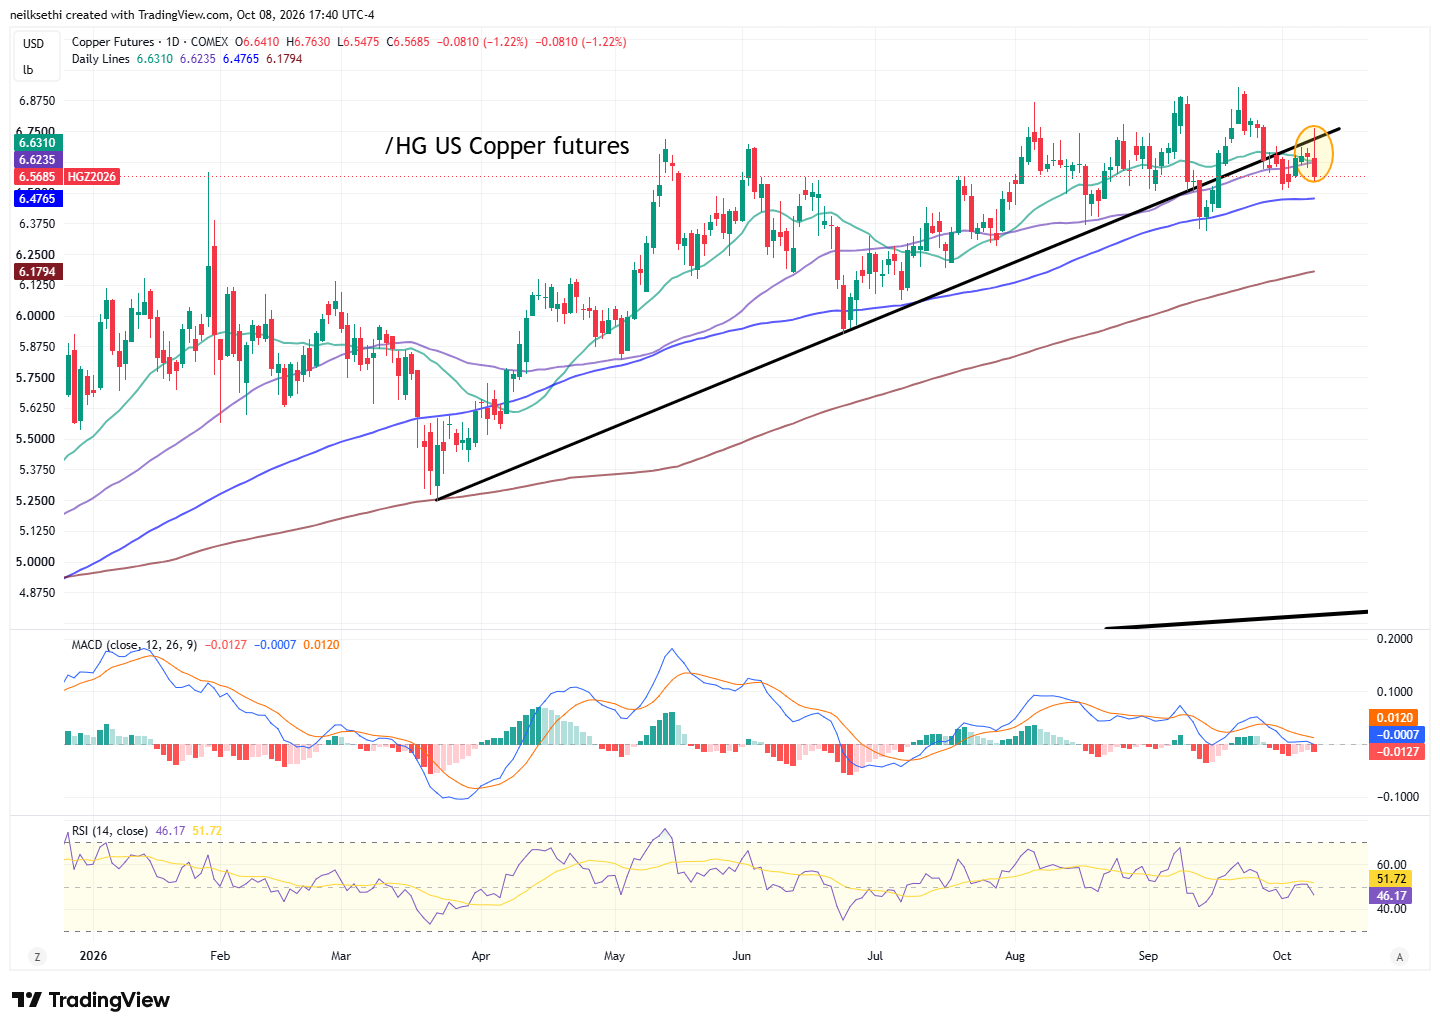
U.S. copper futures (/HG) eased back remaining range bound. Daily MACD and RSI tilt negative.
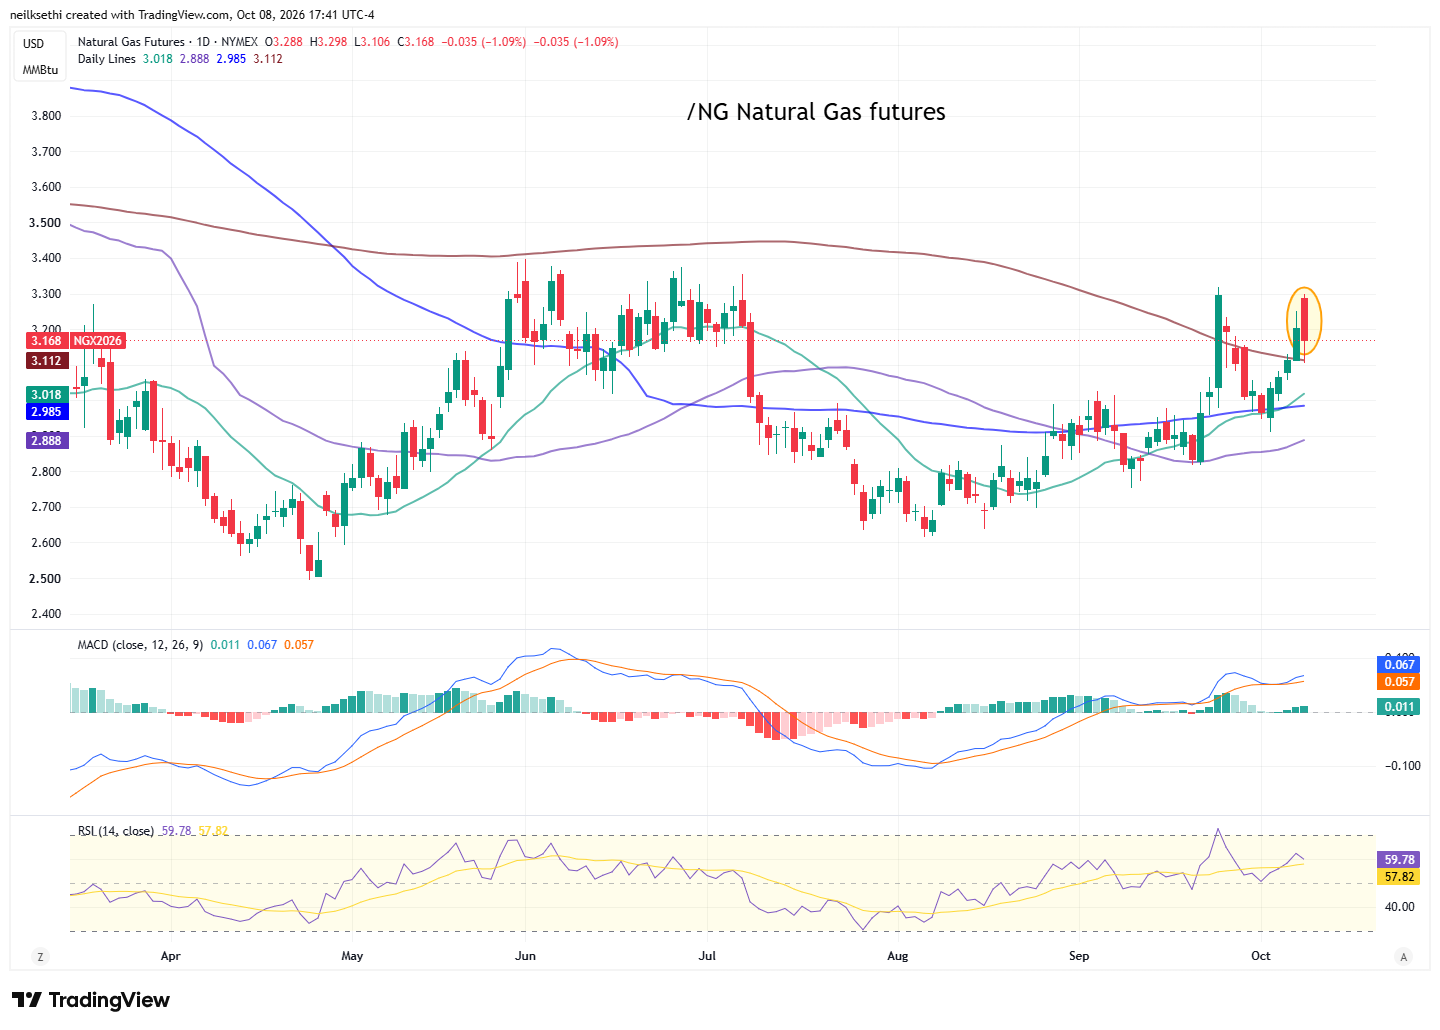
U.S. natural gas futures (/NG)wereup for a fifth daybefore reversing lower. Overall in their range since March.
I said Tuesday on Bitcoin futures that “bulls are looking for a close above $88,000, bears under $82,500.” Well the bears got their close. That opens up a retracement back to the 50-DMA. Daily MACD now more negative while the RSI has fallen sharply to near 50. I did sell my iShares Bitcoin Trust (IBIT) on the break of support. I’ll add it back if/when it reclaims that level or has a deeper correction.
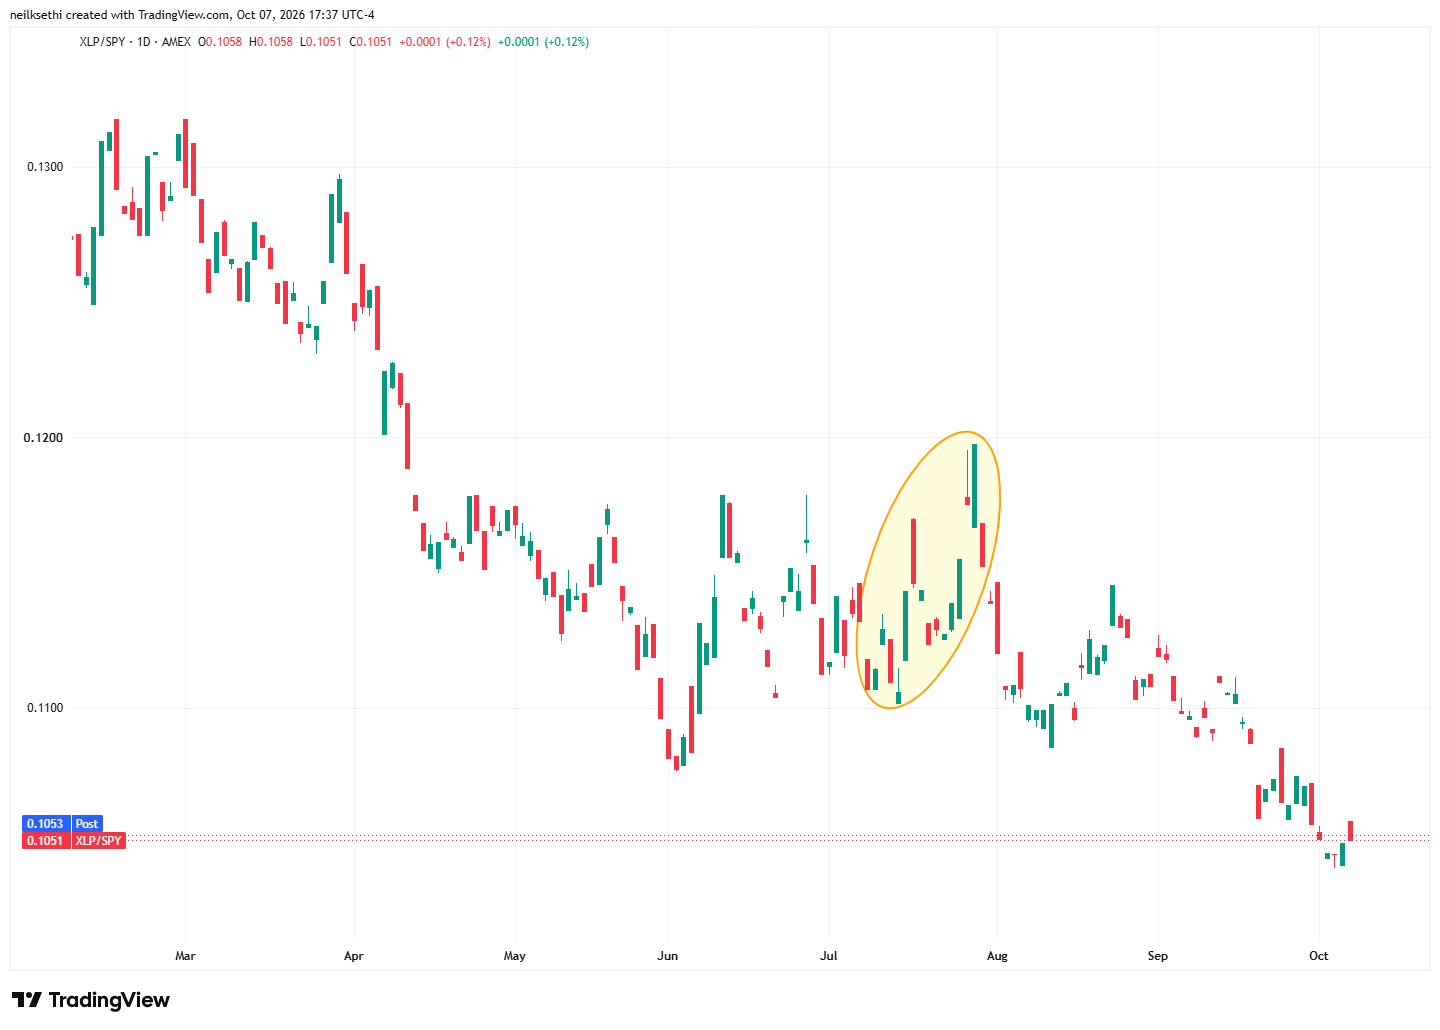
Today things turned weaker with the Tech trade taking a breather and all of the pro-cyclical sectors other than Consumer Discretionary falling with defensives leading. This is something we’ve seen from time to time, but it has yet to stick beyond a few days (remember Staples big outperformance vs the SPX at the end of July? — yeah, neither did I until I looked at the chart).
One day doesn’t even make a pattern let alone a trend, so let’s see how things go tomorrow. It’s a very light day with the possible exception of us getting something noteworthy on monetary policy from Governor Waller or a bad 30-year auction (which seems unlikely after the stupendous 10-year auction today).
So now we’ve had two days of weak Tech and strong Staples, etc., which counts as a pattern but not a trend. I probably don’t need to bore you with the litany of prior headlines (starting with DeepSeek) that have caused kerfuffles in the AI trade from time-to-time, so this seems another one.
Which is not to imply there’s no legitimacy. OpenAI is clearly in a second tier behind Anthropic and perhaps Google’s Gemini, and I do take seriously the idea that not all of these AI models are going to survive. Given the amount of compute OpenAI is on the hook for, their demise would likely not come without a lot of disruption.
But that said, we’re a long, long way off from anything like that. If anything this just makes their spending all the more critical to catch up. And let’s not pooh-pooh a $50 billion revenue run rate. That’s still incredible, just not as incredible as we thought it might be.
So for now this is just another headline scare that will likely fade as they have in the past. For bears it’s a reason to stay out of the AI trade. I want to be a participant, so I didn’t sell anything unless it hit technical sell points (and I did as much buying as selling today).
Tomorrow is an even lighter session than today, so we’ll see what we get.
The Day Ahead: Another Light Day to End the Week
U.S. economic data Friday just the preliminary UMich consumer sentiment index for October.
Fed speakers also lighter with just regional Fed presidents Schmid and Collins, neither FOMC voters until 2028.
Non-Bill (>1yr in maturity) USTreasury auctions done for the week.
One SPX component reporting Friday in Delta Air Lines (DAL).
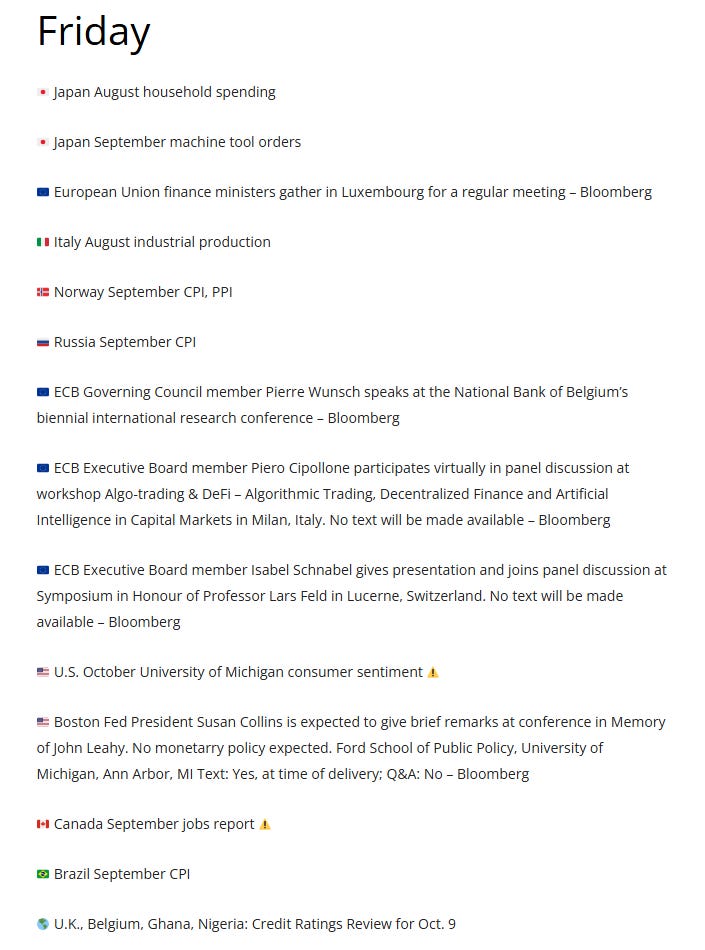
Ex-U.S. highlights include Japan August household spending, September machine tool orders, Italy August industrial production, Canada September labor force survey, Sweden August GDP indicator, Norway September CPI.
At the time of publication, in terms of equities mentioned, Sethi was long NVDA, MU, QQQ, SPY, RSP, IWM, CPER, IBIT, and numerous equities in the energy sector.
As a reminder comments are encouraged. If they are directed at me, please put @NeilSethi in front.
I mentioned in last night's update that we hadn't heard from Fed Governor Waller, who, while note a part of the "core" of the Fed, has been a leading voice, often out in front of where the FOMC is headed.
In a Thursday speech at the Istanbul Economic Forum in Türkiye (linkShow more
investingLive
@investingLive_
Fed's Waller says more hikes are needed but can be flexible about the pace, downplays September NFP weakness
investinglive.com/central-banks/…
"Nearly €215 billion ($241 billion) of France’s corporate bonds now trade as if they were safer than the government’s, an almost 18-fold increase since the start of 2026."
"Some 38% of France’s total pool of high-grade company debt was indicated at lower yields than governmentShow more
LiveSquawk
@LiveSquawk
France’s Debt Is Now Riskier Than 38% Of Nation’s Company Bonds - BBG
bloomberg.com/news/articles/…
After Wednesday’s historically strong 10-year auction (and a similarly good 30-year last month) my expectations were high for today's $22 billion auction in 30-years which came in very solid, but not exceptional, a step back from September.
That was despite a clearing yield ofShow more
investingLive
@investingLive_
US treasury sells $22 billion of 30 year bonds at a high yield of 5.618%
investinglive.com/news/us-treasu…
Panmure Liberum’s Joachim Klement making waves Thursday calling for a 36% crash to 5,000 for the SPX in 2027 or 2028 as the AI bubble (his term) bursts.
Hyperscalers’ free cash flows are largely depleted, while the cost of debt is rising quickly and becoming prohibitive forShow more
The Thursday Brief from @C_Barraud also contained a story on Samsung shares falling 2.4% Thursday despite a nearly 9x increase in quarterly operating profit, as that fell just short of analysts' extraordinary expectations.
Full results will be published Oct. 29, but the companyShow more
BofA's Subramanian says "the easy money in capex vs consumption has been made," and "it's time to selectively pivot, as it is dangerous to underestimate the appetite of US consumers and capex strength may be more priced in than not."
Long-only fund positioning vs. historyShow more
"Investors are aggressively betting on a sudden turnaround in interest rates, and they’re using call options on exchange-traded funds tied to utilities stocks and long-dated Treasury bonds to do it."
Trading volume in call options tied to popular ETFs like the iShares 20+ YearShow more
MarketWatch
@MarketWatch
Options traders are betting on a dramatic drop in interest rates trib.al/c85rG8Z