Chart of the Day: Keep a Close Eye on Axon
The stock is back in familiar territory, where dip buyers got very aggressive. Here’s what to watch now.
You've reached your free article limit
You've read 0 of 1 free Pro articles.
This $400 level on Axon Enterprise (AXON) has been quite interesting. Earlier this year on a few occasions the price was simply too compelling to pass up and buyers stepped in to pick up shares.
See where the arrow ends on the top pane on the chart below. You see the big bar in late May? That was an earnings surprise, but still showed where dip buyers wanted to step in and buy the stock. We are back to that level now and I suspect big money is looking very carefully here at Axon for a purchase.
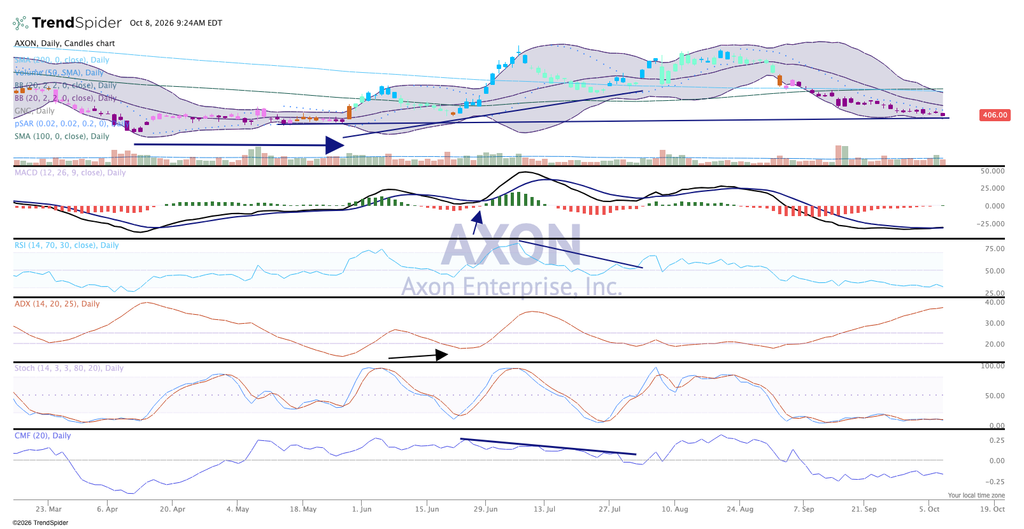
The chart shows bearish indicators. Of course, after a recent slide the candles are purple, as you can see at the top of the chart. This color is bearish on the GoNoGo composite of indicators. Below, you can see the moving average convergence divergence is on the floor. At the bottom or the chart, money flow is weak. The Relative Strength Index, or RSI, is nearly as low as it was back in March. We do not believe these represent a buy signal, however, watch this price level to see if interest is there. A few big buy days with volume would clue us in that this stock may soon rise, but watch it closely.
We like Axon Enterprise in Pro Portfolio and rate it a one, buy at anytime.
At the time of publication, the Pro Portfolio was long AXON.
