Homebuilder Sentiment Falls to Lowest Since 2012
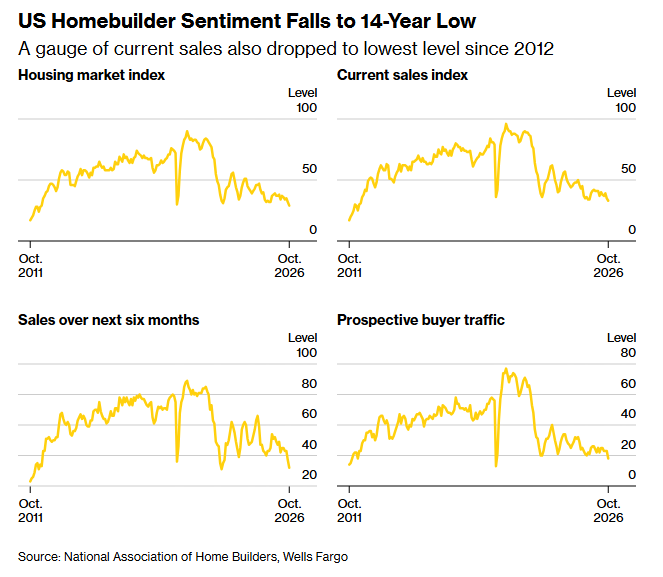
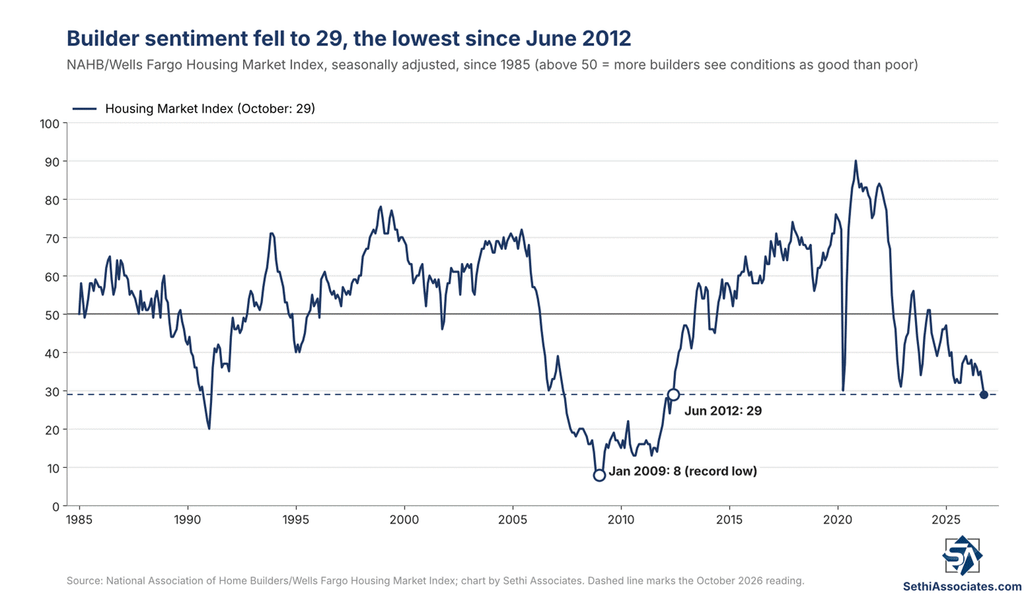
NAHB’s Housing Market Index falls to 29 in October, with all three components also hitting multi-year lows even as 43% of builders cut prices.
You've reached your free article limit
You've read 0 of 1 free Pro articles.
U.S. NAHB Housing Market Index October: 29 (estimate 31; previous 32)
Executive Summary
- The NAHB/Wells Fargo Housing Market Index fell 3 points in October to 29, the lowest level since June 2012, and below the 31 median estimate in a Bloomberg survey of economists. It has been below the 50 line dividing poor and good conditions for a 30th consecutive month, and below 40 for an 18th straight month, the longest such stretch since 2012.
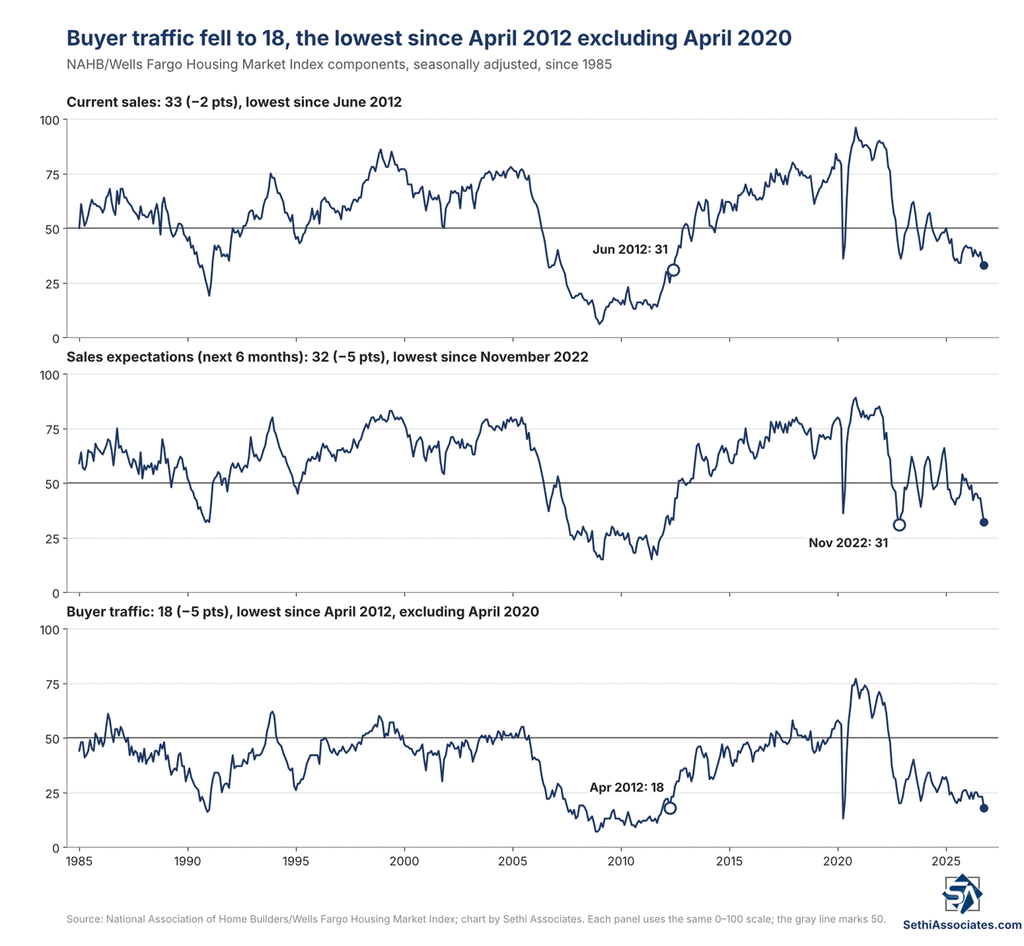
- All three components fell, with current sales at the lowest since June 2012, sales expectations at the lowest since November 2022 and buyer traffic at the lowest since April 2012, excluding April 2020.
- 43% of builders cut prices, “the highest share during the 2020-2026 period,” while the average price cut held at 6% for a seventh consecutive month and 65% of builders used sales incentives.
October Housing Market Index
The NAHB home builder Housing Market Index fell 3 points in October to 29, the lowest since June 2012, and below the 31 median estimate in a Bloomberg survey of economists. It remains well below the 50 dividing line between poor and good conditions for a 30th consecutive month, and below 40 for an 18th straight month, the longest such stretch since 2012.
Components
All three components fell in October.
- Current sales fell 2 points to 33, the lowest since June 2012. It hasn’t been above 50 since January 2025.
- Sales expectations for the next six months dropped 5 points to 32, the lowest since November 2022, and a 10th consecutive month below the 50 breakeven.
- Buyer traffic fell 5 points to just 18, “its lowest level since April 2012, excluding the pandemic’s onset in April 2020,” according to NAHB Chief Economist Robert Dietz. It hasn’t been above 50 since May 2022.
Price Cuts and Incentives
The decline in current sales came even as 43% of builders cut prices in October, up from 38% in September and “the highest share during the 2020-2026 period,” according to NAHB. The average price cut held at 6% for a seventh consecutive month. The use of sales incentives slipped to 65% from 66% in September, but was the 19th straight month at least 60% of builders have used some sort of sales incentive.
Message From the NAHB
“Mortgage rates have climbed well above 7% in recent weeks, and higher gas prices and inflation have further weakened buyer traffic across much of the country,” said NAHB Chairman Bill Owens, a home builder and remodeler from Worthington, Ohio. “Though builders are also contending with higher costs for construction loans, building materials and diesel, the Trump administration’s efforts to advance regulatory reform are helping to ease some of the cost pressures they face. Nationwide, more than one-third of builders reported immigration enforcement activity in their market areas during the past month, causing construction delays and discouraging legal workers from reporting to work.”
“Housing remains squeezed by supply-side constraints and significant affordability challenges,” Dietz said. “Demand persists, but higher mortgage rates, elevated construction costs and weaker consumer confidence are keeping more buyers on the sidelines.”
Regions
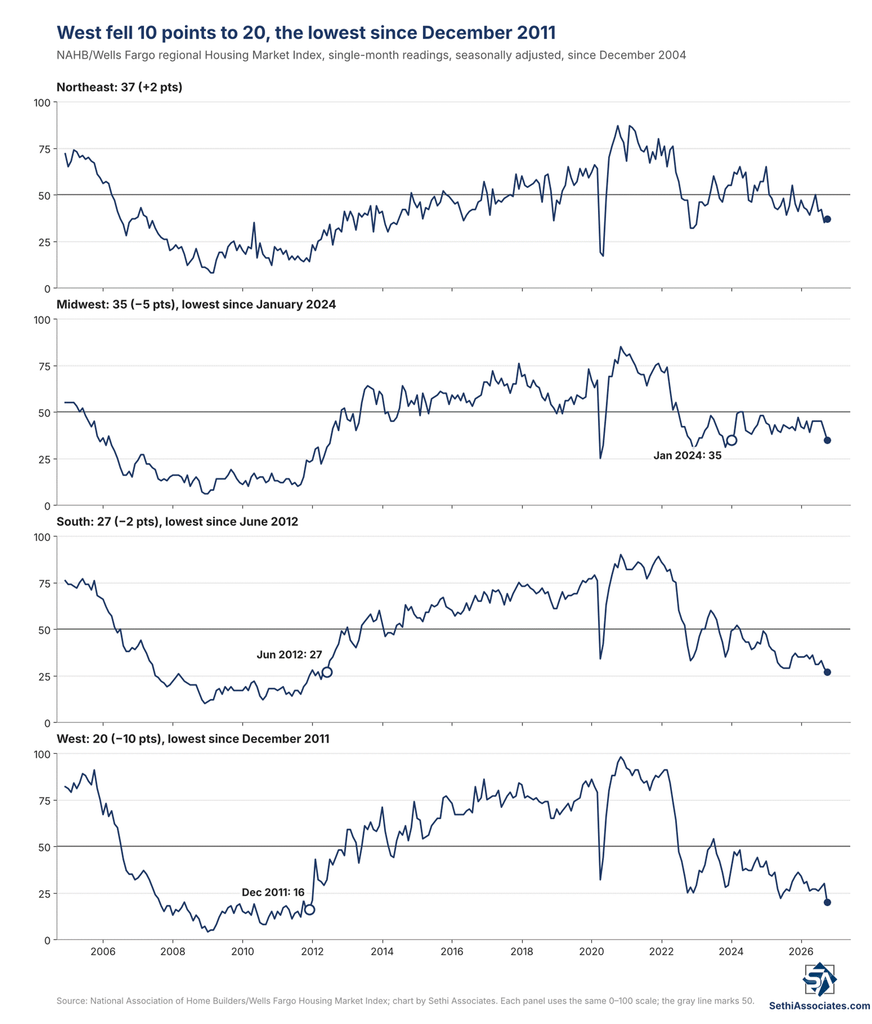
Builder confidence fell in three of the four major regions in October, on single-month readings.
The West fell 10 points to 20, the lowest since December 2011, after an upward revision to September to 30.
The South, by far the largest homebuilding market, fell 2 points to 27, the lowest since June 2012.
The Midwest fell 5 points to 35, the lowest since January 2024, after a downward revision to September to 40.
The Northeast rose 2 points to 37 from the lowest since January 2023.
Read the full NAHB release here.