Hot CPI Puts October Rate Hike Back in Play
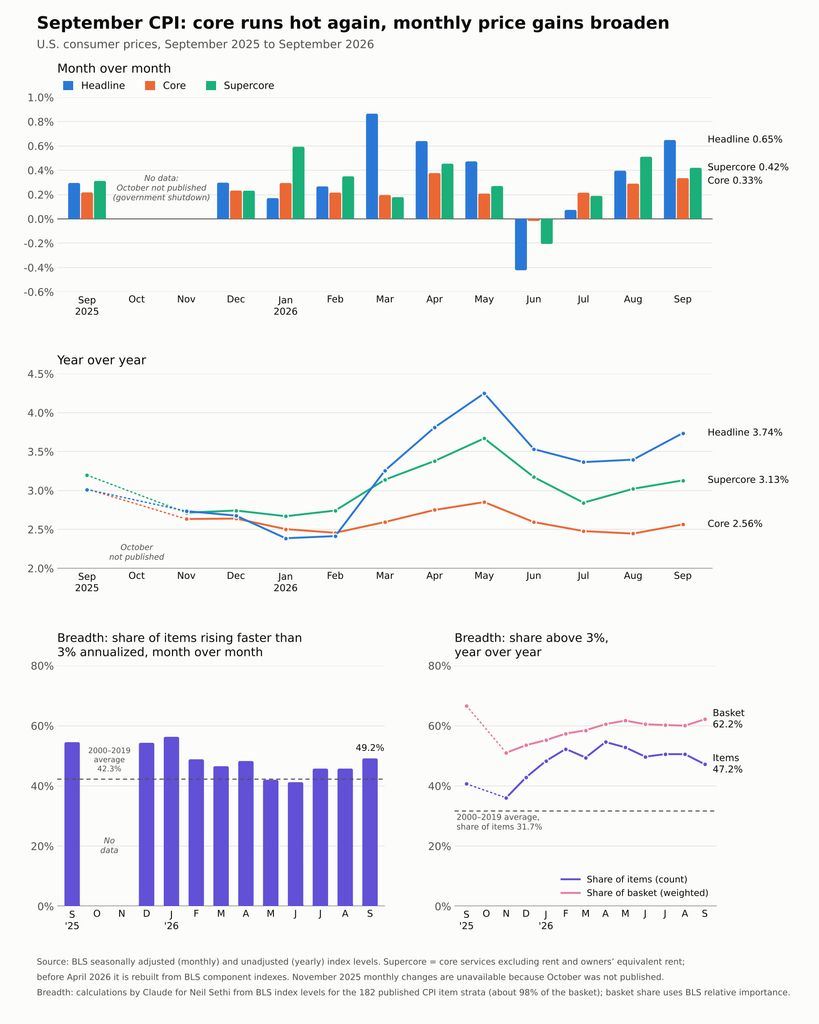
Core rises 0.33% for a second hot month as gains spread well beyond energy. October rate-hike odds more than doubled.
You've reached your free article limit
You've read 0 of 1 free Pro articles.

— U.S. CPI, September (month-over-month): 0.6% (estimate 0.6%; prior 0.4%)
— CPI (year-over-year): 3.7% (estimate 3.6%; prior 3.4%)
— Core CPI (month-over-month): 0.3% (estimate 0.2%; prior 0.3%)
— Core CPI (year-over-year): 2.6% (estimate 2.5%; prior 2.4%)
— CPI Supercore (month-over-month): 0.42% (prior 0.51%)
— CPI Supercore (year-over-year): 3.13% (prior 3.02%)
Executive Summary
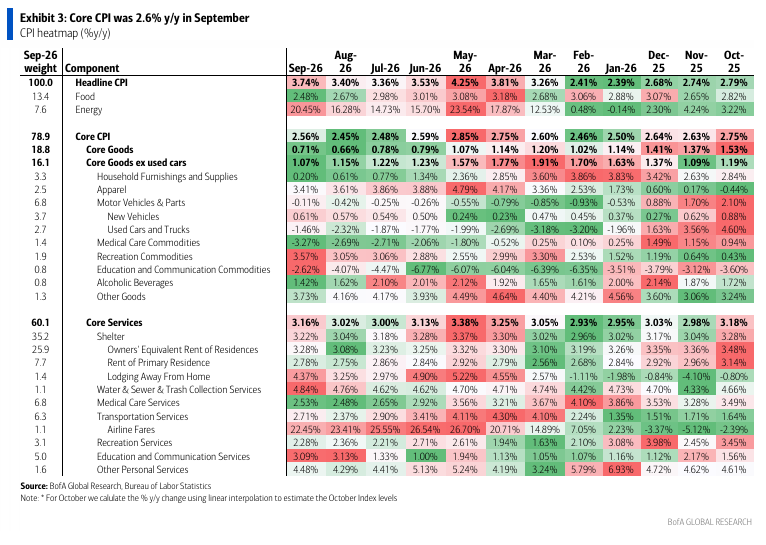
Headline (barely) in line, annual rate hot. Headline consumer prices rose 0.649% in September, just rounding down to the 0.6% expected, but still the most since March and after a 0.40% gain in August. Prices were up 3.74% from a year earlier, the most since May and above the 3.6% expected, after 3.40% in August.
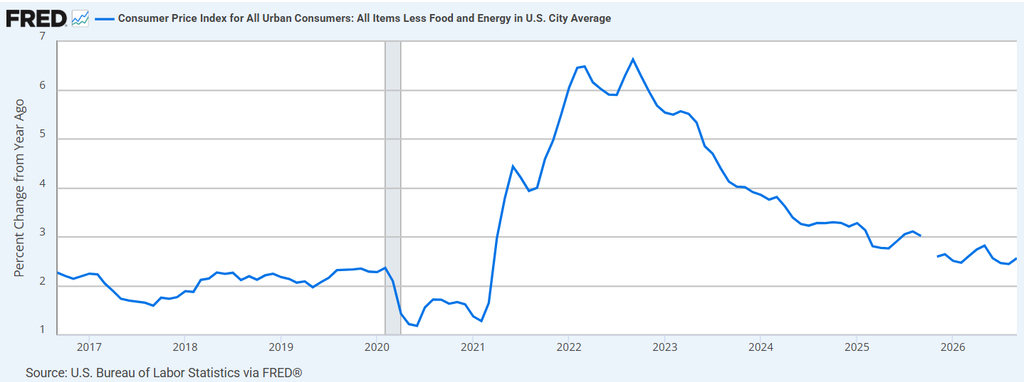
Core ran hot again. Excluding food and energy, prices rose 0.33%, the most since April, against the 0.2% expected. Only 11 of 73 economists in Bloomberg’s survey had forecast 0.3%. Core was up 2.56% from a year earlier, the most since June, after 2.45% in August and above the 2.5% expected.
Gasoline drove the headline. Energy rose 5.20%, the most since March, with gasoline up 9.09%, which the Bureau of Labor Statistics said accounted for “over half of the monthly all items increase.” Energy is up 20.45% from a year earlier, the most since May.
The gains spread out. Bloomberg’s Enda Curran wrote that “unlike in previous months when inflation could be pinned on one offs (like the cellphone impact in August) the pressures seem evident across the board here.” Car and truck rental rose the most since June 2021, toys posted their largest monthly increase on record, used cars rose the most since October 2025, and motor vehicle insurance rose for the first time since April.
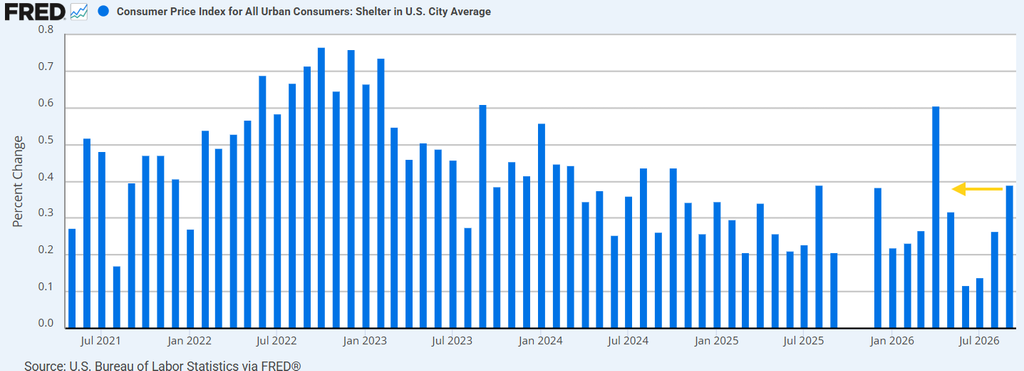
Shelter firmed. Shelter rose 0.39%, the most since April (and second most since October 2024), with owners’ equivalent rent up 0.35%, also the most since April, and rent up 0.25%. Annual shelter inflation rose to 3.22% from 3.04%.
Supercore stayed elevated. Core services excluding housing rose 0.42% after 0.51% in August, and 3.13% from a year earlier, the most since June. Bloomberg noted that in the five years through 2019, the gauge never rose more than 0.39% in a month.
Breadth: wider on the month, narrower on the year. By Claude’s calculations, 49.2% of CPI item categories rose at an annualized pace above 3% in September, the most since January, up from 45.8%. On a year-over-year basis, though, the share fell to 47.2%, the lowest since December, from 50.6%, but remains well above the 31.7% average of 2000 to 2019, a pre-pandemic comparison Chair Kevin Warsh has highlighted.
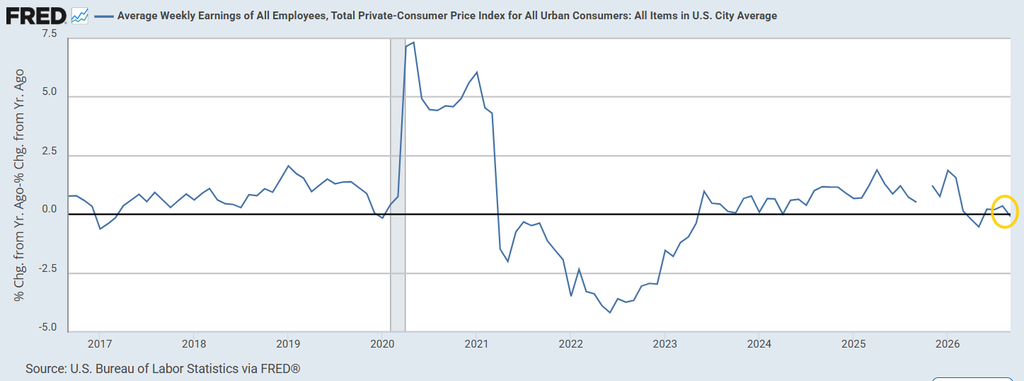
Real paychecks slipped. Real average weekly earnings fell 0.51% from August and 0.09% from a year earlier, the first annual decline since May.
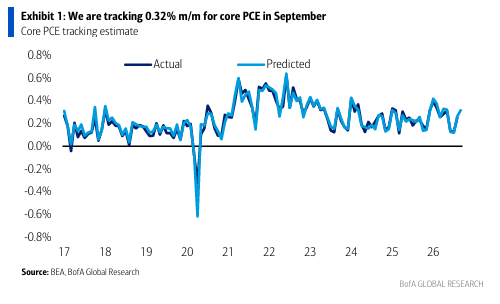
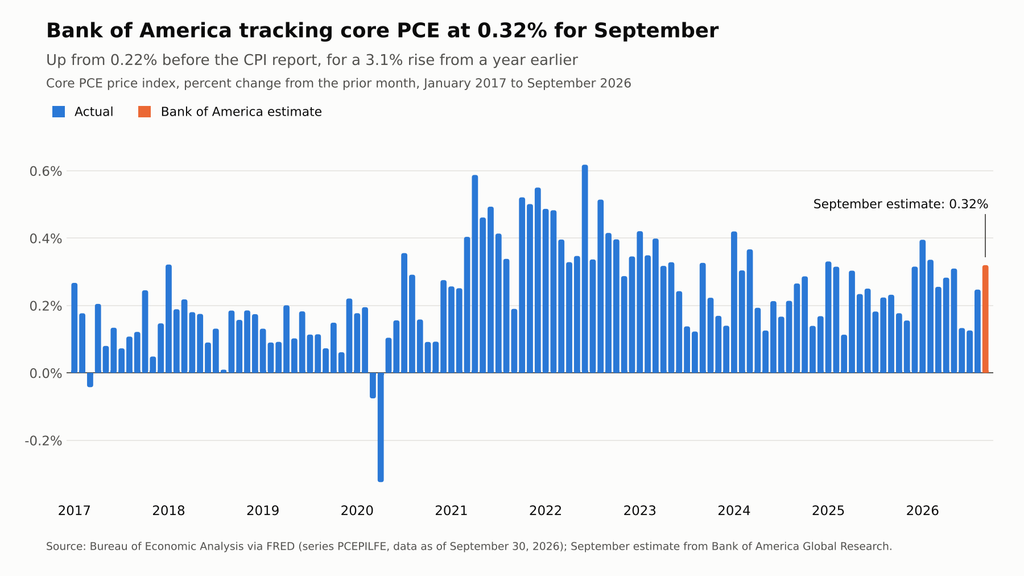
Core PCE. Bank of America raised its tracking estimate for core PCE, the gauge the Fed officially targets, a full tenth of a percent point to 0.32% for September from 0.22%, or 3.1% from a year earlier, and reaffirmed its call for an October rate hike.
The Fed angle. Markets doubled the odds of a hike at the October 27–28 meeting to 44% from 22% on Tuesday and priced a 40% chance of hikes at both the October and December meetings, also double Tuesday’s odds. Total hikes priced through 2027 rose to 92 basis points from 81, and the two-year Treasury yield jumped 15 basis points to what would be its highest close since 2024.
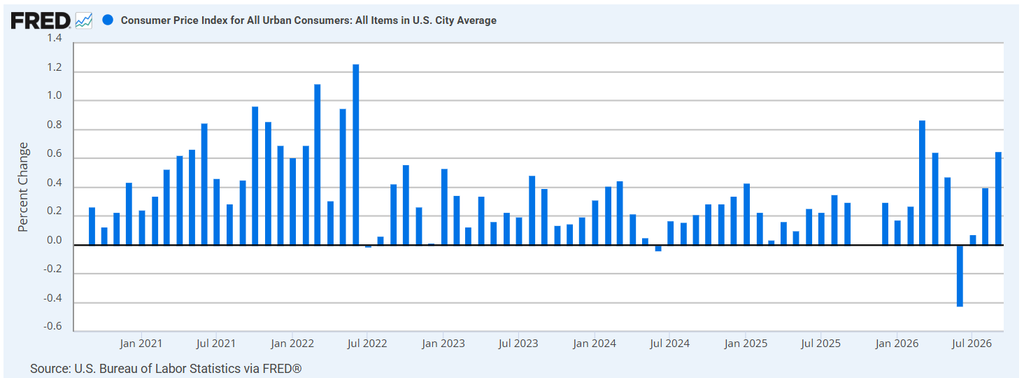
Headline consumer prices rose 0.648% in September, just rounding down to the 0.6% expected, but still the most since March and after a 0.40% gain in August. From a year earlier, prices rose +3.74%, the most since May, after +3.40% in August and above the +3.6% expected. As Bloomberg’s Sarah Foster noted, prices have risen about 30% since January 2020 (+30.61% by the index).
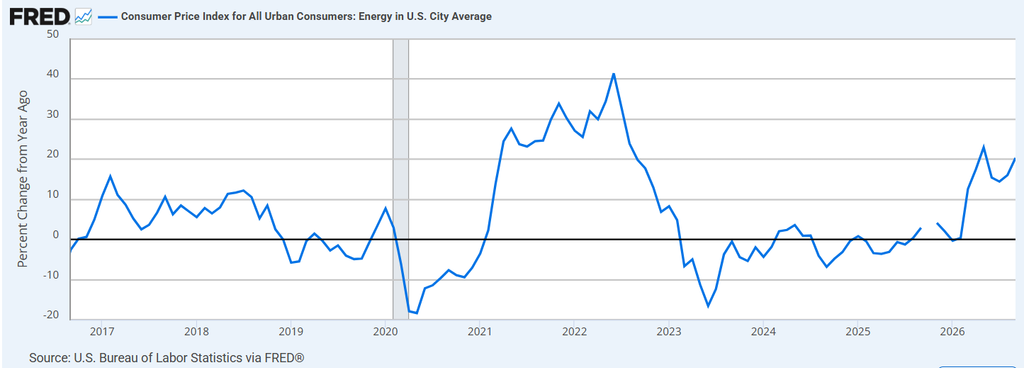
Energy rose +5.20%, the most since March and before that June 2022, after +2.10% in August, with gasoline up +9.09%, also the most since March and second-most since June 2022, which per the BLS accounted for “over half of the monthly [headline CPI] increase.” Fuel oil also jumped +15.33% and electricity rose +0.25%, while utility (piped) gas service fell -0.32%.
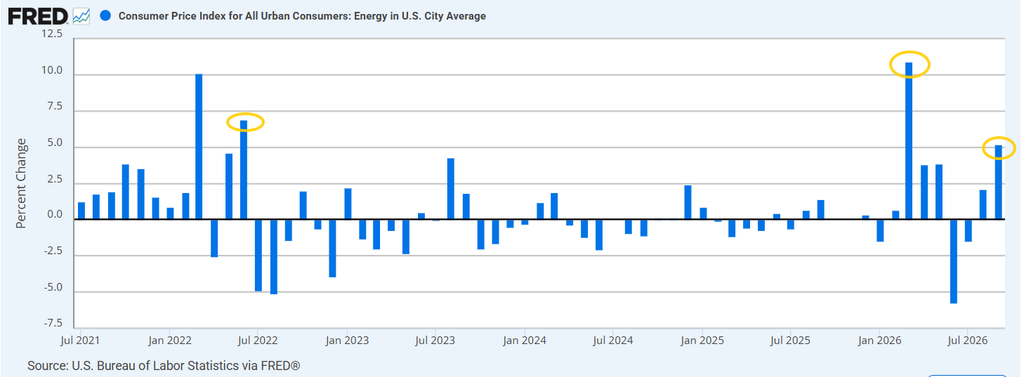
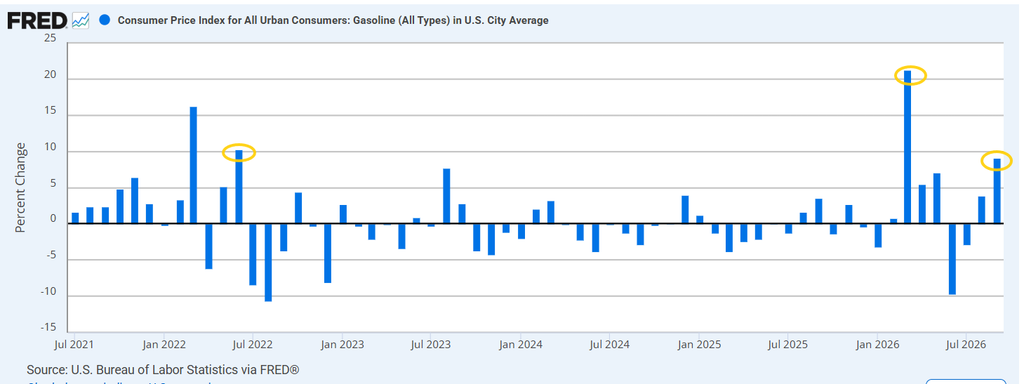
From a year earlier, energy is up +20.45%, the most since May, after +16.28% in August, with gasoline up +34.17% and fuel oil up +74.18%, the most since July 2022. Electricity is up +4.37% and natural gas +4.97%.
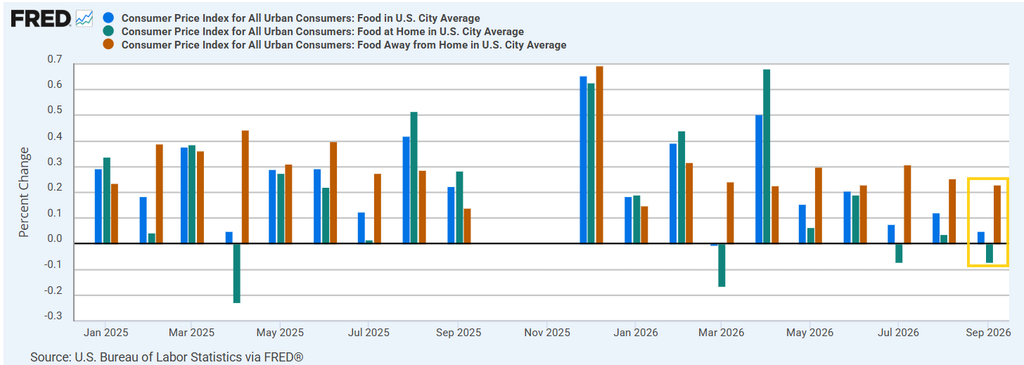
Food rose +0.05%, the smallest increase since March, after +0.12% in August, with groceries (food at home) down -0.07%, matching July’s decline.
The BLS noted: “Three of the six major grocery store food group indexes decreased in September, while the other three indexes increased.” Meats, poultry, fish and eggs fell -0.47% (beef -1.04%, eggs -1.26%), dairy fell -0.90%, the biggest drop since February 2025 (milk -1.98%), and other food at home fell -0.23%. Fruits and vegetables rose +0.48%, nonalcoholic beverages +0.85% and cereals and bakery products +0.08%. Dining out rose +0.23%.
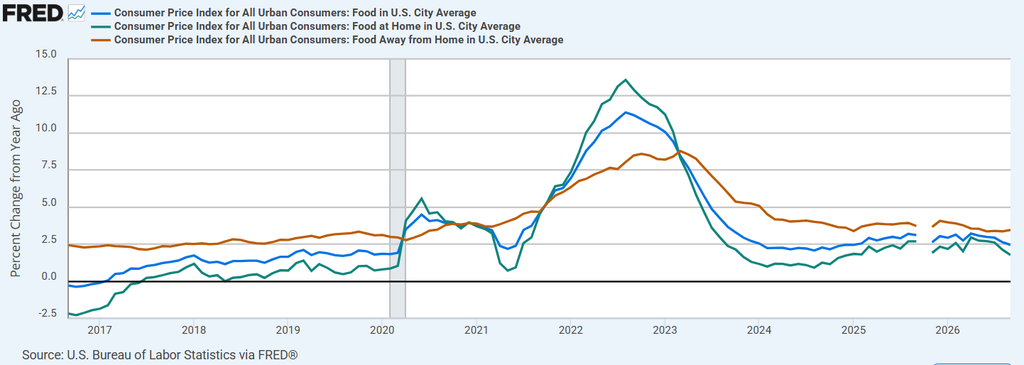
Food is up +2.48% from a year earlier (not seasonally adjusted), the smallest increase since November 2024, with groceries up +1.81%, the smallest since December 2024, and dining out up +3.46%, the most since May.
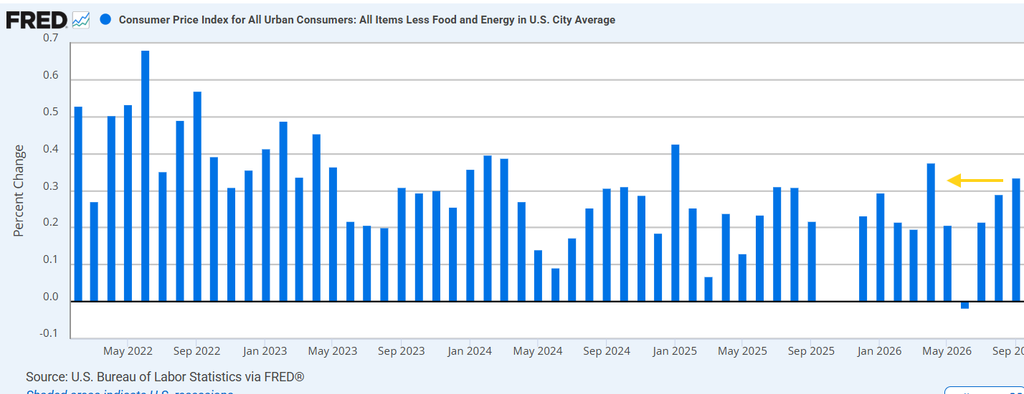
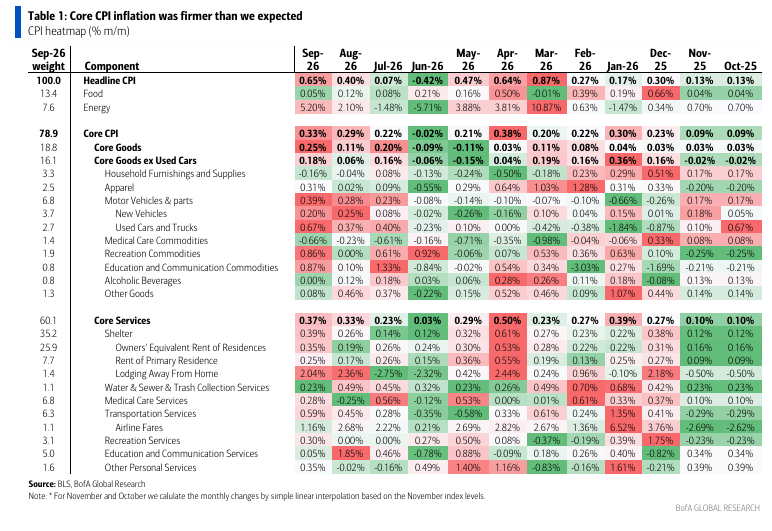
Stripping out food and energy, core prices rose +0.33%,the most since April and above the +0.2% expected, after +0.29% in August. Only 11 of 73 economists in Bloomberg’s survey had expected 0.3%.
Per the BLS, “Indexes that increased over the month include recreation, used cars and trucks, education, airline fares, medical care, and apparel. Conversely, the index for communication was among the small number of major indexes that decreased in September.” More on some of those below.
Core is up +2.56% from a year earlier, the most since June, after +2.45% in August and rounding to +2.6%, above the +2.5% expected.
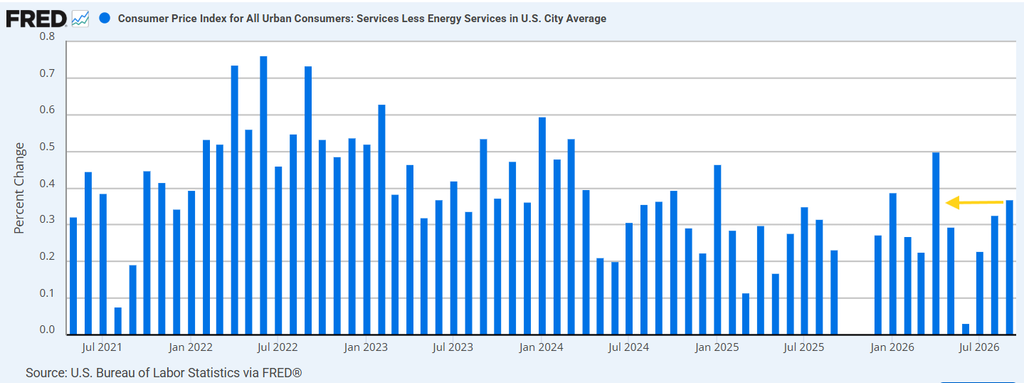
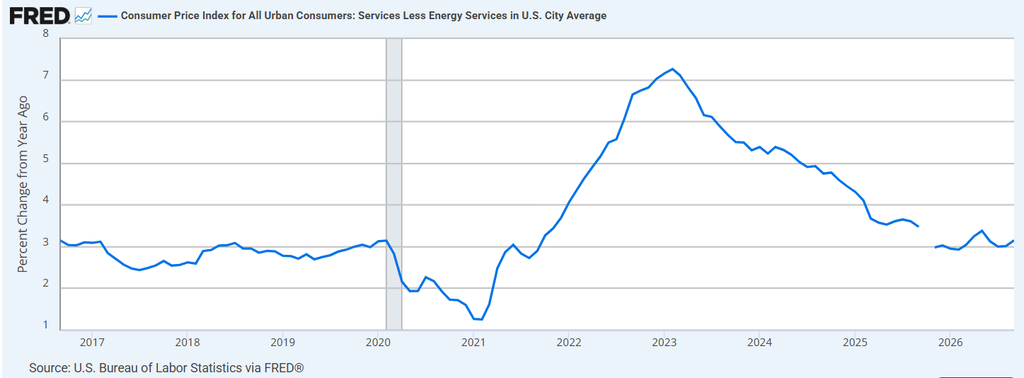
Core services rose +0.37%, also the most since April, after +0.33% in August, with the gains spread across categories. Bloomberg’s Enda Curran wrote that “unlike in previous months when inflation could be pinned on one offs (like the cellphone impact in August) the pressures seem evident across the board here.” In that respect, wireless telephone services were flat (-0.02%) after August’s record +5.89%, and communication overall fell -0.18%.
Looking at other components: Transportation services rose +0.59%, the most since March, after +0.45% in August, as car and truck rental jumped +5.43%, the most since June 2021, motor vehicle maintenance and repair rose +0.72% and airline fares rose +1.16% after +2.68%. Motor vehicle insurance rose +0.06%, its first increase since April, which Curran noted is “one sector that analysts had expected to continue shoring up the disinflation story, but not now.”
Medical care services rose +0.28% after -0.25% in August, with hospital services up +0.72%, the most since January, and dental services +0.48%, while physicians’ services were essentially flat (+0.01%) and health insurance fell -0.24%. Recreation services rose +0.30%, education +0.58% (tuition, other school fees and childcare +0.58%), and lodging away from home +2.04% (hotels +2.34%) after +2.36% in August.
Core services are up +3.15% from a year earlier, the most since June.
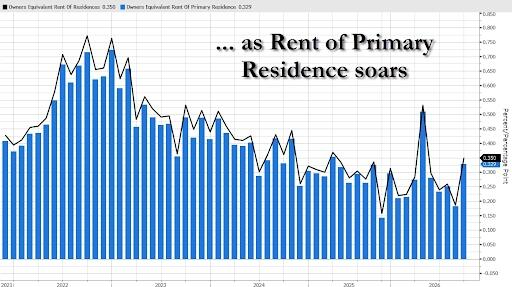
Shelter (about 35% of the CPI) rose +0.39%, the most since April (and second most since October 2024), after +0.26% in August, as owners’ equivalent rent rose +0.35%, also the most since April, and rent of primary residence rose +0.25%, the most since July.
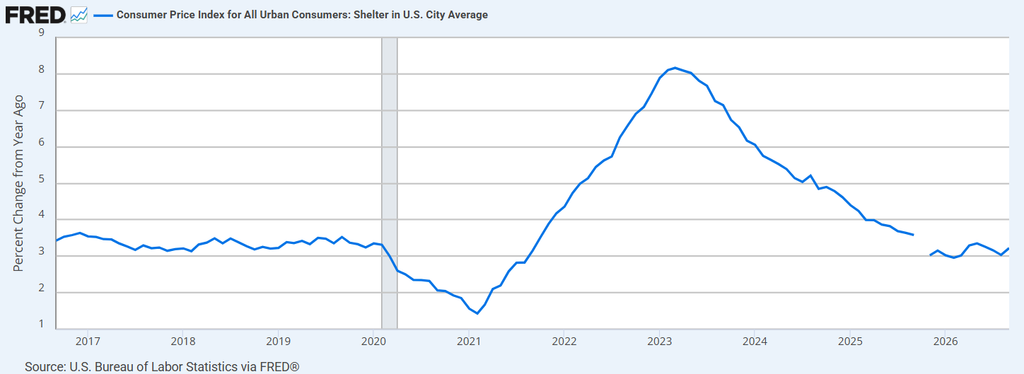
Annual shelter inflation rose to +3.22%, the most since June, from +3.04%, with owners’ equivalent rent at +3.28%, the most since May, and rent at +2.78%.
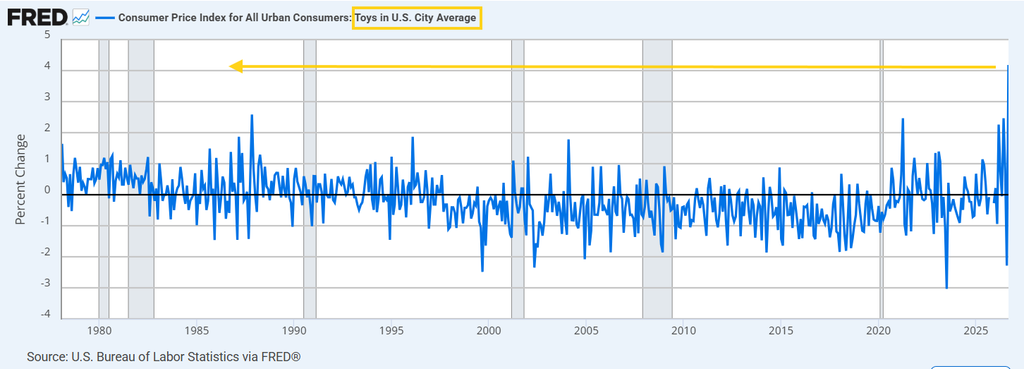
Core goods rose +0.25%, the most since January 2025 (and before that May 2023), after +0.11% in August. Used cars rose +0.67%, the most since October 2025, apparel +0.31%, the most since April, and new vehicles +0.20%, while medical care commodities fell -0.66% (prescription drugs -1.25%). Toys jumped +4.18%, the largest monthly increase on record per the BLS, and sporting goods rose +0.43%.
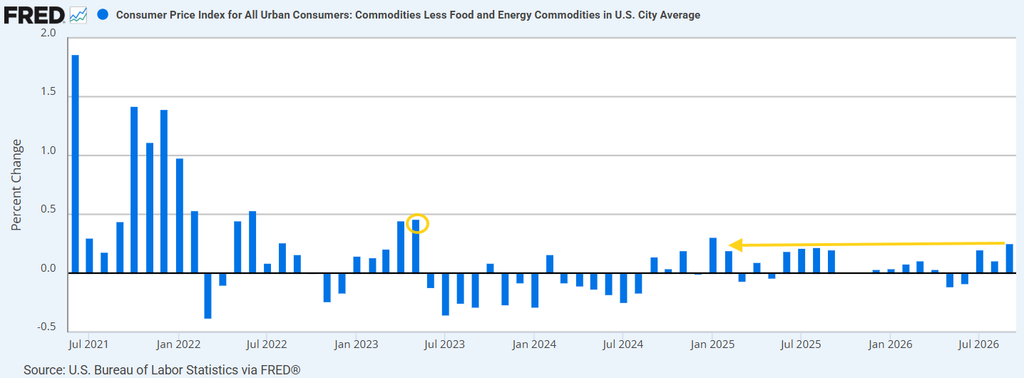
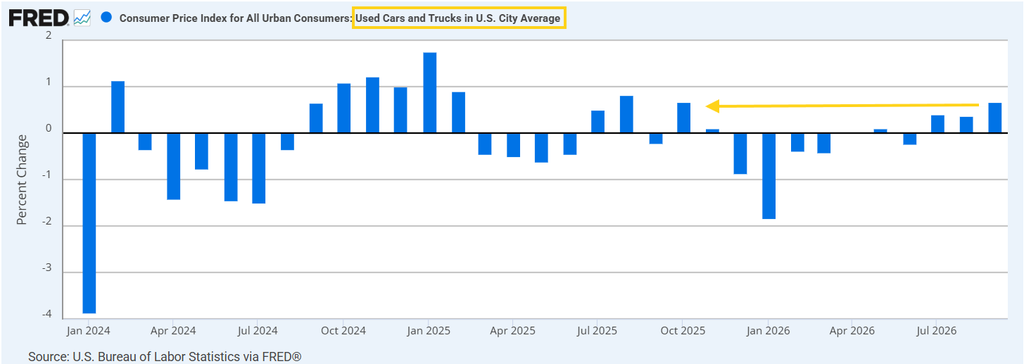
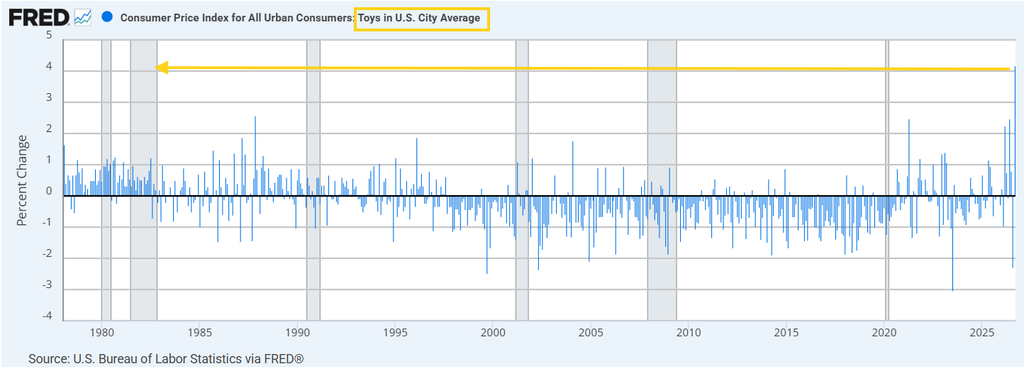
Core goods are up +0.74% from a year earlier, the most since July, after +0.68% in August. Toys are up +6.64%, the most since October 1988, and used cars are down -1.46%. Medical care commodities are down -3.27%, the largest annual decline on record, with prescription drugs down -4.48%, also a record.
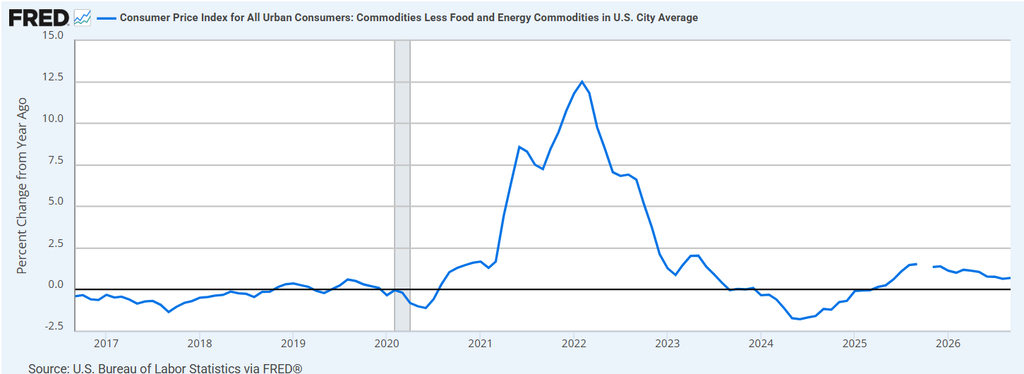
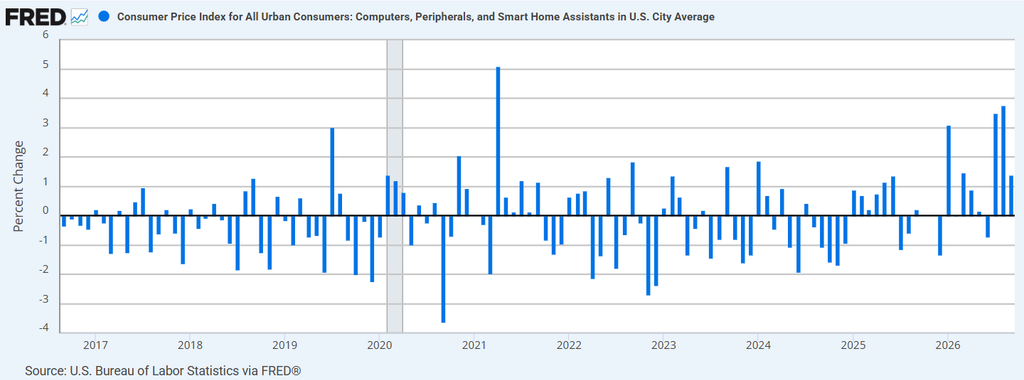
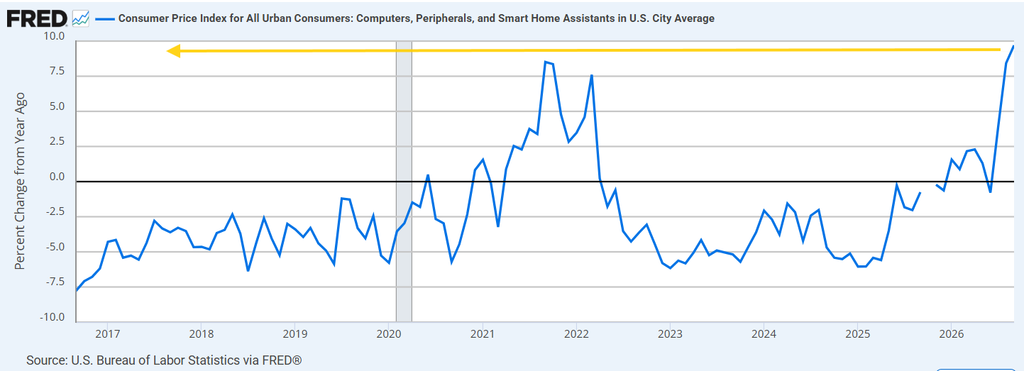
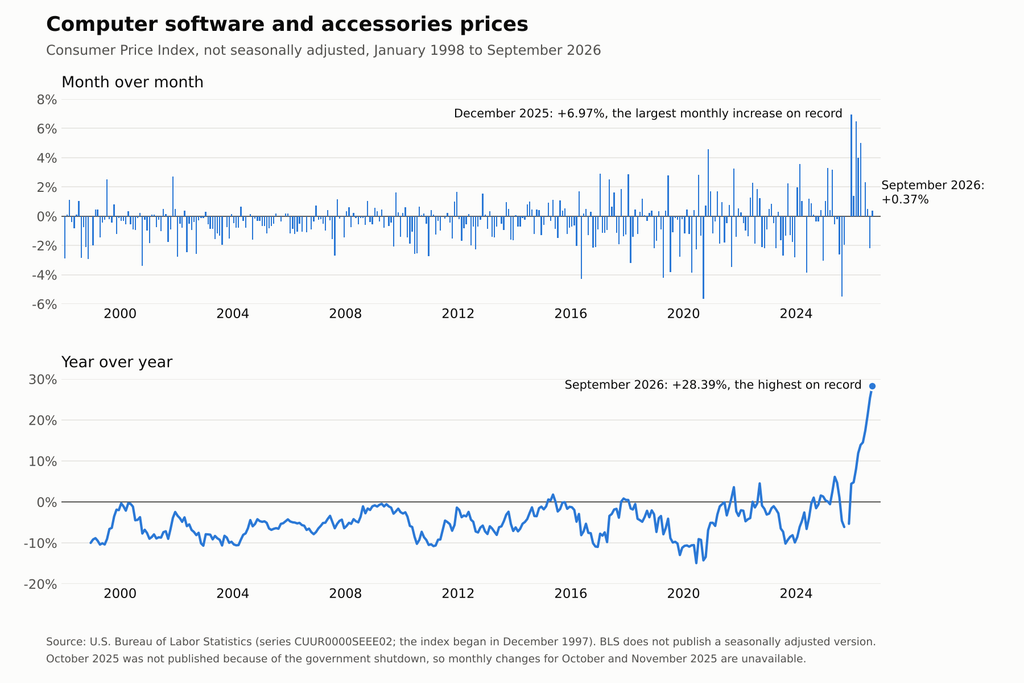
The data-center buildout again stood out: computers, peripherals and smart home assistants rose +1.39% on the month and are up +9.70% from a year earlier, the most on record, while computer software and accessories rose +0.37% and are up +28.39%, also a record. The Journal quoted Cleveland Fed President Beth Hammack saying data-center builders show “much less price sensitivity and much greater sense of urgency around delivery.”
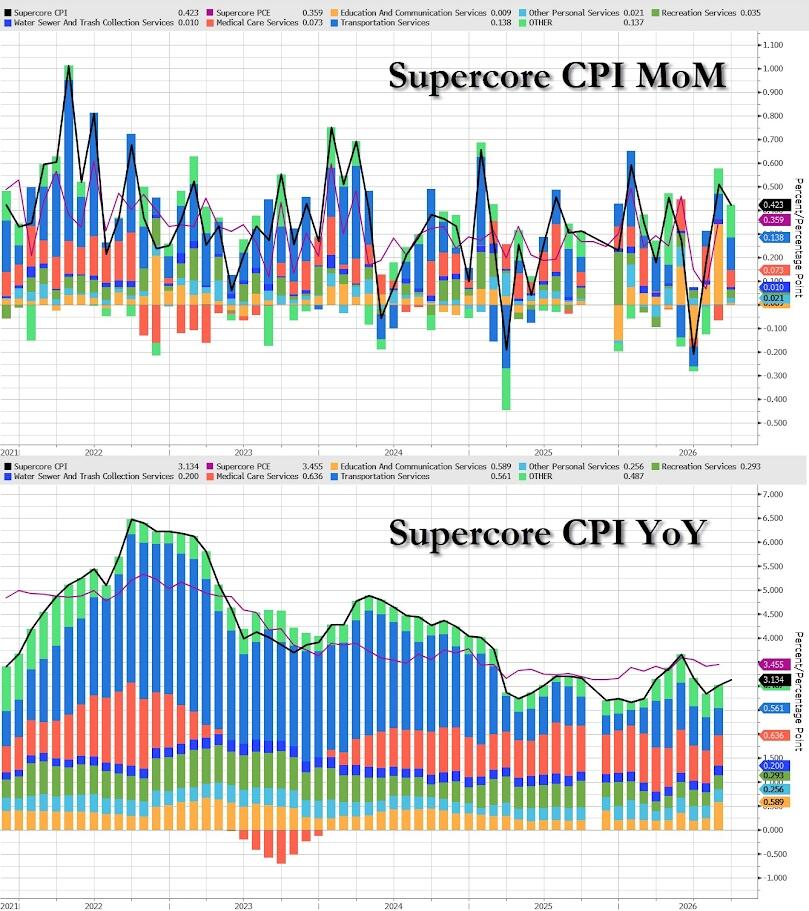
Supercore — core services excluding housing, one of the key metrics from this report on underlying inflation — rose +0.42% after +0.51% in August. Bloomberg’s Chris Anstey noted that “in the five years through 2019, the highest ever recorded was 0.39%.”
From a year earlier, supercore is up +3.13%, the most since June, after +3.02%.
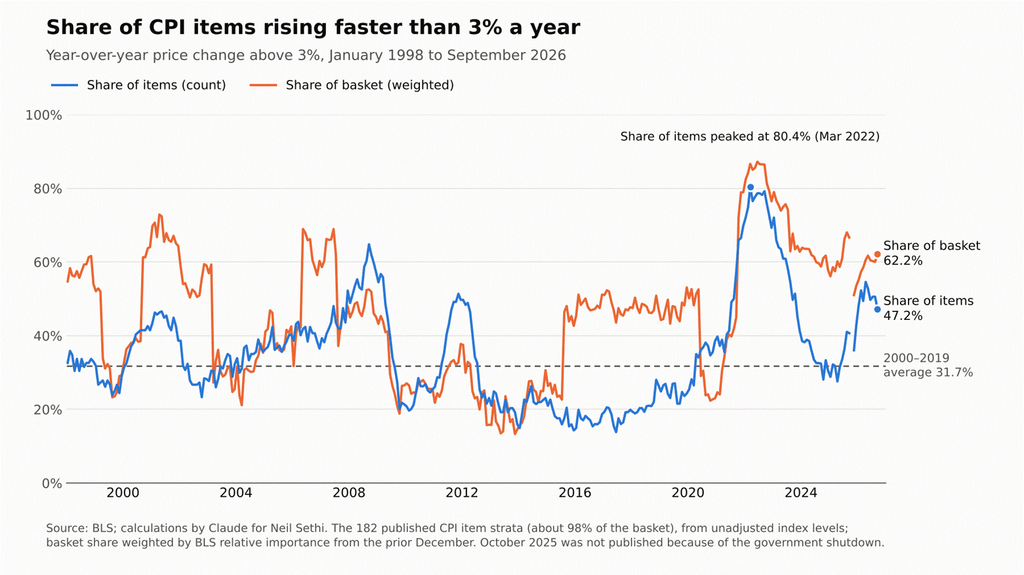
Breadth: a measure Warsh is watching. At Jackson Hole in August, Chair Kevin Warsh said that “over the past 12 months, 54% of goods and services in the PCE basket showed price increases above 3%. This is well below the post-pandemic highs of about 77%, but it remains well above the level of 32% in the two decades that preceded the pandemic.” Bloomberg noted that he has also pointed to a six-month annualized version, which he put at about 49% in August and called “still quite elevated,” and that Bloomberg Economics estimates it eased to 45% after the August PCE data.
Running the same exercise on the CPI* across the roughly 180 item categories the BLS publishes, covering about 98% of the basket, 47.2% of categories rose more than 3% from a year earlier in September, the lowest since December, down from 50.6% in August. That compares with an average of 31.7% from 2000 to 2019 and a peak of 80.4% in March 2022, close to the 32% and roughly 77% Warsh cited for the PCE.
Weighted by share of spending, though, 62.2% of the basket is rising faster than 3%, the most since September 2025, up from 60.0%. The categories that crossed above 3% included larger ones such as college tuition (+4.00%), hotels (+4.27%), cable, satellite and streaming TV (+3.33%) and motor vehicle repair (+3.55%), while eight of the 17 that fell back below 3% were grocery items. The share above 5% rose to 23.0% of categories (13.1% of the basket) from 21.0% (11.6%), led by gasoline (+34.17%), hospital services (+5.63%), dental services (+6.02%) and airline fares (+22.45%), while 27.5% of categories are now falling from a year earlier, up from 21.0%.
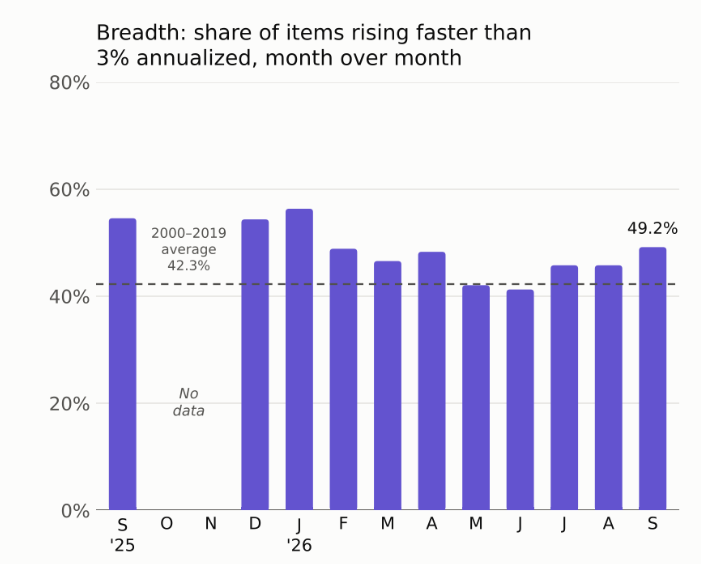
Breadth also widened on a month-over-month basis: 49.2% of categories rose from August to September at a pace that would exceed 3% over a full year, the most since January, up from 45.8% in August, though that noisier measure averaged 42.3% from 2000 to 2019.
But over the six months through September, the share rising faster than a 3% annual rate fell to 37.7%, the lowest since April 2025, from 42.3% in August, against a 35.0% average for 2000 to 2019.
* Note: breadth figures are Claude’s own calculations from BLS index levels for the 182 published CPI item strata (about 98% of the basket), not a BLS or Street-published statistic. Weighted shares use BLS relative importance from the prior December; monthly and six-month changes use seasonally adjusted indexes where the BLS publishes them.
On the read-through to households, real (inflation-adjusted) average weekly earnings (a key metric – the real take home pay of all workers) fell -0.51% from August, the biggest monthly drop since March.
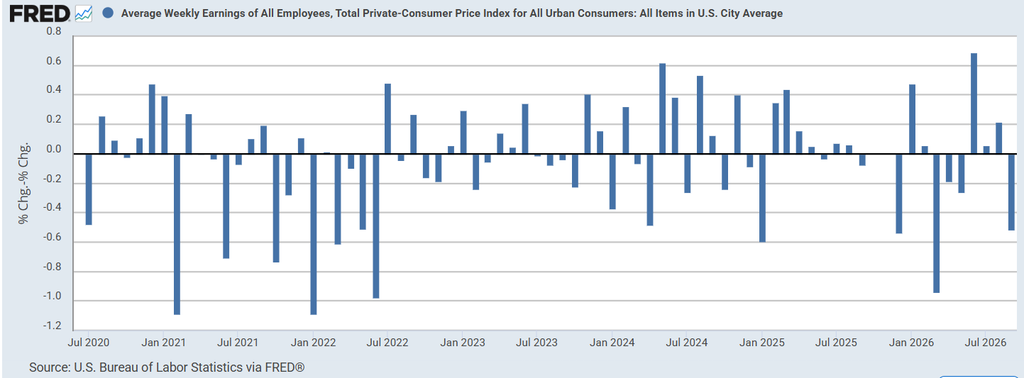
From a year earlier, real weekly earnings slipped -0.09%, back into negative territory for the first time since May, after +0.21% in August.
Core PCE
Bank of America raised its core PCE tracking estimate to 0.32% from 0.22% month over month, or 3.1% from a year earlier. That “would mark a notable acceleration from the 3-month trailing average of 0.19% m/m,” BofA said, adding that its estimate “is subject to change after tomorrow’s PPI data, and Friday’s import price data,” and that it sees “more uncertainty around this estimate than normal given the recent methodology changes to legal services, computer software and accessories and portfolio management and investment advice.”
BofA said the data “continue to underscore two key sources of inflation pressure: AI and Iran,” adding that it is “seeing increasing evidence that AI-related demand is spilling over into consumer goods that share inputs with data center construction. IT commodities rose 0.9% m/m, contributing 2bp to core CPI, and are up 10.0% annualized over the past three months. Airfares and car and truck rental prices also continued to climb, reflecting higher energy costs stemming from the Iran conflict, in our view. The one silver lining is that we see little evidence that rising shipping costs are spilling over into broader consumer prices.” On owners’ equivalent rent, which came in 10 basis points above its forecast, BofA said it does “not believe the September data mark the beginning of a renewed acceleration in OER inflation. Rather, we think it reaffirms our view that rent disinflation has run its course, despite asking rents running below pre-pandemic levels.”
Fed Readthrough
Markets moved quickly to reprice the chances for an October hike. The CME FedWatch tool showed the odds of a hike at the October 27–28 meeting doubling to 44% from 22% on Tuesday, and a 40% chance of hikes at both the October and December meetings, also double Tuesday’s odds. About another half-hike was added to 2027, with 92 basis points of total hikes now priced, up from 81. Anstey called it “just a massive move in interest-rate futures,” going “from less than a 1-in-4 chance of a rate rise this month to almost 50-50 odds. In minutes.” The two-year Treasury yield jumped 15 basis points to what would be its highest close since 2024, while the 10-year climbed back to 5.30%, and stock futures turned negative.


Bank of America reaffirmed its call for an October rate hike. It said it had been “dismissive of the firmer-than-expected August print given the outsized contributions from wireless services, airfares, & lodging away from home,” but that this month “inflation pressures were broader, making us more willing to take signal from the report. Indeed, both core goods & core services accelerated relative to recent trends, and the increases cannot be traced to one or two idiosyncratic sources.” It would, however, “fade the 4.2% jump in toy prices, which contributed 2bp to core CPI this month.”
Interestingly though Bloomberg Economics’ Anna Wong still expects the Fed to stay on hold for the rest of the year following the hotter CPI data, but risks of a hike have increased: “The owners’ equivalent rent component printed hot despite a cool housing market most of the year, suggesting a potential aberration. The breadth of inflation also came down, indicating that the outsize CPI was driven by just a few categories.”
Other Analyst Reaction
- Natixis’ Christopher Hodge said the print puts October in play: “We had said that anything near consensus would not likely shift the narrative for the Fed for October, but this is far enough from consensus to make it a debate. We still think the Fed does not ultimately go – the arguments laid out by Williams and Jefferson suggests that there is no rush to tighten again right now, but today at least gives the hawks more ammo at the meeting.”
- Phillip Neuhart, director of market and economic research at First Citizens Bank Wealth Management, said “today’s hotter-than-expected core inflation data brings the October FOMC rate decision into play,” and that the surprisingly high core print shifts the conversation toward entrenched inflation and away from an energy-driven, temporary spike.
- Bloomberg Intelligence’s Ira Jersey said “the pricing isn’t yet reflecting an October Fed hike, but expectations are solidifying for hikes in December and 2027,” adding that “most Fed speakers have mentioned trends matter more than individual prints, so the post-CPI-release bear flattening may be a little overdone.”
- The longer energy inflation stays elevated, the more likely it seeps into core inflation, so it’s a make-or-break moment for seeing whether the oil shock becomes a more systemic problem, noted Brian Jacobsen at Annex Wealth Management. Still, he says the Fed is likely to wait until December to hike again as a lot can happen between now and then.
- “Overall, it was a troubling round of inflation data that undermines the argument for a gradual pace of future rate hikes, and revives the prospects for a quarter-point Fed hike in two weeks,” said Vail Hartman at BMO Capital Markets. “That being said, CPI by no means locks in an October rate hike.”
- Regions Financial chief economist Richard Moody told the Journal that supply challenges, including the closure of the Strait of Hormuz, tariffs and a shortage of workers in some industries, have been a bigger driver of inflation: “Ultimately it’s a supply-side story.”
- Ahead of the release, iCapital’s Dan Suzuki wrote that the “headline number will be noisy, but core is the signal. … The Fed can look through an oil spike. What it can’t look through is energy costs leaking into everything else.” Bloomberg Economics’ Anna Wong and Troy Durie had expected a 0.23% core gain and “isolated inflation hotspots rather than the broad-based price pressures seen in 2021-’22,” with the Fed on hold for the rest of the year.
The Bureau of Economic Analysis is scheduled to release September PCE data on October 29, and the next CPI report, for October, is due November 10.
https://www.bls.gov/news.release/cpi.nr0.htm
https://www.bls.gov/news.release/realer.nr0.htm
Note on breadth: this month I moved the breadth calculation to BLS index levels for the 182 item categories it publishes, which covers about 98% of the basket and allows a consistent history back to 1998. Last month’s figures excluded some categories that the BLS also breaks into finer detail, most importantly gasoline. On the new basis, August’s share of categories above 3% was 50.6% (vs. 50.0% reported) and the weighted share 60.0% (vs. 61.8%), while 11.6% of the basket was above 5% (vs. 7.0%), with gasoline the largest item in that group.
