Small Caps Lead a Broad Rally as Tech Bounce Stalls
Easing long-term yields and oil prices lifted the Russell 2000 to its best day since early August and saw 9 of 11 S&P 500 sectors higher, even as weakness in Tech dragged on the cap-weighted index.
You've reached your free article limit
You've read 0 of 1 free Pro articles.

Quick Summary
- After buying the dip Monday, traders returned to last week’s rotation away from Tech and into the rest of the market as long-term Treasury yields eased, boosting the Russell 2000, the equal-weight S&P 500 and the Dow Jones Industrial Average each more than 1%. Weakness in Tech and Communications, though, held the S&P 500 to a modest gain and left the Nasdaq flat.
- The Russell 2000 jumped 1.7%, its best day since early August, and the Dow Jones Industrial Average and equal-weight S&P 500 (RSP) each rose over 1%, the former helped by a nearly 6% gain in 3M (MMM) after it raised its full-year guidance and unveiled a large deal with Amazon (AMZN). The S&P 500 added 0.3% and closed just back above its 50-day moving average. The Nasdaq finished flat after chip stocks briefly wiped out Monday’s rebound in early trading, with the PHLX Semiconductor Index (SOX) ending down 0.3%.
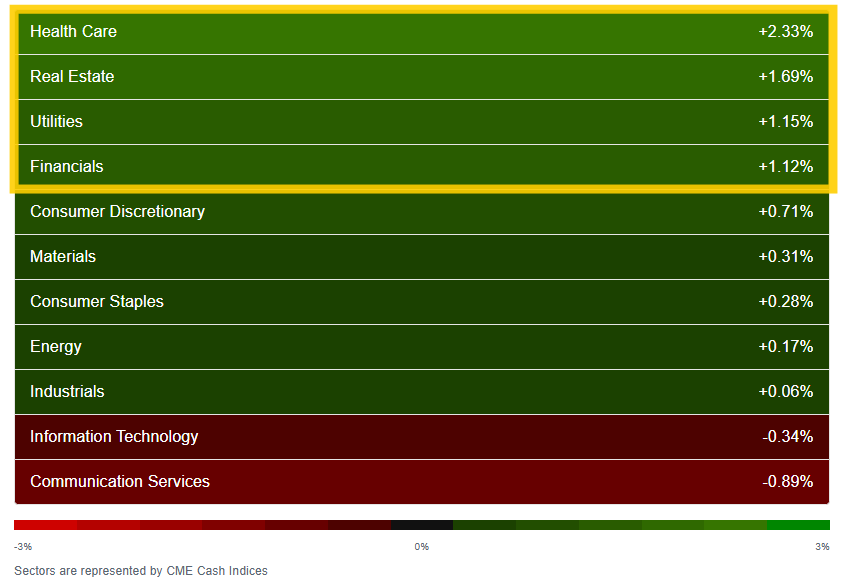
- Breadth was solid, with 9 of 11 sectors higher, up from 4 Monday, and four up more than 1%. Health Care (+2.3%) led, hitting another record high, as did its largest component, Eli Lilly (LLY). Real Estate, Utilities and Financials each rose more than 1% as yields eased. Tech (-0.3%) and Communications (-0.9%) went from the top of the sector scorecard Monday back to the bottom, with broad weakness.
- Earnings drove some big moves. Hasbro (HAS) and Equifax (EFX) each jumped about 11% to lead the S&P 500 after their results, while General Motors (GM) fell nearly 7%. After the close, SpaceX (SPCX) posted quarterly net income more than double expectations on growth in its AI business, while Netflix (NFLX) fell on a disappointing outlook. More on all of those below.
- WTI topped $110 early on reports of Iran looking to take back some control of the Strait of Hormuz, before falling back after unconfirmed Israeli media reports that a U.S.-Iran compromise proposal had won preliminary approval. Bloomberg reported that talks continue, though a deal is not as close as those reports suggested. In the cash session, the 10-year yield slipped 2bp to 5.12%, while the 2-year rose 3bp to 4.79%.
- In data, September housing starts fell more than every Bloomberg estimate, with single-family starts the least in a year, while single-family permits dropped to the lowest since March 2023. Separately, contract signings for existing homes saw the biggest drop since December, sending the index to its lowest level in data back to 2001.
- Wednesday all the attention will be on earnings including Meta Platforms (META) and Tesla (TSLA), along with Lam Research (LRCX), IBM (IBM) and Texas Instruments (TXN).

Market Commentary
Equities:
- “Concerns surrounding AI-related data center and infrastructure investment have been building for several days,” said Roger Lee at Cavendish. “The market probably needs some reassurance that the huge capex investment is generating a return. That is hard to see at the moment.”
- “A return to the narrative of ever-higher capex guidance looks unlikely at this stage,” Mathias Heim, chief investment officer at Belle Capital said. “I would expect a period of digestion rather than a sustained rebound: slower growth for AI capex beneficiaries and potentially continued stress for highly leveraged neocloud providers.”
- “Fundamentals remain strong enough to support equity dip-buying, with the latest scare more financing- than demand-driven. But investors are reassessing exposures and hedges in favour of quality.” — Skylar Montgomery Koning, Bloomberg macro strategist.
- “We expect a strong third-quarter tech earnings season from a fundamental perspective, but elevated expectations may lead to company-specific volatility,” said Ulrike Hoffmann-Burchardi at UBS Chief Investment Office.
- “AI remains a long-term driver of earnings and economic growth, but investors are becoming more selective about which companies get rewarded from here,” Anthony Saglimbene at Ameriprise said. “For investors, that argues for owning AI exposure selectively rather than broadly, keeping technology concentration in check, and diversifying across market caps, sectors, and regions.”
- “In the short term everybody’s freaking out, but in the long term, it makes the cycle longer,” says James Thorne, chief market strategist at Canadian wealth manager Wellington-Altus.
- “There are no signs that demand for AI is slowing,” said Angelo Kourkafas at Edward Jones. “We’re seeing healthy skepticism and a maturation of the theme, moving away from an environment where everything AI-related goes up toward a greater focus on quality and the companies with the deepest pockets to finance the investment needed to meet demand.”
- “For much of this year, the market has been willing to look through higher rates because the growth story, notably that around AI, was strong enough to justify it. Last week, we saw that relationship begin to be tested,” said Jake Behan, head of capital markets at Direxion. “Hyperscalers report over the next few weeks, setting up the next major stress test for the AI trade,” he continued. “Guidance around ROI, data center spending and 2027 capex will arguably be more important than the headline earnings figures.”
Stock and Sector Breakdown:
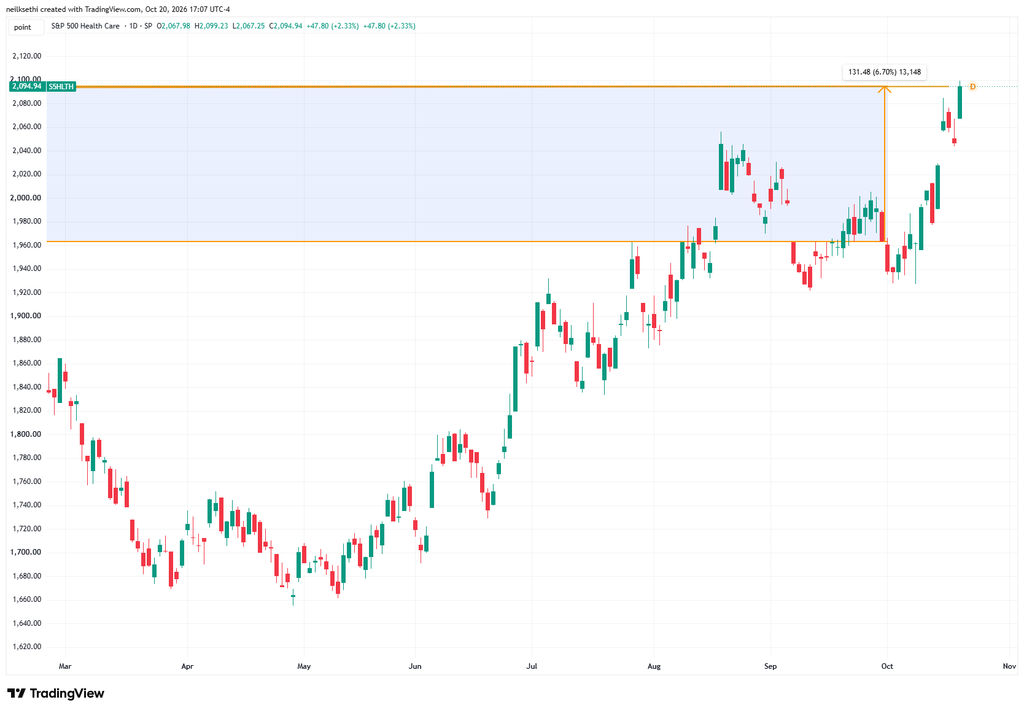
Nine of 11 sectors were higher (up from 4 Monday), with another reversal in Tech and Communications, which fell back to the bottom of the sector chart (from the top Monday and the bottom Friday). That weighed on the S&P 500 even as four sectors were up over 1%, led by Health Care which hit a fresh record high, now up over 6% on the month. Real Estate, Utilities, and Financials were the others.
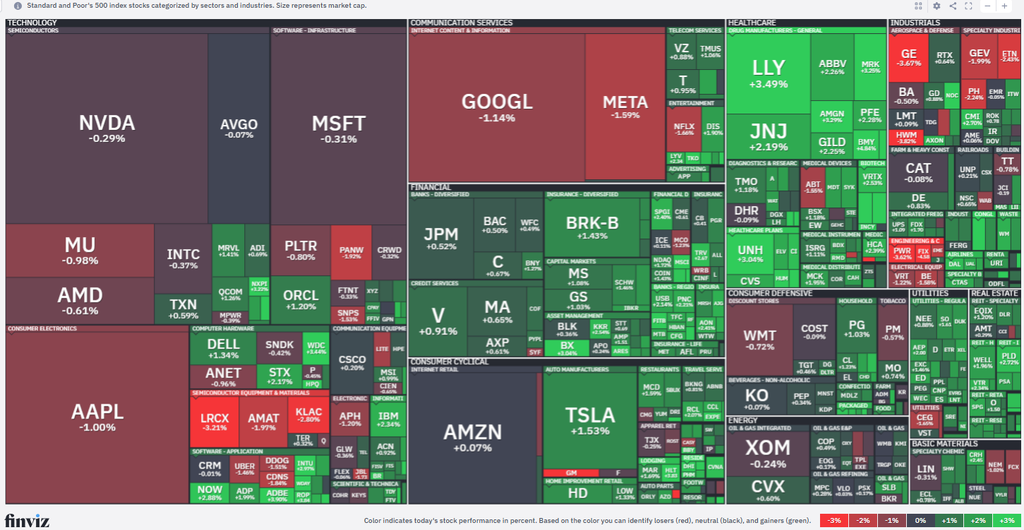
Tech started the day lower after Elice Inc., a $750 million Korean data center and AI developer saw its shares drop as much as 35% following its IPO. You can read more on that from me here and Alex Frew McMillan also wrote on it in Why a Little-Known Korean Company Is Sending Markets South.
Tech would rebound into the green early in the session, with the Philadelphia Semiconductor Index (SOX) up over 1% at one point, before falling back to end the day modestly lower (-0.3%)
In other corporate news:
General Motors (GM) -6.8% was the worst performer in the S&P 500 even as it beat Wall Street’s expectations on the top and bottom lines in its Q3 2026 earnings, delivering strong results driven by high truck sales and growing subscription revenue, and authorizing a new $20 billion buyback program. General Motors has a market value of roughly $72.6 billion, so this $20 billion buyback program means the company is committing to repurchase more than a quarter (about 27.5%) of its outstanding shares. The company also raised its free cash flow expectations, but instead of being cheered by the buyback, investors worry that it will erode cash buffers and reduce investment to deal with slowing vehicle sales. A narrowed full-year profit outlook didn’t help.
Amazon.com (AMZN) +0.1% plans to ramp up hiring over the next few months to handle the increase in orders on its e-commerce platform during the holiday shopping season. A press release from the company noted that it intends to hire roughly 300,000 seasonal, part-time, and full-time workers, with job posts starting in October and lasting through December. It also said it will invest more than €16 billion ($17.9 billion) next year in Germany for operations including data centers, its satellite program and Prime Video media production.
Salesforce (CRM) agreed to buy Braze Inc., an artificial intelligence-powered platform for marketers, for almost $5.7 billion in enterprise value.
Health Care was helped by its largest component, Eli Lilly (LLY) +3.6% pushing to a new all-time high.
The top performer on the S&P 500 was Equifax (EFX) +11.3% even as it cut its FY 26 revenue outlook, edging out Hasbro (HAS) +11.2% as the latter saw a solid beat on the top and bottom line and raised its outlook.
After the close SpaceX (SPCX) shares were higher, while Netflix (NFLX) fell. Read more on those and 3M (MMM) shares rising following its earnings and a big Amazon deal in the new Stock Market Today live conversation.
The number of large SPX winners (up over 3%) rose to ~45 from 17 Monday, still well below the ~120 Thursday, which was the most we’d seen since the start of August.
The number of large losers (down over 3%) remained at just 8.
As mentioned previously, both of these metrics have been very (extremely?) subdued since the start of August, rarely getting above 50 and only twice above 100.
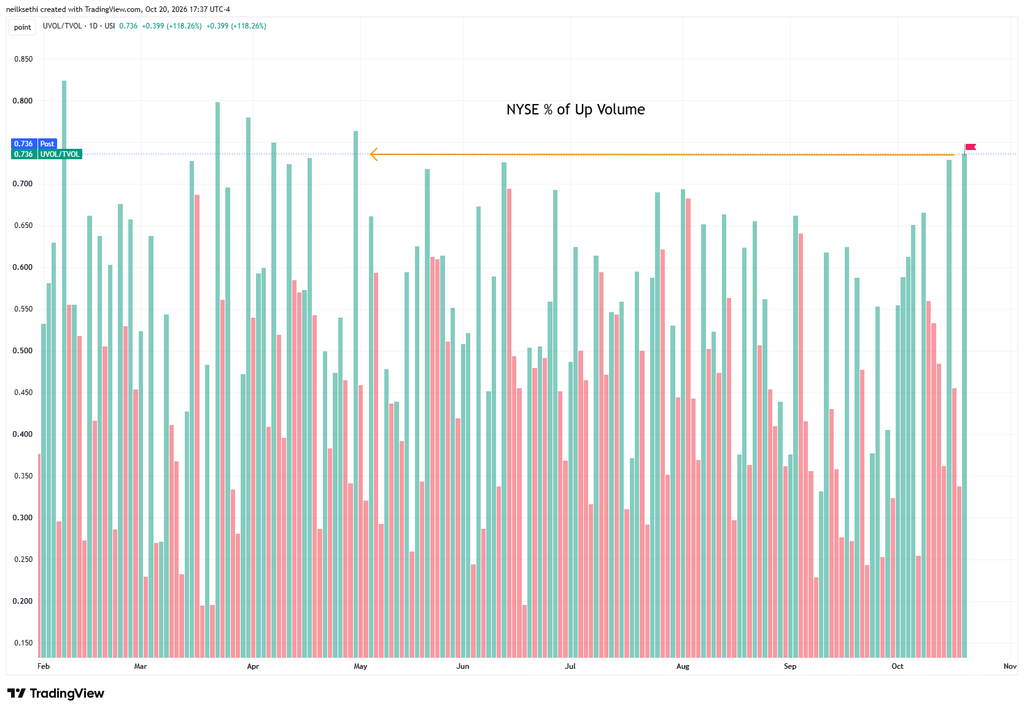
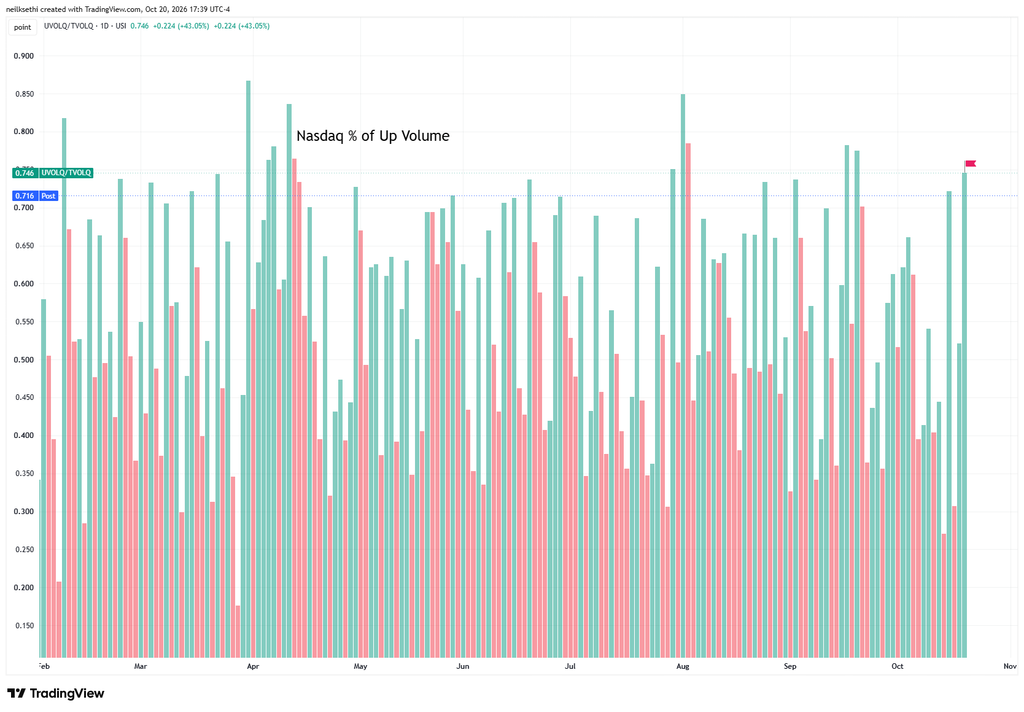
Breadth metrics were also solid with positive volume (intensity in buying stocks up on the session) coming in at 73.6% on the NYSE, the best since April, and 74.6% on the Nasdaq, an extremely high number for a modestly negative day on the index.
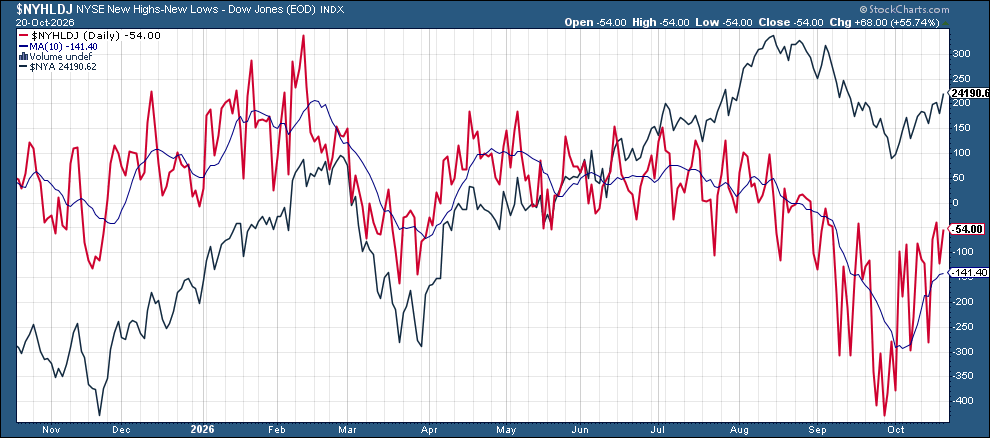
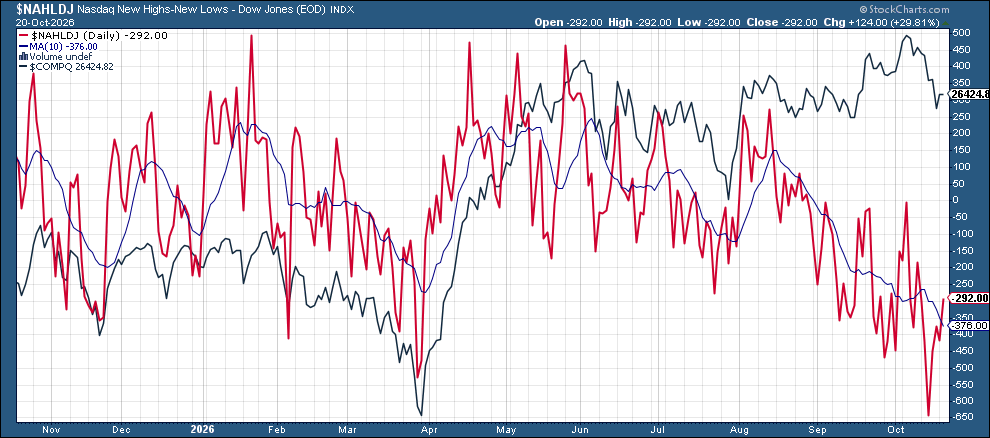
And looking at new 52-week highs minus lows the NYSE improved to -54 and the Nasdaq to -292, still though the 37th straight session of new lows outnumbering new highs on the Nasdaq, the longest such streak since the 43-day stretch that ended April 22, 2025.
Some other stock-specific commentary from TheStreet Pro:
- Chris Versace –
- Stephen Guilfoyle –
- Bob Lang –
- Ed Ponsi – Don’t Ignore Message From Nvidia, Broadcom, Micron, Sandisk Charts
A Look At The Charts
Note on all charts the colored lines are moving averages (the average price over the lookback period — days on the daily charts, weeks on the weekly charts):
20 = green
50 = purple
100 = blue
200 = brownException is monthly charts where blue is 10-month moving average and brown is 20-month moving average.
MACD = Moving average convergence/divergence line, a measure of momentum that compares longer term and shorter term momentum to gauge if a move is strengthening or weakening. This is probably my favorite individual indicator.
RSI = Relative Strength Index (basically what it sounds like) = measures the strength of the move comparing gains to losses over the given lookback window (I use the standard 14 periods).
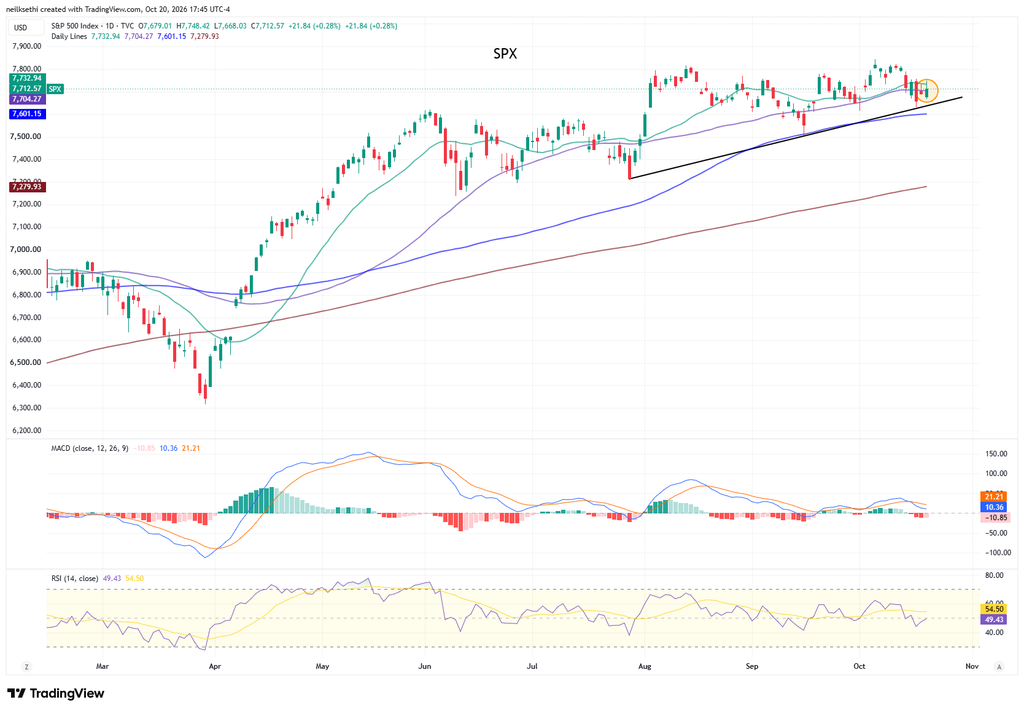
SPX continued its bounce but still not conclusively through its 50-DMA. As noted last week the daily MACD and RSI have slipped negative.
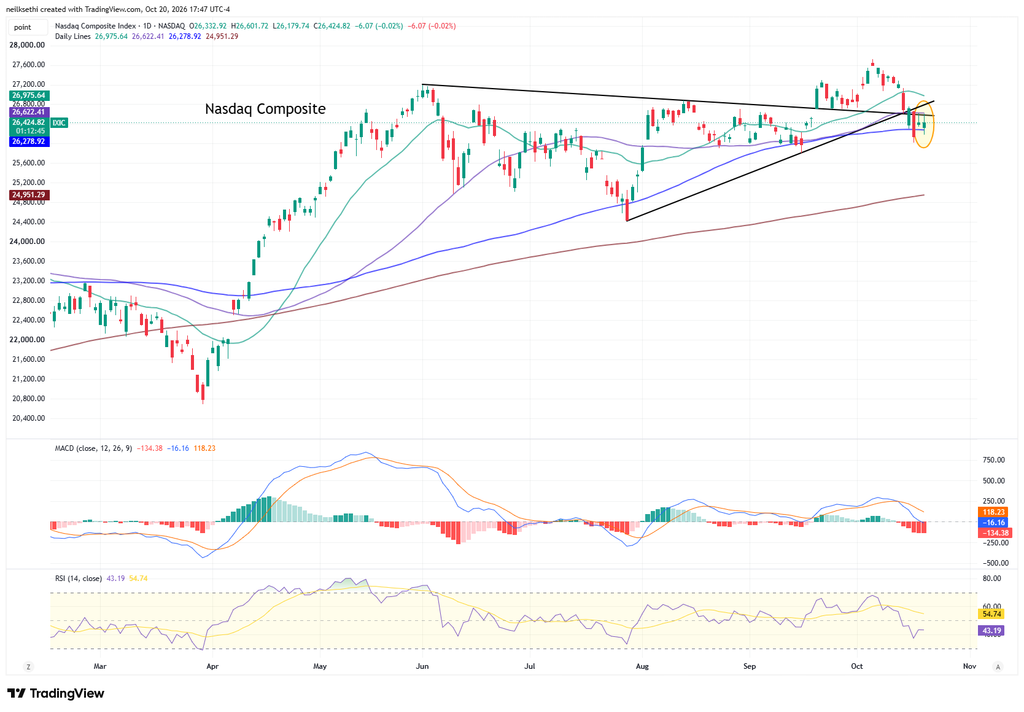
Nasdaq Composite more firmly below its 50-DMA. As I noted last week, it has a MACD sell signal and the RSI has fallen under 50. It also remains under the trendline from the August low.
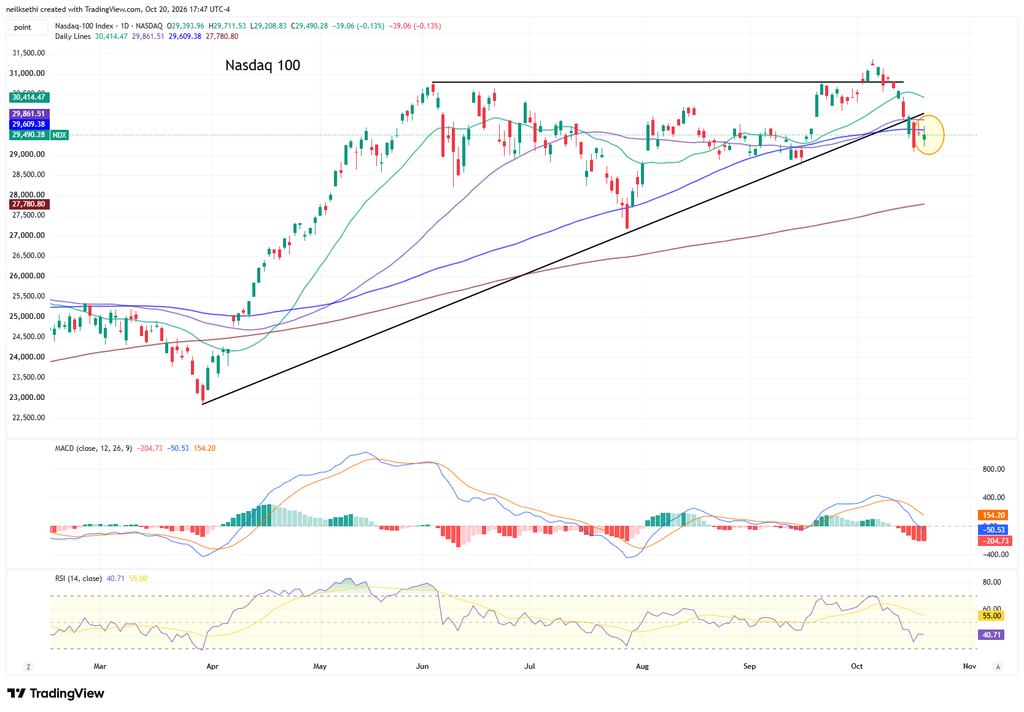
The Nasdaq-100 (QQQ) again couldn’t reclaim the 100-DMA. As I said Monday “this is not at this point a bounce to buy. I’ll be waiting for a break back above the 50-DMA.”
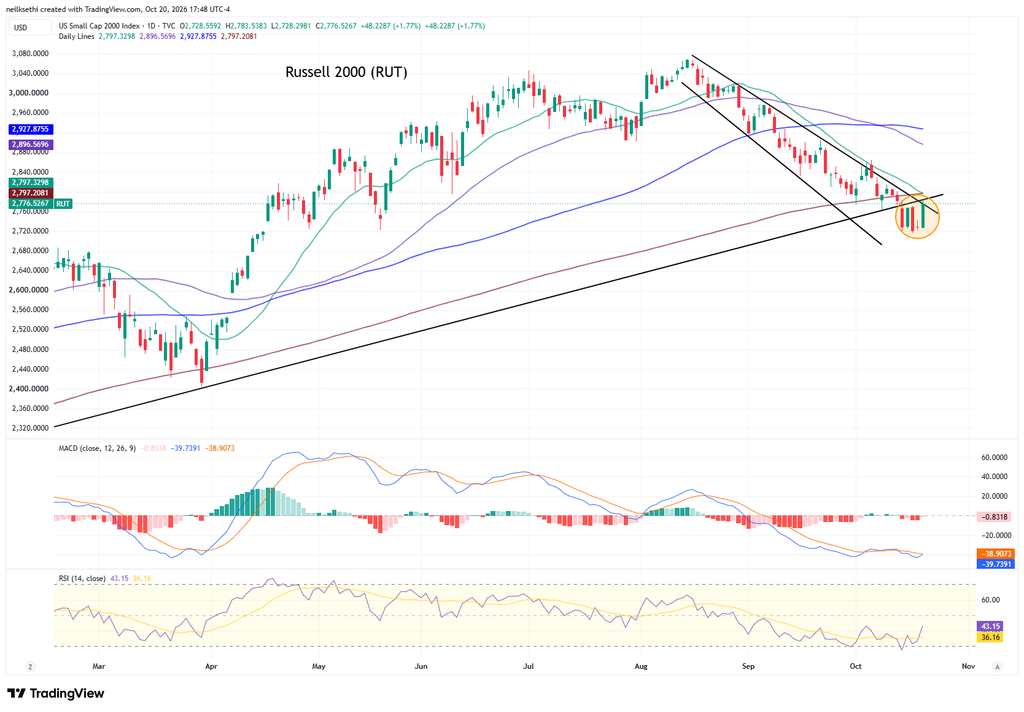
The Russell 2000 (IWM) a strong session, but it just takes it back to where it was a week ago, still in its downtrend channel below its 200-DMA. The MACD remains “go short” and the RSI under 50 although both improved with the bounce.
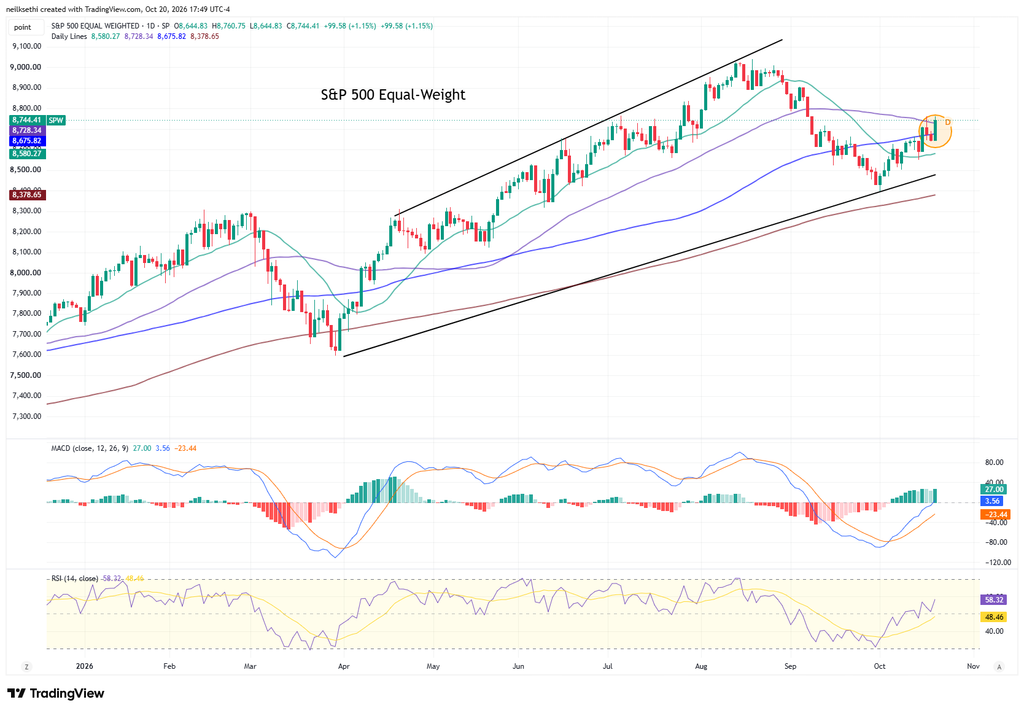
The equal-weighted SPX which I have said has been “able to hold up better” the past couple of weeks got over not only its 100-DMA but also its 50-DMA, the highest close since September 8th. If it can hold above, I will probably add tomorrow. It remains the only one with a positive MACD, and the RSI is over 50.
Treasury yields saw a bull flattening (falling more at the long end).
The 2-year Treasury was little changed at 4.78% (including the after-hours).
It is ~90 basis points above the Effective Fed Funds rate, so still calling for one or two rate hikes, but not much more than that (it historically has traded 25-50 basis points above the Fed Funds midpoint).
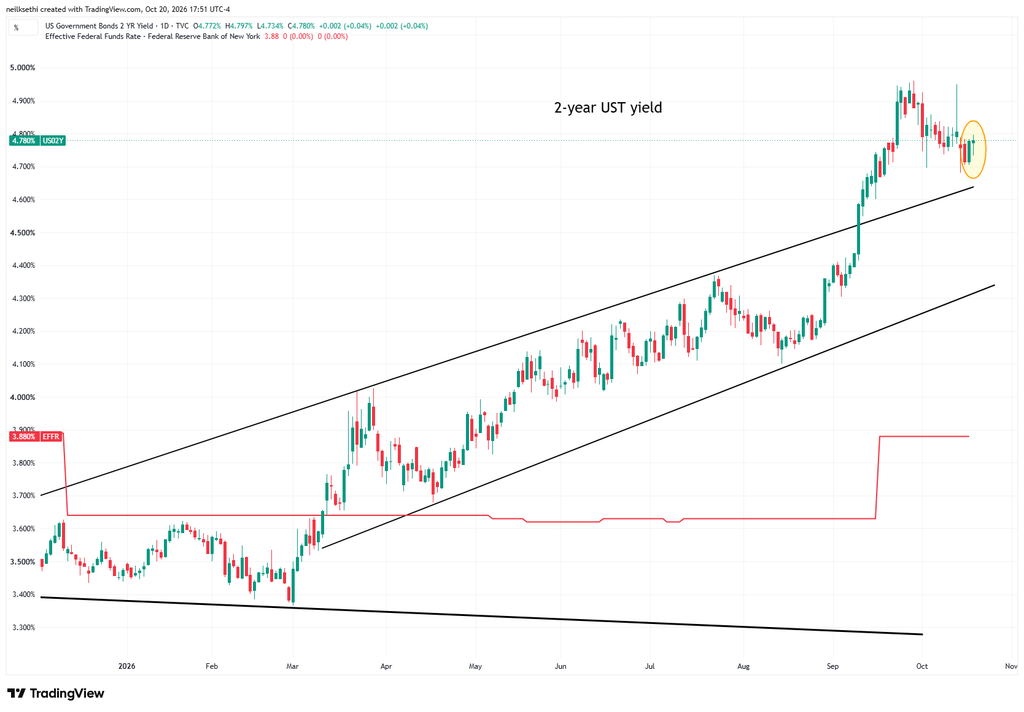
Fed rate hike expectations were also little changed with October 17% priced, December 92% priced, and two more after December next year (79 basis points of total hikes).
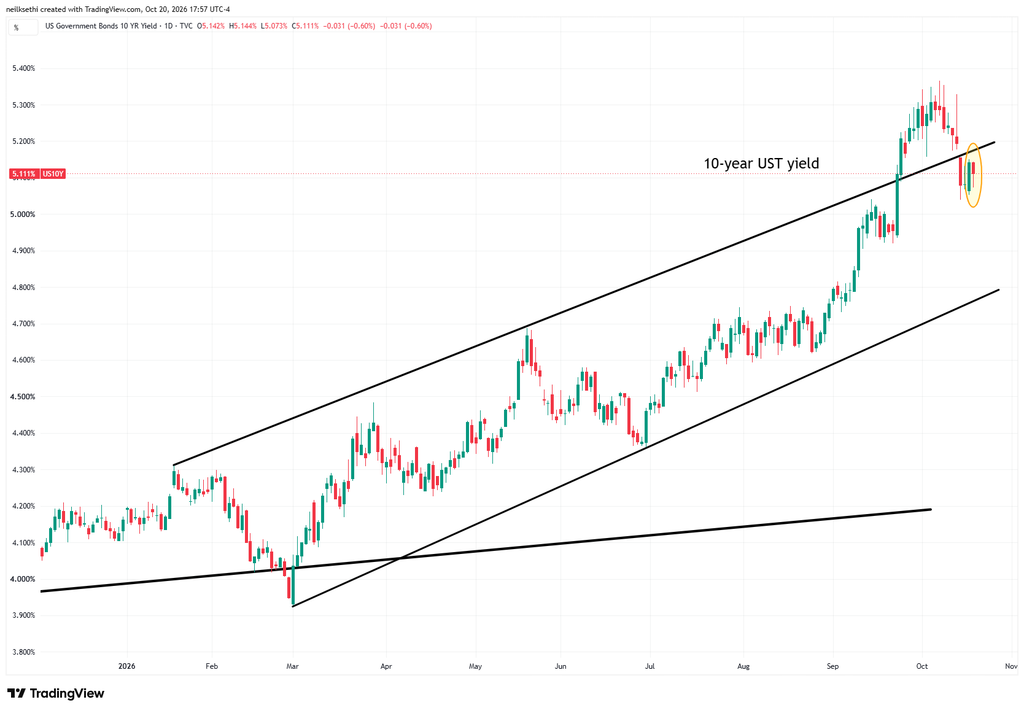
10-year yields down three basis points to 5.11% (including after-hours).
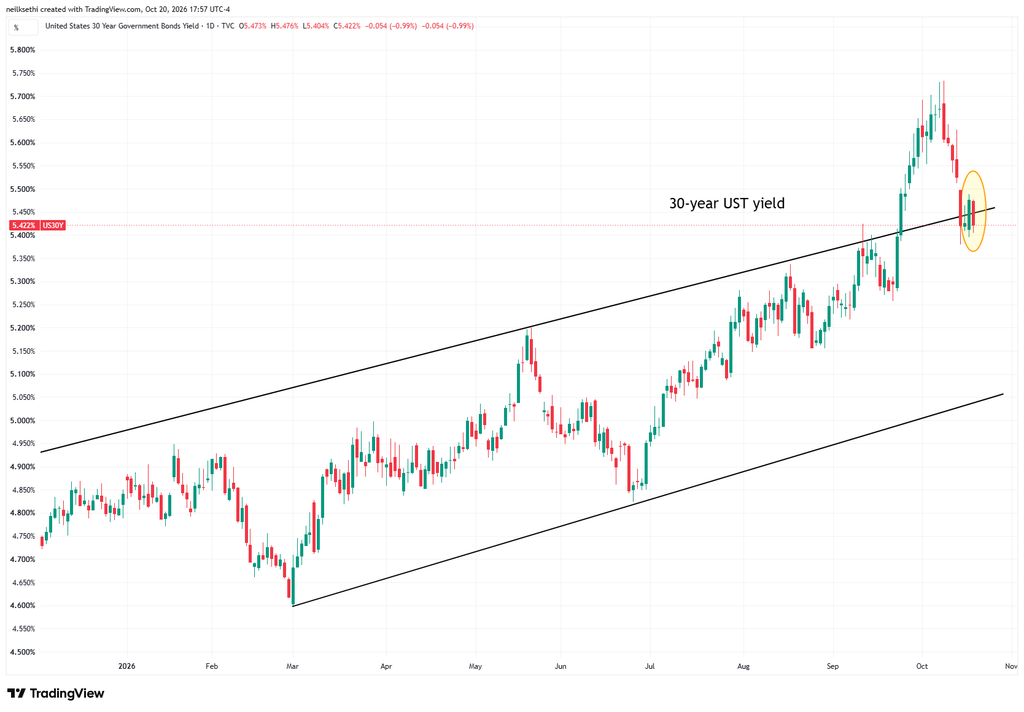
30-year yields down five basis points taking the yield to 5.42% (including after-hours).
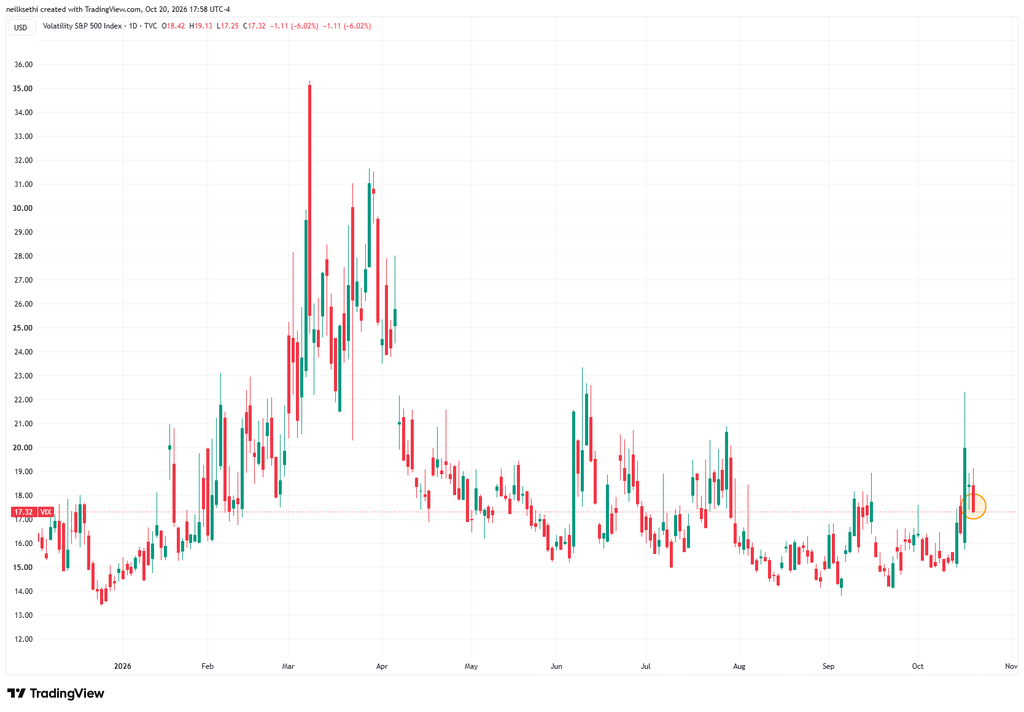
VIX eased back further to 17.3 from 20 Friday which was the highest close since July. The current level is consistent with ~1.09% average daily moves in the SPX over the next 30 days.
The VVIX (VIX of the VIX) also eased back to 97.5. The current level is consistent with “moderate” daily moves in the VIX over the next 30 days (historically, normal is 80-100, although we haven’t been below 80 since July 2024). Above 100 is the level flagged by Charlie McElligott as indicating higher stress.
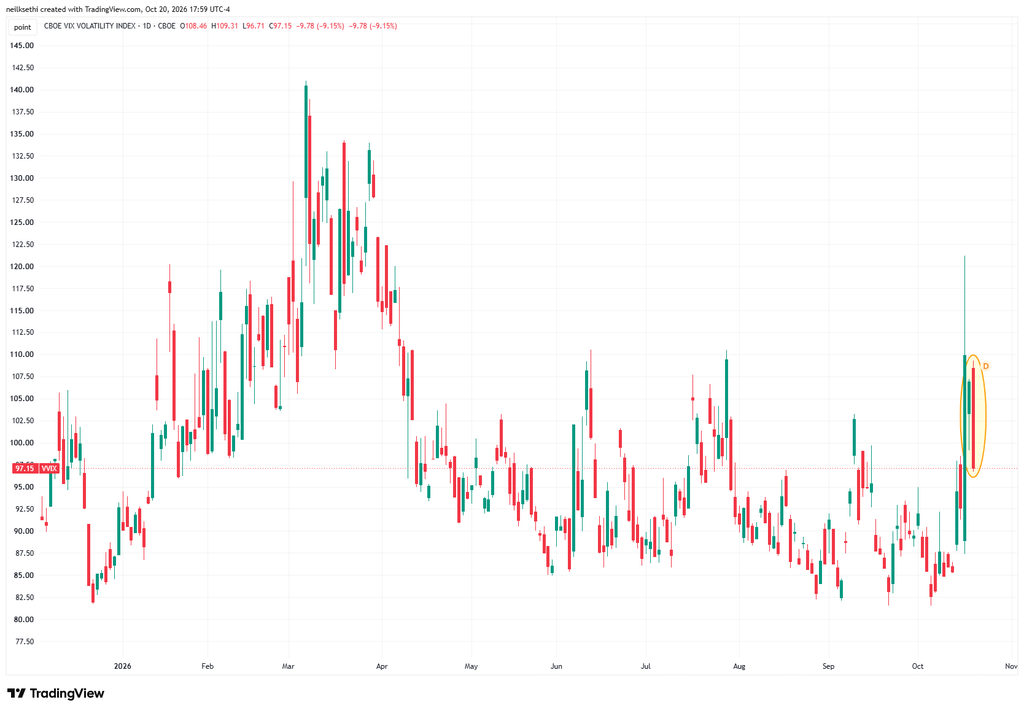
1-day VIX eased to 11.2. The current reading is consistent with a move of 0.70% in the SPX next down from ~1.5% on Friday.
Note: The following charts were after 6pm so futures have opened for Wednesday’s session.
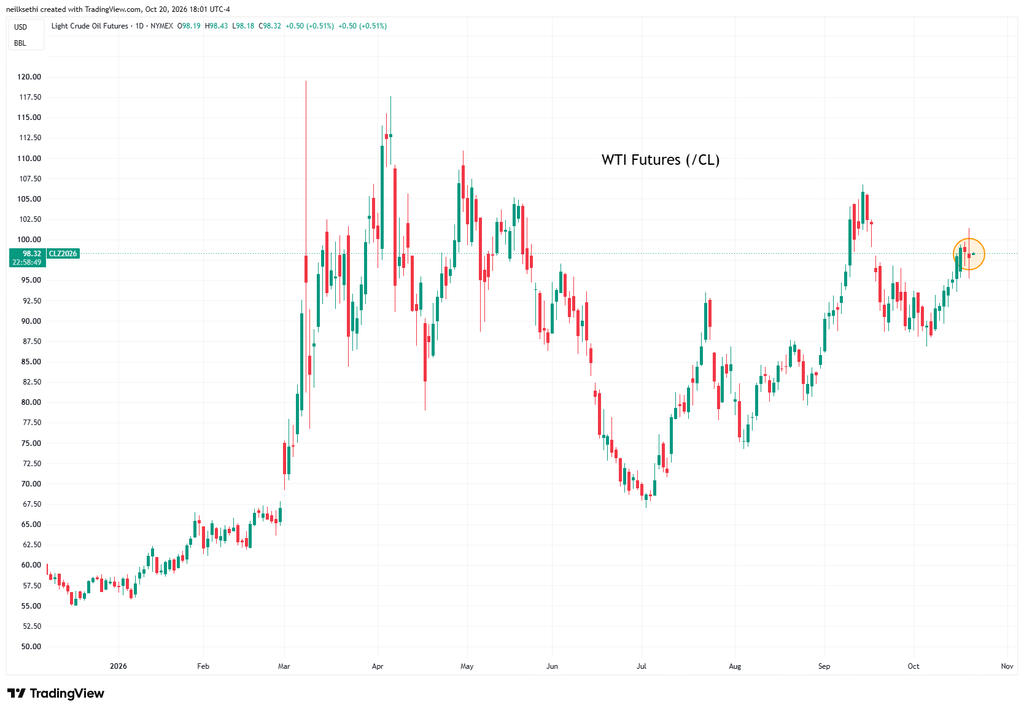
WTI futures (/CL), which TradingView has at December currently, were down again although very mildly (including after-hours).
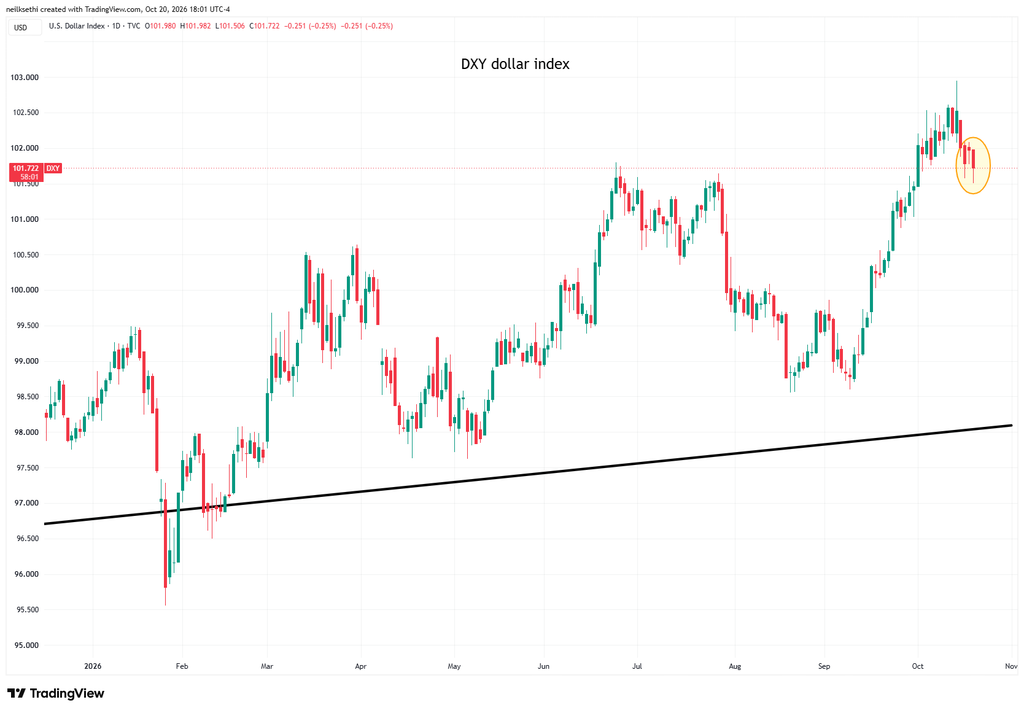
The DXY dollar index (which is fixed weighted with a heavy 57% weighting vs the euro) eased back further slipping under its 20-DMA. As I mentioned Friday “The daily MACD flipped to a ‘sell longs’ positioning while the RSI has fallen from over 70 to well under, both of which would argue for a consolidation.”
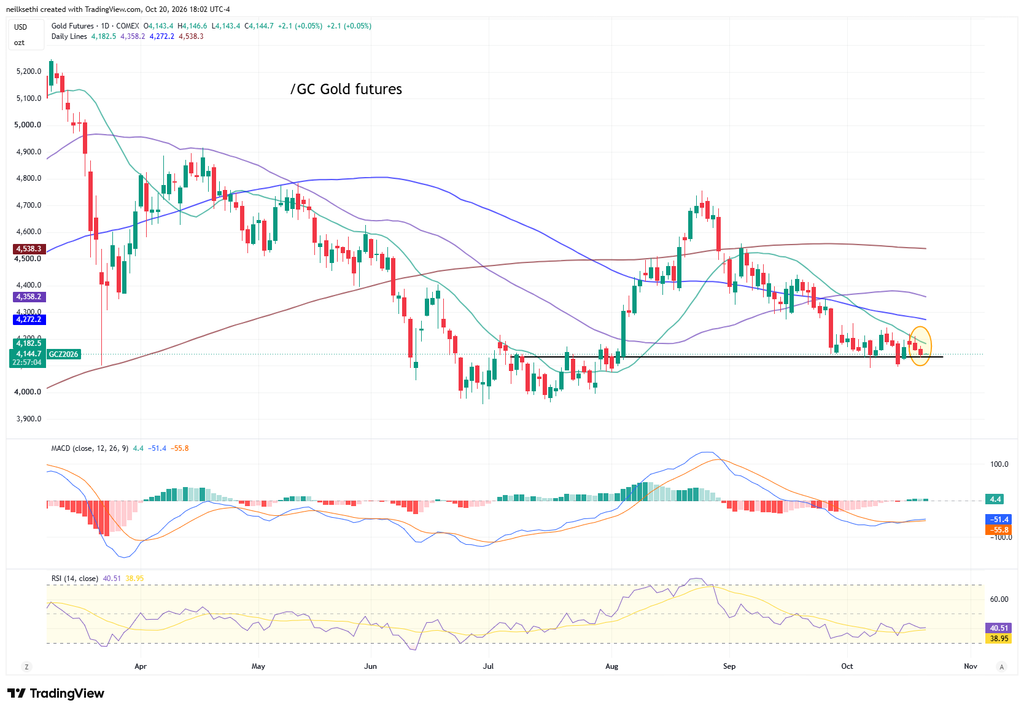
Gold futures (/GC) continue to trade just above support. The daily MACD is slightly positive but the RSI is still under 50. As I mentioned Thursday “It’s worked itself into a position for a rally if it wants to take advantage.”
If you missed it, Bob Lang wrote on gold in the Stock Market Today: Gold Looks Very Attractive
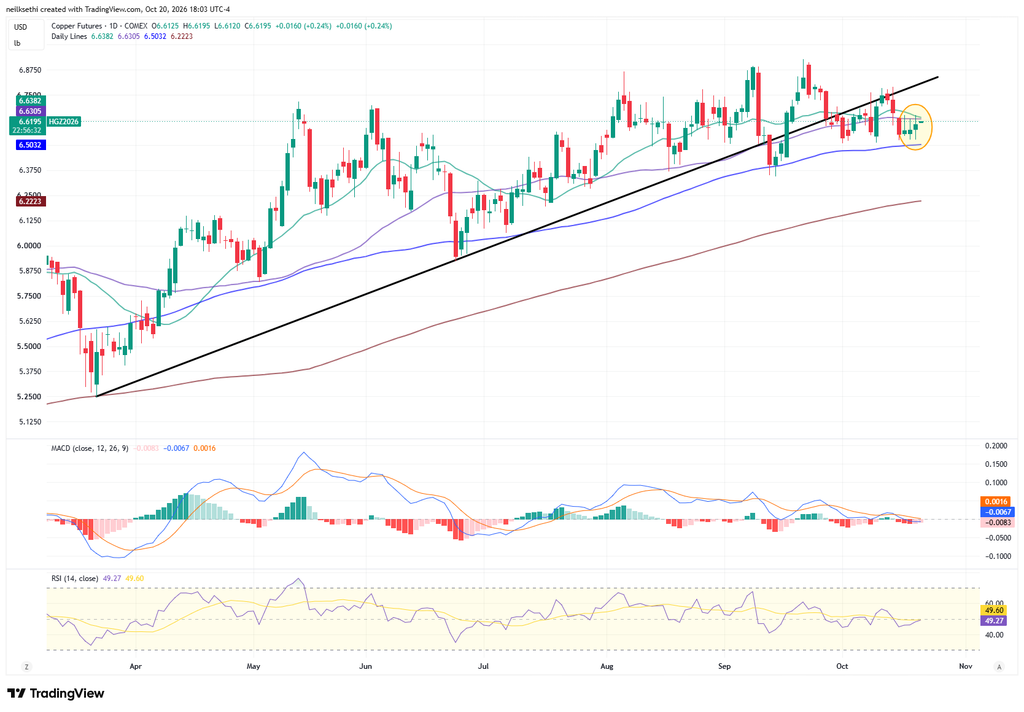
US copper futures (/HG) edged higher. Overall they still remain range bound. Daily MACD and RSI remain slightly negative.
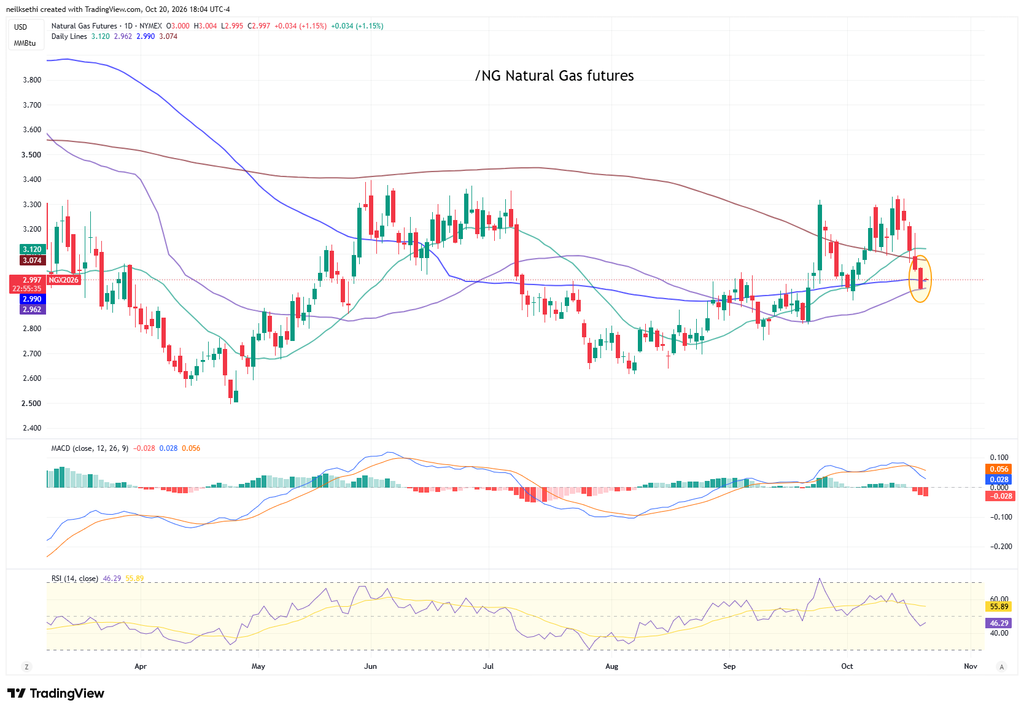
US natural gas futures (/NG) fell for a fourth session to their 50-DMA, back in the middle of their range since March.
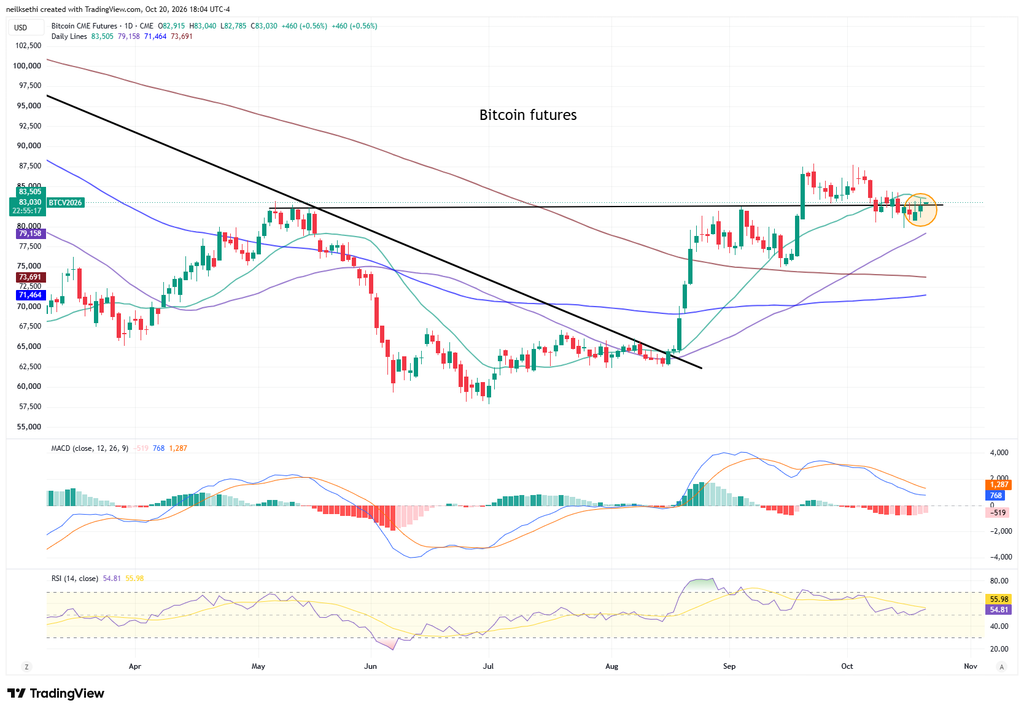
Bitcoin futures edged up to support, and it looks like the overnight session is pushing it through, although I’ll need to see more before stepping back in. Daily MACD is still negative, although the RSI is over 50.
More From TheStreet Pro:
- Chris Versace – South Korea’s Ants Renew AI and Data Center Pressure: 8 Key Items Shaping the Stock Market
- Helene Meisler – Monday’s Stock Market Rally Was Pathetic. Here’s Why.
- James “Rev Shark” DePorre –
- Stephen Guilfoyle – Rally Dreams, Millions of Jobs on Thin Ice, Canada Keeps It Together
- Bob Lang – Gold Looks Very Attractive
- Peter Tchir – Corporate Bonds Flash Warning
And From Me If You Missed It:
- Housing Starts Slide to Second-Least Since May 2020 and Single-Family Permits Weakest Since March 2023
- Pending Home Sales Plunge to a Record Low
- BofA Still Looks for October Fed Hike
- Atlanta Fed Q3 GDP Tracker Eases to +3.5%
- ADP Weekly Job Growth Estimate Pulls Back
Miscellaneous:
Wrap-Up – So Far Looks Like Just a Bounce
As I noted Sunday:
All the negativity has my contrarian impulses on high alert (I have traditionally liked to go against the grain), but I have a tough time going against both DB and Rubner, and the Goldman prime desk are no dummies. So for now, I will maintain my cautious stance on the Tech trade while being more aggressive with stocks outside of the Tech area which I have increasingly been doing the past couple of weeks as chart setups germinate.
…
And we still haven’t seen much short-covering in bonds which would add fuel to the rotation. But of course any push higher in yields could just as easily stall it out.
…
Although I would be remiss not to note that a rebound in Tech may come along with a rebound in bond yields given the tie between the two identified earlier. So AI worries are doing double duty: weighing on Tech while pulling yields lower despite hot inflation, fueling leadership in rate-sensitive and defensive sectors like Utilities, Health Care and Staples.
And then Monday:
sure enough, we did get a bounce in Tech (which is not unexpected given the severity of the losses), but for now it’s just that. After a decline like we have seen this month, it takes more than one or two days to establish a new trend. So, for now, I will retain my cautiousness on Tech, although we’ll get a test of sentiment tomorrow with SpaceX ahead of Meta on Wednesday.
Another notable from today is we did see a rise in yields come along with the Tech bounce, so the strong positive correlation between Tech and 10-year yields continues. That means to the extent we see more days like today (strong Tech, strong yields) we likely will see weakness elsewhere, keeping us in Helene’s “either/or market”.
And while Tech finished well off the lows of the session, it also finished off the highs (and in the red), more consistent with Monday’s action just being the oversold bounce I discussed yesterday. But, once again, the weakness in Tech saw yields retrace some of Monday’s gains, allowing the rest of the market to get back on track and continue the broadening trend we’ve seen for most of this month. In that regard, the positive volume metrics mentioned earlier were notable to me.
Tech gets a big test tomorrow with Meta after the close along with chipmakers Lam Research and Texas Instruments and AI-related names IBM and Tesla. They’ll give us several early datapoints on hyperscaler capex, demand for chipmaking equipment (Lam), the industrial and analog chip cycle (Texas Instruments), and how enterprises are actually adopting AI (Meta, Tesla and IBM).
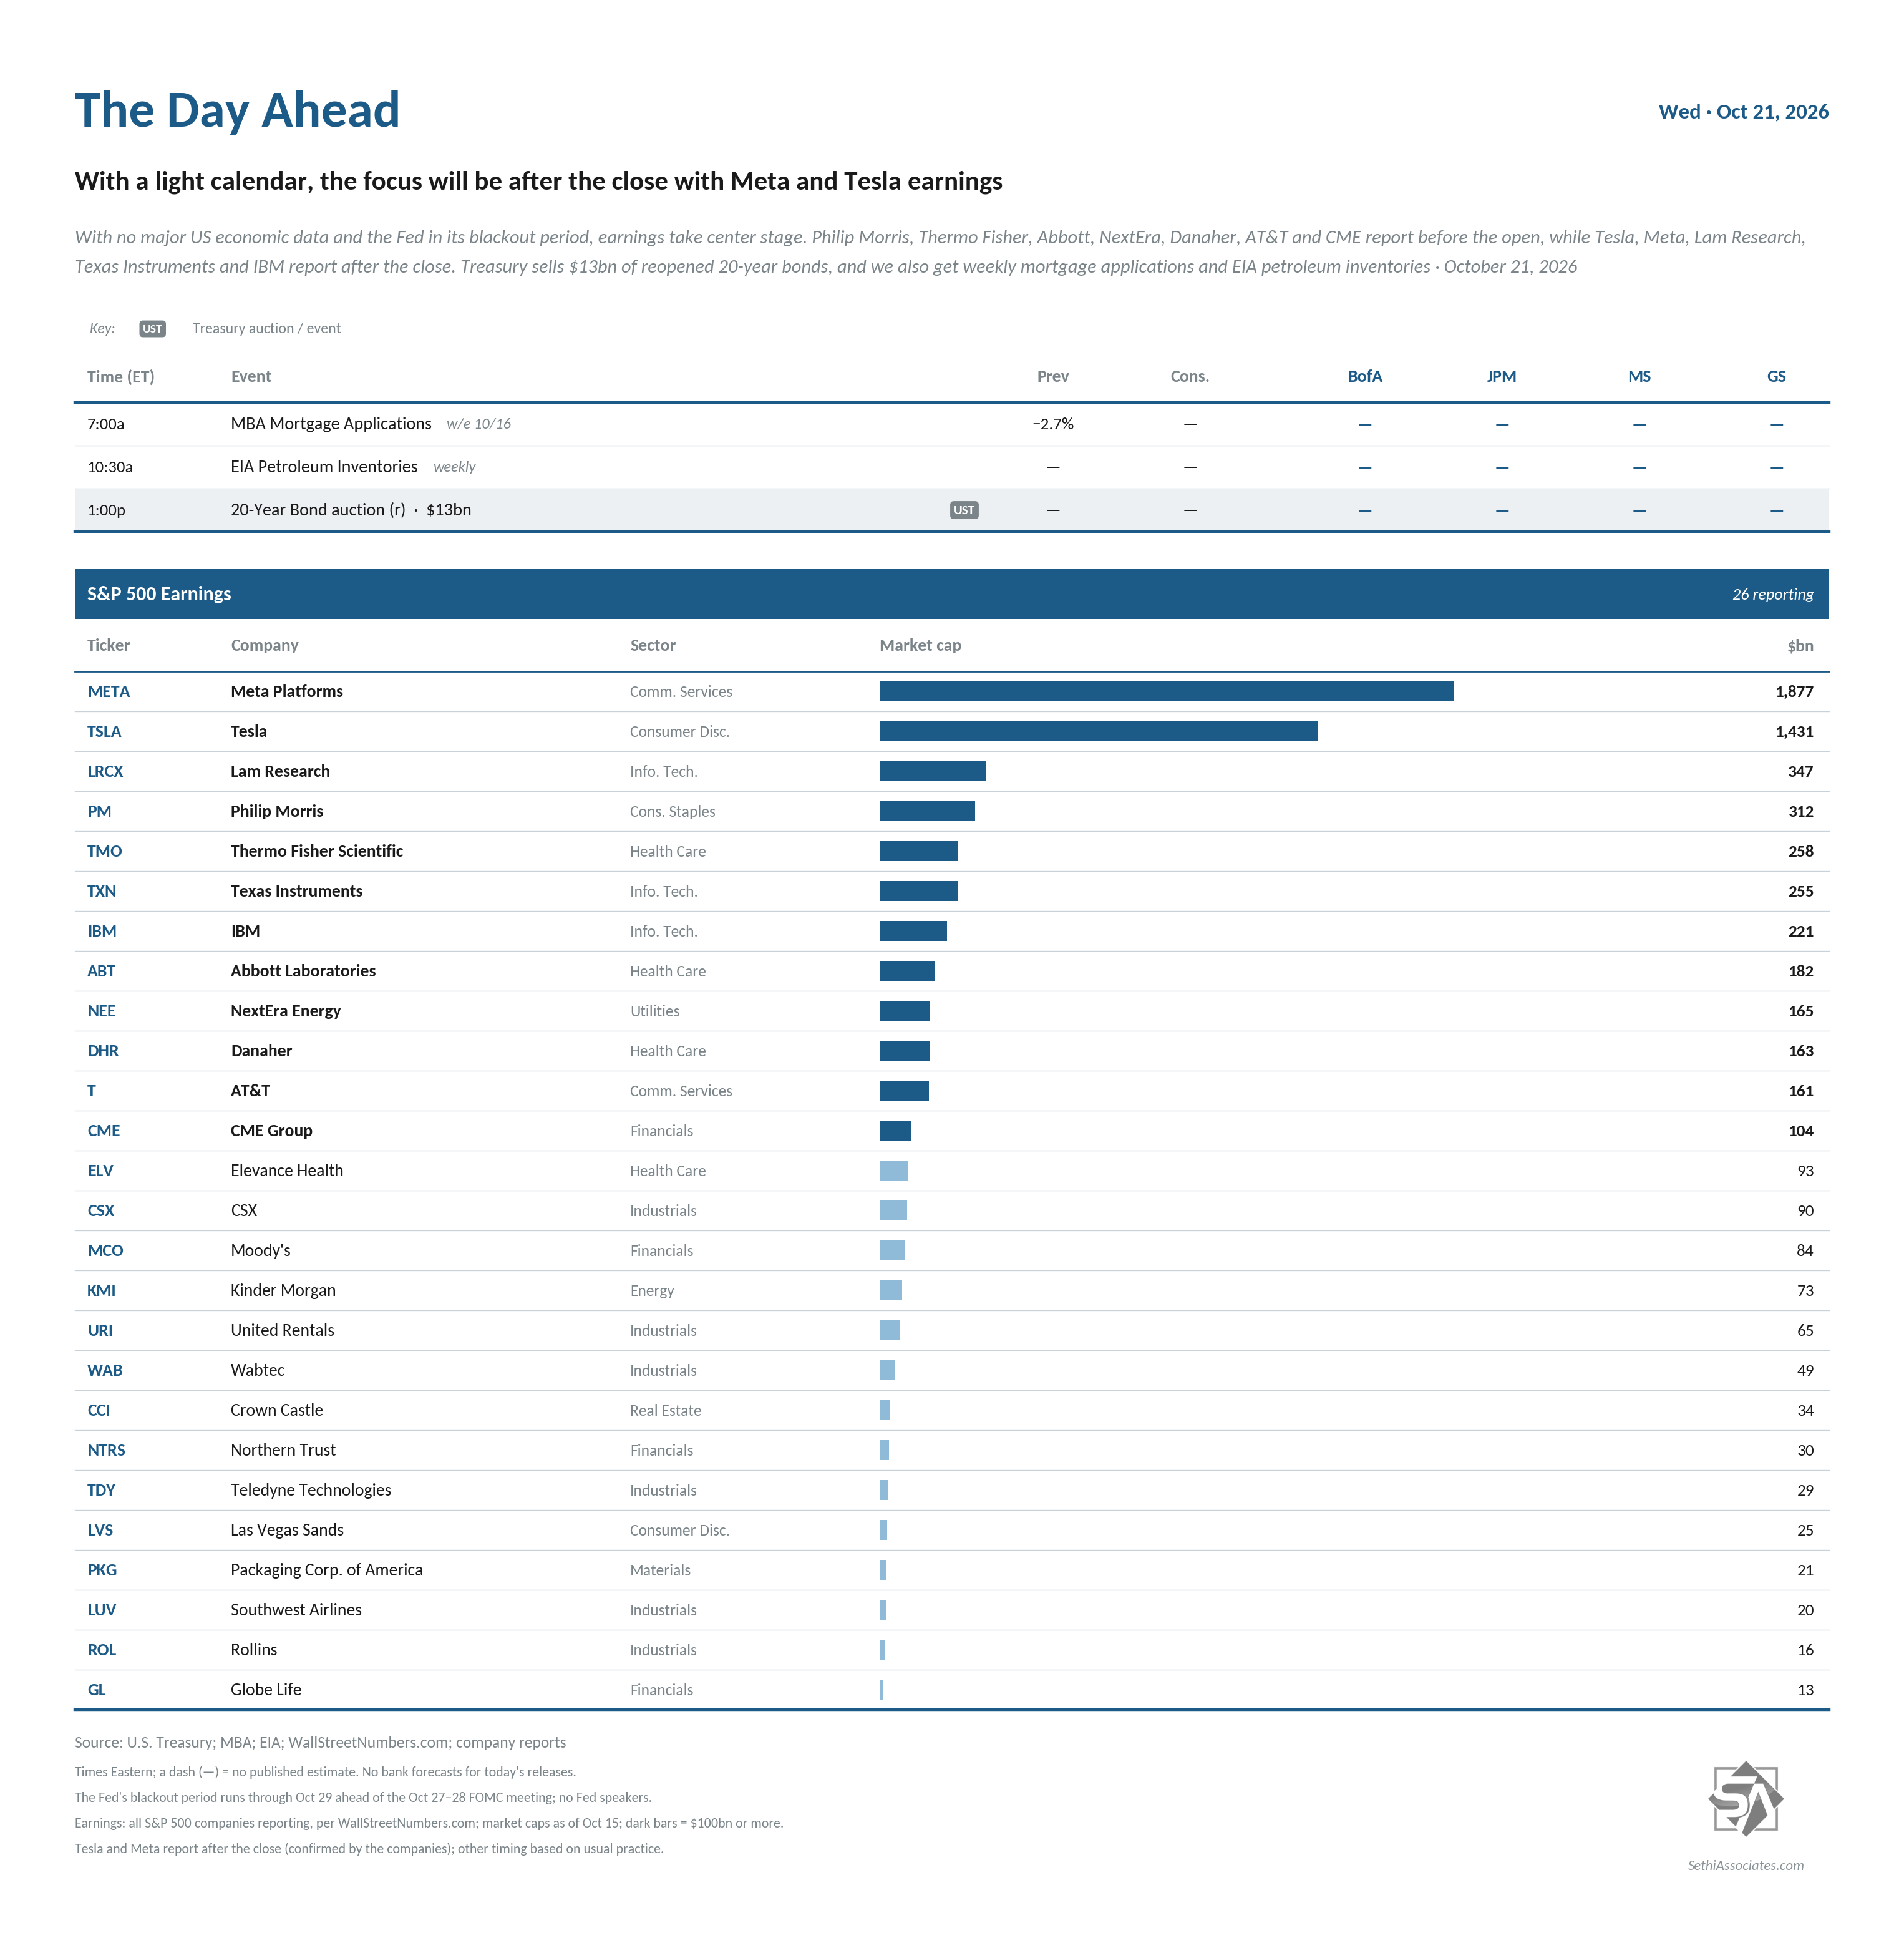
The Day Ahead – Focus Is After the Close
US economic data is light Wednesday, with only weekly mortgage applications and EIA petroleum inventories.
The Fed remains in its blackout period ahead of next week’s October 27–28 FOMC meeting.
Non-Bill (>1yr in maturity) US Treasury auctions resume with a $13bn 20-year bond reopening.
Q3 earnings season continues with 26 S&P 500 components including a number of AI-related names: Meta Platforms (META), Tesla (TSLA), Lam Research (LRCX), Philip Morris (PM), Thermo Fisher Scientific (TMO), Texas Instruments (TXN), IBM (IBM), Abbott Laboratories (ABT), NextEra Energy (NEE), Danaher (DHR), AT&T (T), CME Group (CME), Elevance Health (ELV), CSX (CSX), Moody’s (MCO), Kinder Morgan (KMI), United Rentals (URI), Wabtec (WAB), Crown Castle (CCI), Northern Trust (NTRS), Teledyne Technologies (TDY), Las Vegas Sands (LVS), Packaging Corp. of America (PKG), Southwest Airlines (LUV), Rollins (ROL) and Globe Life (GL).
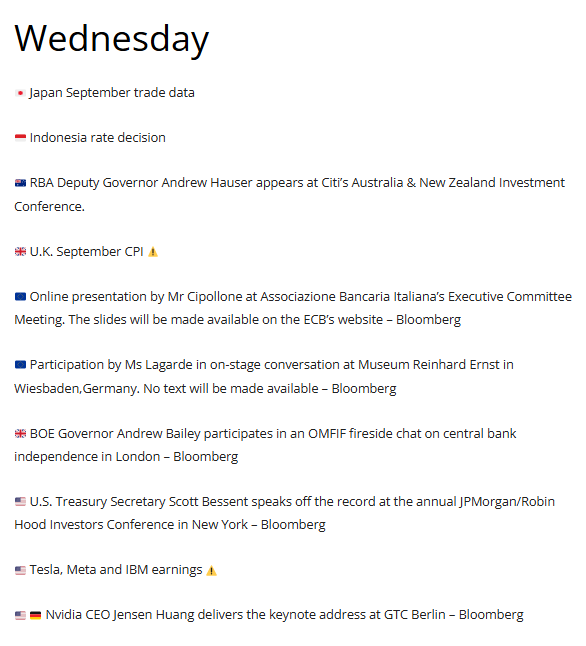
Ex-US highlights are UK September CPI, PPI, RPI, public finances, August house price index, Japan September trade balance, New Zealand Q3 CPI.
From Christophe Barraud’s international Week Ahead rundown:
At the time of publication, in terms of equities mentioned, Sethi was long AMZN, CRM, NFLX, SPCX, T, SPY, RSP, CPER, and numerous equities in the energy sector.
As a reminder comments are encouraged. If they are directed at me, please put @NeilSethi in front.