Don’t Ignore Message From Nvidia, Broadcom, Micron, Sandisk Charts
Some of the biggest names in tech are underperforming the market, which is still in consolidation mode.
You've reached your free article limit
You've read 0 of 1 free Pro articles.
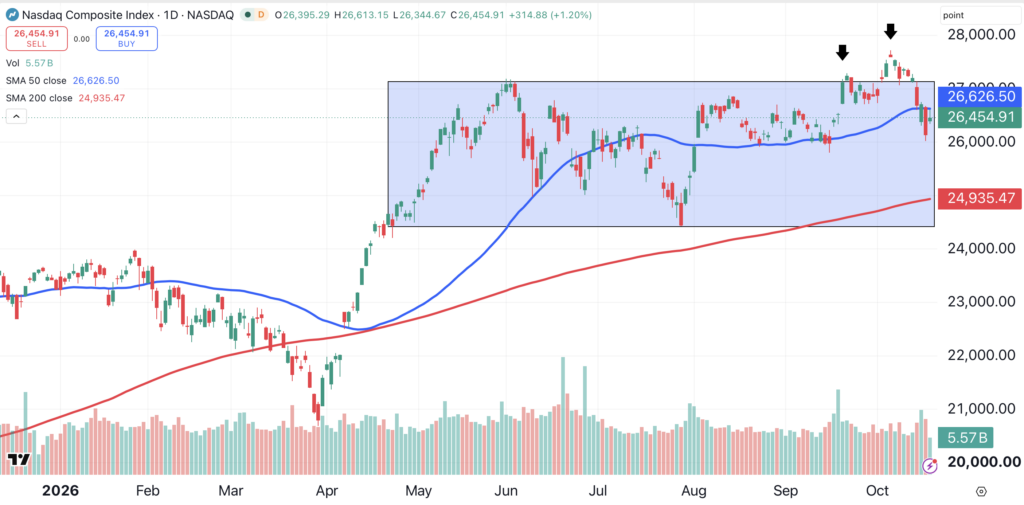
Tech stocks have been all over the map this year. Year to date, the Nasdaq Composite has reached 24 record closing highs, the last one coming on Oct. 6.
Despite this, the tech-laden index closed below its 50-day moving average on Monday. The Nasdaq Composite has been range-bound for the past six months (shaded area), with several false breakouts over that time (arrows).
Charts via TradingView
The semiconductor sector has been especially hot this year. The bellwether Philadelphia Semiconductor Index has gained nearly 60% year to date, outperforming the Nasdaq Composite, which has gained 13.7%.
But if you compare the Nasdaq Composite (above) to the Philadelphia Semiconductor Index (below), the Nasdaq has the better chart. The SOX has formed a bearish descending triangle pattern (black lines).
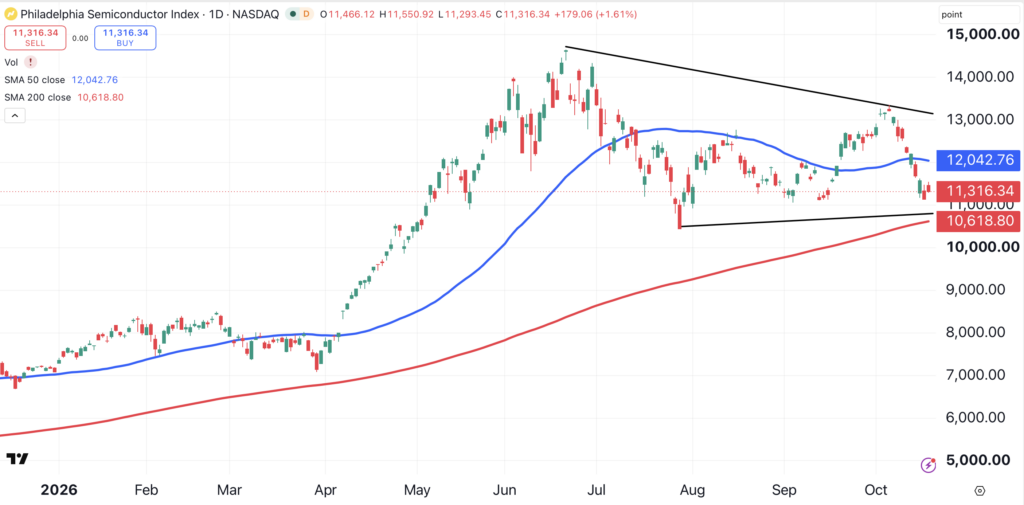
While the Nasdaq’s latest high occurred earlier this month, the Philadelphia Semiconductor Index last reached an all-time high on June 22.
Nvidia
The largest component of the SOX is Nvidia (NVDA), which makes up about 10% of the index. Nvidia reached an all-time high earlier this month, but a breakout to new highs on Oct. 6 failed (arrow).
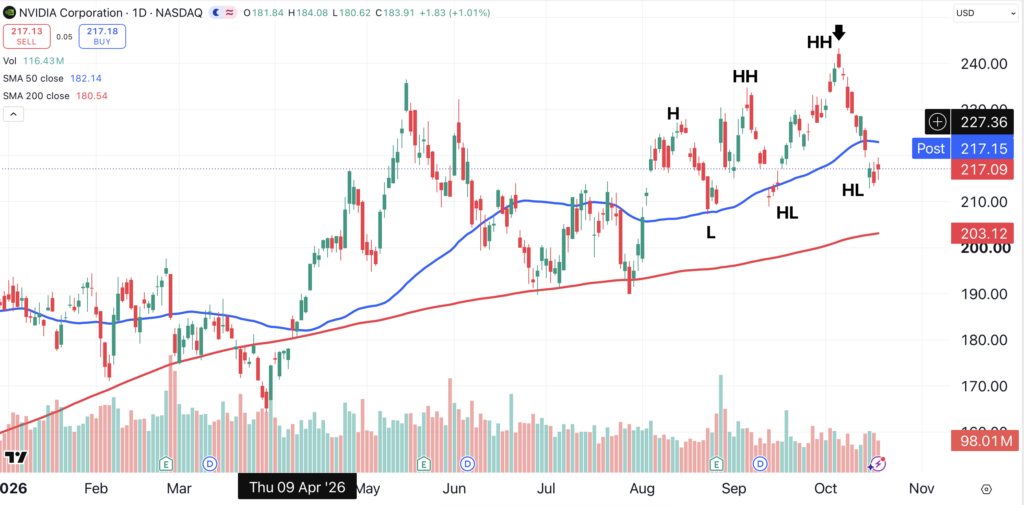
Despite that failure, Nvidia has formed a recent series of higher-highs (HH) and higher-lows (HL), a bullish sign. Because of this pattern, Nvidia still has the look of a potential market leader. As of Monday’s close, Nvidia was trading about 10% below its all-time high.
Broadcom
I cannot say the same for Broadcom (AVGO), which also makes up about 10% of the SOX. Broadcom reached a six-month low last week (arrow), and is trading below its 200-day moving average (red line). Broadcom is now 30% below its all-time high, set in early June.
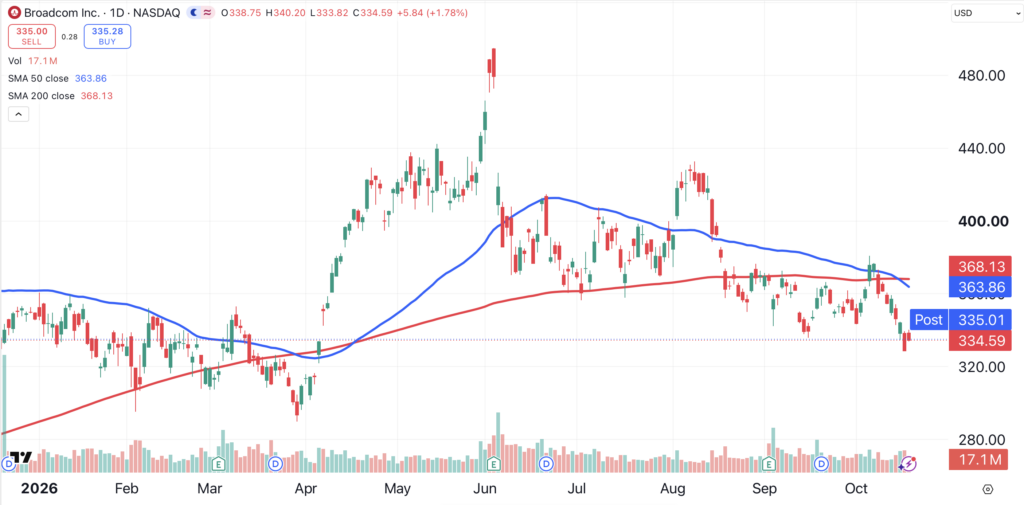
In June, we indicated that we would sell our Broadcom shares if the stock fell below its 50-day and 200-day moving averages. The stock has spent most of the past two months below both of those indicators.
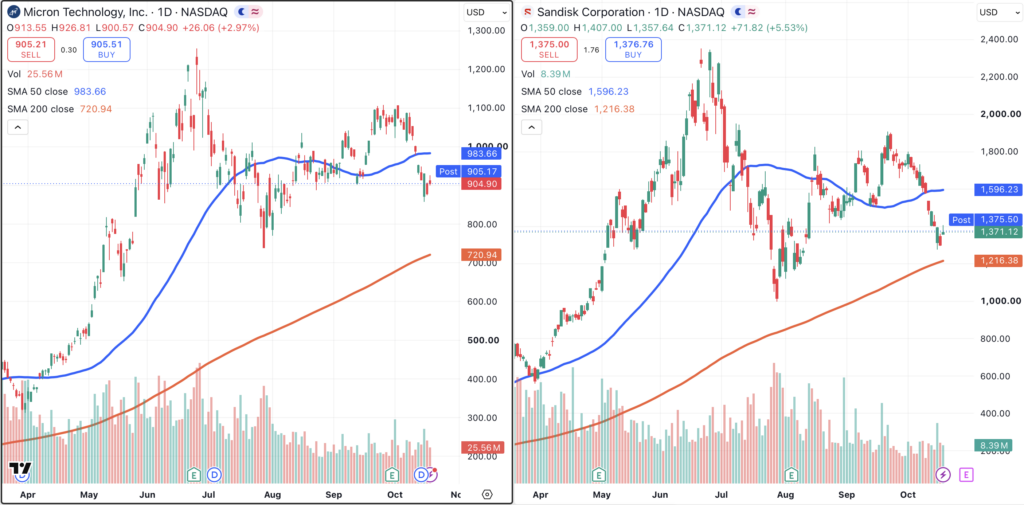
Micron (MU) (left chart) comprises about 8% of the SOX, and looks similar to Sandisk (SNDK) (right chart), which is not part of the index. Sandisk is primarily considered a flash memory and data storage company.
Stuck In Neutral
There are many charts in the semiconductor industry, and many tech stocks in general, that have a similar look — a lower-high, a higher-low, with the 200-day moving average still rising.
This look is neither bullish nor bearish, but neutral. Both names would turn bearish if they close below their respective 200-day moving averages. Micron’s 200-day moving average is currently located at $720, and Sandisk’s is located at $1,216.
Bottom Line
Some of the biggest names in tech are underperforming the market, which is still in consolidation mode. Meanwhile, other sectors are stealing the spotlight.
Energy names continue to run, with APA Corp (APA), ConocoPhilips (COP), and EOG Resources (EOG) all reaching 52-week highs within the past week. Healthcare and industrial stocks are also stronger than the overall market. By moving some capital away from tech and into these sectors, investors can diversify their holdings while reducing portfolio volatility.
At the time of publication, Ponsi was long APA, COP, EOG, and NVDA.