Monday’s Stock Market Rally Was Pathetic. Here’s Why.
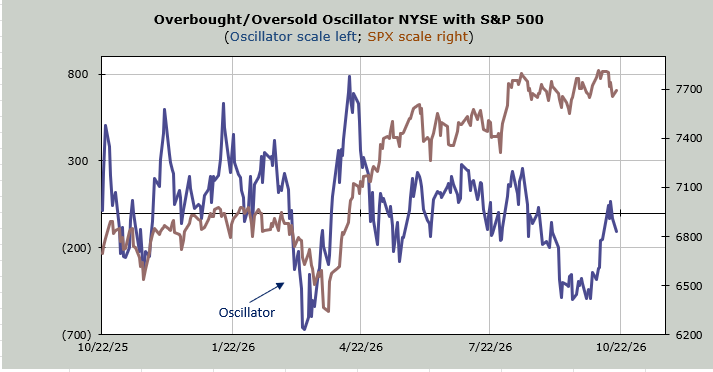
Investors are complacent. Even in stocks that are sinking. Until something changes, we won’t get a lasting and meaningful rally.
You've reached your free article limit
You've read 0 of 1 free Pro articles.

That was one pathetic rally, wasn’t it?
But are folks bearish? Not the way you would expect them to be.
Each day I look at dozens of charts, and there are so many that look like those rocket/aerospace charts I showed here yesterday. And then there are those that are not so far down as to appear on the new low list, but they are now quietly breaking under their 200-day moving average lines.
A few months ago, we discussed how many stock charts were breaking their 50-day moving average lines. Now the 200-day moving average lines are coming into play. But first let’s talk about the 50-day MA.
Fifty trading days ago was mid-August. With so many stocks well below their mid-August levels, that means many of these 50-day MAs are rolling over.
Look at the Bank Index, which I turned cautious on in early August. But even I thought at 172-175 it would find support and rally. It lasted two days. The blue line is the 50 DMA, and it has clearly rolled over. And we keep replacing higher prices with lower prices, so it will continue heading down for now. As I explained then, declining moving average lines are harder to recapture than rising ones.
But what I want you to see is the red line. That is the 200 DMA, and the Bank Index is now below it. That line is still flat to up, so it’s not as hard to get back over it. Yet I have started to notice how many charts are slipping under the 200 DMA.
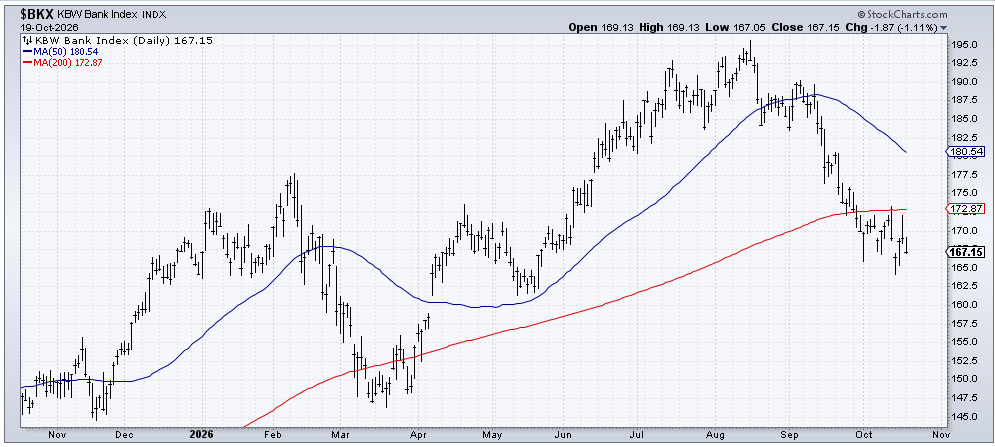
I note this because, please glance again at the chart and see that in March the Bank Index broke under the 200 DMA. But you know what we had in March that we don’t have now? Panic. Fear. Bearishness.
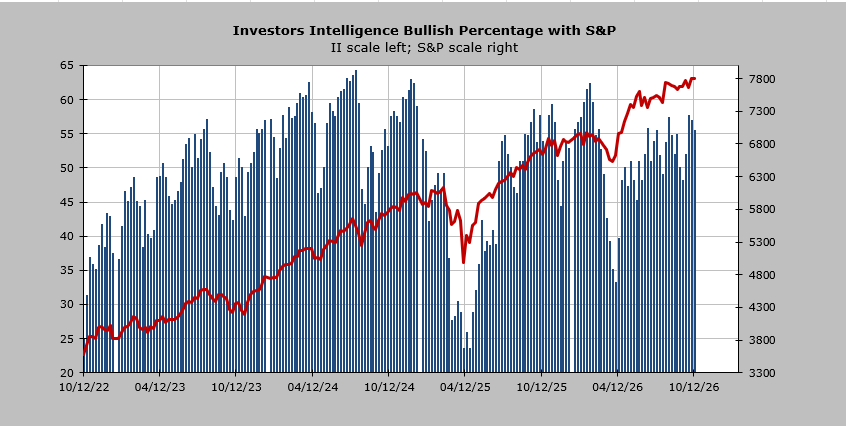
In March, the Investors Intelligence bulls were at 33%. Last week’s reading was 56%. I expect it will be lower when it is released later this week, but is it going to fall 20 points in a week? I doubt it.
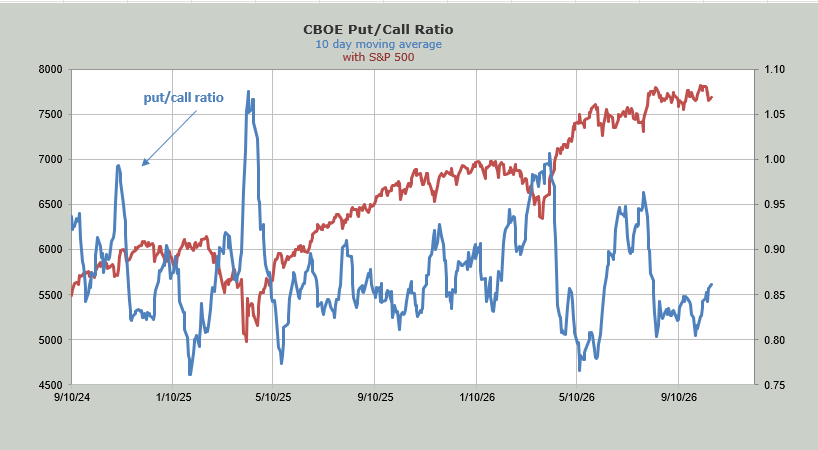
In March, the put/call ratio’s ten-day moving average surged up to 1.01. Monday’s reading is .86.
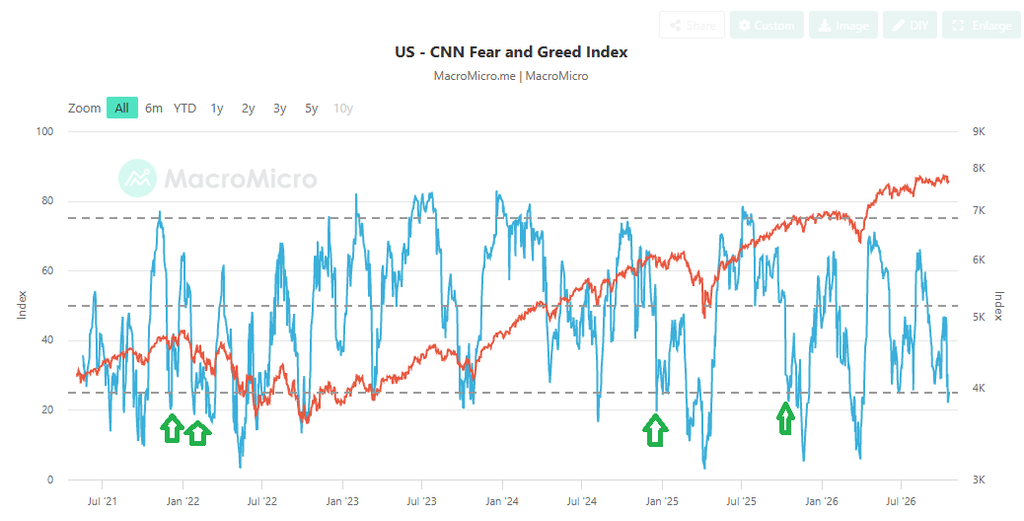
And yes, I know the CNN Fear and Greed (not an indicator I love for a variety of reasons) is showing ‘fear,’ but take a closer look at it. I noted at least four times (green arrows) it fell under the dashed line (fear), and the rallies were short-lived. The good rallies? When this plunges, not when it leaks.
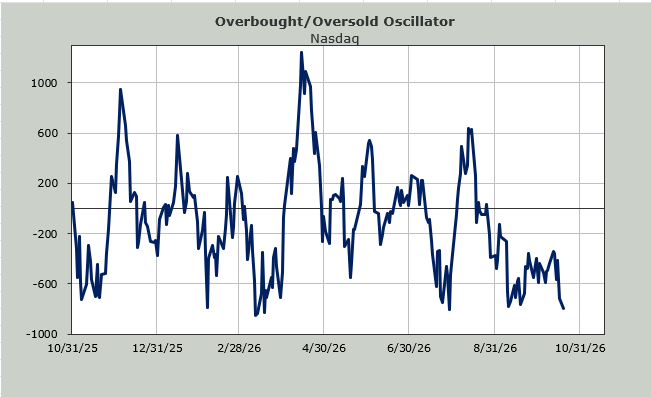
The ingredients for an oversold condition exist, more so in tech-land than in the others right now, but sentiment remains complacent in my view. Change sentiment, and it changes the malaise we’ve endured for months now. Keep it complacent and not much changes.