Another Sentiment Indicator Shows a Bearish Turn
The tech stocks are due for an oversold rally. Sentiment remains complacent, but more bears are joining the fray.
You've reached your free article limit
You've read 0 of 1 free Pro articles.

The Market
I know the tech stocks didn’t rally today. I know folks are disappointed. Anecdotally, I can hear and see the frustration. It’s in the emails I get. It’s all over social media. It’s in the research reports I read.
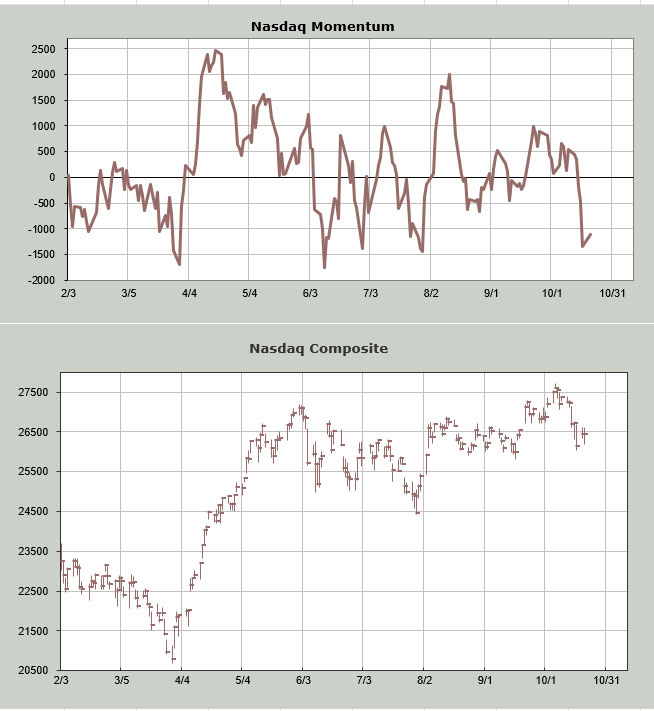
But please remember my initial note said Nasdaq would be oversold midweek this week, using my Overbought/Oversold Oscillator. Here we are at midweek.
My note on the weekend said the time frame for a rally was wide: it was Tuesday until Monday when we looked at the Nasdaq Momentum Indicator. And despite Nasdaq being down today, the Momentum Indicator ticked up. There is still room for it to come down again (until Monday), but this is the neighborhood we should start looking for an oversold bounce.
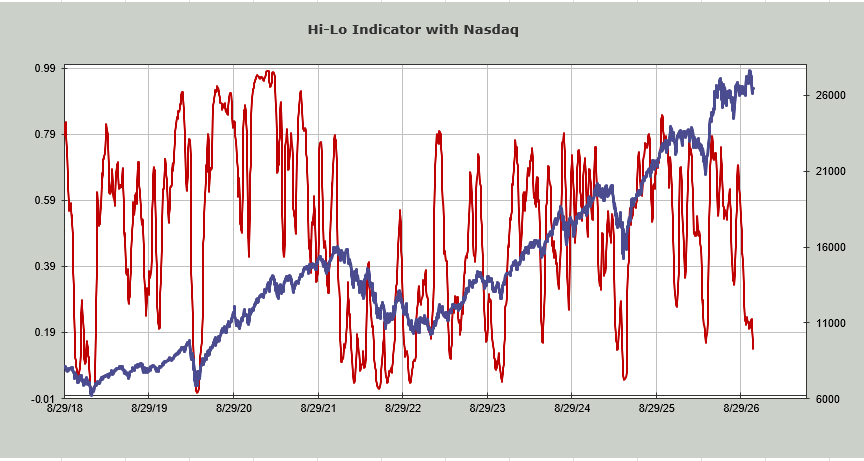
Then there is the Nasdaq Hi-Lo Indicator. I had thought it would scoot under .19 this week, and now it has. It resides at .14. That makes it oversold.
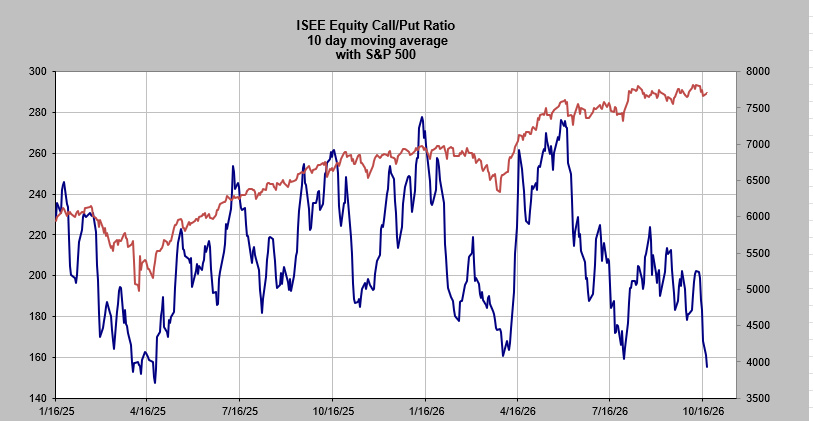
And sentiment? I still think it’s too complacent, but I can add one other (aside from NAAIM Exposure) indicator to the mix that folks are getting bearish: the ISEE Equity call/put ratio’s ten-day moving average has now sunk to levels not seen since the Tariff Tantrum. Remember, these are mostly retail traders, so you can see how their sentiment has shifted.
Let me finish by saying so many of these big cap tech stock charts look like tops, but I still think they are due a rally.
New Ideas
As noted here yesterday, I am going to do my best to find some down-and-out stocks that I would call tax loss rally candidates. Yesterday we looked at Aloca. In an effort to find different groups, today I have found a homebuilder and a financial. One thing to keep in mind: these are not investments; they are trades.
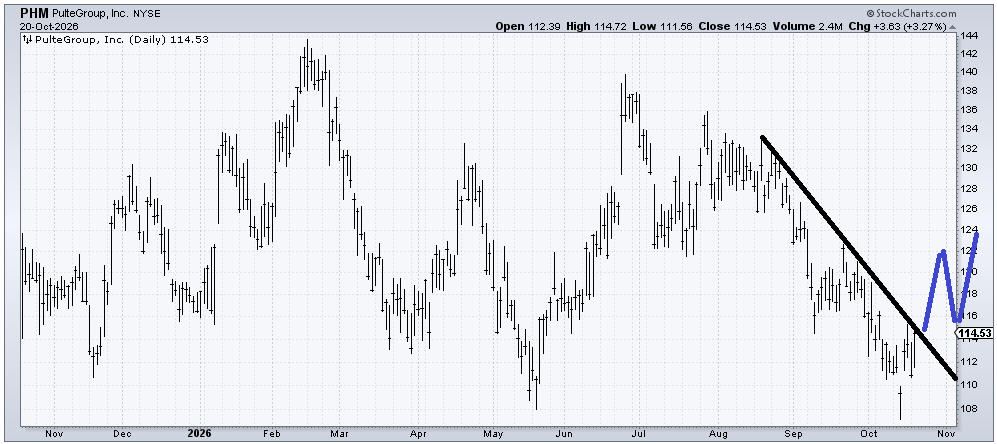
Pulte (PHM) seems to have an island down below. Getting up and over that line around 115, I can see it mapping out as I have drawn in blue. Keep in mind it’s the pattern I am looking for rather than the exact price.
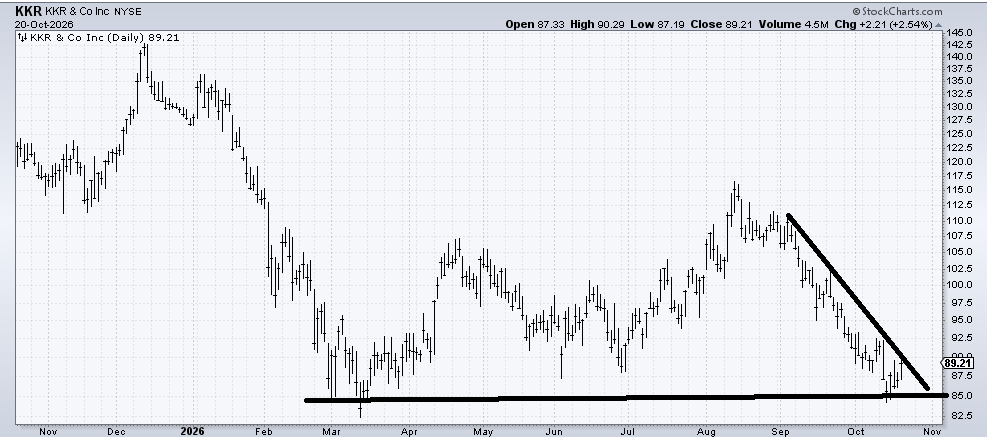
Do you remember when the private equity stocks took it on the chin last spring (after the May high)? Well, they came right back down again off the August high, and now KKR (KKR) looks like if it crossed that line (90-ish), it ought to enjoy a rally.
Today’s Indicator
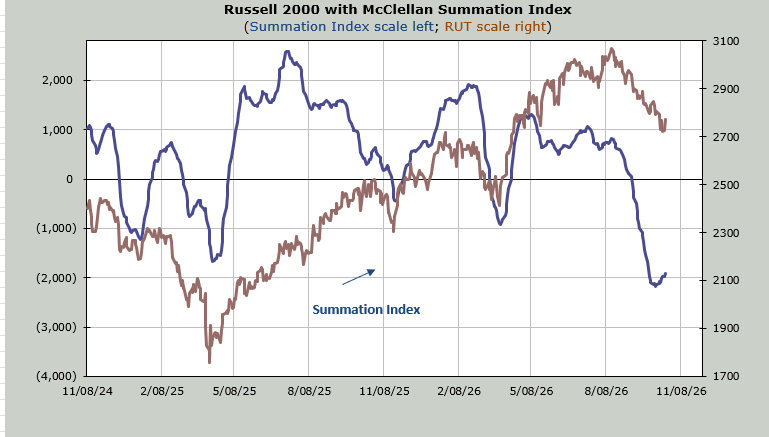
The McClellan Summation Index is still heading upward (Nasdaq’s is not). It would need a net differential of -1400 advancers minus decliners on the NYSE to halt the rise.
Q&A/Reader’s Feedback
Helene welcomes your questions about Top Stocks and her charting strategy and techniques. Please send an email directly to Helene with your questions. However, please remember that TheStreet.com Top Stocks is not intended to provide personalized investment advice. Email Helene here.
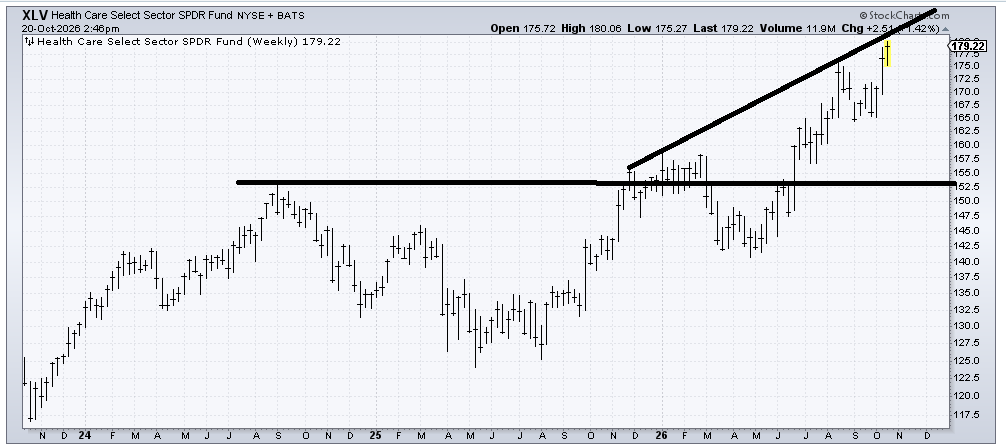
I was asked for the upside measured target on XLV, an ETF to be long healthcare. This is a three-year weekly chart, and it measures to the low to mid 180s. I am still a fan of most (not all) drug stocks, but I am not interested in buying them unless there is a decent pullback/correction.
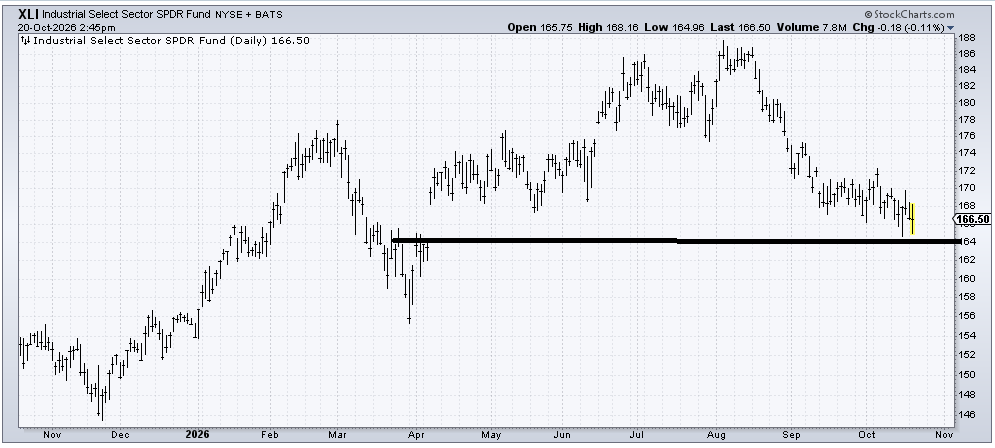
I like that XLI, an ETF to be long industrials, has filled the gap at 164. I don’t like that it looks like a big top. The problem, as you can imagine, is that Caterpillar is the largest holding and that has traded poorly. A break of 164 and this gets worse. Although Boeing (BA), another component, is probably ok for a trade.
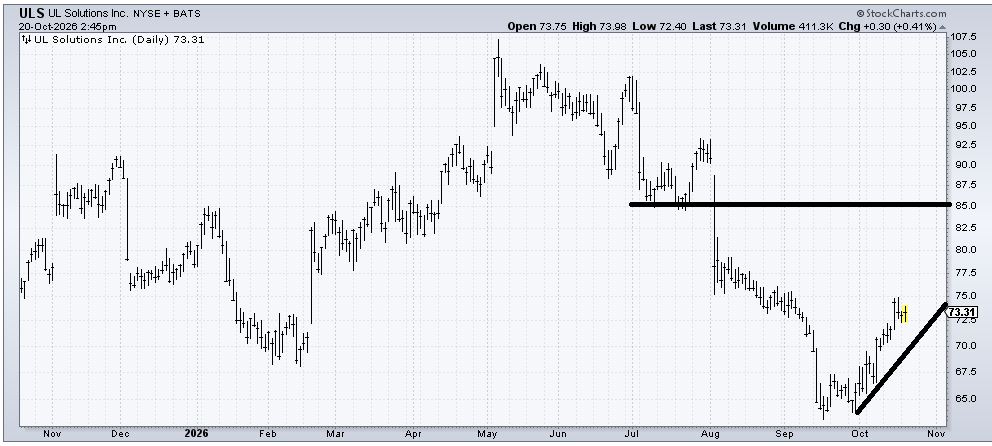
The good news is UL Solutions (ULS) met its downside target when it got to 65. The bad news is that there is resistance all the way up. I would take a stab on a pullback to that steep line because the risk/reward is decent there: under the line, and you know you are wrong/perhaps early.