I’m Lowering My Price Target for RTX Despite Earnings Beat
The quarter was great, guidance awesome, and cash flow roaring. Let’s dive into the numbers and check the chart.
You've reached your free article limit
You've read 0 of 1 free Pro articles.
Key defense contractor RTX (RTX) released its third-quarter financial results this morning, revealing top- and bottom-line beats.
RTX reported alongside fellow defense name Northrop Grumman (NOC), and both stocks are performing well in the early going, despite what looks to be a weak tape. Your author is long RTX as that is my top pick in the space. My other pick, Lockheed Martin (LMT) is set to release numbers this Thursday.
RTX posted an adjusted earnings per share of $2.26 (GAAP EPS: $1.89) on revenue of $24.965 billion. The sales print was good for annual growth of 11.1%. RTX can now boast a $340 billion order backlog, which surprisingly, at least to me, is slightly more than half, driven by commercial clientele, despite the federal government’s drive to replenish its depleted arsenal.
“Our strong execution and operational focus in the third quarter enabled RTX to deliver double-digit organic sales growth across commercial aerospace and defense,” said Chairman and CEO Chris Calio in the press release. “Demand for our products remains robust with over $81 billion of new commercial and defense awards, resulting in a record backlog of $340 billion.”
Then came the part that investors had hoped for, as Calio added: “Given our performance year to date, we are again raising our full year outlook for adjusted sales, adjusted EPS, and free cash flow. We remain focused on increasing output, optimizing our cost structure, and investing in new technologies to support our customers and drive continued growth.”
Operations
As total sales grew 11.1% to $24.965 billion, total costs and expenses increased 8.8% to $21.789 billion. That put the unadjusted operating income at $3.337 (+32.3%) as unadjusted operating margin improved from 11.2% to 13.4%. After accounting for interest, taxes and all other income and expenses, unadjusted net income attributable to shareholders soared to $2.583 billion (+34.7%). This works out to a fully diluted unadjusted EPS of $1.89, up from the year ago comp of $1.41. After adjustments, the EPS print lands at $2.26, up from $1.70.
Segment Performance
- Collins Aerospace generated sales of $8.382 billion (+10%), producing an operating profit of $1.789 billion (+42%) on an operating margin of 21.3% (up from 16.5%).
- Pratt & Whitney generated sales of $9.231 billion (+10%), producing an operating profit of $608 million (-19) on an operating margin of 6.6% (down from 8.9%).
- Raytheon generated sales of $8.031 billion (+14%), producing an operating profit of $1.133 billion (+32) on an operating margin of 14.1% (up from 12.2%).
Guidance
For the full fiscal year, RTX is now projecting net sales of $97 billion to $97.5 billion. This brings the low end of the range above the consensus view which had been for $96.5 billion. This is also up from previously issued guidance of $95 billion to $96 billion. That would put organic sales growth at an annual pace of 10% to 11%, up from previously issued guidance for growth of 8% to 9%.
Full year adjusted EPS is now seen at $7.65 to $7.75, up from prior guidance of $7.10 to $7.25. This is also well above the $7.25 that Wall Street was hoping for. Full year free cash flow is now projected at $9 billion to $9.25 billion, up from prior guidance of $8.5 billion to $8.75 billion.
Fundamentals
For the period reported, RTX generated operating cash flow of $2.868 billion. Out of that number came capital spending of $749 million. This left free cash flow of $2.119 billion. For the first nine months of the fiscal year, RTX has generated free cash flow of $6.306 billion, up from $4.745 billion a year ago.
Turning to the balance sheet, RTX ended the quarter with a cash position of $9.173 billion and inventories of $14.953 billion. This puts current assets at $66.096 billion. Current liabilities add up to $63.198 billion. Debt due within 12 months comes to $5.889 billion. This puts the current and quick ratios at 1.05 and 0.81 respectively, which is good enough (I don’t love it) to pass muster for a large industrial sector corporation.
Total assets amount to $176.596 billion, of which a rough 47% is labeled as either goodwill or other intangibles. Yes, I am a little uncomfortable with that. Total liabilities less equity comes to $105.632 billion. Of that $31.49 billion is in long-term debt. That’s a bit much for my liking versus the cash position.
My Take and the Chart
There’s a lot to like here. The quarter was great. The guidance is awesome. Cash flows are roaring. I don’t love the balance sheet. With cash flows like this (that are growing), I can live with a mediocre balance sheet.
Readers will see in this chart, the cup with saucer pattern that we talked about and benefited from earlier this year. The stock obviously sold-off after that rally petered out, and at this time, the stock is trying to recapture its 200-day simple moving average. RTX has already experienced support at its 21-day EMA, implying that the swing crowd is behind the current optimism.
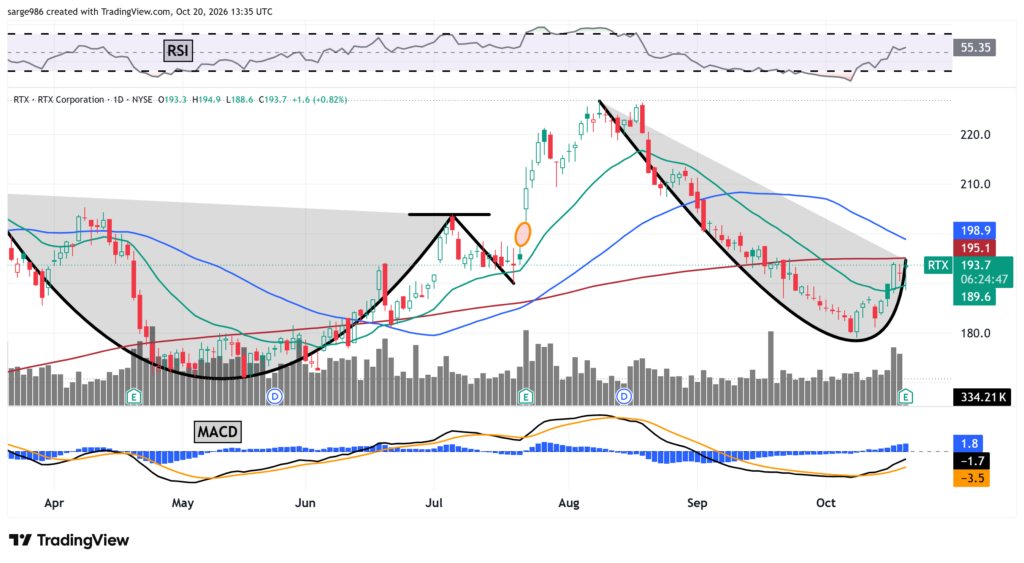
Moving on to my indicators, both Relative Strength and the daily moving average convergence divergence are suddenly showing overt recent improvement. The Relative Strength Index is now better than neutral. Within the MACD, the histogram of the 9-day exponential moving average has gone positive which is a short-term bullish signal. The 12-day EMA has also crossed above the 26-day EMA (also bullish). Now, if those two lines can hold that posture while moving into positive territory, we’ll have a ballgame.
Target Price: $245 (down from $265)
Pivot: $195 (200-day SMA)
Add: Down to October low ($179)
Panic: loss of October low
At the time of publication, Guilfoyle was long LMT, RTX equity.