Tech Bounces, but the S&P 500 Still Has Its Worst Week Since April 2025
Tech got a bounce but finished well off the highs and most stocks slipped as yields and the dollar rose after a blowout employment report.
You've reached your free article limit
You've read 0 of 1 free Pro articles.

Executive Summary
The bounce I said often follows a selloff like Thursday’s showed up Friday, but only in Tech, as AI names found some dip-buyers, but they finished well off the highs and most stocks fell as yields and the dollar rose after a very strong October Employment Situation report.
The Nasdaq-100 rose 1.4%, the Nasdaq Composite 1.1%, the S&P 500 0.3%, and the Russell 2000 0.9%, all getting back a small slice of Thursday’s losses. The Dow though fell 0.5% to its lowest close since October 8, and the equal-weighted S&P 500 lost 0.4%.

The Philadelphia Semiconductor Index (SOX) jumped 4.2%, and like the Nasdaq-100, had its best day since September 21. Even so, it recovered just around a third of Thursday’s 12% plunge.
Worries about the data center buildout remained top of mind as Texas Governor-elect Gina Hinojosa said in a CNN interview Thursday evening that the state needs to “stop what we are doing with data centers” until it has protections for Texans (note Hinojosa doesn’t take office until January).
For the week, the Dow held up best despite Thursday’s drop, falling 0.9%. The Russell 2000 lost 2.1%, the S&P 500 2.7% and the Nasdaq 3.4%. For the S&P 500, it was the worst week since April 2025, and the SOX’s 12% drop and the S&P 500 Tech sector’s 6.9% slide were also their worst since then. All four were solidly higher for the week before Thursday’s flush, and with November starting Monday, the weekly figures double as month-to-date.

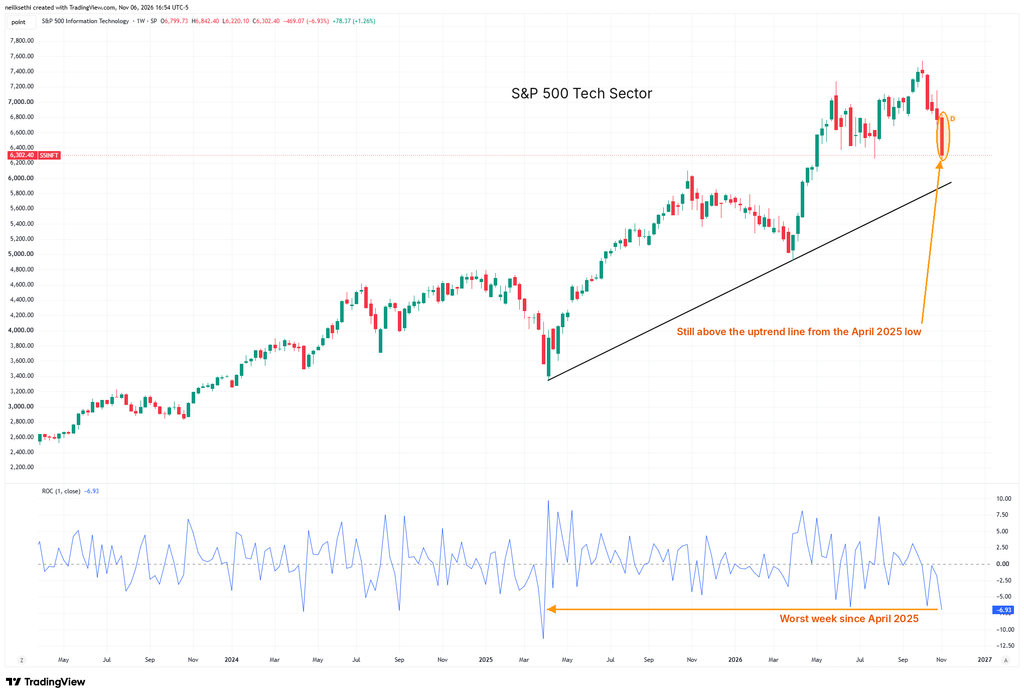
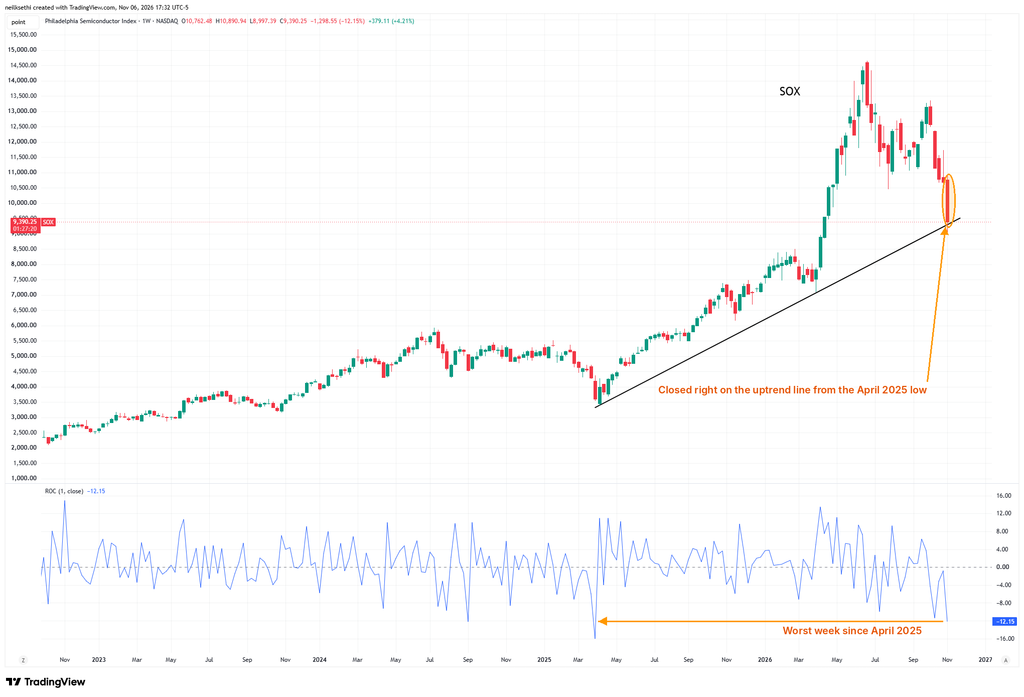
Thursday’s drop put the Nasdaq Composite in a correction, and CNBC’s look at past Nasdaq corrections found Tech stocks often find their footing within three to six months, though trading can stay rocky in the near term.
October payrolls rose 165,000, more than double the 62,000 expected and above every one of the 79 forecasts in Bloomberg’s survey, with another 84,000 in upward revisions to August and September. The unemployment rate fell to 4.1%, and wages beat, rising 0.4% for the month (more here: October Payrolls Top Every Forecast as Unemployment Falls Back to 4.1%).
Preliminary November University of Michigan consumer sentiment rose to 51.0, the highest since August, and year-ahead inflation expectations eased to 4.3%. The survey closed November 2, though, before the election and Thursday’s AI rout, and sentiment for those with the biggest stock portfolios had fallen even before that (more here: Consumer Sentiment Rebounds to a Three-Month High as Inflation Expectations Ease).
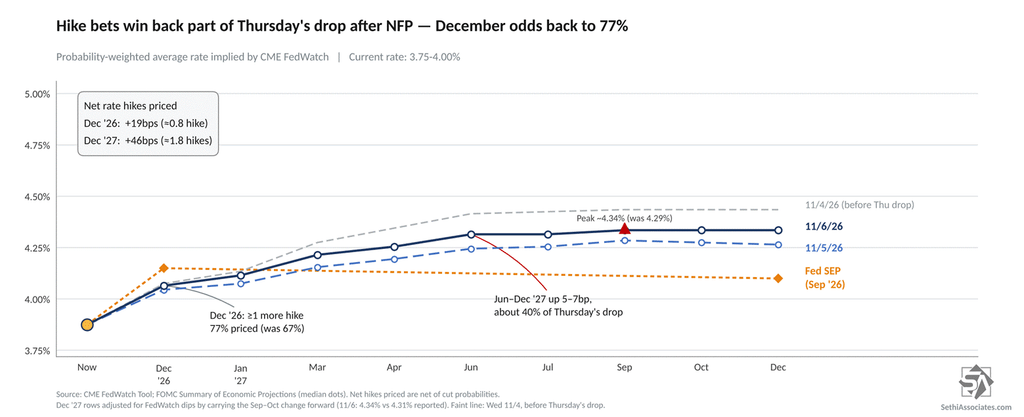
The strong employment report pushed Treasury yields higher, with the 2-year up about 4 basis points to 4.51%, and the dollar index rose 0.7%, its best day since June 18 as Fed rate-hike expectations rose with December now a 77% probability from 67% Thursday (still down from 82% Wednesday), per CME FedWatch.
Volatility eased but stayed elevated. The VIX fell 9% to 25.63, still up 32% for the week, its biggest weekly jump since mid-October, and the 1-day VIX dropped 22%, but other than Thursday, was the highest close since April. Thursday’s selloff set off a scramble for protection, with SPX put volume at a record, per Tier1Alpha.
More positively, jumps like we’ve seen this week are historically followed by market gains (more here: Wall Street’s ‘Fear Gauges’ Just Jumped the Most in Years. Here’s What Usually Came Next.).
In commodities, WTI was flat at $90.55 but fell 13% for the week, its worst since April. Gold slipped 0.9% but rose 4.5% for the week, its best since August, while bitcoin edged lower to its lowest close since August 20.
Next week is lighter but brings the important October CPI Tuesday (and PPI Friday) along with a host of Fed speakers and the Treasury’s quarterly refunding auctions. Cisco and Applied Materials headline earnings reporters. The bond market is closed Wednesday for Veterans Day (more in the Week Ahead below).
Market Commentary
Equities:
- “For the selloff to signal a lasting downturn in the AI investment cycle, we think we would need to see evidence that AI-related revenue growth is slowing, cloud utilization is weakening, or lower AI costs are failing to generate sufficient new usage to absorb expanding capacity,” UBS said in a note to clients. “We would also reassess the outlook if advances in algorithmic efficiency sharply reduced compute requirements, larger investments failed to produce commensurate gains in AI capabilities, or tighter financial conditions constrained spending by the largest technology platforms and frontier labs.” It also said investors who are underweight bonds may want to rebuild those positions. “To prepare for potential further equity market volatility, investors with significant bond underweights should consider using opportunities to rebuild strategic allocations,” it said.
- JPMorgan’s market-intelligence team says the worst of the deleveraging now appears to be over. In a note to clients Friday, it said the spike in the VIX was the sharpest since April 2025’s “Liberation Day” selloff, with most of the losses concentrated in the most crowded longs, which are largely in Tech.
- Stuart Kaiser, head of equity trading strategy at Citi, said in a note to clients that it’s too early to buy the dip. “Equities buckled under elements of positioning risks, EPS disappointment and geopolitical uncertainty. We would still not buy this positioning-driven sell-off,” he wrote. Kaiser estimated that volatility-targeting funds now have $77 billion in equities to sell.
- “When I did the school run this morning and [the selloff] was the top story in the BBC, I thought, ‘Well, that’s probably the end of the problem.’ The bad news is already priced in,” said Anthony Willis, senior economist at Columbia Threadneedle Investments.
- “The scale of the falls in some of the market’s biggest names has been striking. But it also highlights the concentration risk that has built up in U.S. equity markets,” Stuart Clark, portfolio manager at Quilter, said by email. “With a relatively small number of technology and semiconductor stocks now carrying so much weight, weakness in those names quickly translates into sizeable falls for the Nasdaq and S&P 500.”
Bonds/Fed:
- “Markets are not noticing recent data which shows continued strength in the economy. To wit, Japan’s cash labor earnings came in at 30-year highs and there was little notice. If this tech nightmare ends, we may awaken to realize that economic growth is better than expected again. That could reverse some of the bond market rally,” said SMBC Nikko Capital Markets in London.
- “The key point is that this report once again confirms the economic strength highlighted by the Fed and all but seals the case for a December rate hike,” said Florian Ielpo at Lombard Odier Asset Management. “Main Street is doing just fine, thank you.”
- “While the weakness in equities is contributing to tightness in financial conditions, we doubt those moves have been enough so far to rule out a December rate hike,” said Ariane Curtis at Capital Economics.
- The jobs report “is a good reminder that the economy remains on solid footing despite the recent AI-driven market volatility,” said Angelo Kourkafas at Edward Jones.
Stock and Sector Breakdown
Schwab
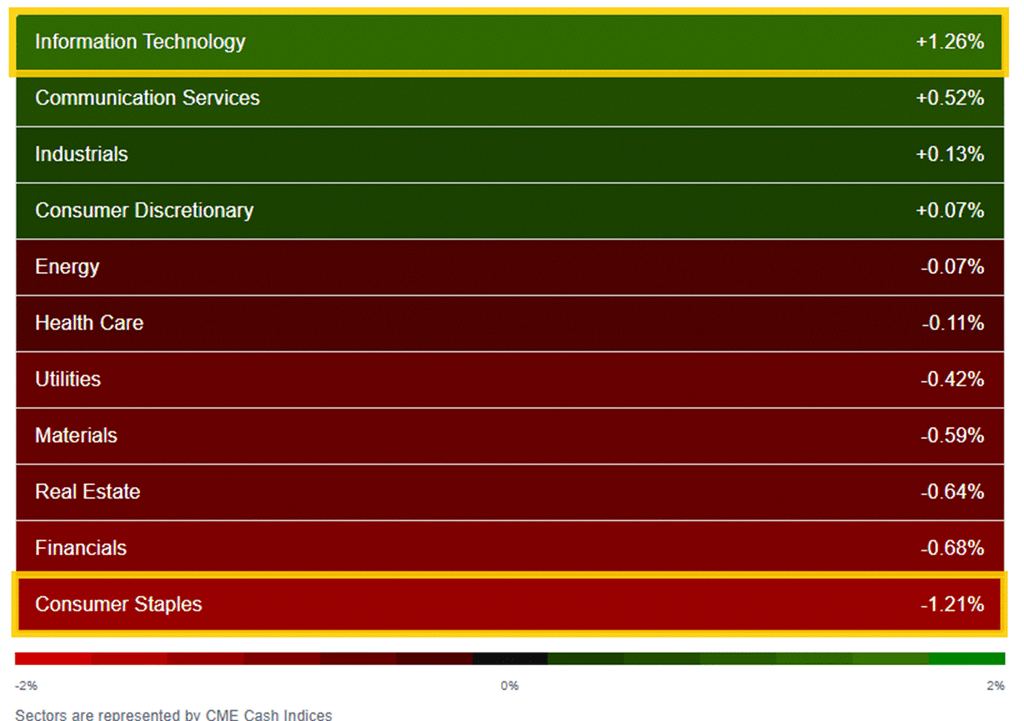
Tech (+1.3%) was the only sector up more than 0.6%, with Communication Services, Industrials and Consumer Discretionary also edging higher. The rest fell, led by Consumer Staples (-1.2%), as Thursday’s non-AI plays gave some ground back, followed by Financials and Real Estate (about -0.7% each). Decliners outnumbered gainers 318 to 184 in the S&P 500.
Coherent (COHR) (+14%) was the best performer in the S&P 500 as AI hardware bounced, and Axon Enterprise (AXON) (-18%) was the worst after its third-quarter report. Chris Versace has a New Axon Price Target as Momentum Investors, Short Sellers Clear Out.
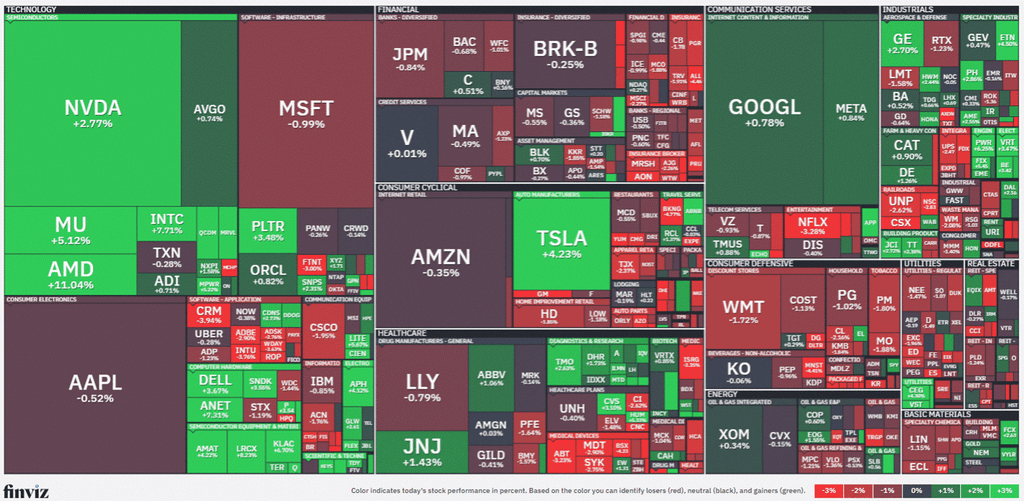
Chips led the Friday rebound. Advanced Micro Devices (AMD) rose 11%, Lam Research (LRCX) 8%, and Intel (INTC), Arista Networks (ANET) and KLA (KLAC) about 7% to 8%. Micron (MU), Qualcomm (QCOM) and Marvell (MRVL) gained about 5% to 6%. Outside the S&P 500, CoreWeave (CRWV) and Arm Holdings (ARM) rose about 5% to 6%. Ed Ponsi is Taking Action on AMD, Alphabet and Meta After Steep Nasdaq Selloff.
While I am far from convinced we’re through the worst of the selloff, “I did respect the price action, covering my AMD short, flipping my Arista short to a long, buying Broadcom and adding to NXP Semiconductors as they recaptured technical levels or provided a nice swing opportunity.
In that regard, Rev Shark says Don’t Confuse a Bounce With a Bottom and A Routine Bounce Is Only the First Step, noting chips are leading but breadth is thin. Helene Meisler thinks A Market Washout May Be Setting Up the Next Tradable Rally.
Nomura’s Charlie McElligott noted in his colorful way that the “semis-energy barbell,” which was up 66% just weeks ago, “just got leg-swept,” with both the SOX and the energy sector on pace Thursday for their worst weeks since April 2025’s “Liberation Day” selloff. Clients are “feeling incentivized to take risk down” to protect what’s left of their year-to-date gains, he said.
AI power names also bounced, with Vistra (VST) up about 11% after its report and NRG Energy (NRG) up about 10%. Quanta Services (PWR) gained 6%.
Among the megacaps, Nvidia (NVDA) rose about 3%, getting back into positive territory for the year, and Tesla (TSLA) gained 4%, while Alphabet (GOOGL), Meta Platforms (META) and Broadcom (AVGO) gained less than 1%. Microsoft (MSFT), Apple (AAPL) and Amazon (AMZN) fell about 0.4% to 1%. Microsoft reportedly plans to cut the number of neocloud partners it works with, which helped keep a lid on the AI bounce.
Earnings moved others. Airbnb (ABNB) jumped 12% after its report, but Booking Holdings (BKNG) and Expedia (EXPE) fell about 5%. Microchip Technology (MCHP) lost 10%, Charter Communications (CHTR) 6% and Monster Beverage (MNST) 4% after their reports, while Moderna (MRNA) and Humana (HUM) rose about 5%. Outside the S&P 500, DraftKings (DKNG) sank 21%.
Doug Kass says Buying Is Back! His oscillator finally moved into oversold, and he’s been adding to SPY, QQQ and banks. Stephen Guilfoyle explains How I Traded Through a Market Bloodbath.
The number of large SPX winners (up over 3%) rose to 48 from 9 Thursday, while large losers (down over 3%) fell to 42 from 207.
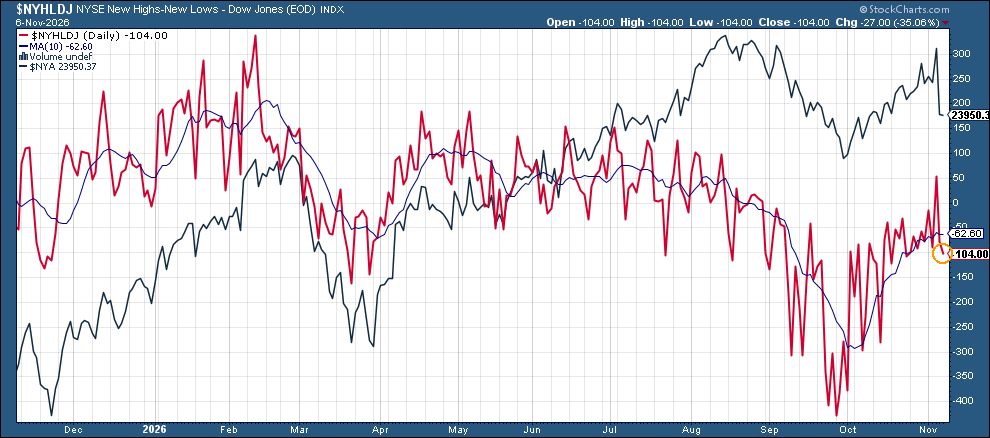
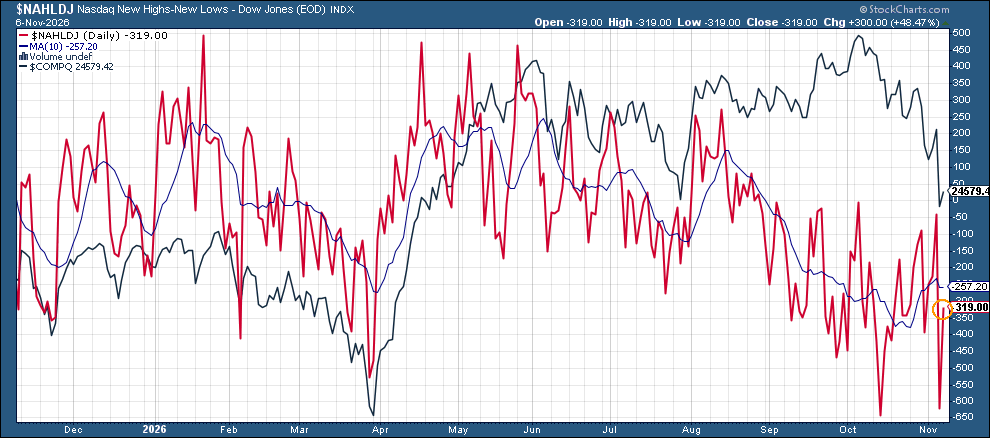
52-week highs minus lows on the Nasdaq improved to -319 from -619 Thursday, but it was still a 50th straight negative session, topping the 49-day stretch that ended November 14, 2023, for the longest streak since May 2023. The NYSE slipped to -104 from -77, its lowest since late October.
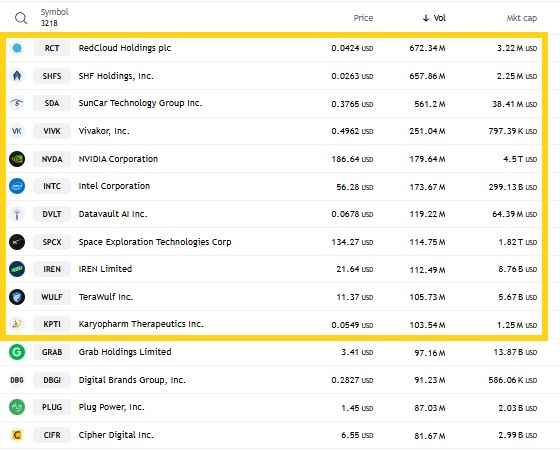
Interestingly, speculation was much higher than we’ve seen the past couple of weeks on the Nasdaq with three penny stocks trading over 500 million shares (and another over 250 million) with eleven total companies over 100 million.
Some other stock-specific commentary from TheStreet Pro:
Stephen Guilfoyle — GE Gets Bullish Update After $12 Billion Record Report and New Aspen Aerogel Price Target After Markets Enter Meltdown Mode
Bret Jensen — After a Wild Week on Wall Street, Take Refuge in Four Rising Biotechs
A Look At The Charts
SPX
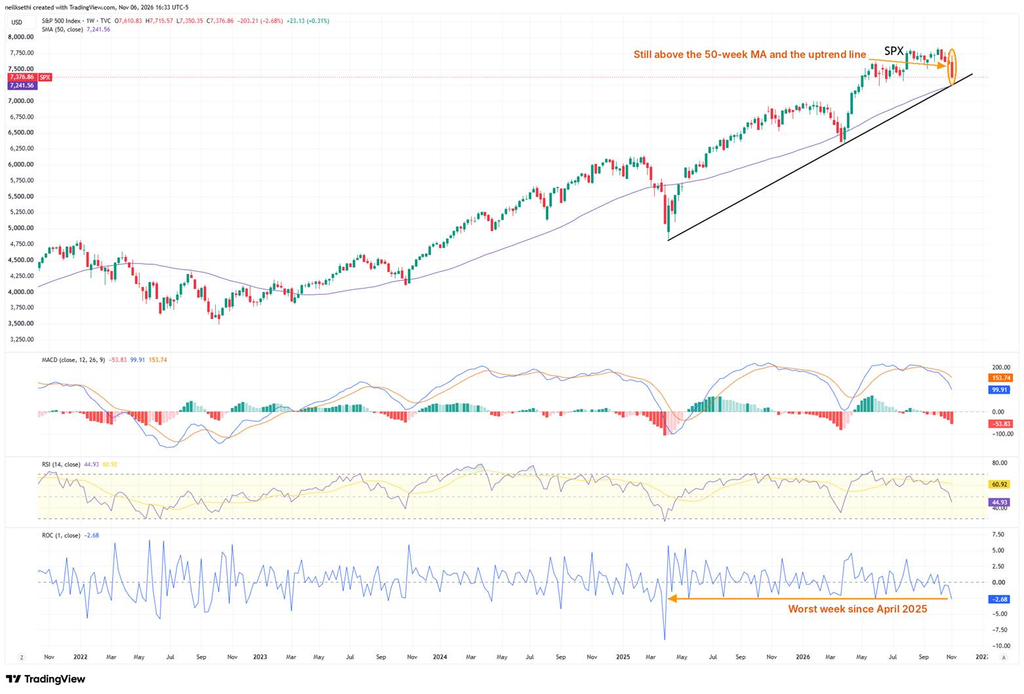
The SPX rose 0.31% to 7,377 after trading as high as 7,444, holding 0.7% above its 200-DMA (7,325). It’s still below its 20-, 50- and 100-DMAs. The MACD is in “go short” positioning, and the RSI is at 35.
As I noted, I’ll sell the rest of my SPY position, and likely go short, if the SPX breaks its 200-DMA, although I might give it the benefit of the weekly support line noted in the next chart.
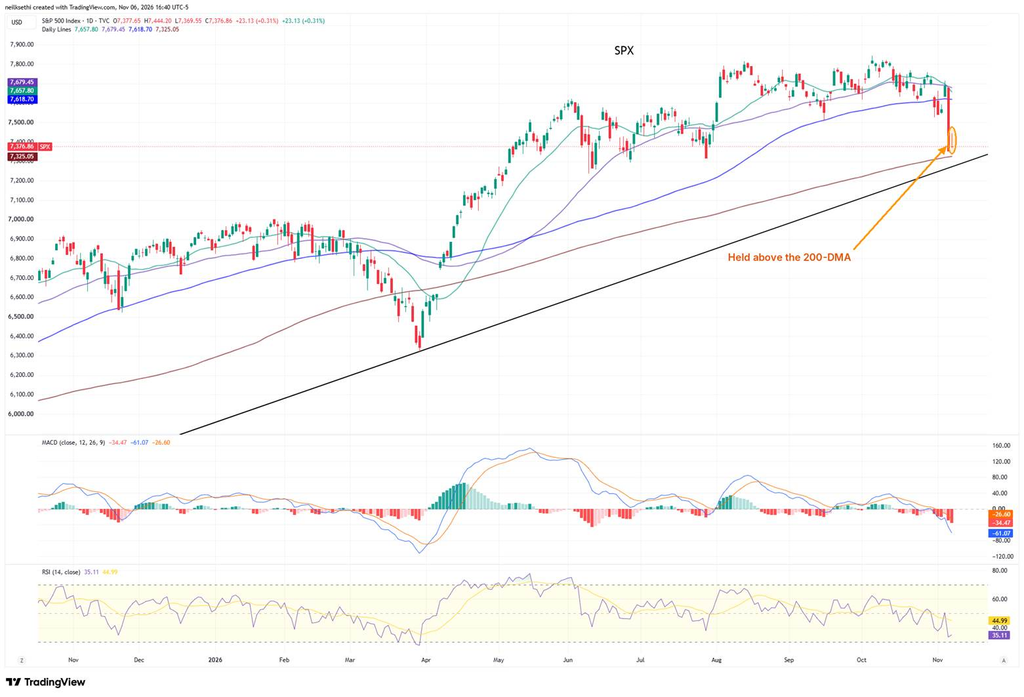
For the week, it fell 2.68%, its worst week since April 2025, but on the weekly chart held above its 50-week moving average and the uptrend line from the April 2025 low, with the weekly MACD in “sell longs” positioning.
Nasdaq Composite
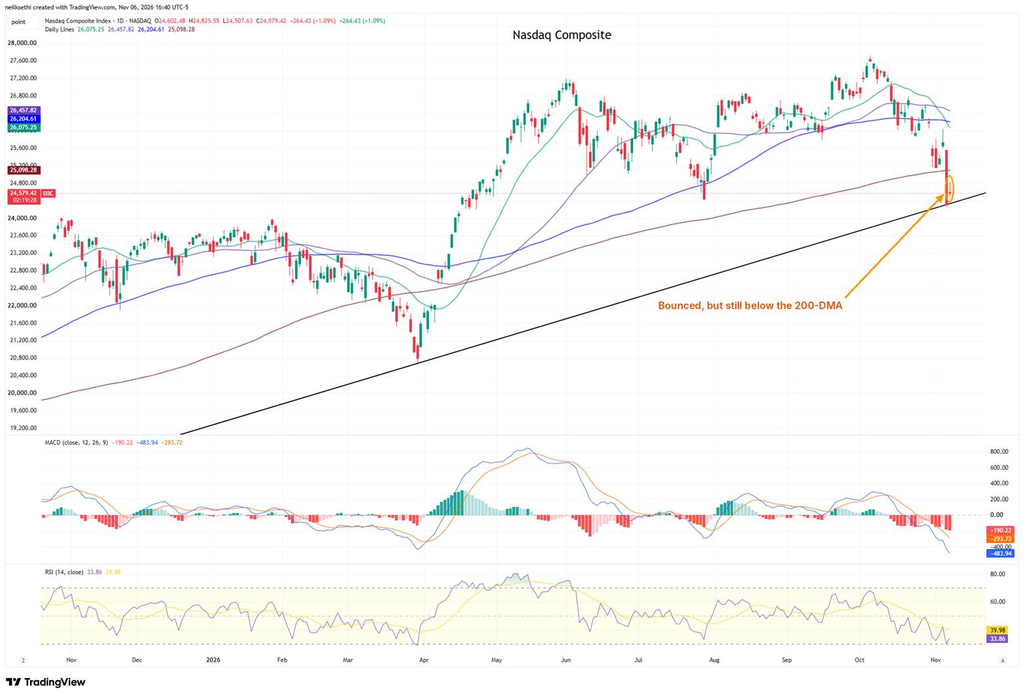
The Nasdaq Composite rose 1.09% to 24,579, still 2.1% below its 200-DMA (25,098). The MACD is in “go short” positioning, and the RSI is at 34. It fell 3.37% for the week, its worst week since mid-October.
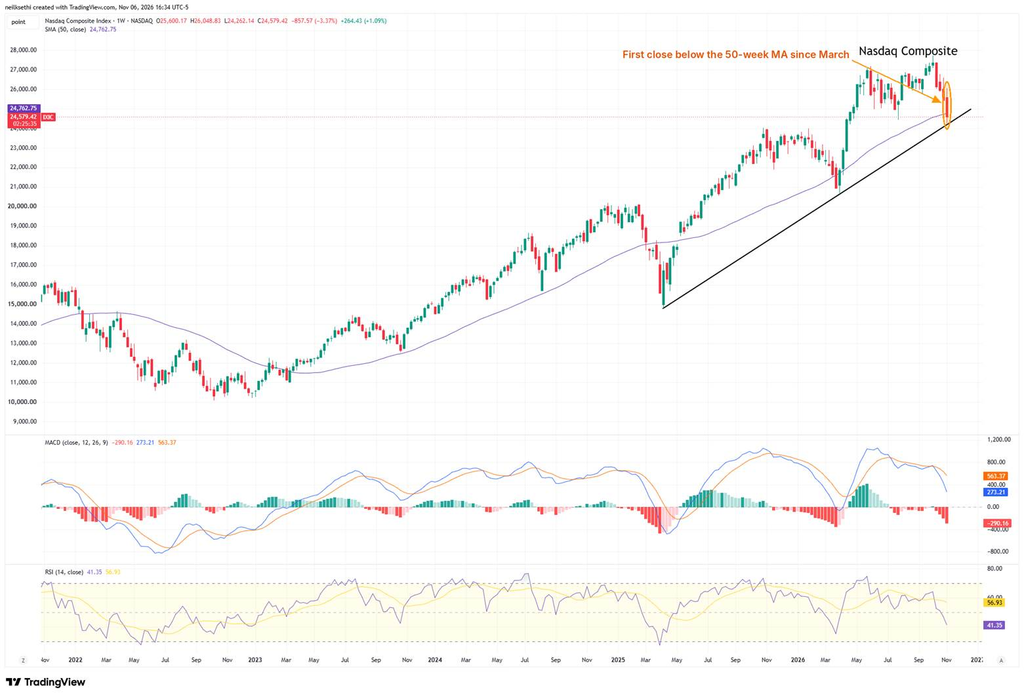
On the weekly chart, the Composite closed below its 50-week MA for the first time since March, with the weekly MACD in “sell longs” positioning.
The Nasdaq-100 (QQQ)
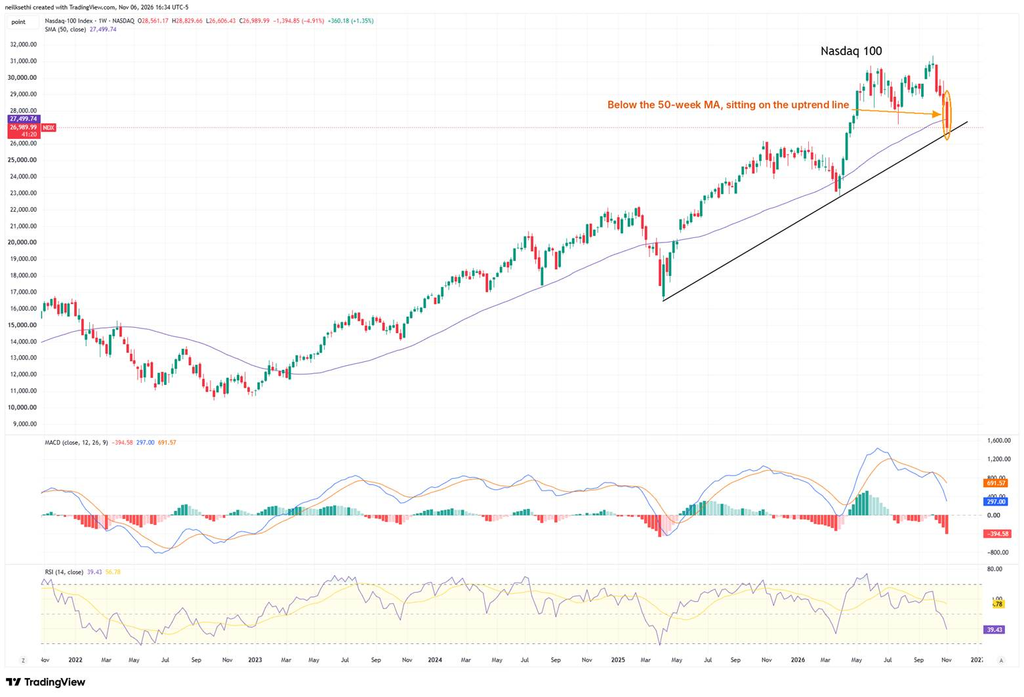
The Nasdaq-100 rose 1.35% to 26,990, its best day since September 21, but it’s still 3.6% below its 200-DMA (27,984). The MACD is in “go short” positioning, and the RSI is at 31.
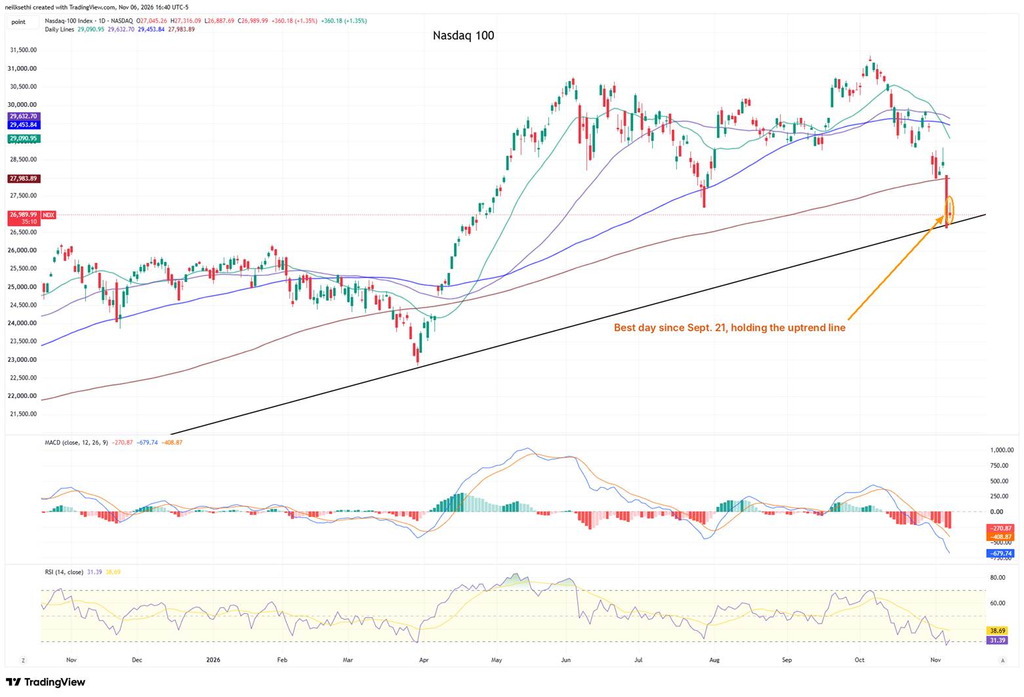
It fell 4.91% for the week. On weekly the chart the Nasdaq-100 also closed below its 50-week MA for the first time since March, sitting right on its uptrend line, with the weekly MACD in “sell longs” positioning. I hadn’t noticed that support line until today (not sure how I missed it) so I covered my QQQ short. I’ll re-short if it breaks. I won’t go long until it gets back over the 200-DMA.
The Russell 2000 (IWM)
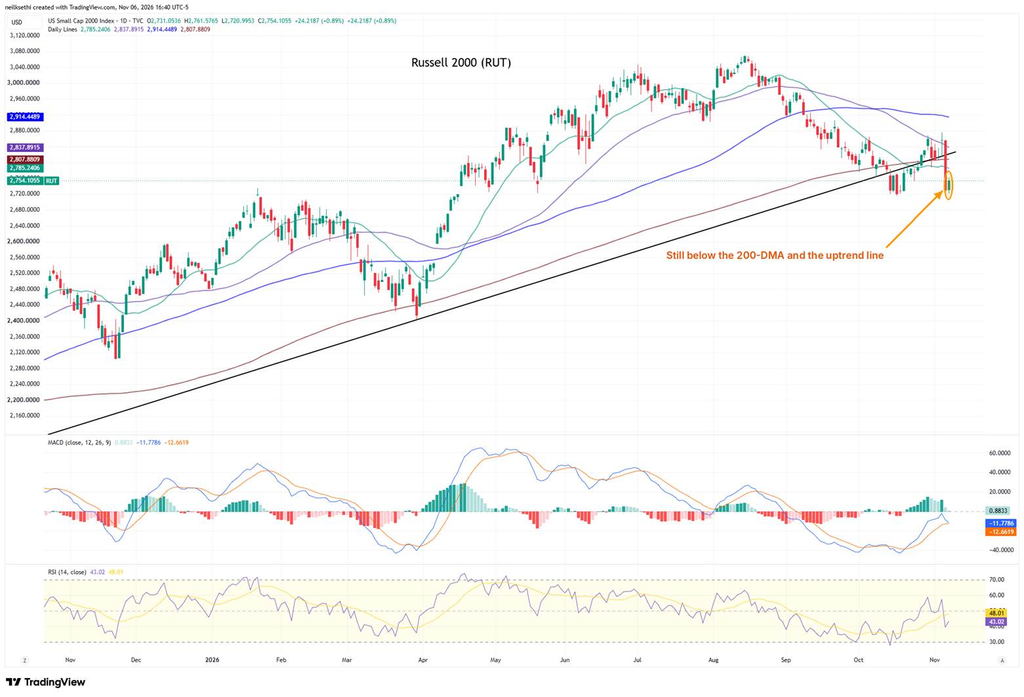
The Russell 2000 rose 0.89% to 2,754, still 1.9% below its 200-DMA (2,808). The MACD remains in “cover shorts” positioning, and the RSI is at 43.
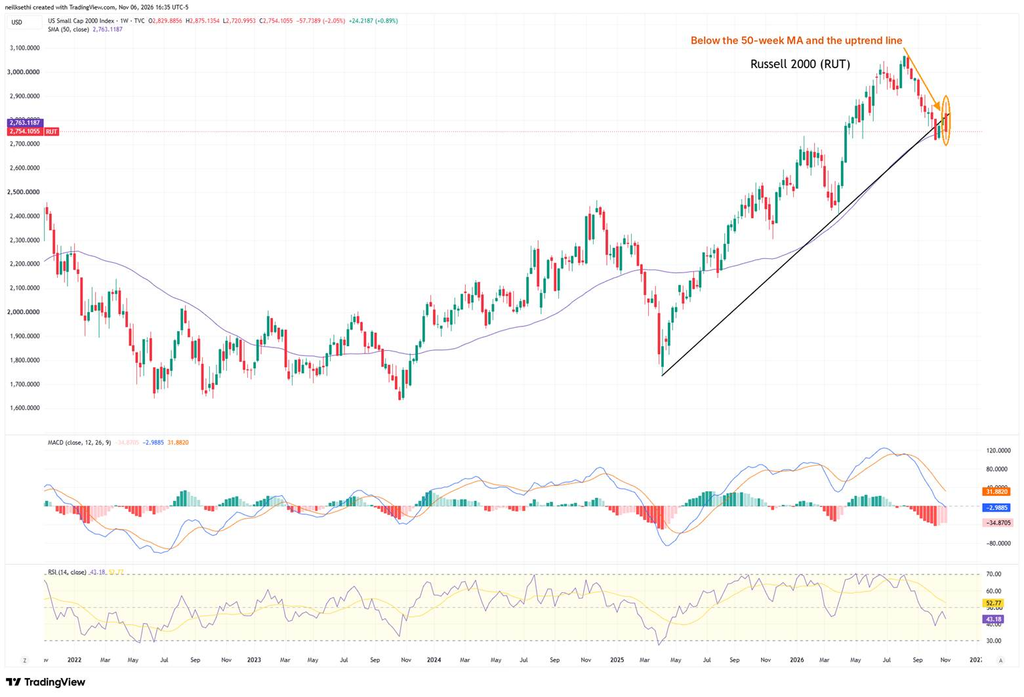
It fell 2.05% for the week. On the weekly chart, the Russell 2000 closed just below its 50-week MA and its uptrend line, and the weekly MACD slipped below zero to “go short” positioning. Not great.
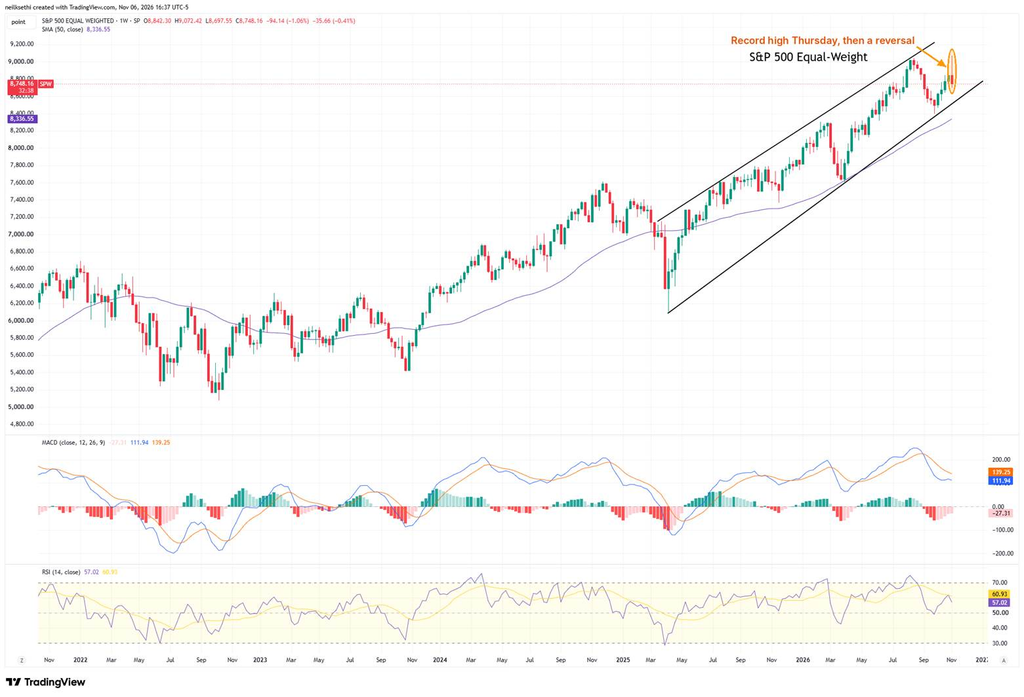
The equal-weighted SPX (RSP)
The equal-weighted SPX fell 0.41% to 8,748, a second straight loss. It slipped back below its 20-DMA (8,778) but held above its 50-, 100- and 200-DMAs. The MACD is barely still in “buy longs” positioning, and the RSI is at 49.
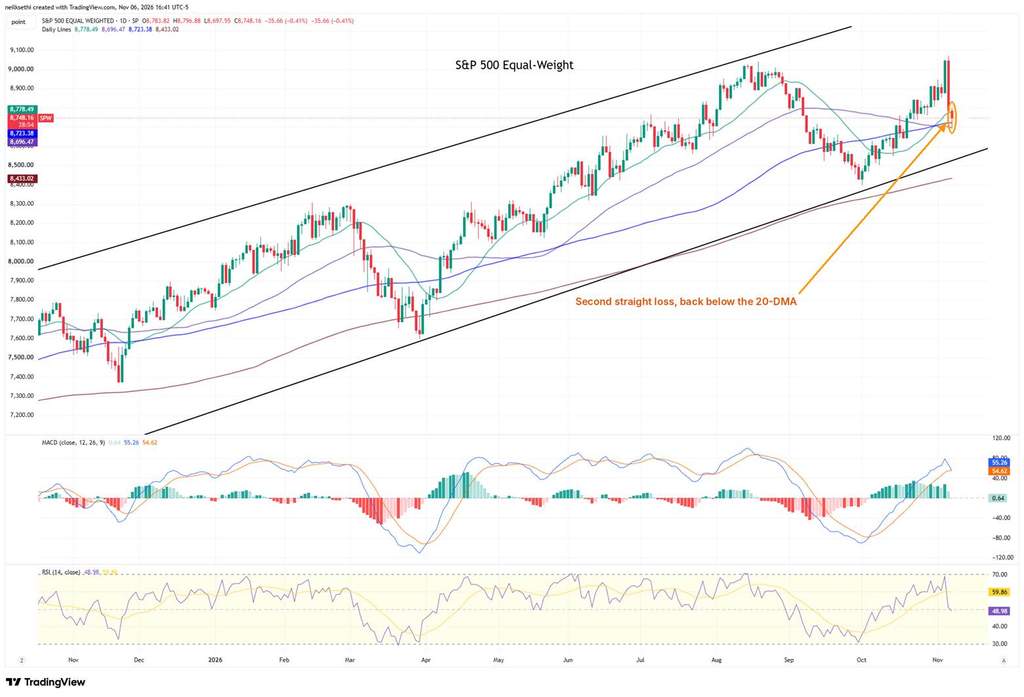
It lost 1.06% for the week, its worst since mid-September. On the weekly chart, it hit an intraday record Thursday before reversing, leaving a long upper wick, with the weekly MACD in “sell longs” positioning. I’m watching that lower trendline as a likely exit point.
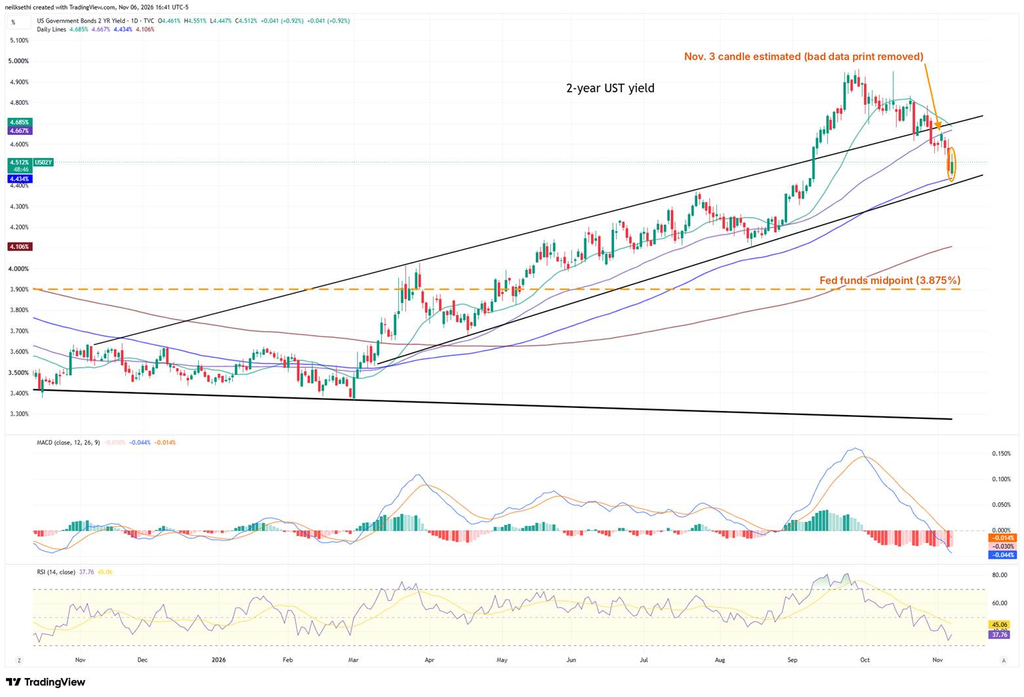
The 2-year Treasury
The 2-year yield rose 4.1 basis points to 4.51%, about 64bp above the midpoint of the Fed funds target range (3.875%). It’s still below its 20- and 50-DMAs (about 4.69% and 4.67%) but above its 100-DMA (4.43%). The MACD is in “go short” positioning, and the RSI is at 38.
The November 3 candle on the chart is an estimate, since TradingView’s data for that day has a bad print.
Odds of a December hike rose back to 77% from 67% Thursday, with 46bp of hikes now priced through December 2027, up from 39bp, per CME FedWatch.
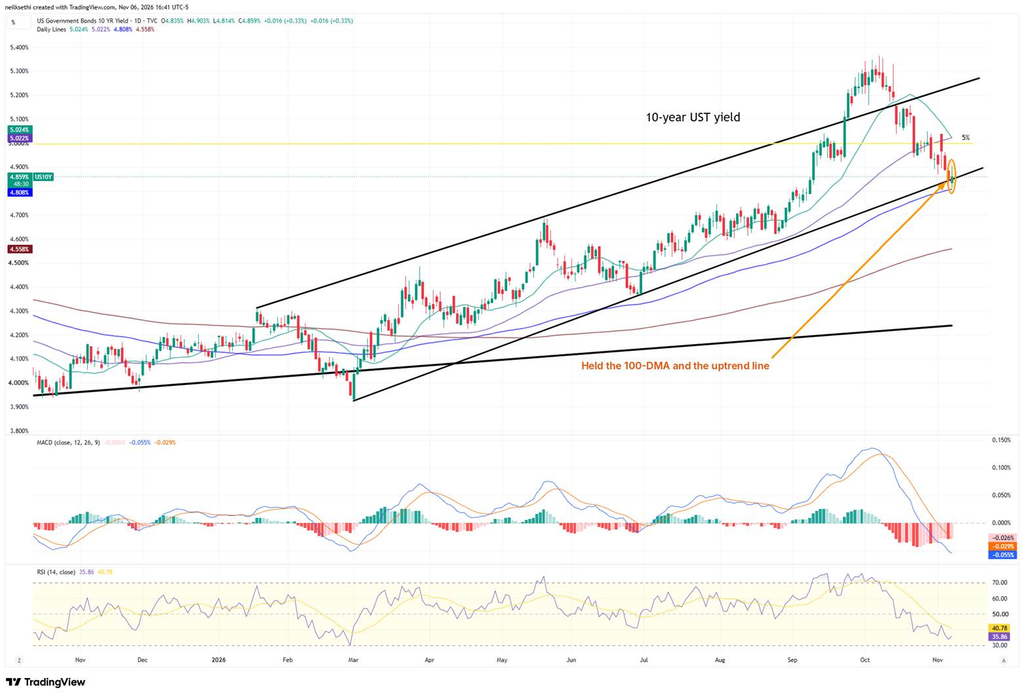
10-year yields
The 10-year yield rose 1.6 basis points to 4.86% after dipping to 4.81%, right at its 100-DMA and the lower channel line. It’s still below its 20- and 50-DMAs (both about 5.02%). The MACD is in “go short” positioning, and the RSI is at 36.
30-year yields
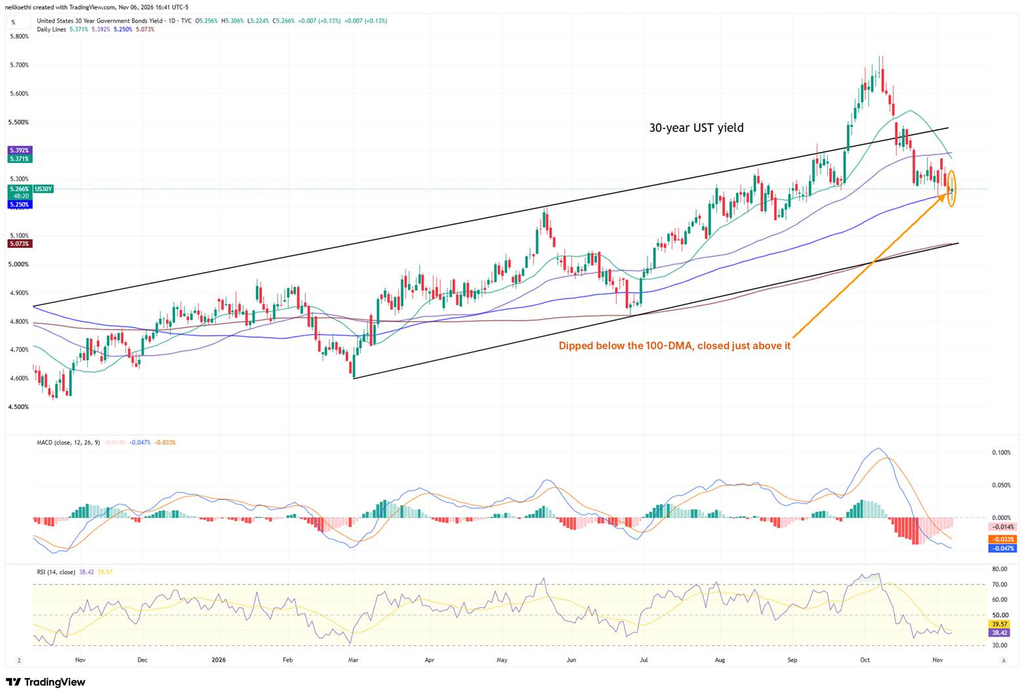
The 30-year yield edged up 0.7 basis points to 5.27%, closing just above its 100-DMA (5.25%) after dipping below it. The MACD is in “go short” positioning, and the RSI is at 38.
VIX
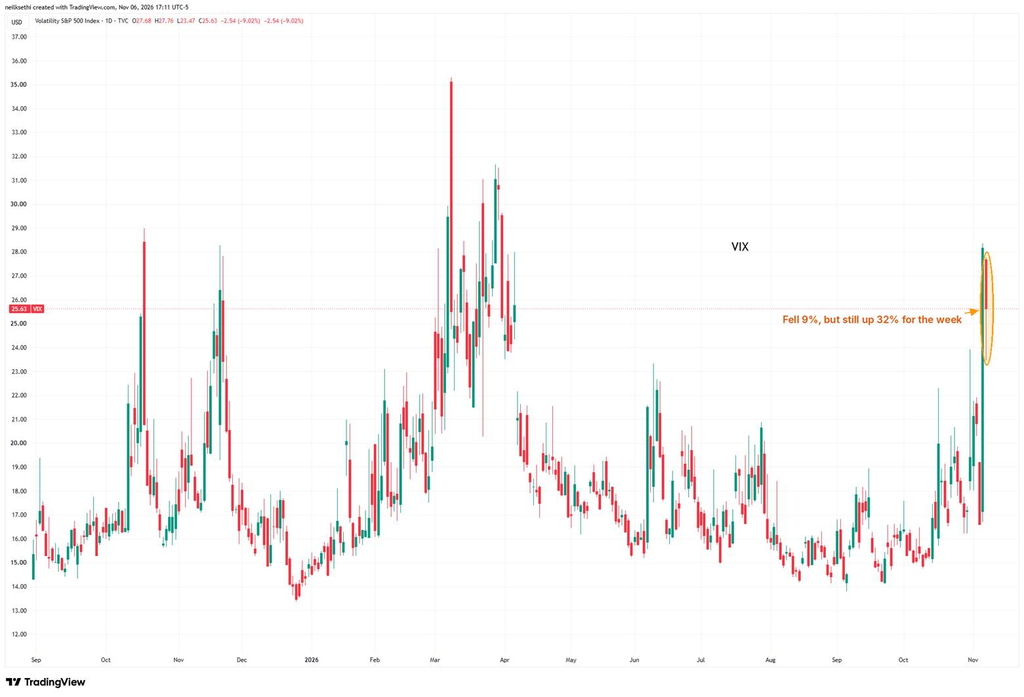
The VIX fell 9.02% to 25.63, still the second highest close since April. It was up 32% for the week, its biggest weekly gain since mid-October. The current reading implies a daily move of about 1.62% over the next 30 days.
VVIX
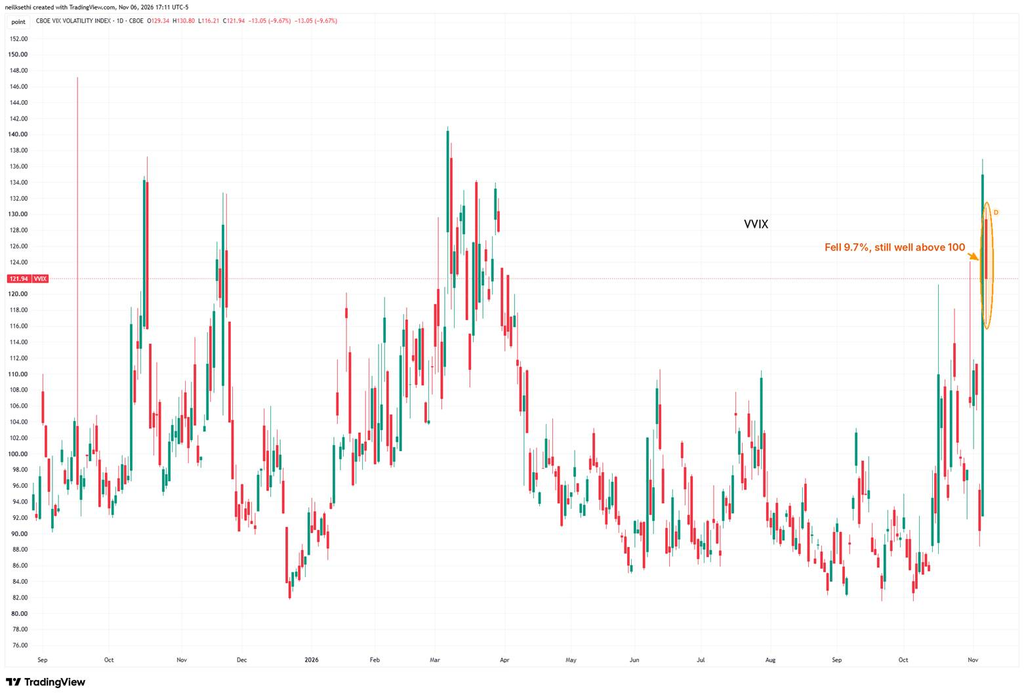
VVIX (the VIX of the VIX) fell 9.67% to 121.94. The current level is consistent with “highly elevated” daily moves in the VIX over the next 30 days (historically, normal is 80-100, although we haven’t been below 80 since July 2024), and it remains well above the 100 level flagged by Charlie McElligott as indicating higher stress.
1-day VIX
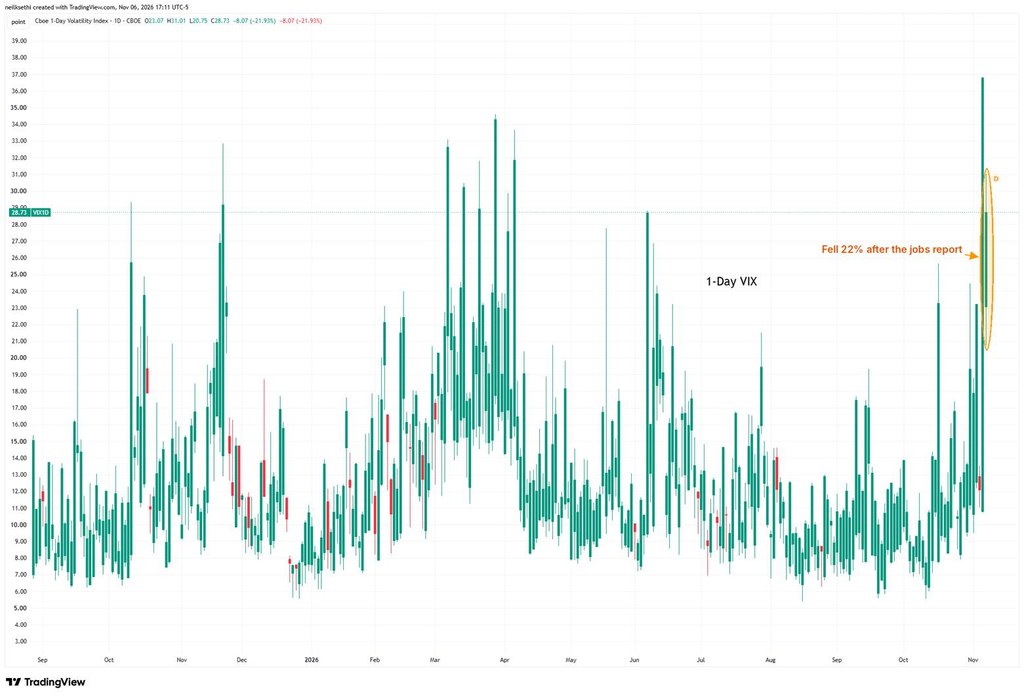
Thursday’s 1-day VIX reading implied a move of about 2.32% for Friday, and the SPX moved just 0.31%. The 1-day VIX then fell 21.93% to 28.73, but still the second highest close since April, implying a move of about 1.81% for Monday.
WTI futures (/CL)
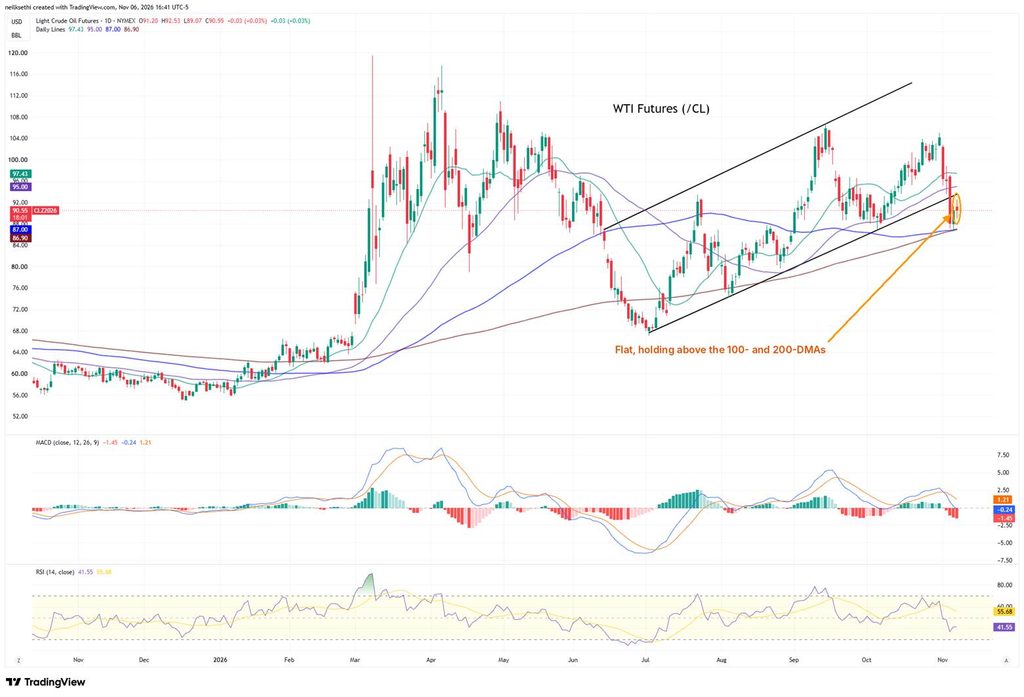
WTI futures were flat at $90.55, holding above their 100- and 200-DMAs (both about $87), but fell 13% for the week, their worst week since April. The MACD crossed below zero to “go short” positioning, and the RSI is at 42.
DXY
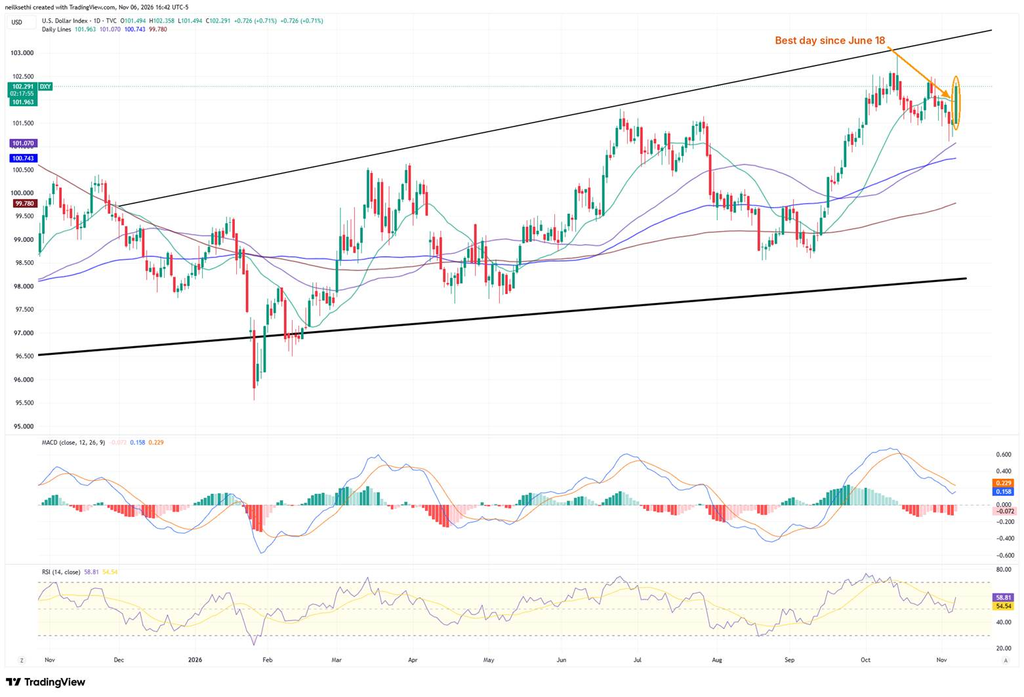
The DXY dollar index rose 0.71% to 102.29, its best day since June 18, moving back above its 20-DMA (101.96). The MACD remains in “sell longs” positioning, and the RSI is at 59.
Gold futures (/GC)
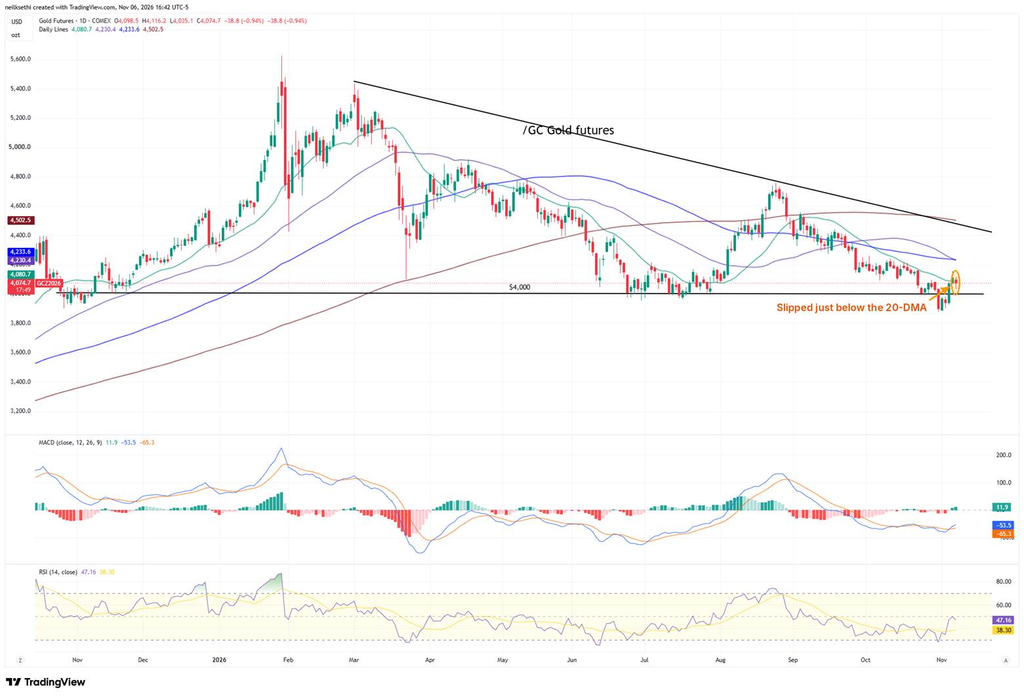
Gold futures fell 0.94% to $4,075, slipping just below their 20-DMA ($4,081). The MACD remains in “cover shorts” positioning, and the RSI is at 47 so the daily chart improved this week.
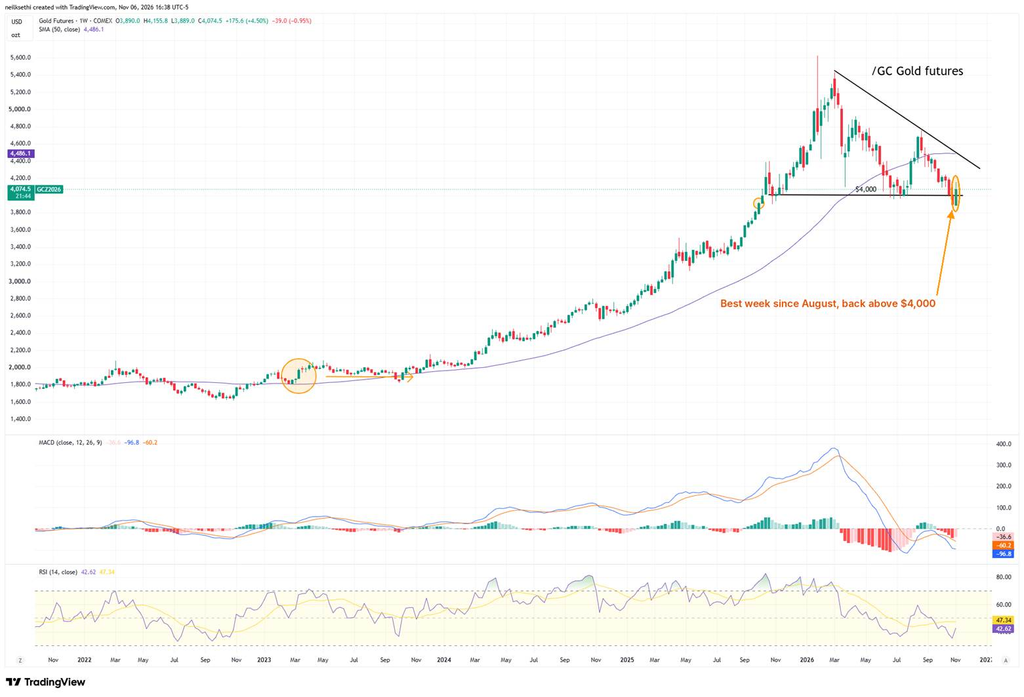
Gold rose 4.50% for the week, its best week since August, getting back above $4,000 after dipping below it. It’s still below its 50-week MA ($4,486) though, and the downtrend line from the March high, with the weekly MACD in “go short” positioning, so more work to do.
US copper futures (/HG)
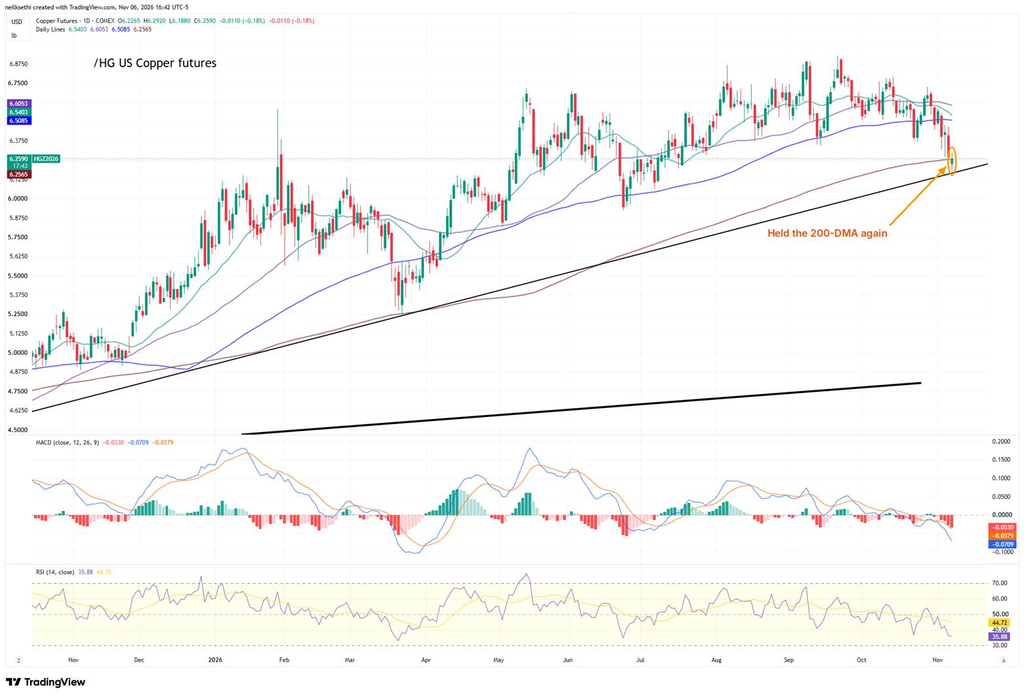
Copper futures edged down 0.18% to $6.26, holding a hair above their 200-DMA again. The MACD is in “go short” positioning, and the RSI is at 36.
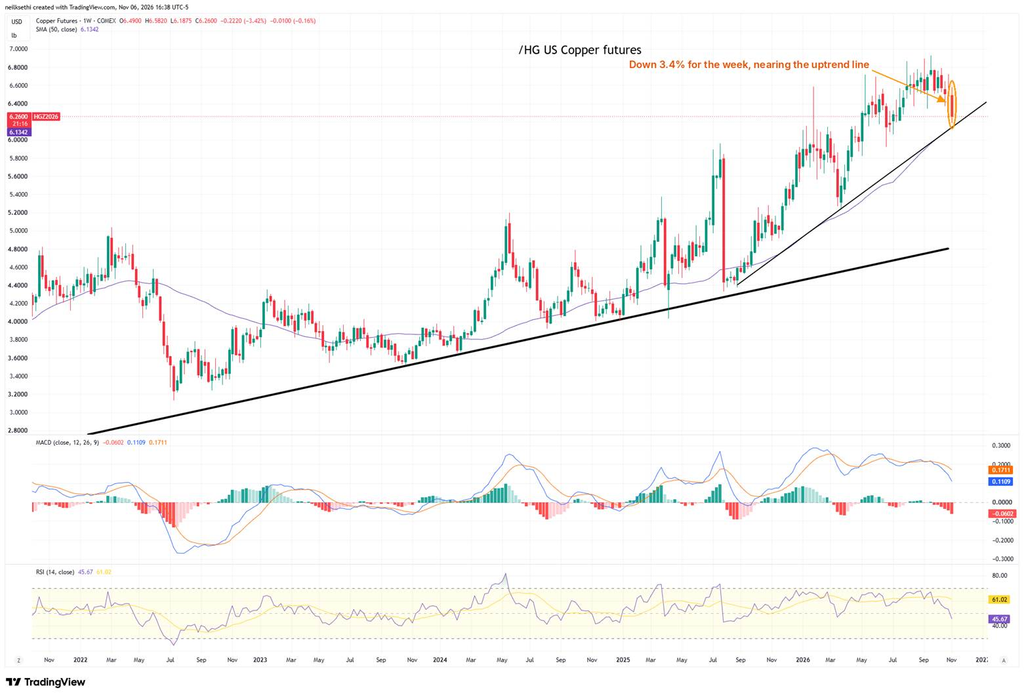
Copper fell 3.42% for the week, moving toward the uptrend line from the August 2025 low, with the weekly MACD in “sell longs” positioning.
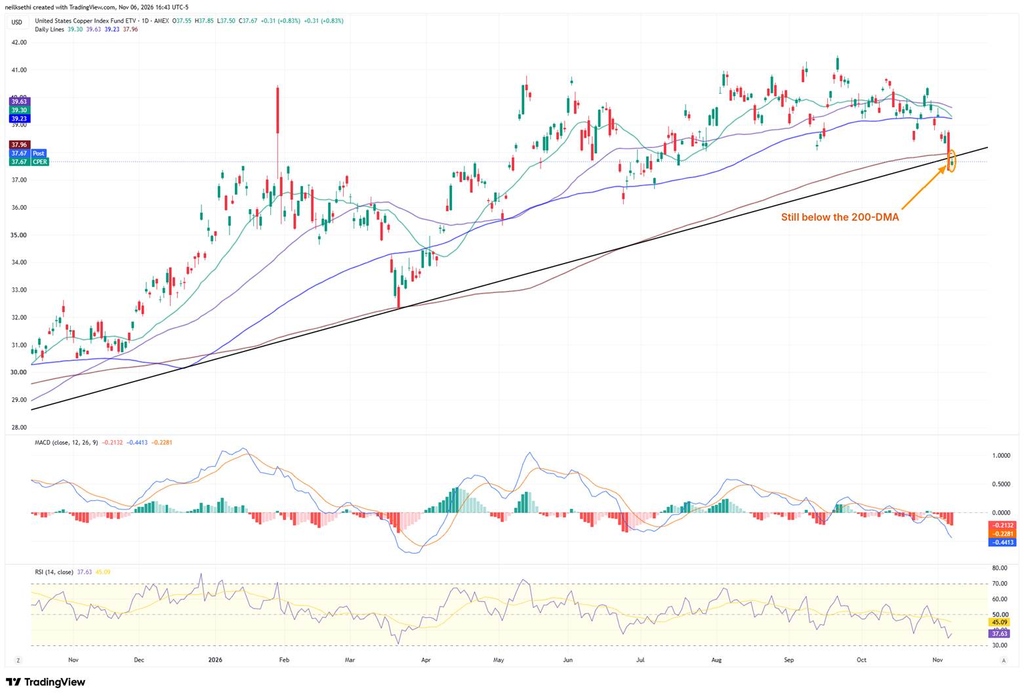
The copper ETF (CPER) remains in worse shape than the copper futures chart even as it rose 0.83% to $37.67. It is still below its 200-DMA ($37.96) and trendline, so I’m still short. The MACD is in “go short” positioning, and the RSI is at 38 as well.
US natural gas futures (/NG)
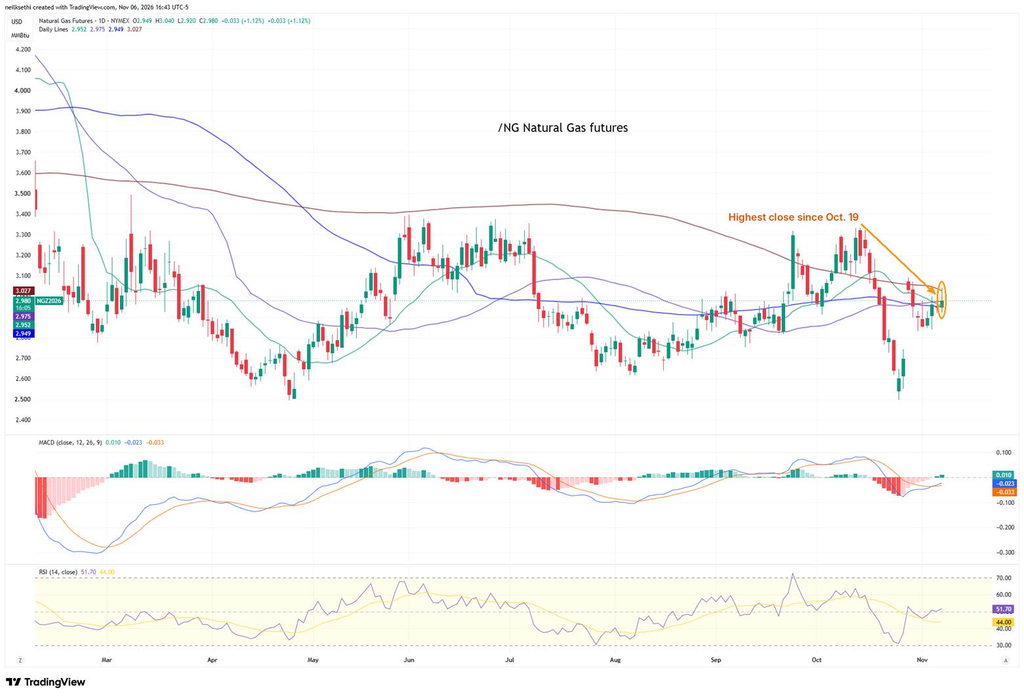
Natural gas futures rose 1.12% to $2.98, their highest close since October 19, edging above their 20-, 50- and 100-DMAs but still below the 200-DMA ($3.03). The MACD remains in “cover shorts” positioning, and the RSI is at 52.
Bitcoin futures
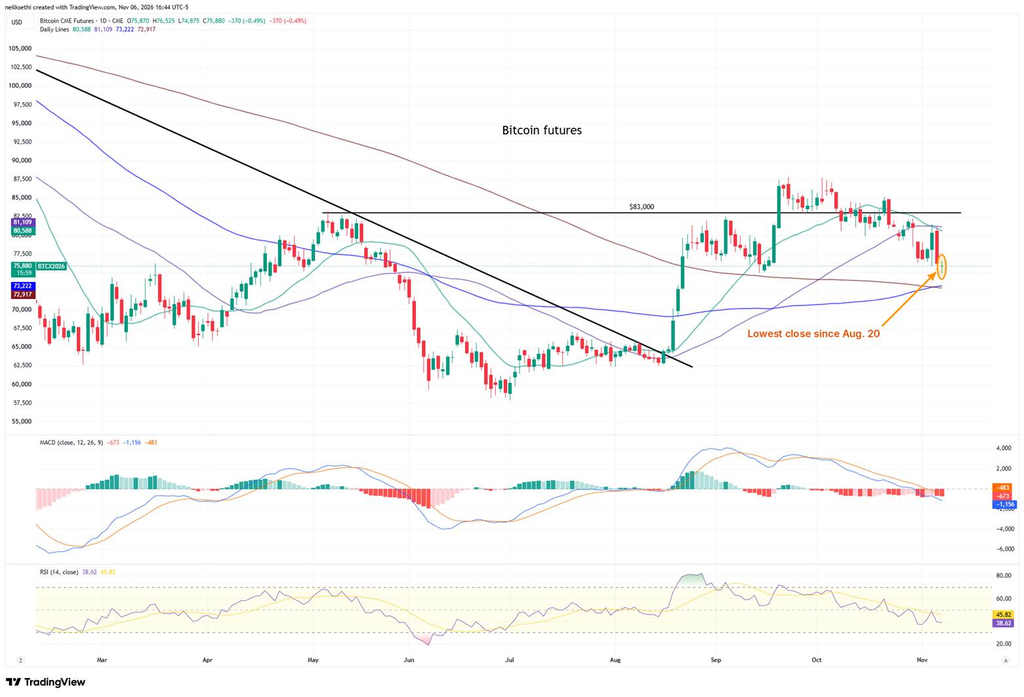
Bitcoin futures fell 0.49% to $75,880, their lowest close since August 20, below their 20- and 50-DMAs (about $80,600 and $81,100). The MACD is in “go short” positioning, and the RSI is at 39.
More From TheStreet Pro
Chris Versace — Jobs Report May Impact Holiday Shopping Season: 8 Key Items Shaping the Stock Market Friday
Doug Kass —
- Oscillator Finally Moves to Oversold
- Returning to the Land of the Living
- More Bank for My Buck
- Added to Index Longs
- Memorize Howard Marks’ List!
Note: Doug posted 14 Diary entries today; these were the market ones.
And From Me If You Missed It
- Wall Street’s ‘Fear Gauges’ Just Jumped the Most in Years. Here’s What Usually Came Next.
- October Payrolls Top Every Forecast as Unemployment Falls Back to 4.1%
- Consumer Sentiment Rebounds to a Three-Month High as Inflation Expectations Ease
Miscellaneous
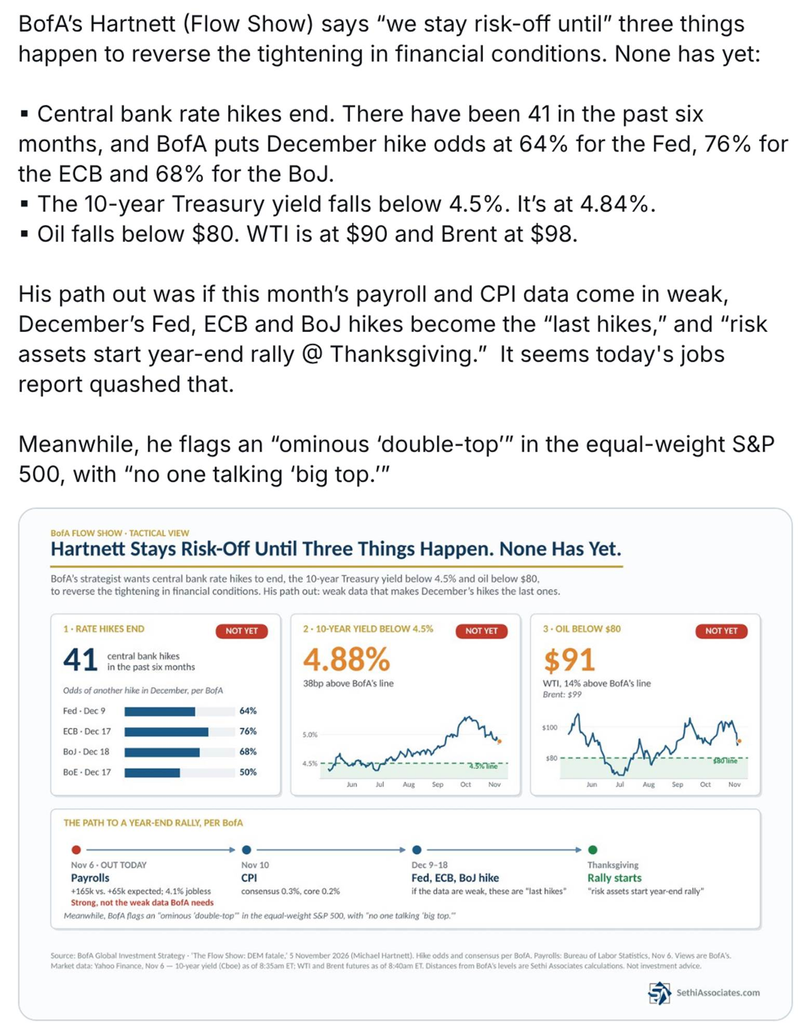
BofA’s Michael Hartnett says “we stay risk-off until” central banks stop hiking, the 10-year yield falls below 4.5% and oil falls below $80. None has happened yet, and Friday’s jobs report made the first less likely. He also flags an “ominous ‘double-top'” in the equal-weighted S&P 500.
Bespoke though notes that after a 4% drop in the SPX (56 instances), “historically, the index has averaged a gain of 2% over the next month and 6.7% over the next three months.”
Wrap-Up — Just a Bounce, for Now
I said Thursday that “markets did a lot of work today in flushing out any non-diehards (like myself) or completely passive investors, and I’d have to think if the buy-the-dip crowd still exists this is quite the dip to buy. As I said last week, a selloff like this often sees a bounce, and often a sharp one at that, but as I also said then until proven otherwise it will just be a bounce.”
And bounce we did, although it was a weak one and hardly a resounding victory for the bulls, particularly since it was all in the AI names, with the average stock falling again into the weekend. I had said the Tech selloff “may prove to be more than a one-day event,” and it appears that may extend to the rest of the market.
A V-shaped bottom is certainly possible, but something tells me this may have further to go. As many of the comments at the top noted, these things often see follow-through selling. Systematic traders now have a lot of volatility in their lookbacks, hedge funds will likely be slow to step back in after getting torched this week when they took hedges off, and retail appears hesitant as well.
I’m very interested to see where all of the positioning and flow indicators stand, and hopefully to get updated thoughts from Deutsche Bank, which I suggested Sunday may have been a little quick to go overweight Tech.
But as I also said Thursday, “with markets having given back much of this year’s advance on what for now are just concerns about slower growth and positioning having been cleaned out (we’ll see how much this weekend), things certainly seem relatively favorable for upside once things stabilize.” The question is of course when we get that stabilization.
Let’s see how things look Sunday.
The Week Ahead — Inflation Data and a Wave of Fed Speakers
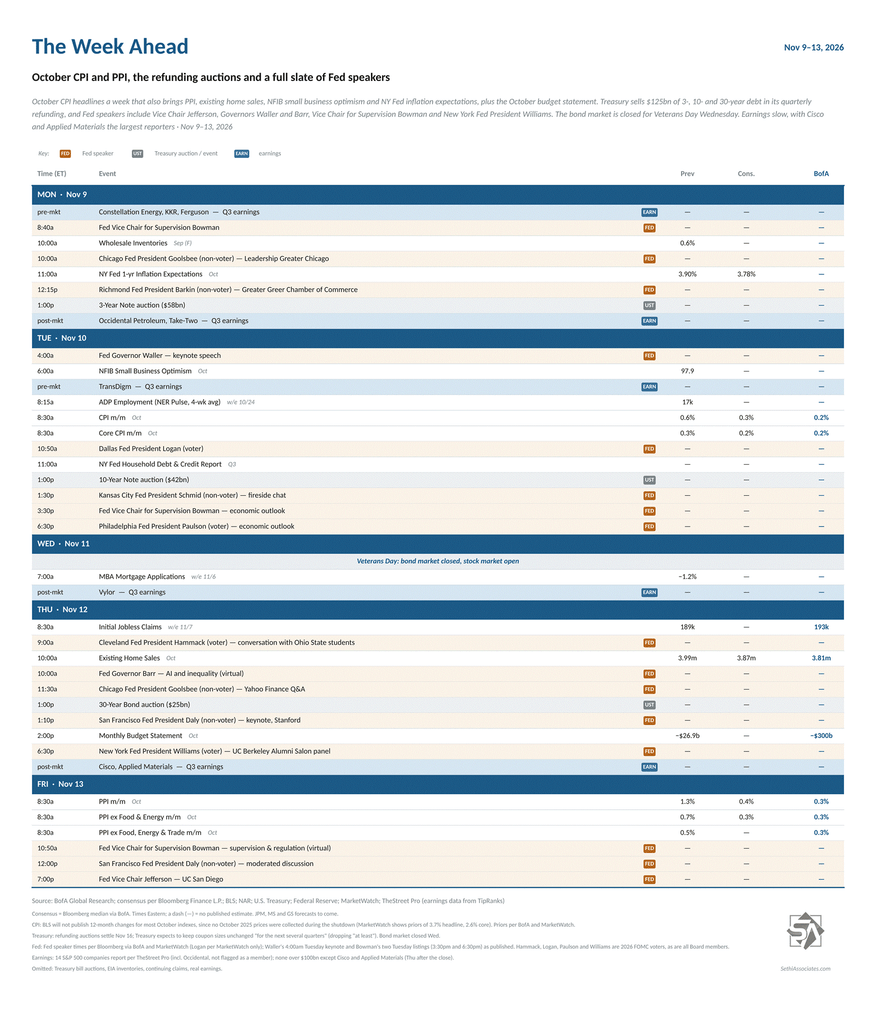
After a packed week, things ease off, but we do get key readings on inflation, a slew of Fed speakers and the return of Treasury auctions. It’s a lighter week for earnings as we await Nvidia later this month (and Broadcom and Micron in December), but we will hear from AI beneficiaries Cisco and Applied Materials.
US economic data turns to inflation next week. October reports are highlighted by CPI Tuesday and PPI Friday and also include NFIB small business optimism, NY Fed 1-year inflation expectations, existing home sales and the Monthly Budget Statement. We’ll also get final September wholesale inventories, the NY Fed’s Q3 Household Debt and Credit Report and the usual weekly reports (ADP, mortgage applications, unemployment claims, etc.). Note that BLS won’t publish 12-month changes for most October CPI indexes, since no October 2025 prices were collected during the shutdown.
Plenty of Fed speakers including Vice Chair Jefferson, Governors Waller and Barr, Vice Chair for Supervision Bowman, New York Fed President (and FOMC Vice-Chair) Williams (permanent voter), Cleveland Fed President Hammack (2026 voter), Dallas Fed President Logan (2026 voter), Philadelphia Fed President Paulson (2026 voter), Chicago Fed President Goolsbee (2027 voter), Richmond Fed President Barkin (2027 voter), San Francisco Fed President Daly (2027 voter) and Kansas City Fed President Schmid (2028 voter).
Non-Bill (>1yr in maturity) US Treasury auctions bring the quarterly refunding: a $58bn 3-year note Monday, a $42bn 10-year note Tuesday and a $25bn 30-year bond Thursday, all at 1:00pm ET. Note: The bond market is closed Wednesday for Veterans Day; the stock market is open.
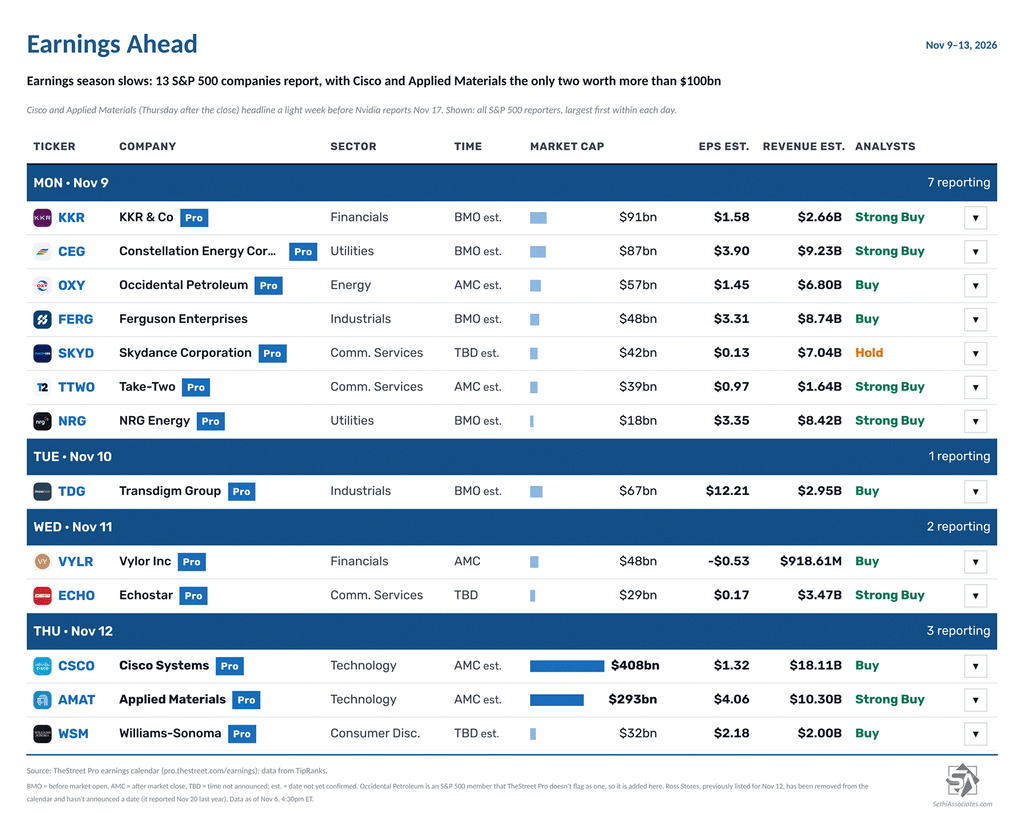
Q3 earnings season slows, with 13 S&P 500 components reporting, two of them with market caps over $100bn:
Thursday: Cisco (CSCO) and Applied Materials (AMAT)
Other S&P 500 reporters include KKR (KKR), Constellation Energy (CEG), Occidental Petroleum (OXY), Ferguson (FERG), Skydance (SKYD), Take-Two (TTWO) and NRG Energy (NRG) Monday; TransDigm (TDG) Tuesday; Vylor (VYLR) and EchoStar (ECHO) Wednesday; and Williams-Sonoma (WSM) Thursday.
Outside the S&P 500, we’ll hear from Petrobras (PBR), Sea (SE), Honda (HMC), Nu Holdings (NU), Nebius (NBIS) and Japanese megabanks Mitsubishi UFJ (MUFG), Sumitomo Mitsui (SMFG) and Mizuho (MFG).
At the time of publication, in terms of securities mentioned, Sethi was long AMZN, ANET, AVGO, BKNG, CEG, EXPE, GOOGL, MSFT, NXPI, OXY, SKYD, SPY, IWM, RSP and numerous Treasury ETFs, and short AMAT, CPER, LRCX, META, MRVL and MU. In the last 24 hours Sethi covered AMD and QQQ, covered ANET and went long, sold a small AXON position, bought AVGO and EXPE, and added to NXPI.