Hotter Inflation and AI Weakness End the S&P 500’s Run Without a 1% Drop
A hotter-than-expected September CPI report and a deepening selloff in AI names sent the S&P 500 down more than 1% for the first time in 54 sessions, with the Nasdaq and small caps falling nearly 2%.
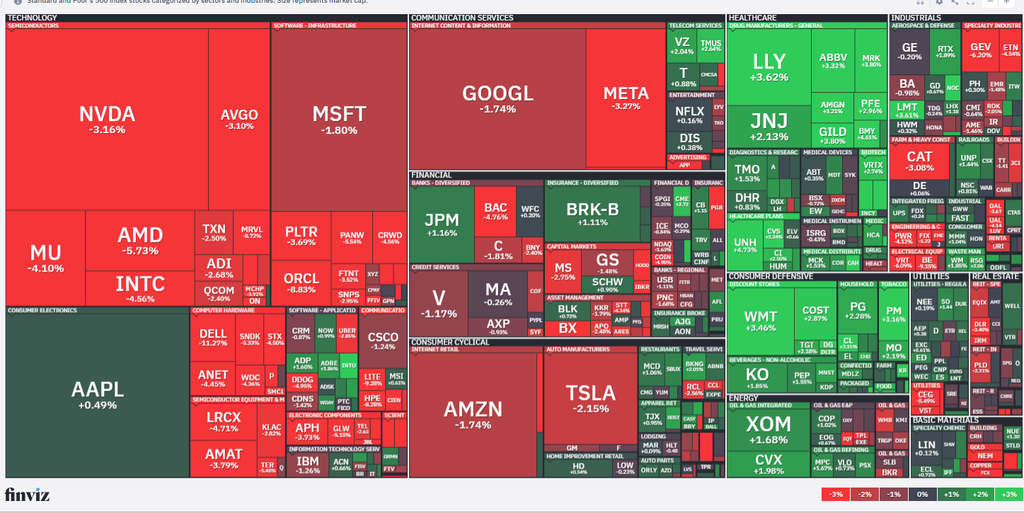
A hotter-than-expected September CPI report and a deepening selloff in chipmakers and debt-heavy AI names sent the S&P 500 and Nasdaq to their biggest drops since July. The S&P 500 fell more than 1% for the first time in 54 sessions, ending its longest such streak in more than six years, per Bloomberg, while investors rotated into Health Care, Staples and Energy, which kept the Dow Jones Industrial Average nearly flat.
Indices spent the session in the red for a second straight day. The S&P 500 fell 1.1%, and the Nasdaq and Russell 2000 each lost 1.9%, their worst days since July and June, respectively. The Dow Jones Industrial Average slipped just 0.1%, cushioned by gains in UnitedHealth (UNH) and Merck (MRK).
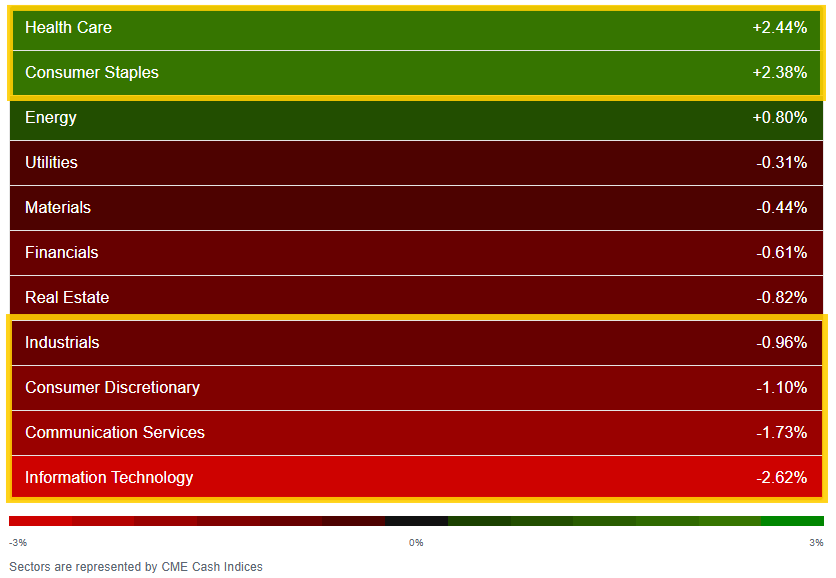
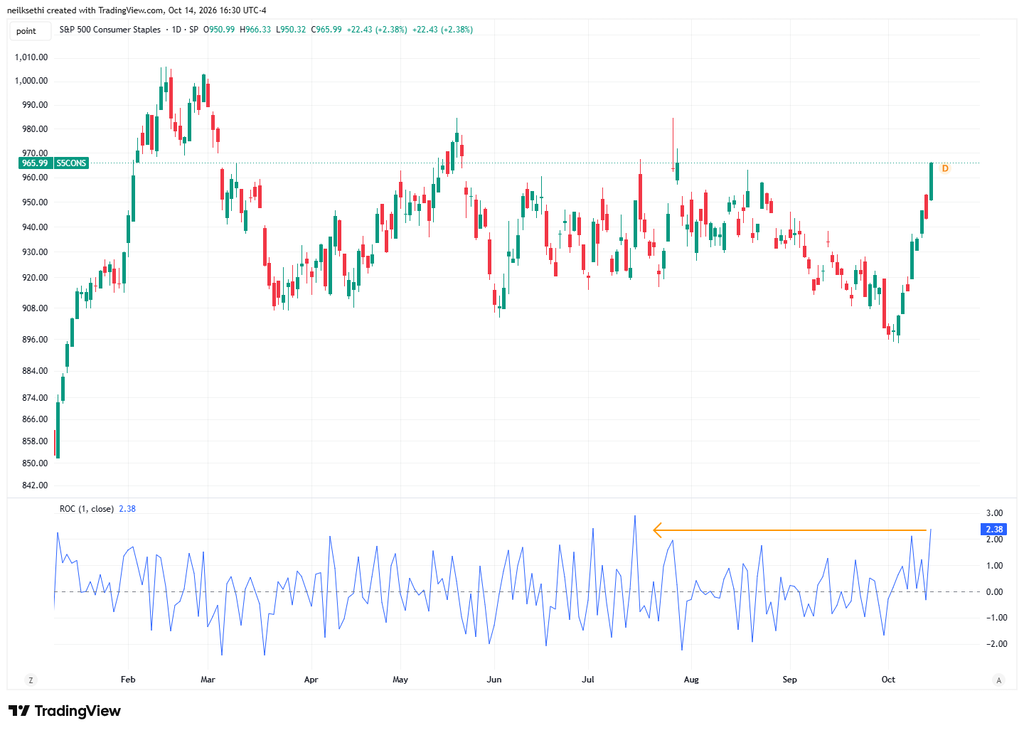
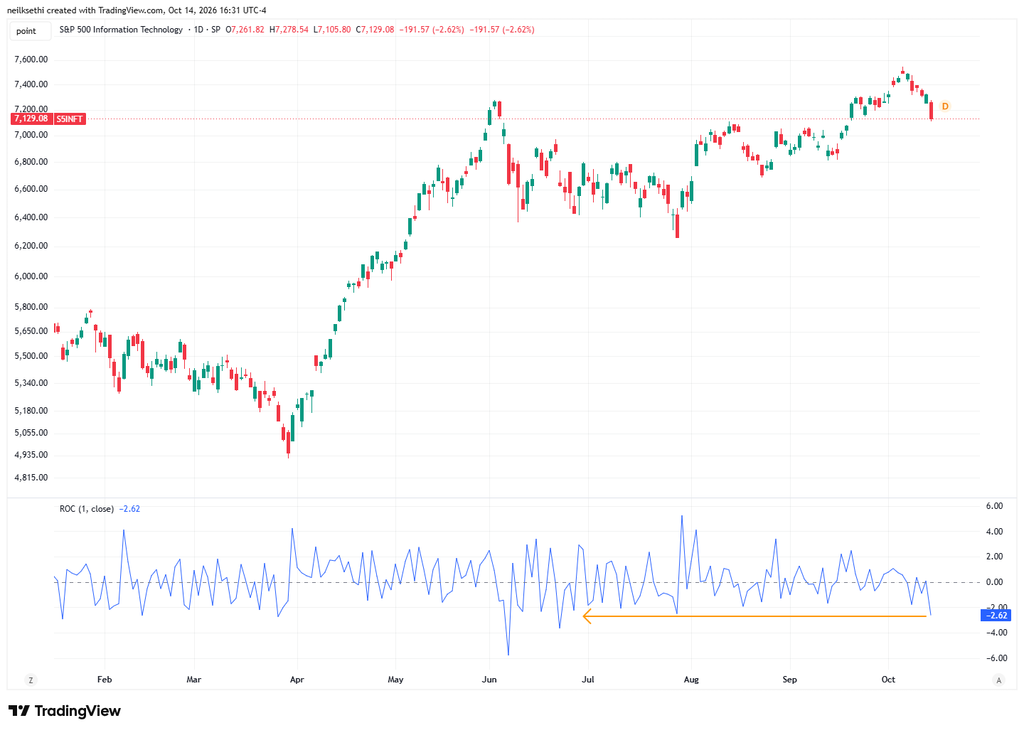
Breadth narrowed to just 3 of 11 sectors higher. Health Care and Staples each rose more than 2%, their best days since August and July, respectively, with Staples up for the seventh session in eight. Energy added 0.8% as WTI climbed to about $95. Tech though fell more than 2%, its worst session since June, and the other megacap-growth sectors, Communications and Consumer Discretionary, each lost more than 1%.
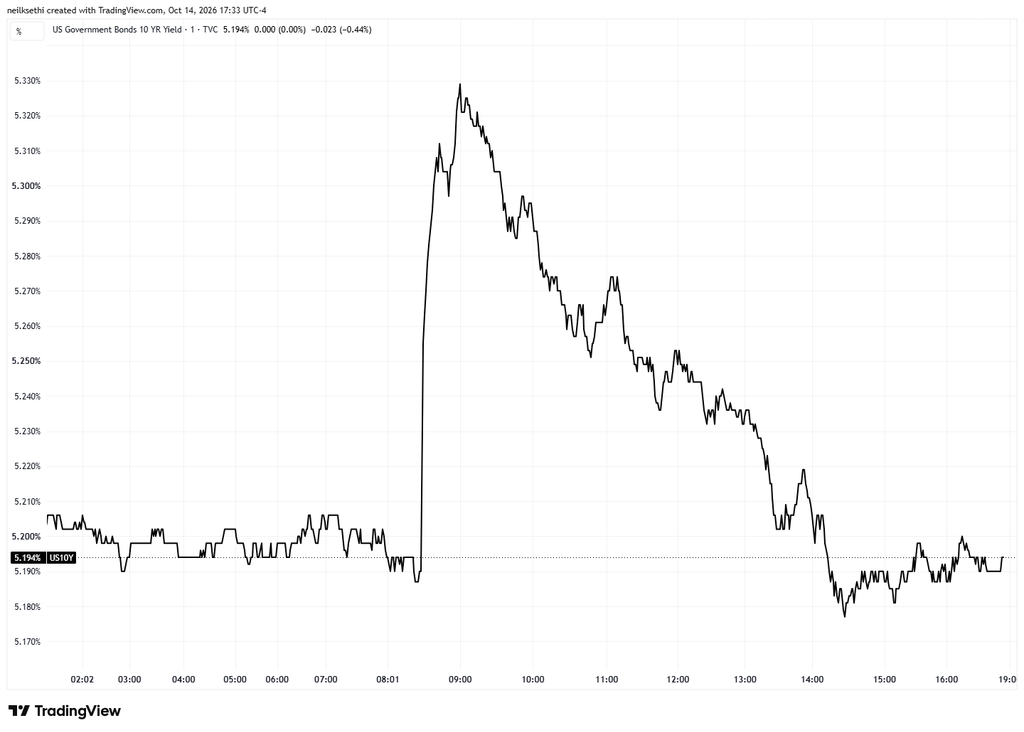
September CPI ran hotter than expected. The annual rate jumped to 3.7% from 3.4%, and core rose 0.3% for the month versus 0.2% expected. October hike odds briefly rose near 50% on CME FedWatch before fading. The 10-year yield topped 5.32% early, then reversed to settle down 3bp at 5.19% in the cash session, though the bond rally did little for most stocks. The Fed’s Beige Book also showed intensifying price pressures.
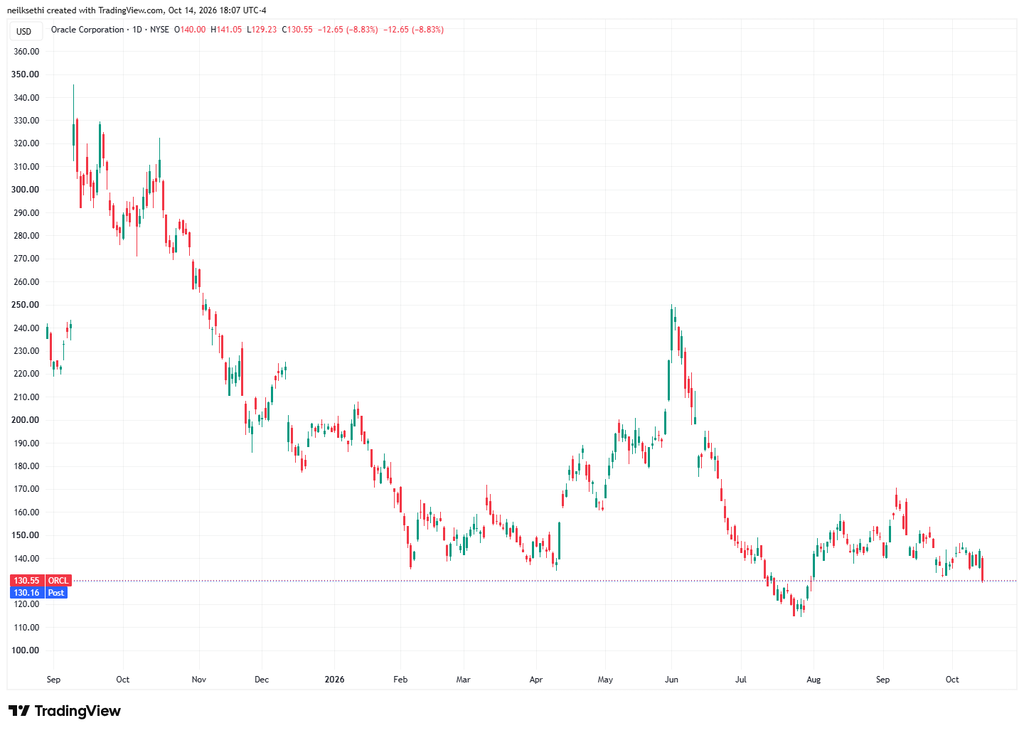
The PHLX Semiconductor Index (SOX) sank 4.3%, extending a six-day slide to 11.6%. Debt-heavy AI infrastructure names fared worst: CoreWeave (CRWV) plunged more than 15% as its bonds fell to distressed levels, and Oracle (ORCL) lost almost 9%. Bank of America (BAC) fell 4.7% after its results missed estimates, and Morgan Stanley (MS) slid 2.7% despite a beat.
Thursday brings September PPI and retail sales, the Empire State and Philly Fed surveys, more bank earnings, and earnings from Taiwan Semiconductor Manufacturing (TSM). Fed Chair Warsh’s fireside chat is late Thursday night.
Schwab
Market Commentary
Equities:
“Investors are jittery and looking for excuses to take profit on AI-related stocks that have outperformed this year, especially memory stocks,” said Vey-Sern Ling, a managing director at Union Bancaire Privee. “The excuses are not new, but nobody wants to stand in front of a stampeding herd. Sell first, ask later is the mood.”
“While increased competition within AI, rising financing requirements, and higher rates may periodically add to volatility, we view this latest bout as more of a recalibration of expectations than a fundamental break in the AI investment story,” said Ulrike Hoffmann-Burchardi at UBS Chief Investment Office.
CPI:
“It’s clear as ever that inflation is stubborn and moving in the wrong direction,” according to Skyler Weinand at Regan Capital. “While we expect the Fed to pause on any rate changes in October, we expect rate hikes to resume in December and continuing until June 2027.”
“Overall, it was a troubling round of inflation data that undermines the argument for a gradual pace of future rate hikes, and revives the prospects for a quarter-point Fed hike in two weeks,” said Vail Hartman at BMO Capital Markets. “That being said, CPI by no means locks in an October rate hike.”
“This puts the Federal Reserve very much in play for December,” Philip Blancato, Osaic chief market strategist, told CNBC, before later noting that “we’re looking at probably a core CPI next year of 3%” given the impact of higher oil prices. Still, Blancato isn’t “overly concerned” about the equity or bond markets, as he views the latest rise in inflation as “transitory.” He continued, “I think a lot of this has already been priced in.”
While the latest consumer price index raises concerns around inflation risks, the Fed has already communicated a gradual hiking process, according to TD Securities’ strategists including Oscar Munoz and Gennadiy Goldberg.
“Today’s report makes the chance of an October hike higher, but we still believe the Fed will hold and opt for December as the market is already doing some of the work for them,” they said.
Sector breadth eased further with just 3 of 11 sectors higher. Health Care back to the front (after leading to the downside Tuesday) up over 2% as was Staples, the latter up for the 7th session in 8 and the best day since July (Health Care best since August). Energy +0.8% was the other green sector after leading Monday and Tuesday.
Tech was another 2% mover, but to the downside, the worst session since June, dragging the market cap indices lower. The other two megacap growth sectors (Communications and Consumer Discretionary) also down over 1% and AI-beneficiary Industrials was close.
[chart uses futures prices]
Schwab
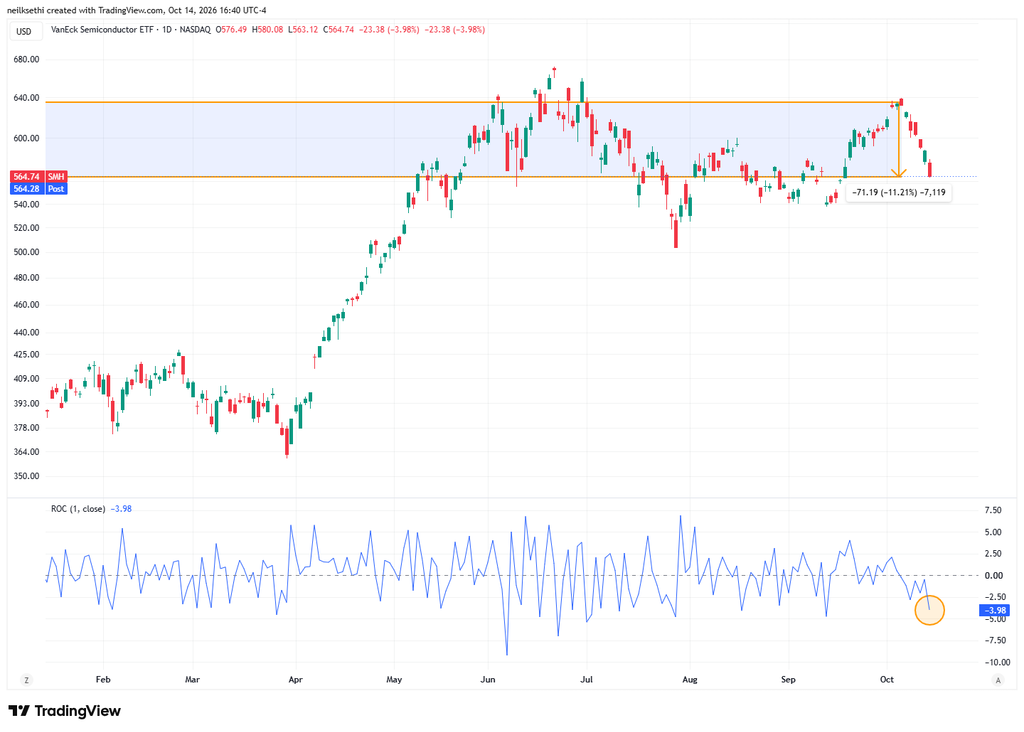
Chip stocks added to their recent declines. The VanEck Semiconductor ETF (SMH) fell for a 7th straight session accelerating to -4%, its worst drop in a month, and bringing its losses to over 11% over the past seven sessions. If you missed it, Helene explained why this might be a good thing: If We Want a Lasting Rally, the SOX May Need to Fall Some More.
Micron Technology (MU) dropped 4%, Advanced Micro Devices (AMD) moved down nearly 6%, Intel (INTC) 4%, and SanDisk (SNDK) over 5%.
Shares in neocloud companies CoreWeave (CRWV) -15.5%, Nebius (NBIS) -10.1%, and IRENLimited (IREN) -12.2% sold off after Venture capitalist Chamath Palihapitiya shared a chart on X showing certain CoreWeave bonds were trading in “distressed” territory. Elon Musk reacted “Yikes”. The post shows the yield on $1.25 billion CoreWeave bonds due 2032 reached 15% before closing at a record 14.5% on Tuesday. Oracle (ORCL) fell 8.8%.
Dell (DELL) -11.4% was the second-worst performer in the S&P 500, facing sharp selling pressure after Barclays analyst Tim Longdowngraded the computer and server maker from Overweight to Equal Weight. The 5-star analyst also cut his price target to $574 from $603. Long also downgradedHewlett Packard Enterprise (HPE) -8.3% and lowered his price target for HPE stock to $77 from $83. He explained the downgrade by stating he sees “less upside as memory prices normalize.”
The declines in semiconductors came even as ASML (ASML) -3.9%, the Dutch semiconductor-machine company, lifted its annual forecasts for the third time this year and said it was looking at ways to boost production. Sarge wrote on ASML in his morning opener: ASML Just Told Investors Something They Shouldn’t Ignore. As a side note, I did sell my ASML shares when they broke support. I will look to re-enter when the coast is more clear.
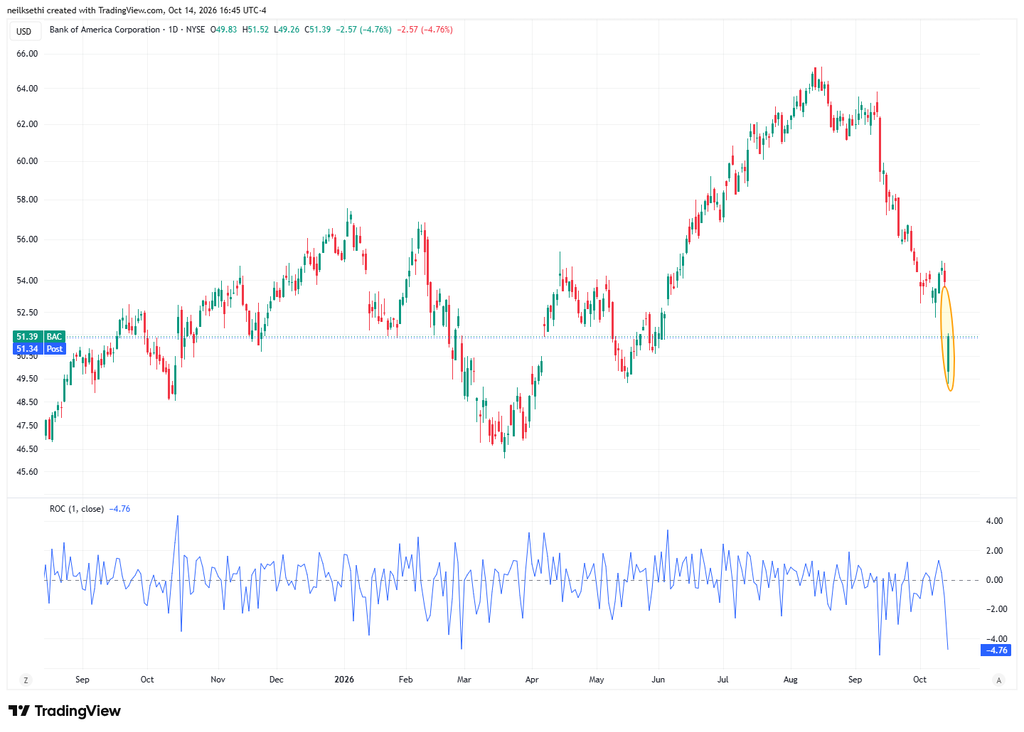
Financials were pressured by a 4.7% decline in Bank of America (BAC) after its earnings miss. Bank of America says its results today included a charge that hit its results by 17 cents per share after the Treasury Department said yesterday that it fined the bank $1.2 billion after finding it had insufficient systems to monitor for financial crimes. The bank also said trading operations, which include stocks and bonds, struggled in the period. If you missed it from Sarge: Exiting Bank of America After $1.2 Billion AML Embarrassment.
Morgan Stanley (MS) -2.7% also retreated despite topping earnings expectations, with its wealth management business posting record-high revenue. More on both Bank of America and Morgan Stanley from Chris Versace: Our Plan for Big Bank Shares Hinges on 2 Things.
Skydance’s (SKYD) was the worst performer on the S&P 500, sinking 22% in part due to a technical adjustment as 471 million stock warrants issued as part of the deal to combine with Warner Bros began regularly trading today under the symbol SKYD.WS. That meant the value of the warrants is no longer reflected in Skydance’s stock price. The distributed warrants give current investors the right to purchase additional equity in the newly merged studio for $12 a share.
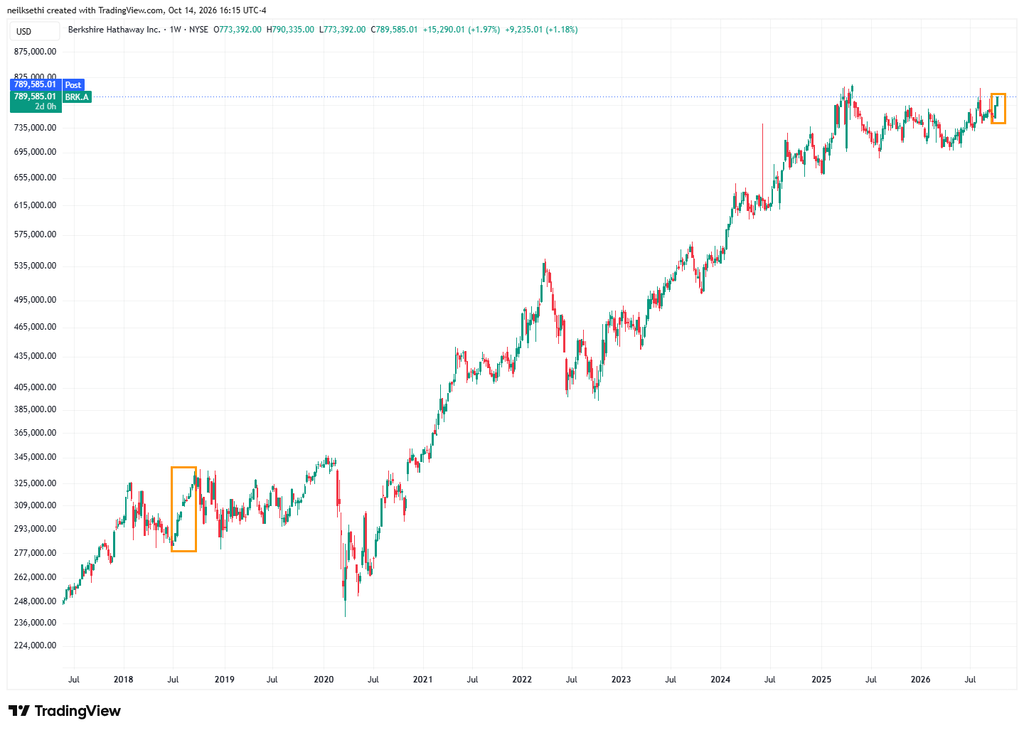
Berkshire Hathaway’s Class A shares (BRK.A), on the other hand, rose for a 10th consecutive day, their first 10-day rally since January 2018, when they rallied 20% for the better part of three months (weekly chart below – TradingView doesn’t have daily past 10 years).
Relatedly, Bending Spoons (BSP) shares ripped over 40% to an all-time closing high after new securities filings showed Berkshire is investing $330 million into the company, bringing its total stake in the Italy-based serial acquirer to 4%.
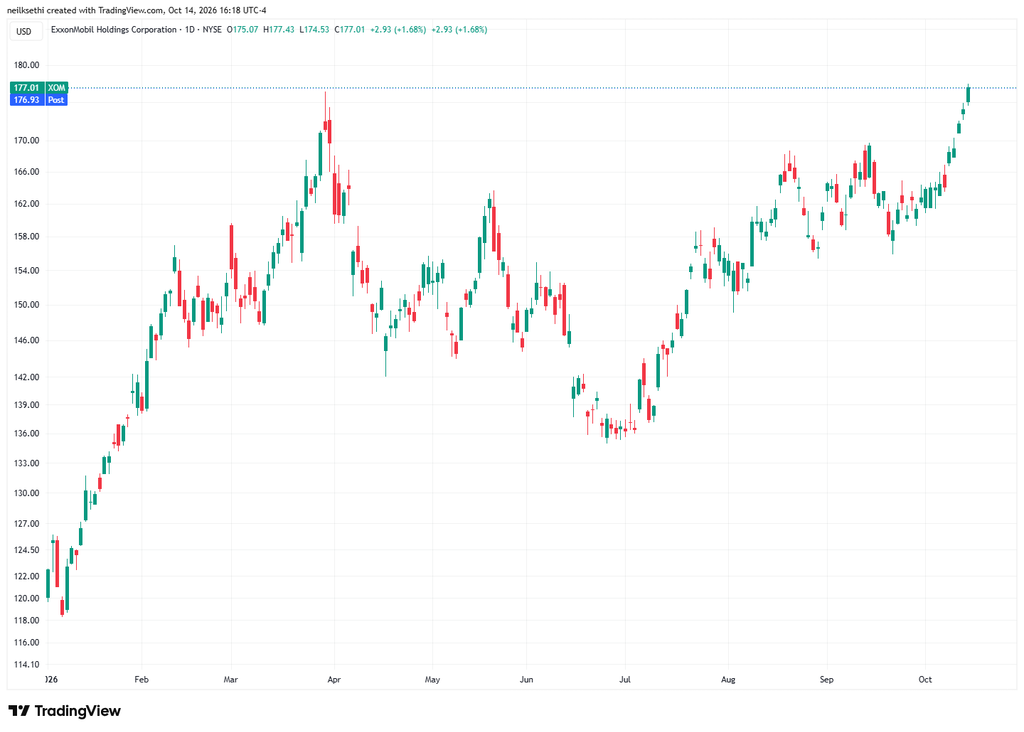
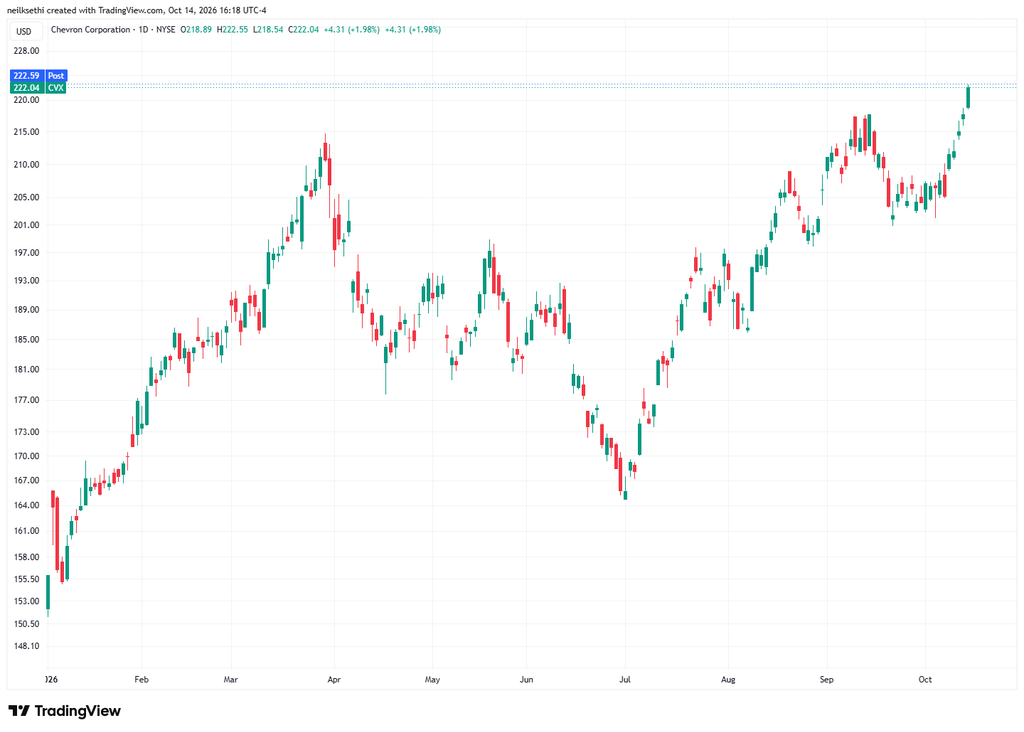
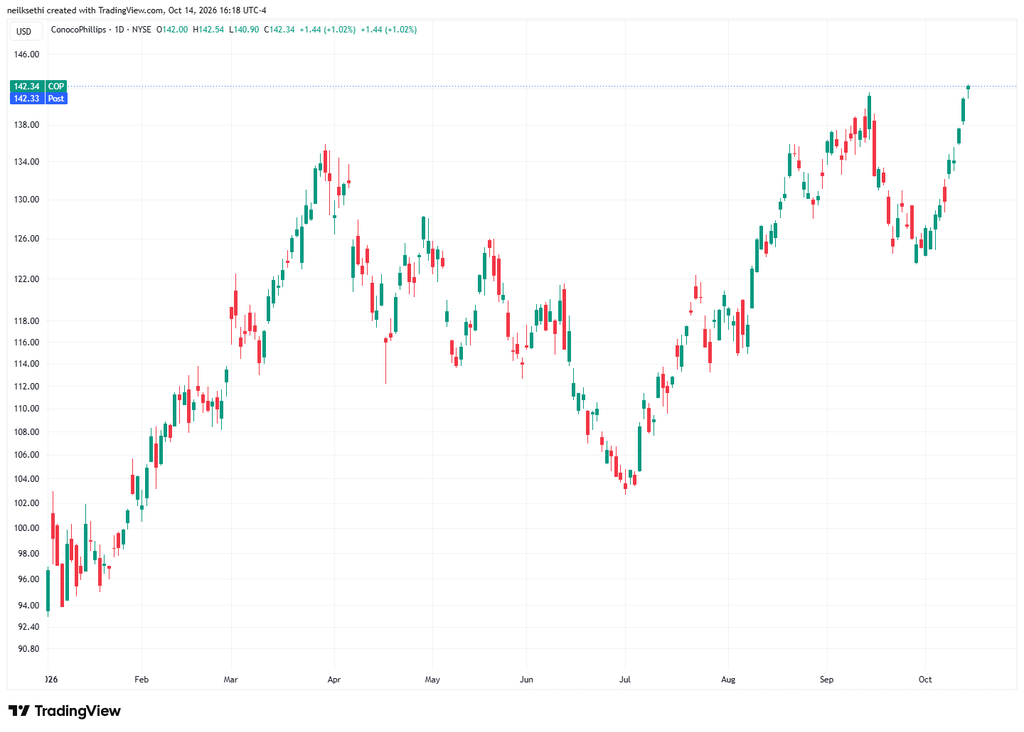
A trio of oil majors also closed at all-time highs Wednesday: ExxonMobil (XOM) +1.7%, Chevron (CVX) +2.0%, and ConocoPhillips (COP) +1.0%.
UnitedHealth (UNH) +4.8% was the best performer on the S&P 500 along with Merck (MRK) +3.8% a support to Health Care, while Walmart (WMT) +3.5% and Coca-Cola (KO) +1.9% lifted Staples.
The number of large SPX winners (up over 3%) did improve slightly to ~20 from 13 Tuesday, 10 Monday, but the number of large losers (down over 3%) jumped to ~85 from ~20. As mentioned previously, both of these metrics have been very (extremely?) subdued since the start of August, rarely getting above 50 and only once above 100. So the large losers was a relatively high reading compared to what we’ve been seeing the past couple of months.
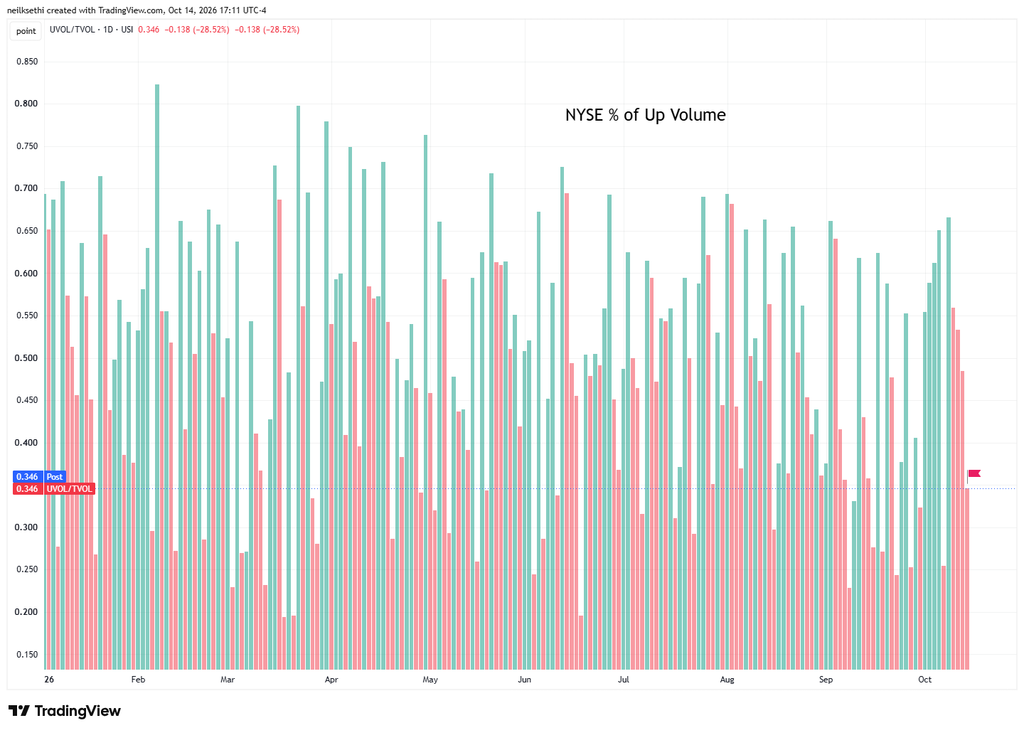
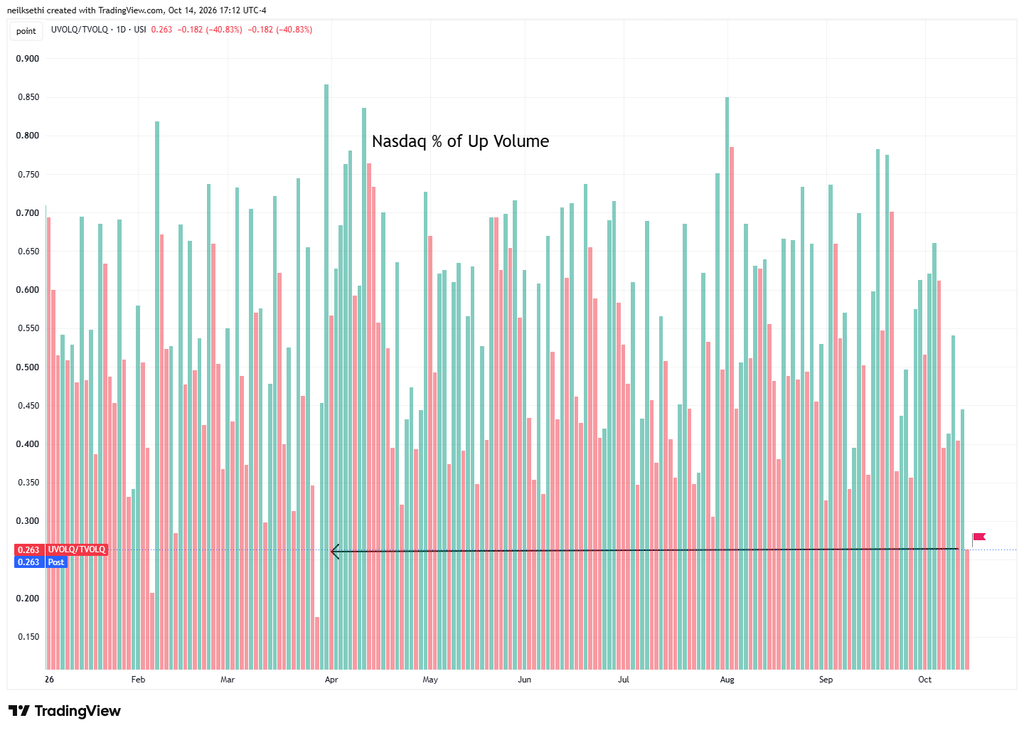
As you’d expect positive volume (intensity in buying stocks up on the session) was weak on both the NYSE and Nasdaq at 34.6% and 26.3% respectively, the latter the weakest since March.
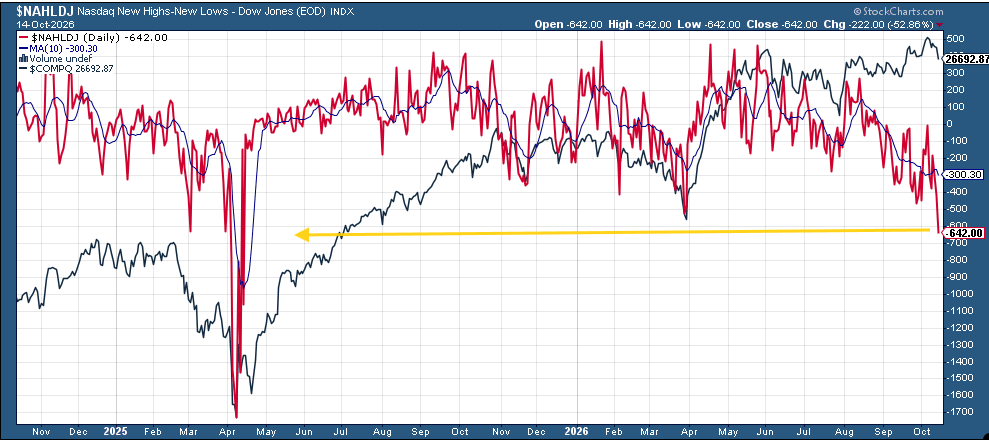
And NYSE new 52-week highs minus lows fell back to -282, but it was the Nasdaq where we got the eye-popping number with 652 fewer new 52-week highs than lows, the most negative since April 2025.
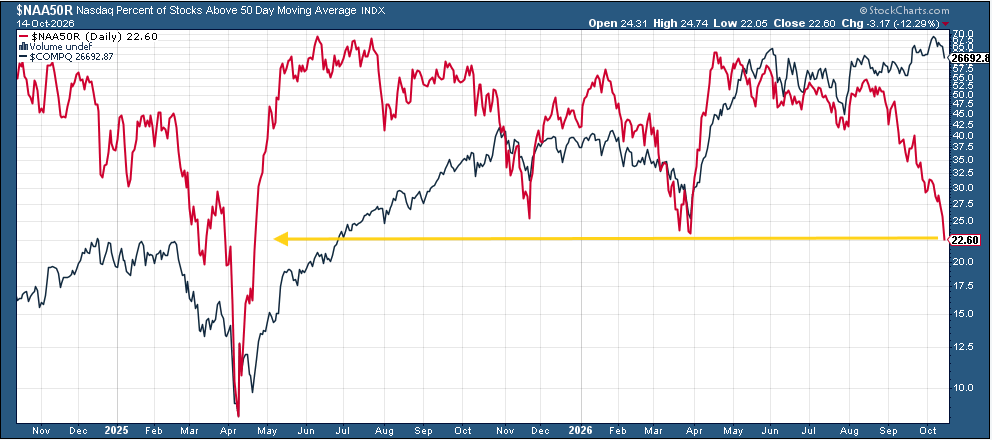
And Nasdaq percentage of stocks above their 50-DMA is also now the least since April 2025.
Some other stock-specific commentary from TheStreet Pro:
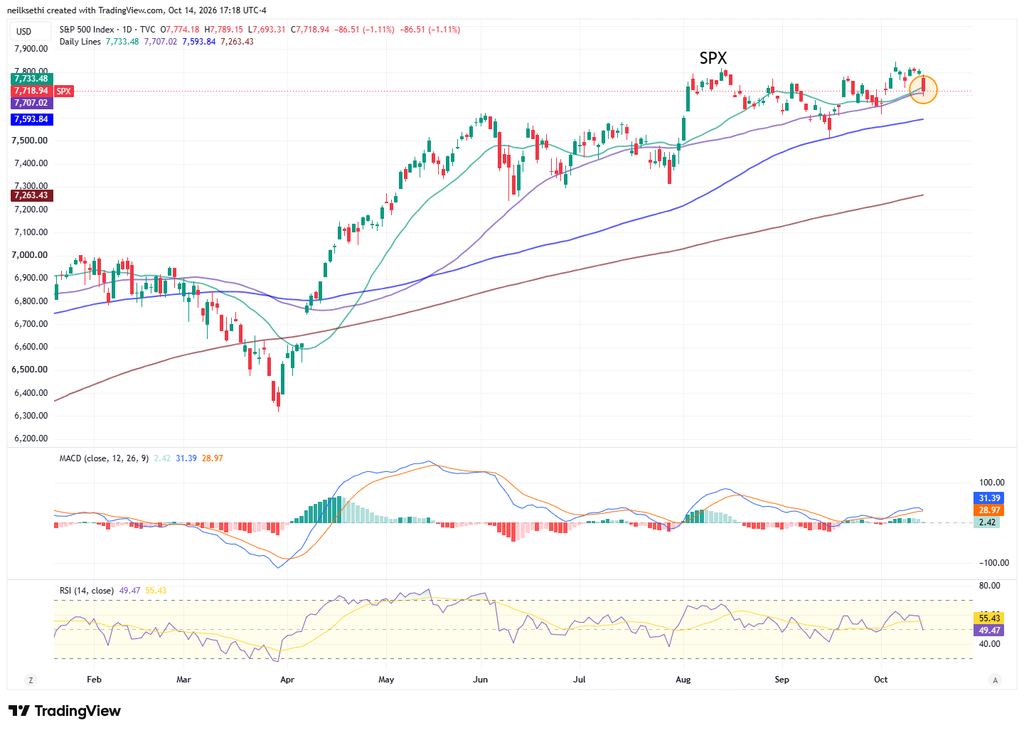
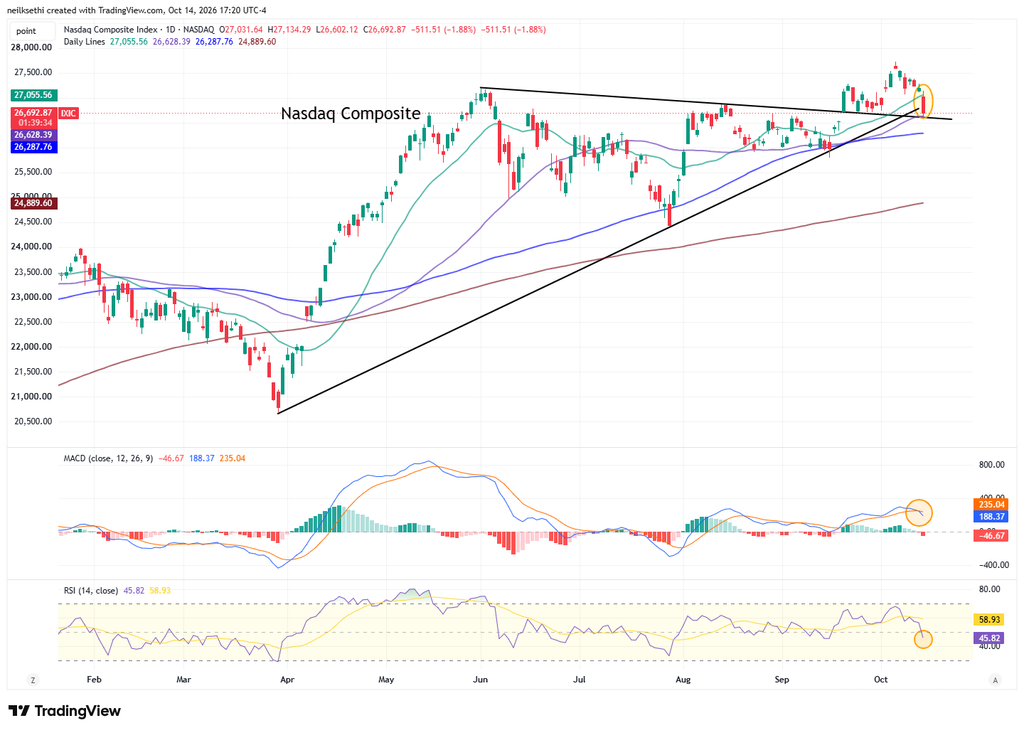
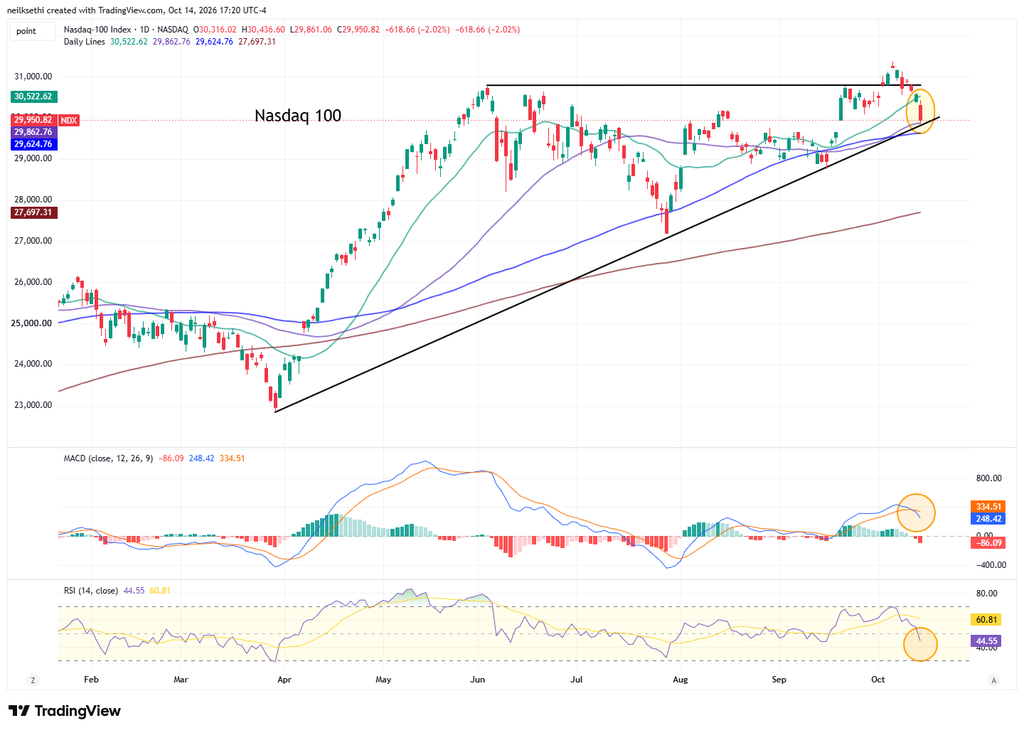
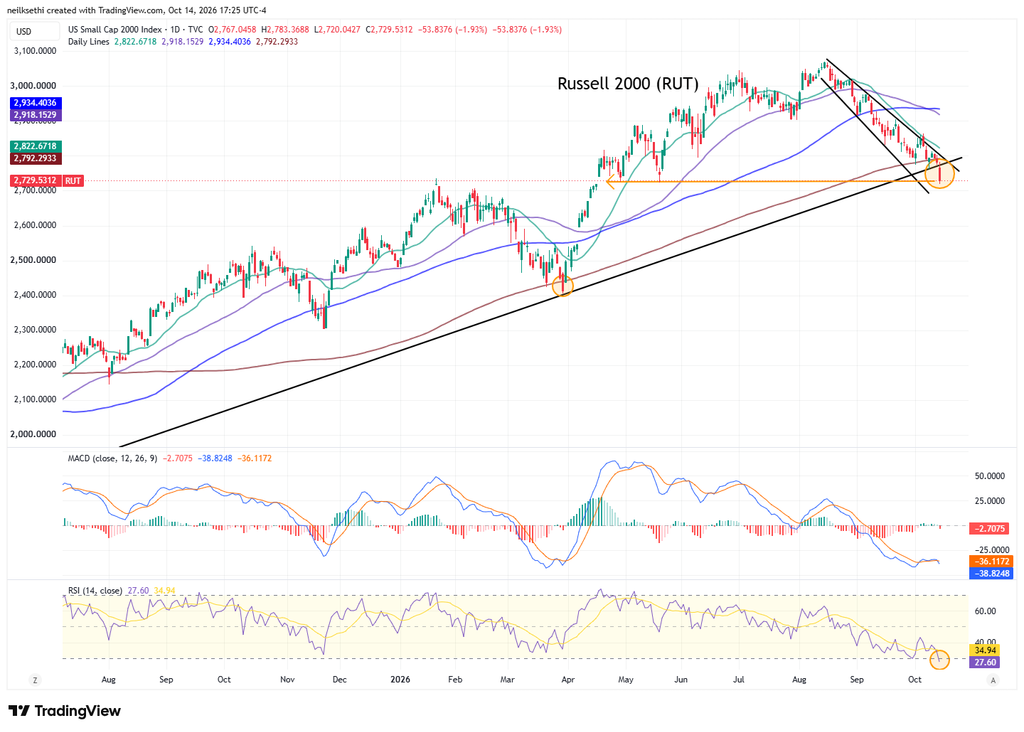
Note on all charts the colored lines are moving averages (the average price over the lookback period — days on the daily charts, weeks on the weekly charts): 20 = green 50 = purple 100 = blue 200 = brown
Exception is monthly charts where blue is 10-month moving average and brown is 20-month moving average.
MACD = Moving average convergence/divergence line, a measure of momentum that compares longer term and shorter term momentum to gauge if a move is strengthening or weakening. This is probably my favorite individual indicator.
RSI = Relative Strength Index (basically what it sounds like) = measures the strength of the move comparing gains to losses over the given lookback window (I use the standard 14 periods).
SPX fell under its 20-DMA to its 50-DMA. The daily MACD and RSI also softened to neutral.
NasdaqComposite also fell to its 50-DMA, but as noted Tuesday it has a MACD sell signal and now the RSI has fallen under 50. It’s also now under the trendline from the April 2025 lows.
And theNasdaq-100 (QQQ) similar to the Nasdaq. I haven’t sold my QQQ position yet, but a break of the 100-DMA just below the 50-DMA likely sees me sell at least half. That would also coincide with a break of its own trendline.
Uh oh. The Russell 2000 (RUT) fell under the uptrend line from the April 2025 lows. As I said Tuesday “breaking that would be notable and would normally see me put a short on the index, but it has a divergence in the MACD and price that keeps me cautious on doing that.” I did though sell out of the Russell 2000 ETF (IWM). It’s now the lowest since early April, the MACD is back to “go short,” although the RSI is under 30 for the first time since April 2025.
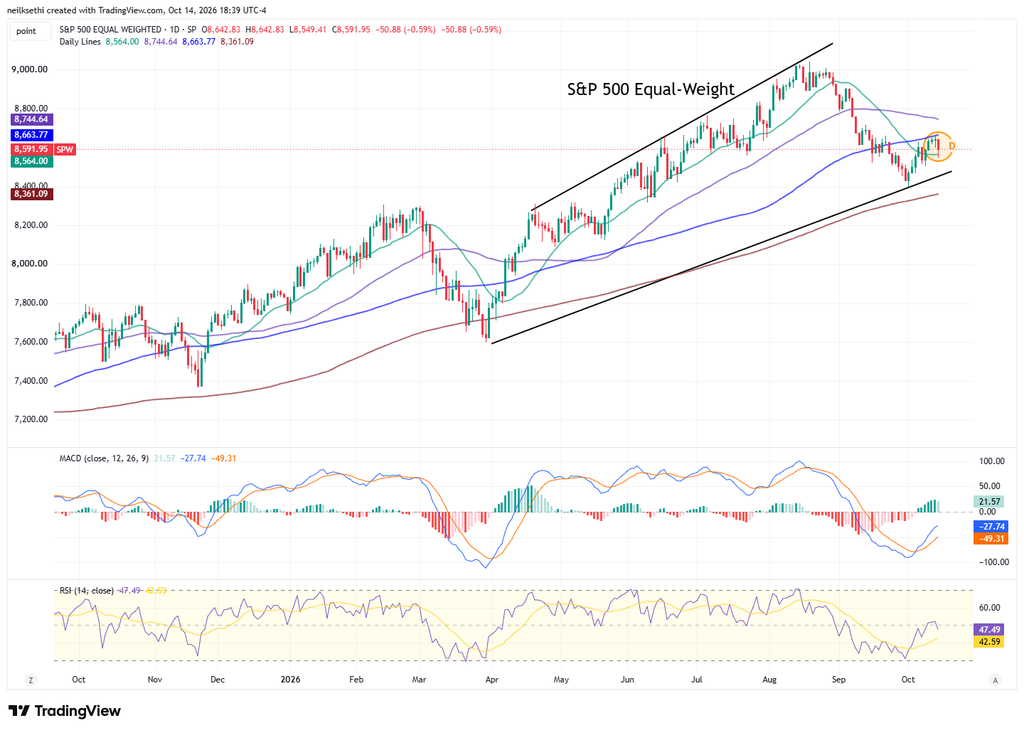
The equal-weighted SPX continues to hold up better but also capped by the 100-DMA. It still has a positive MACD, but the RSI fell under 50.
Treasury yields “twisted” for a second session with the short end edging higher (in line today with the increased Fed rate hike odds) while the long end again fell.
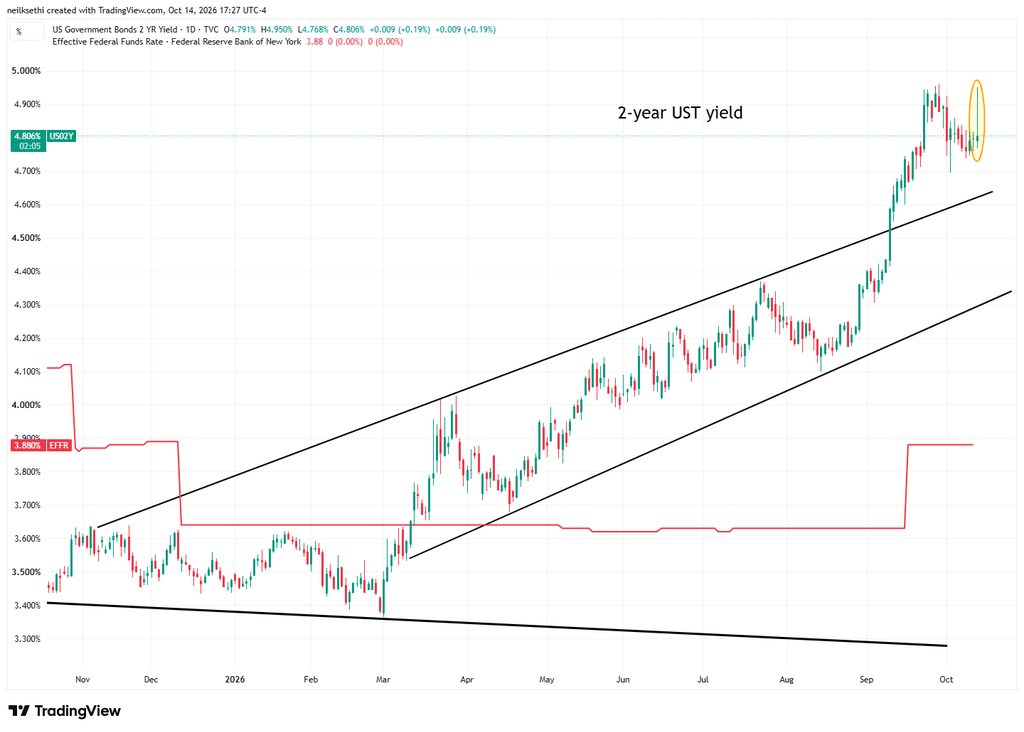
The 2-year Treasury rose one basis point (including the after-hours) for a second day, but that was way off the highs of the session of around 15 basis points right after the CPI print.
It is ~93 basis points above the Effective Fed Funds rate, so still calling for (at least a couple) more rate hikes.
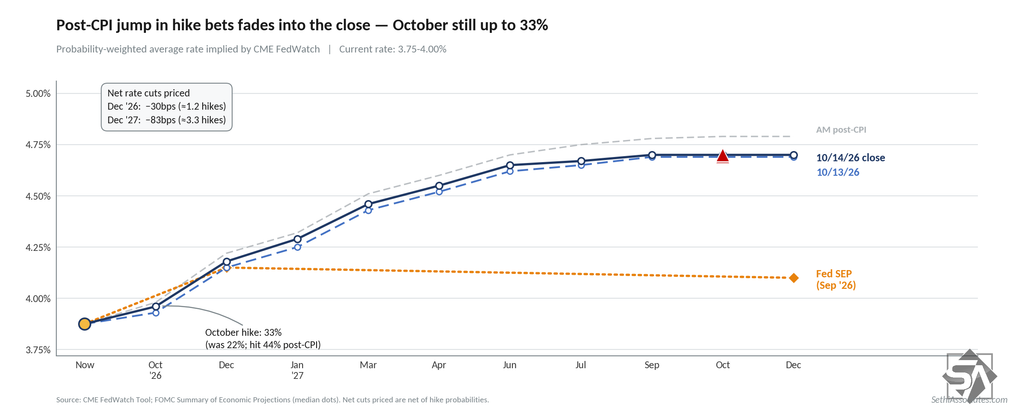
Fed rate hike bets from the CME Fedwatch tool similarly gave back some, but not all, of their firming. After CPI the chance of an October rate hike rose to nearly 50% and total rate hikes through 2027 rose to around 91 basis points.
By the end of the day, though, we are at a 33% chance of an October hike (from 22% Tuesday) and ~83 basis points of hikes through 2027 (compared with 81 Tuesday). Chance of two hikes this year is 29%.
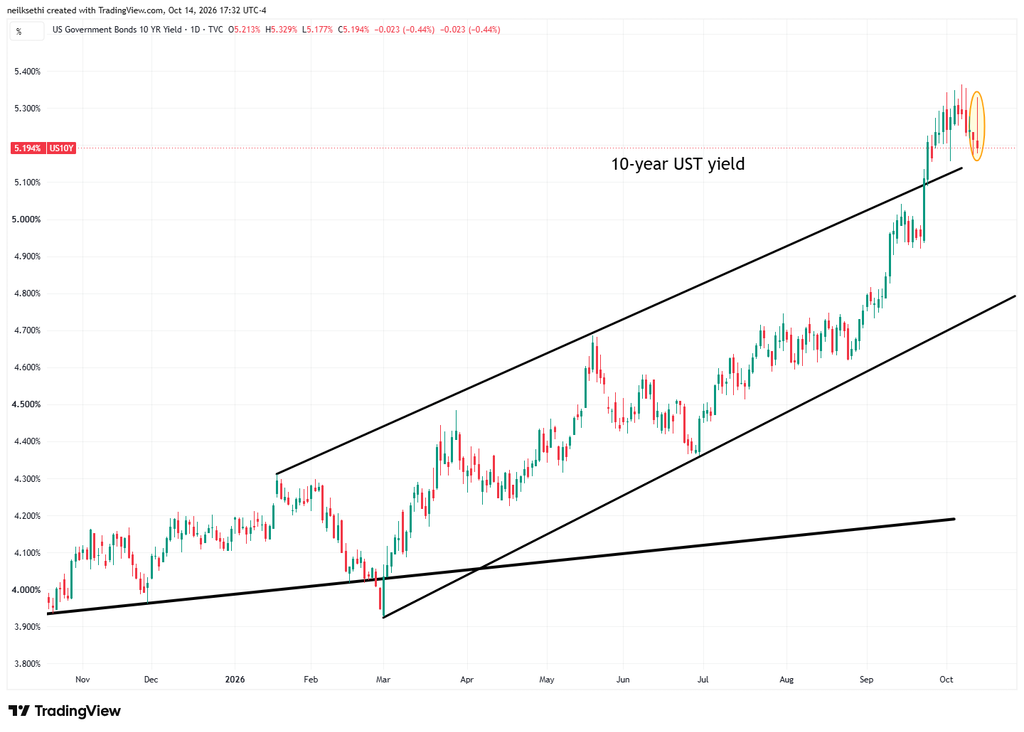
10-year yields eased two basis points to 5.19% (including after-hours), the lowest close in two weeks and now 12 basis points from the highest close since 2002 last week. Immediately after CPI it was higher by 10 basis points.
You can see the sharp reversal in the intraday chart.
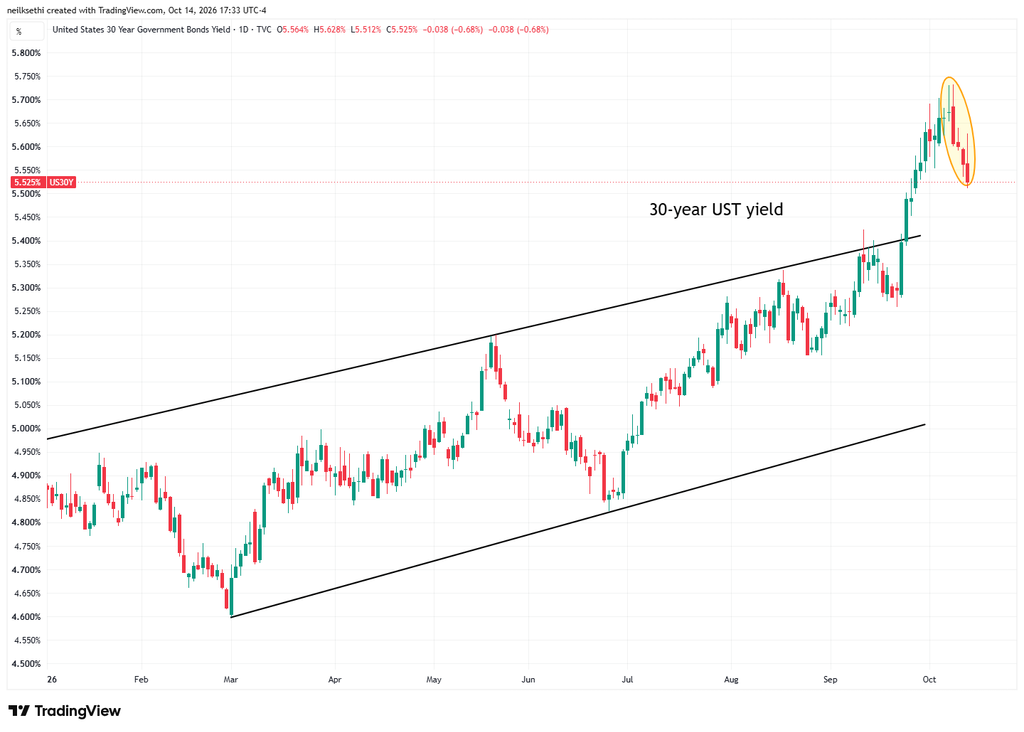
30-year yields eased four basis points for a second session to 5.52% (including after-hours), also a two-week closing low and the fourth straight decline.
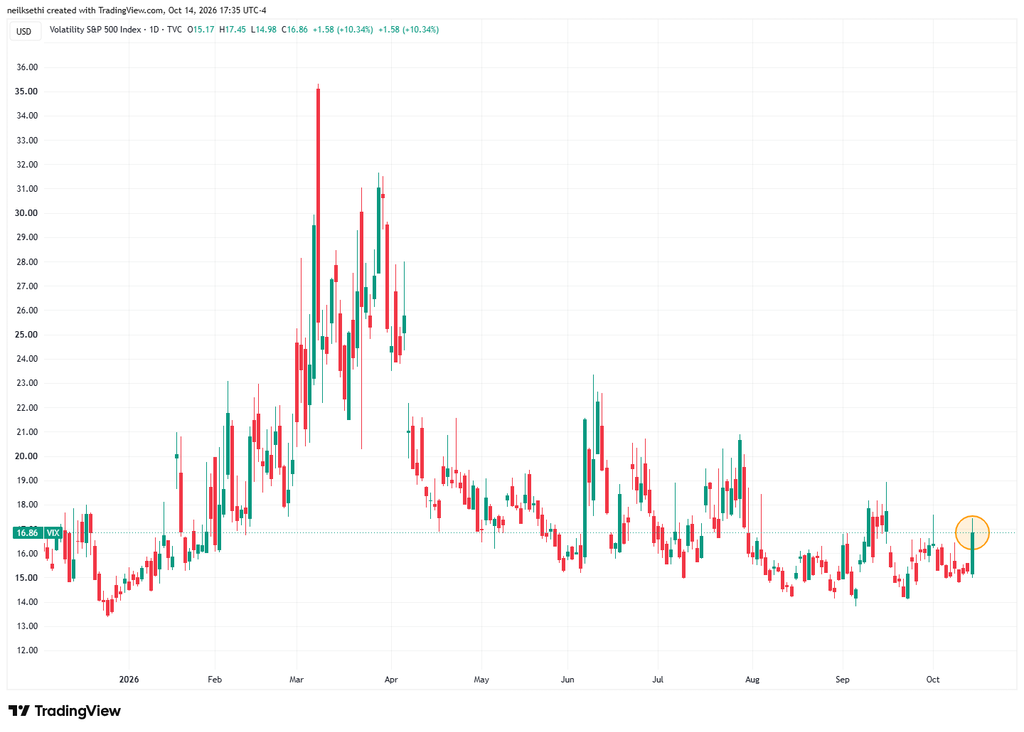
VIX did rise to 16.9, the highest in nearly a month. That’s consistent with ~1.06% average daily moves in the SPX over the next 30 days.
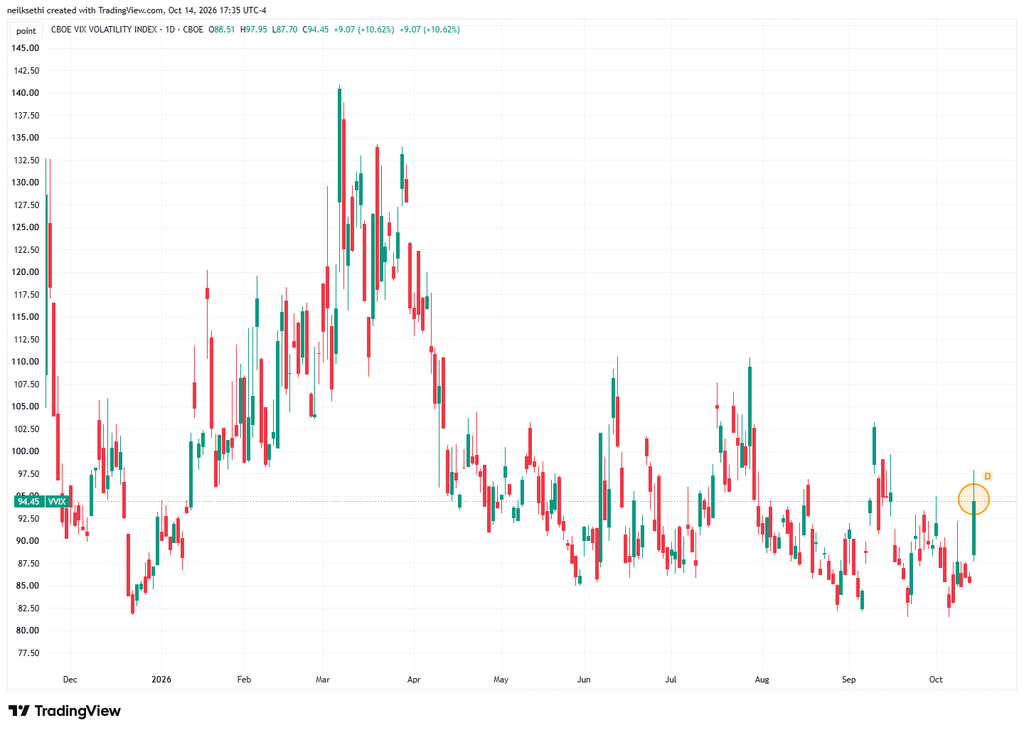
The VVIX (VIX of the VIX) up to 94.5. The current level is still consistent with “moderate” daily moves in the VIX over the next 30 days (historically, normal is 80-100, although we haven’t been below 80 since July 2024). Above 100 is the level flagged by Charlie McElligott as indicating higher stress.
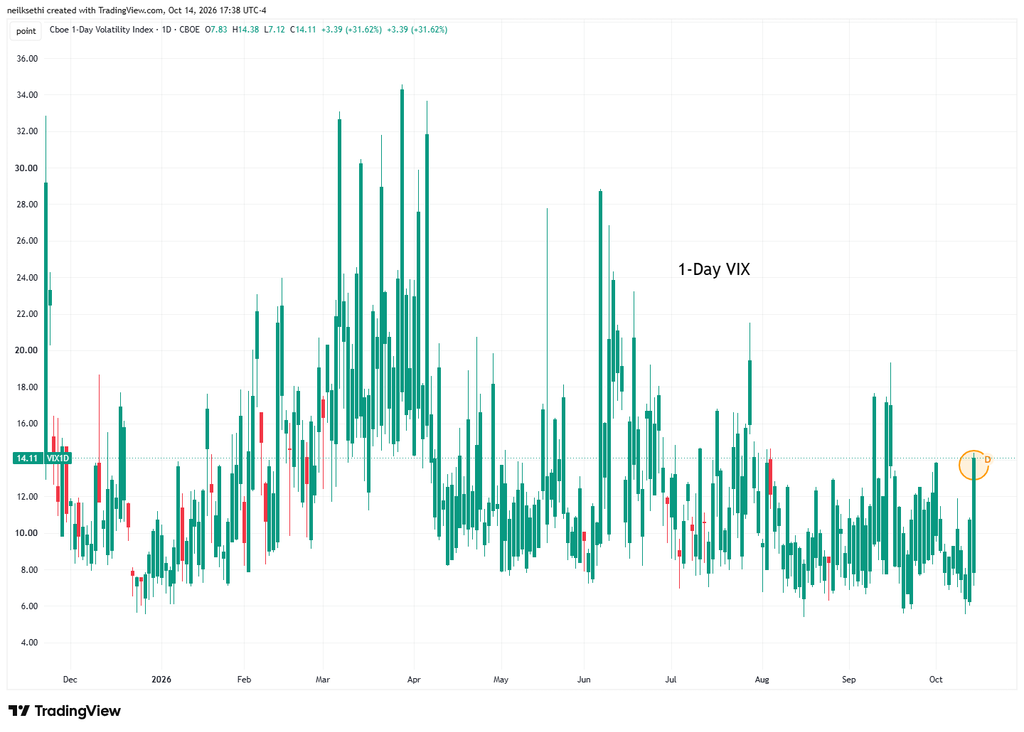
Apparently traders are having second thoughts after going into CPI with one of the lowest pre-CPI 1-day VIX readings in years, pushing it up to 14.1 from 10.7 even with the event behind us. As I said Tuesday, ‘for a CPI day that’s pretty tame.'” The current reading is consistent with a move of 0.89% in the SPX next session.
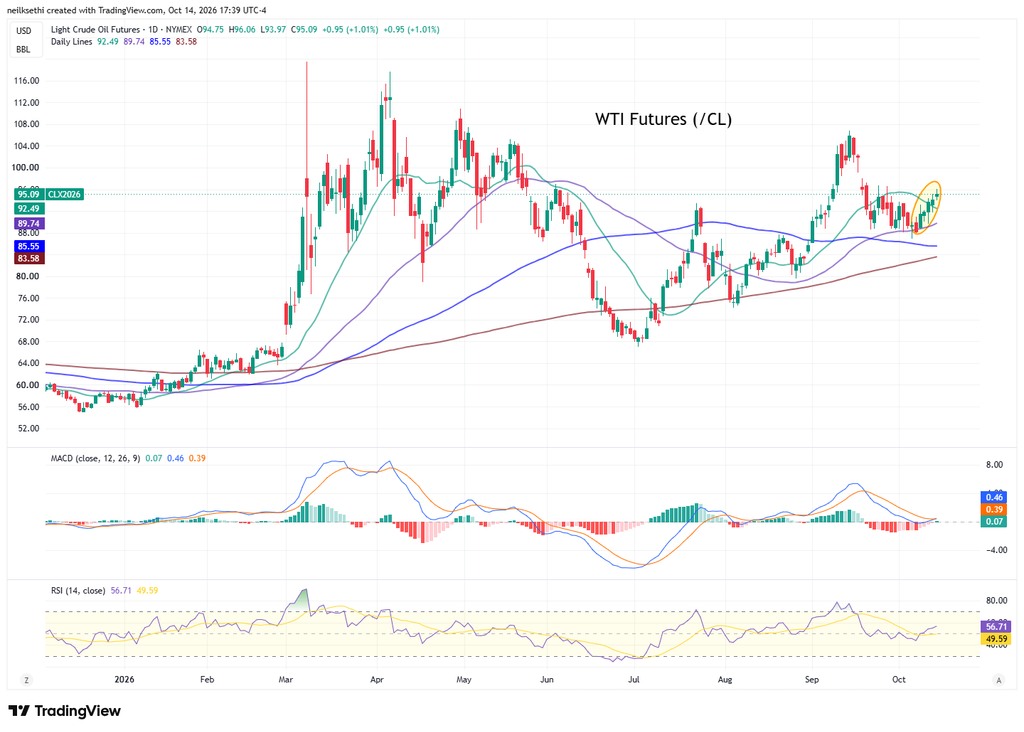
WTI futures (/CL) up for a fifth session to the highest close in three weeks (including after-hours).
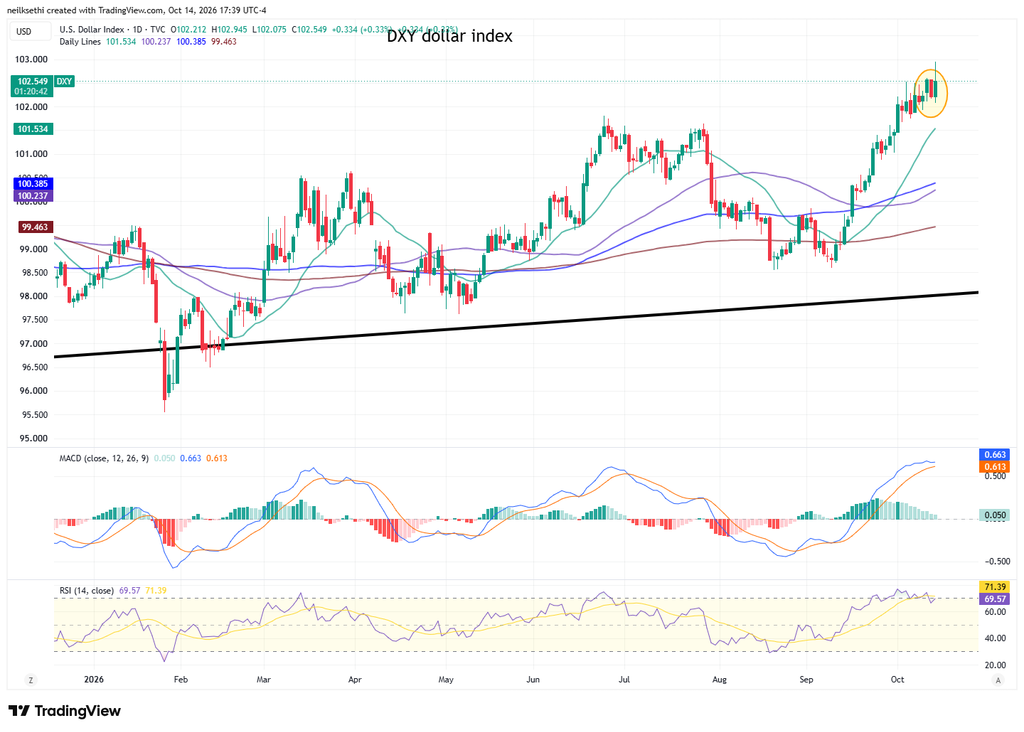
The DXY dollar index (which is fixed weighted with a heavy 57% weighting vs the euro) at one point hit the highest levels since April 2025 before giving up some of those gains to end just below Monday’s close.
As I mentioned last month “The daily MACD remains positive and the RSI is above 60 so it continues to have strong technical support.”
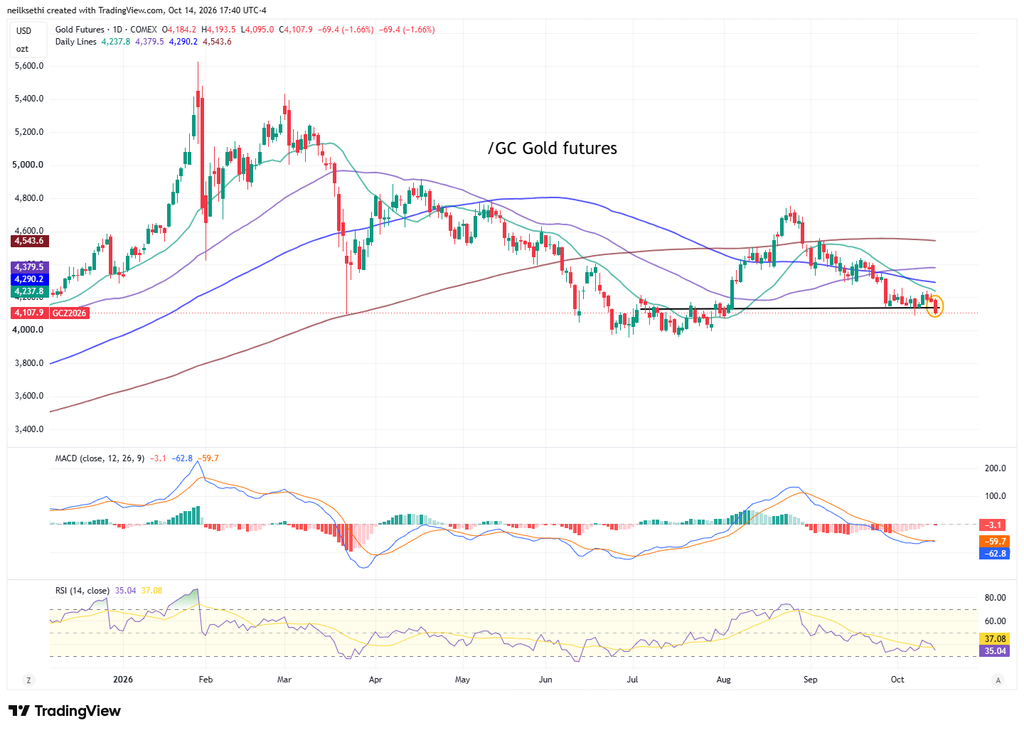
Gold futures (/GC) fell back under support to the lowest close since August 3rd. The daily MACD remains negative (but still very close to crossing positive) and the RSI is under 40.
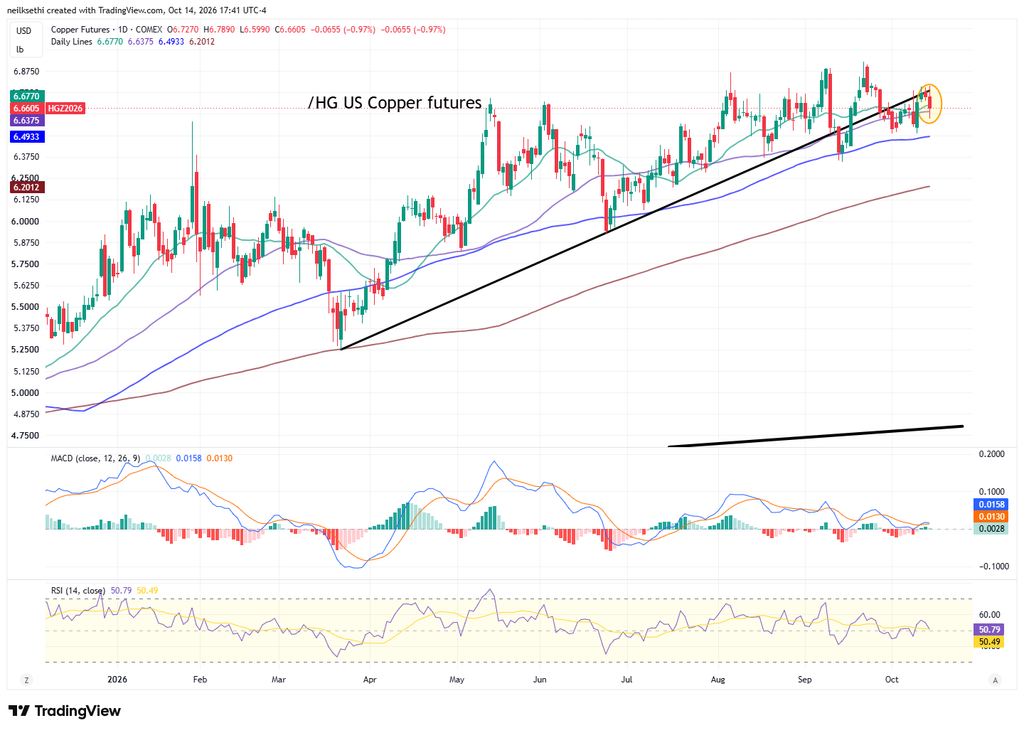
US copper futures (/HG) fell back along with the AI-trade although I’m surprised it didn’t lose more. Overall still remains range bound. Daily MACD and RSI slightly positive.
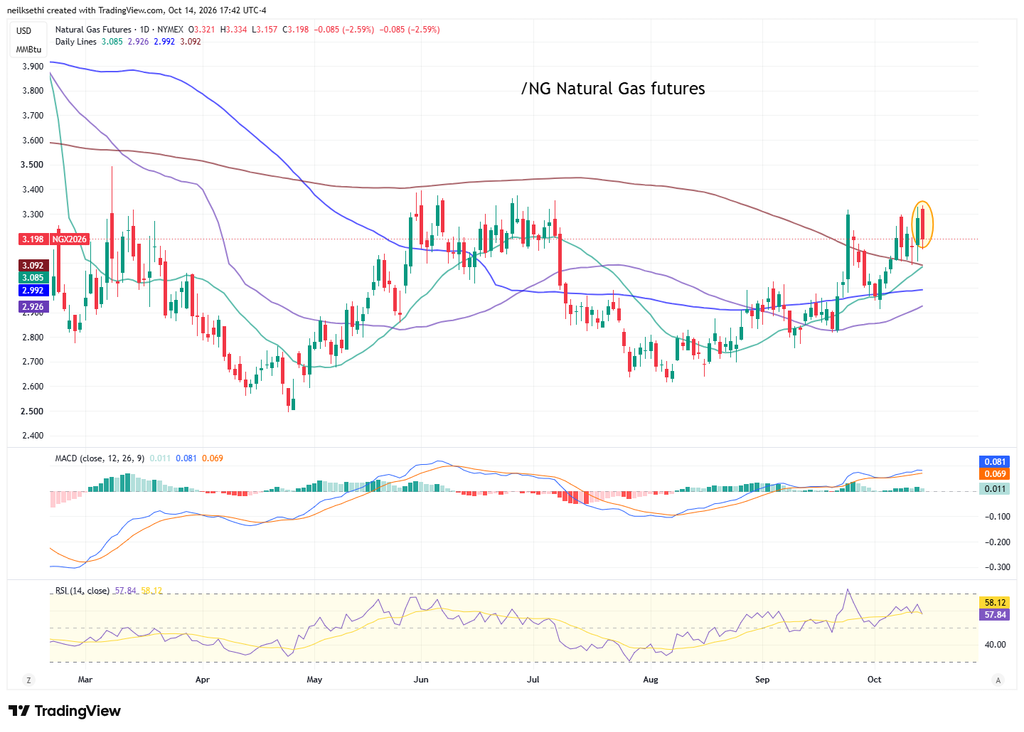
US natural gas futures (/NG) fell back from around four month highs. They remain towards the top of their range since March. As mentioned Tuesday, “They do have positive technicals, so if they get over the $3.40 area they could run.”
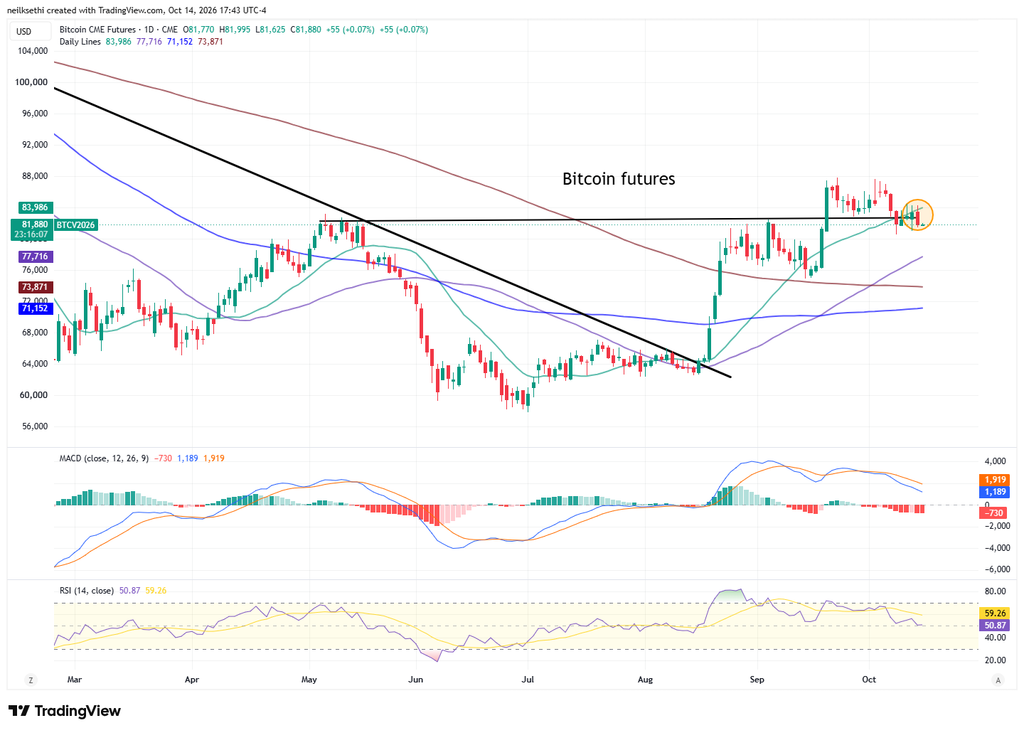
Bitcoin futures, like gold, fell back under support. They’re very close to hitting my stop. Daily MACD still negative, although the RSI still holds just above 50.
A benign print that keeps yields easing gives the broadening room to run even if Tech takes a breather, and with the bond market primed for the short-covering rally I’ve been waiting for, the impact of a cool print could extend well beyond a session or two. A hot print, on the other hand, likely puts an October rate hike back on the table and probably sends yields to new highs.
And after a hot print, I got the October rate hike part right, and early on it looked like I’d get the yields part right too. But as mentioned earlier, long duration yields slowly gave up their gains during the session to end lower. I don’t have a great explanation, but it does bolster my case that we are past or near a short-term peak for yields.
And while it was definitely a “hot” print (and the Beige Book also provided plenty of ammunition to the hawks), it wasn’t quite hot enough to tip the scales to an October hike, and it surprisingly did little in terms of 2027 rate hike expectations. We’ll get PPI tomorrow, which we’ve seen in the past move markets due to its read-through to PCE prices, the Fed’s preferred inflation metric, so I don’t want to say too much more until we get that along with retail sales.
One thing to keep in mind though is that even if CPI and PPI are enough to move the dial on some Fed members, there’s only Bowman tonight and then Hammack tomorrow on the calendar before we get Warsh right before the blackout. So if the consensus has shifted it will primarily be up to Warsh to communicate that, as I’ll talk more about tomorrow.
But all of that aside, I have to get back to the elephant in the room — the continued implosion of the AI trade this week. I have mentioned previously we’ve seen this sort of thing in the past several years, and I expect this time to be no different, at least as it comes to the leaders. But perhaps we might get more separation of the wheat from the chaff. The market seems to have woken up to the fact that beyond Oracle (ORCL) there are major fundamental differences between the business models and balance sheets in many of these players.
So while I do think we’ll get back on track with the AI trade at some point, I do think we could continue to see pressure on the weaker players similar to what we’ve seen with Oracle since concerns over its balance sheet and business model surfaced last year.
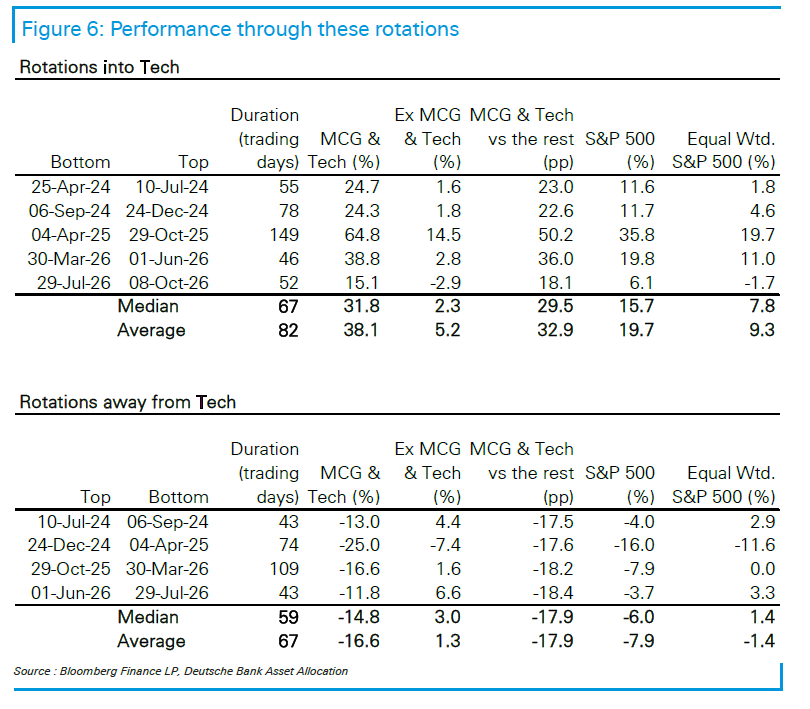
When does the overall AI trade get back on track? With no crystal ball, I continue to think Deutsche Bank’s analysis is as good as anyone’s:
I went through on Sunday my concerns about the Tech trade. It was lengthy, so I won’t revisit that all here, but it was in part based on the analysis of Deutsche Bank’s equity team, who as I mentioned has “called the past year as good as anyone”.
My takeaway was: “I remain hopeful that Tech can get it back into gear, but it does seem we’re due for a rotation out of Tech, and those have lasted over a month since mid-2024. So if they’re right, the answer is no, Tech and non-Tech will not rise together.”
Again, we need to get through tomorrow’s economic data (and then Warsh on Thursday night). So, as always, let’s see what we get.
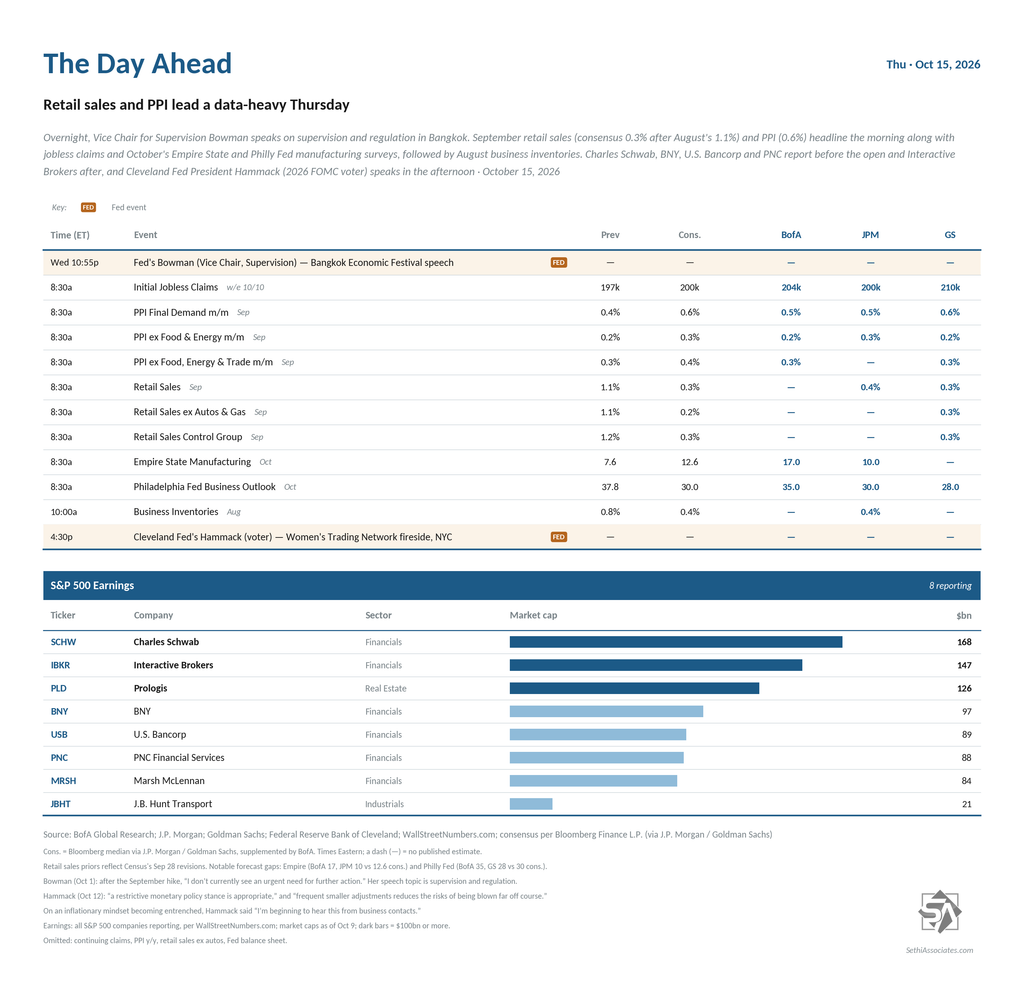
The Day Ahead – Retail Sales & More Inflation Data
US economic data gives us two more of the week’s highlights in September retail sales and producer prices (PPI). We’ll also get the October Empire State and Philly Fed manufacturing surveys, August business inventories and weekly unemployment claims.
Fed speakers tomorrow limited to Cleveland Fed President Hammack (a 2026 FOMC voter) in her second appearance of the week. We will also get Governor Bowman later tonight from Bangkok. While we will get Chair Warsh Thursday, it won’t be until after 11pm Eastern so I’ll talk more about that tomorrow.
No non-Bill (>1yr in maturity) US Treasury auctions this week.
Q3 earnings season continues with eight S&P 500 components: Charles Schwab (SCHW), Interactive Brokers (IBKR), Prologis (PLD), BNY (BNY), U.S. Bancorp (USB), PNC Financial Services (PNC), Marsh McLennan (MRSH) and J.B. Hunt Transport (JBHT). We’ll also hear from Taiwan Semiconductor Manufacturing (TSM).
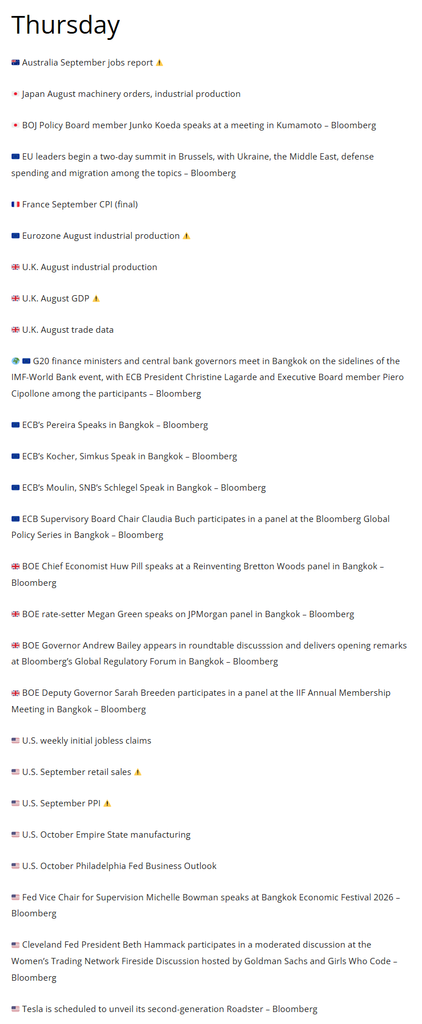
Ex-US highlights include UK August monthly GDP, Japan August core machine orders and industrial production/capacity utilization, Italy August general government debt, Eurozone August industrial production, Canada August manufacturing sales, and Australia’s September labor force survey. EU leaders also begin a two-day summit in Brussels and G20 finance ministers and central bank governors will meet in Bangkok on the sidelines of the IMF-World Bank event.
At the time of publication, in terms of equities mentioned, Sethi was long CVX, XOM, BRK.B, ORCL, SKYD, QQQ, SPY, RSP, CPER, IBIT and numerous equities in the energy sector.
As a reminder comments are encouraged. If they are directed at me, please put @NeilSethi in front.
$CRWV "The AI cloud-computing provider’s unsecured debt due in 2032 traded below 80 cents on the dollar on Wednesday, according to Trace pricing data. That’s widely considered the threshold for when a borrower is financially strained."
At that price, the bonds yield more thanShow more
CoreWeave’s bonds have plunged to levels that typically indicate distress, in a swift move that has caught the attention of Silicon Valley leaders including Chamath Palihapitiya and Elon Musk bloomberg.com/news/articles/…
If you missed it, there was a lot of chatter yesterday about Harley Bassman (@ConvexityMaven), the inventor of the MOVE index of Treasury market volatility, warning about a hidden accelerant in the Treasury selloff that could send yields sharply higher.
@C_Barraud’s alwaysShow more
⚠ Wednesday Brief ⚠️
🇺🇲 Focus on U.S. CPI
🇺🇲 U.S. House #Democrats Plan a First 100-days Agenda
🇨🇳 #China High-#Tech Exports Explode
🇪🇺 #ECB Not Seeing Second-Round Inflation Effects
...
christophe-barraud.com/morning-brief-…
Eight of 11 S&P 500 sector indexes are up this year, led by a 42% jump in energy and a 32% surge in technology. However, because of its sheer size, technology is responsible for over 10 percentage points of the S&P 500's approximately 14% gain this year, while the energyShow more
Yardeni: Since the start of the current bull market four years ago only two of the S&P 500's 11 sectors have outperformed the index: Information Technology (258.1%) and Communication Services (196.7%).
The others posted reasonably strong bull-market returns. Keep in mind thatShow more
"The contract rate on a 30-year fixed mortgage ticked up 1 basis point to 7.50% in the week ended Oct. 9, still the highest level since November 2023, according to Mortgage Bankers Association data released Wednesday. Rates are up nearly 1 percentage point since the end of June.Show more
BofA’s Michael Hartnett says fund managers are waiting for yields of about 6% “before flipping from stocks to bonds.”
The October Global Fund Manager Survey puts the average 10-year Treasury yield that would trigger the switch at 5.9%, about 70 basis points above currentShow more
Preliminary weekly hiring report from ADP for the four weeks ending September 26th fell for the first time since early August, but very slightly and only after an upward revision to the prior week.
At +99k (+24.75k/wk), it was otherwise the best since June 6th, and the 4-weekShow more
Mike Zaccardi, CFA, CMT 🍖
@MikeZaccardi
Another week of improved ADP weekly jobs numbers... pacing for a bit above 100k/mo