If We Want a Lasting Rally, the SOX May Need to Fall Some More
It comes down to sentiment, which remains complacent. A little bit of fear would help provide the fuel needed to get stocks moving higher.
You've reached your free article limit
You've read 0 of 1 free Pro articles.

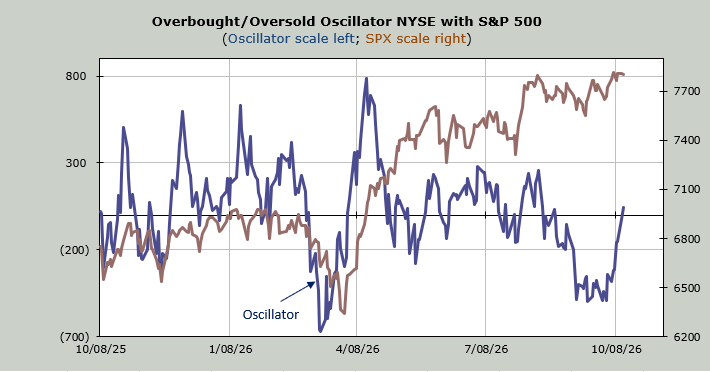
Would you be surprised to know that breadth on the NYSE has been positive for six of the last ten trading days? How about if I told you that net volume (up minus down) on the NYSE has been positive for seven of the last ten trading days?
But wait, there’s more! The equal-weight S&P has been up eight of the last nine trading days too. And despite the Russell 2000 toying with its recent lows, which also coincides with the 200-day moving average line, the number of stocks making new lows on the NYSE was a rather subdued 180 on Tuesday. As a reminder, on September 28th that number was 447.
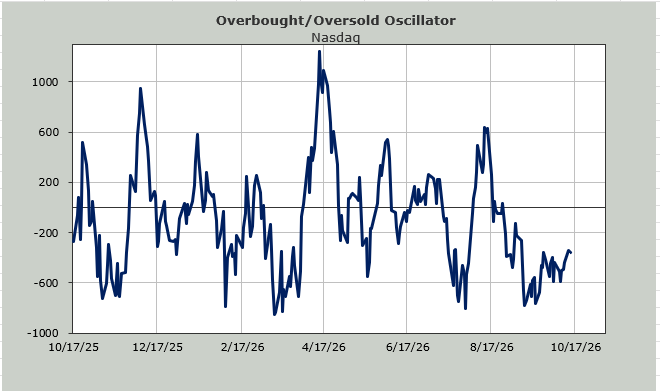
What does this all mean? It means the selling has abated. The relentless selling that began mid-August and continued through late September has worn itself out. That doesn’t mean there is a whole lot of interest in buying.
We discussed this quite frequently prior to my departure for vacation. Oversold markets are great, but they do not rally the same as oversold markets with bearish sentiment. And we remain in a market that is complacent.
But let’s take a look at the ten-day moving average of the put/call ratio. It has lifted quite a bit off that low reading just over .80 in late September, as it is now at .85. It doesn’t show any significant fear, but it has seen a pick-up in the moving average, with more puts being traded.
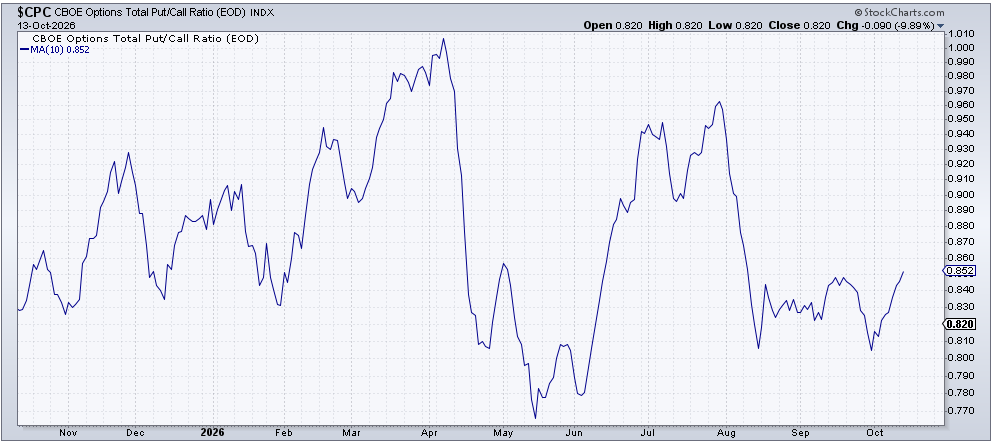
Now I’d like you to take a look at a chart of the SOX. Sure, we can note that while the RSP has been green for so many days, the SOX has been red for five straight days (the ETF, SMH, has been red for six straight days). First, that means the Either/Or Market continues to be with us. But do you notice that when the SOX peaked in June, the put/call ratio’s ten-day moving average was at the bottom of the page?
And do you notice that when the SOX bottomed in late July, this indicator was at the top of the page? So now take a look at the moving average of the put/call ratio again and see how it bottomed as the SOX peaked heading into October.
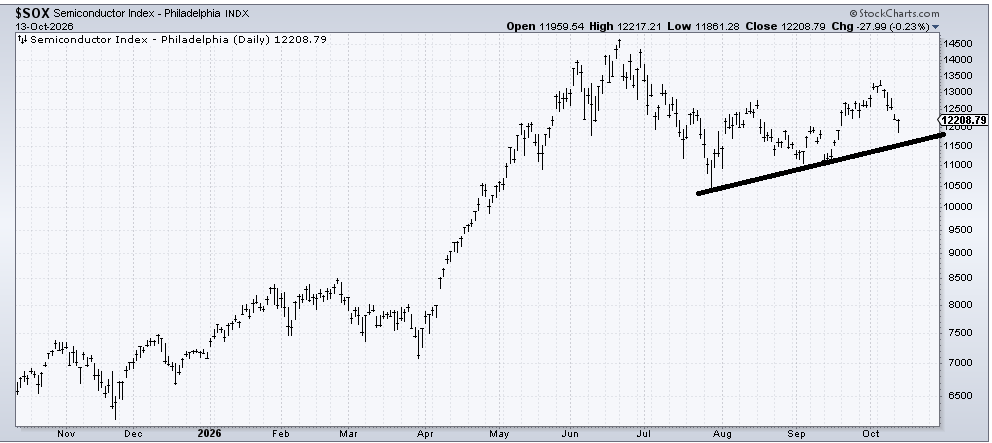
The others, much as we can try and trade them, do not control sentiment. If they did, that put/call ratio would be flying off the top of the page considering what those stocks have done in the last two months. I am convinced that the only thing that will change sentiment to be less complacent and more bearish is if the SOX goes down some more.
In the meantime, my guess is that after so many red days, the SOX gets a short-term bounce, but the resistance at 12,500 looms overhead.