Stocks spent most of the Tuesday session in the red, trading in a narrow range, pressured by a tepid investor reception to earnings from a number of big banks as well as continued weakness in memory chipmakers. Strength in the Magnificent 7, which collectively hit an all-time high, kept losses in check.
The S&P 500 finished flat, the Nasdaq slipped 0.2%, and the Dow Jones Industrial Average and Russell 2000 each fell 0.4%.
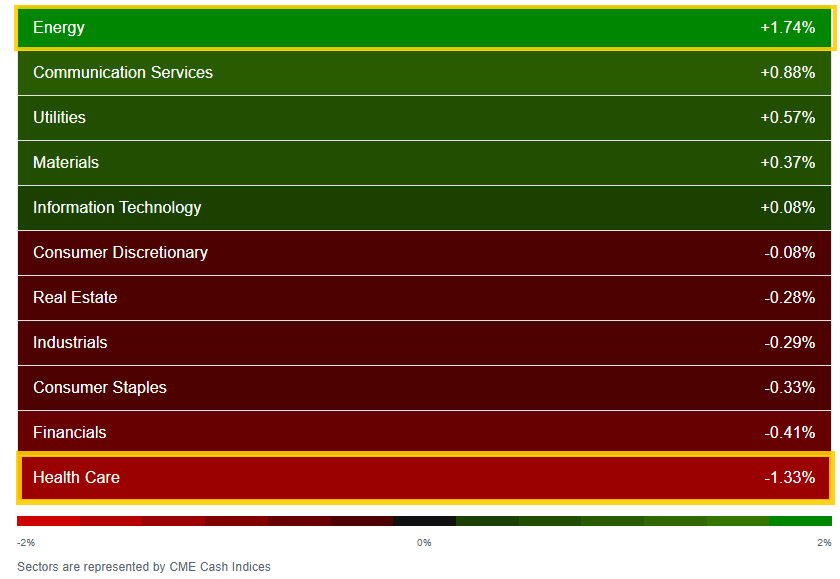
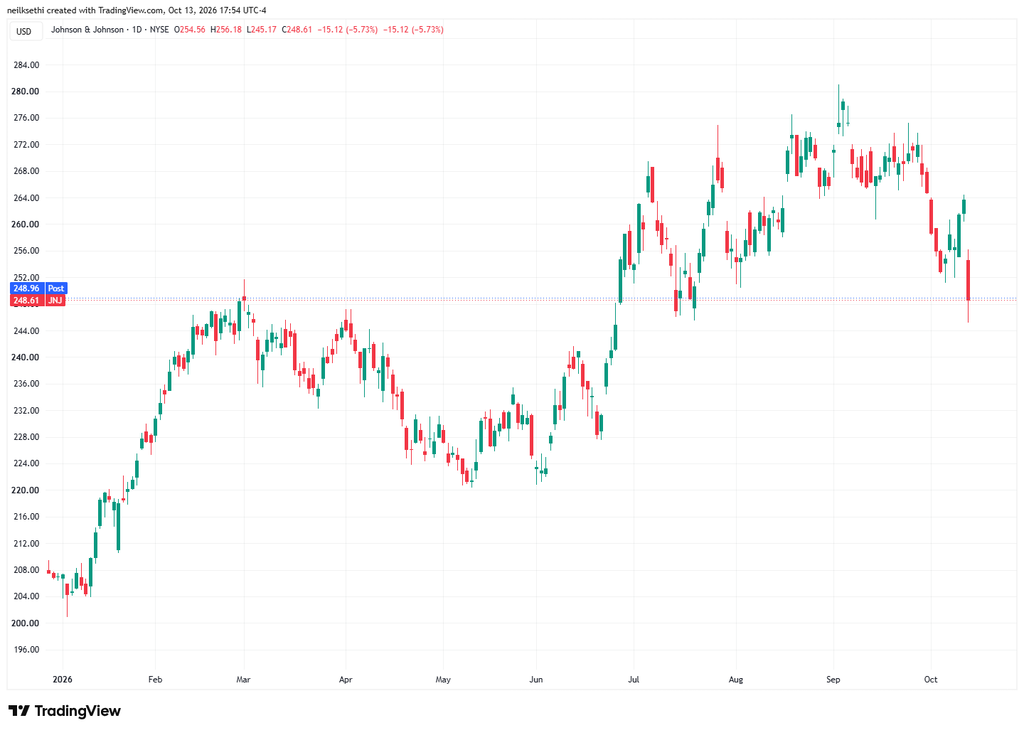
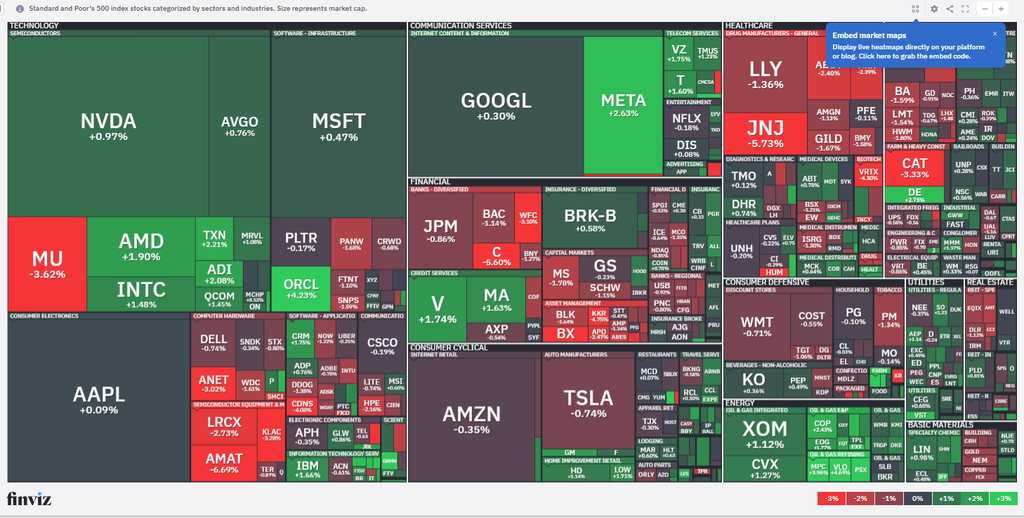
Breadth eased to 5 of 11 sectors higher (according to CME futures). Energy (+1.7%) was the only sector up more than 1%, led by refiners, with Valero Energy (VLO) hitting a record high. Health Care (-1.3%) was the worst sector in the S&P 500 after Johnson & Johnson (JNJ) fell 5.7% on disappointing MedTech growth.
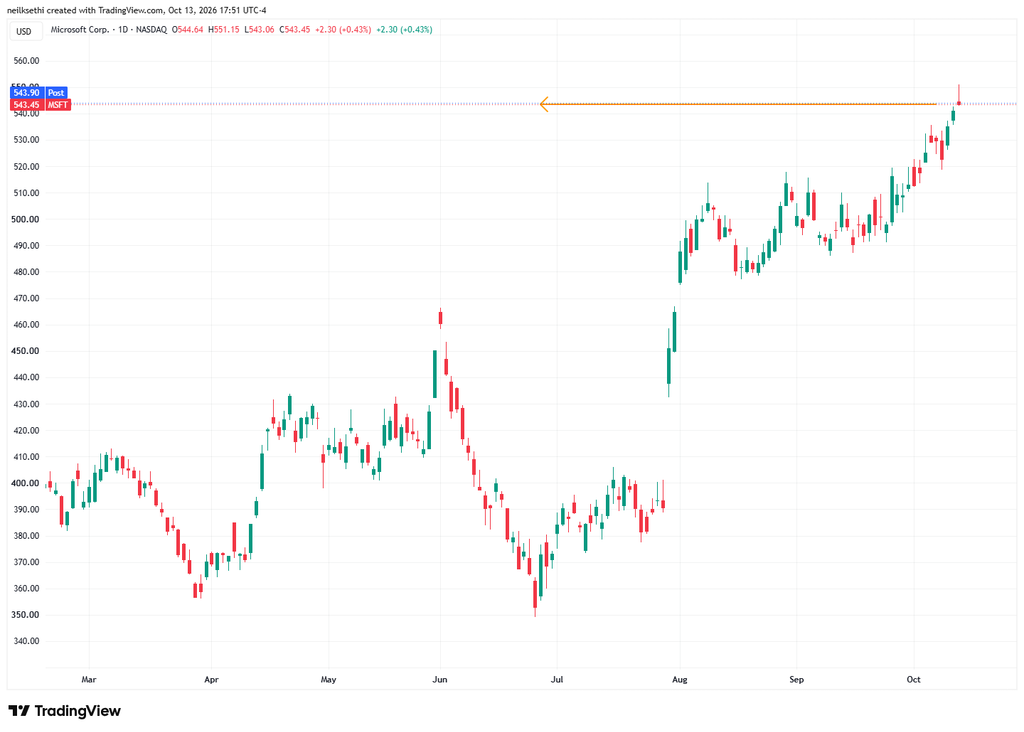
The PHLX Semiconductor Index (SOX) fell as much as 3.1% early after South Korea’s Kospi sank 5.5% overnight on memory-chip concerns, but a late rebound cut the loss to just 0.2%. Tech eked out a 0.1% gain, though, on the Magnificent 7 strength as Microsoft (MSFT) hit a record.
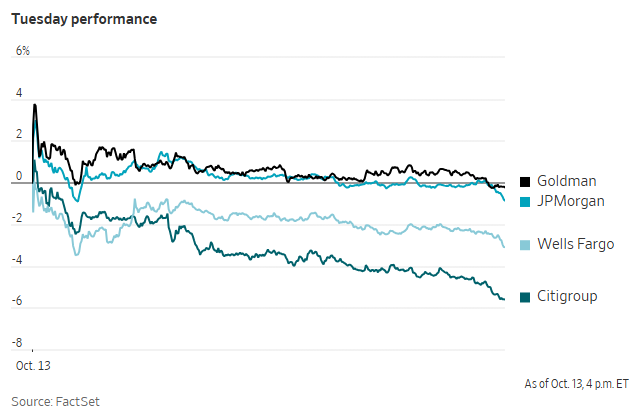
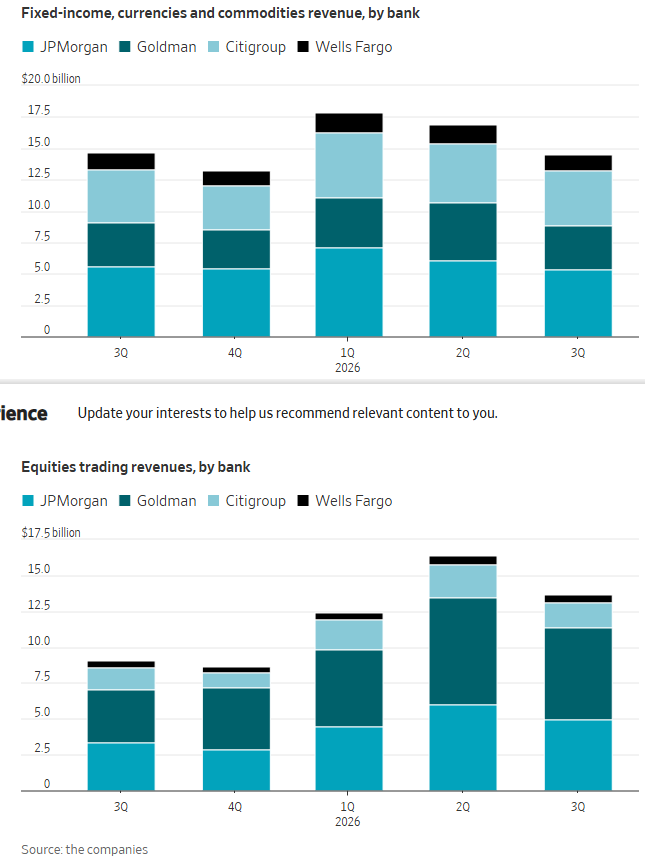
Earnings season opened with JPMorgan Chase (JPM), Goldman Sachs (GS), Wells Fargo (WFC), and Citigroup (C) all reporting higher profits, but all four still finished lower, led by Citi (-5.6%) and Wells Fargo (-3.1%).
Longer dated Treasury yields eased, with the 10-year down 2bp to 5.22% in the cash session. New York Fed President Williams told Bloomberg that one more hike may be appropriate this year, but he doesn’t currently see a need for more after that.
Existing home sales beat expectations, but the National Association of Realtors noted that those sales reflected contracts signed when mortgage rates were much lower saying there could be a “material” drop in future months, while NFIB small business optimism slipped to a three-month low as fewer small business owners expected conditions to improve.
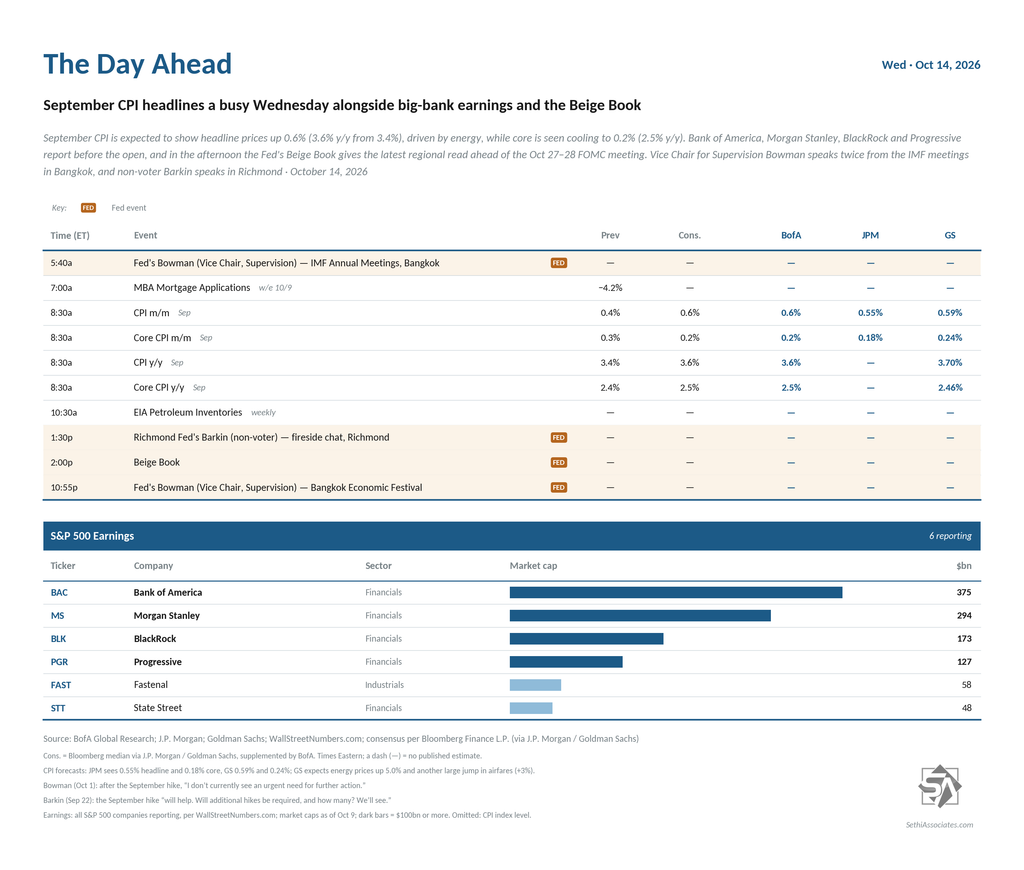
Wednesday is headlined by September CPI, the Fed’s Beige Book, and earnings from Bank of America (BAC) and Morgan Stanley (MS).
Schwab
Market Commentary
Equities:
“Mag 7 is the last cohort of stocks that are important to the SPX that hasn’t shown any weakness,” said Jonathan Krinsky, chief market technician at BTIG Research. “It’s also the group that is the most widely owned right now for their perceived safety to rates and geopolitical risk.”
“These banks still reported strong numbers, it’s just that expectations were high, and higher expectations is a risk for companies across the board during this current earnings season,” said Rebecca Walser, chief investment officer at Walser Wealth Management.
CPI:
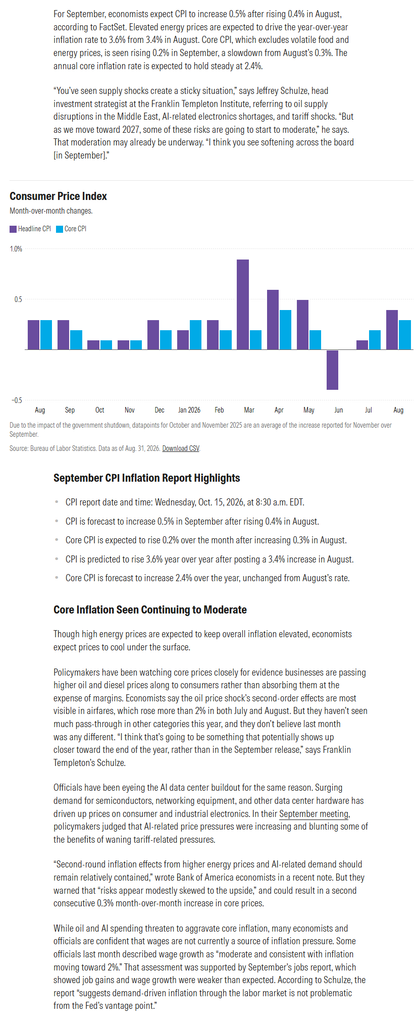
“Headline inflation is obviously going to be higher, with energy prices driving that,” said Tony Rodriguez, head of fixed-income strategy at Nuveen. “We’re not seeing that kind of pressure flow through the core inflation yet, but the concern is just if this really drags on for another two quarters, then you start to see the pass-through into all kinds of things like food and goods prices,” he told MarketWatch via phone on Tuesday.
“Confirmation that underlying inflation moderated last month would allow the Fed to approach the timing of its next rate hike with patience rather than urgency,” said Ian Lyngen at BMO Capital Markets.
Stock and Sector Breakdown:
Sector breadth eased back to 5 of 11 sectors higher. Energy again led but this time was the only sector finishing over 1%, although again just one megacap growth sector in the top four (as on Monday Communications — there hasn’t been more than one of Consumer Discretionary, Communications, and/or Tech in the top four in those seven sessions).
Keeping the selloff contained superheavyweight Tech was +0.1%, even as semiconductors were weak (more below on that). Health Care led to the downside -1.3% led by weakness in Johnson & Johnson.
[chart uses futures prices]
Schwab
The VanEck Semiconductor ETF(SMH) was down for a sixth session, its longest losing streak since May 2025, down over 7% over that time. For the bulls, the last such streak was just a breather before the uptrend resumed.
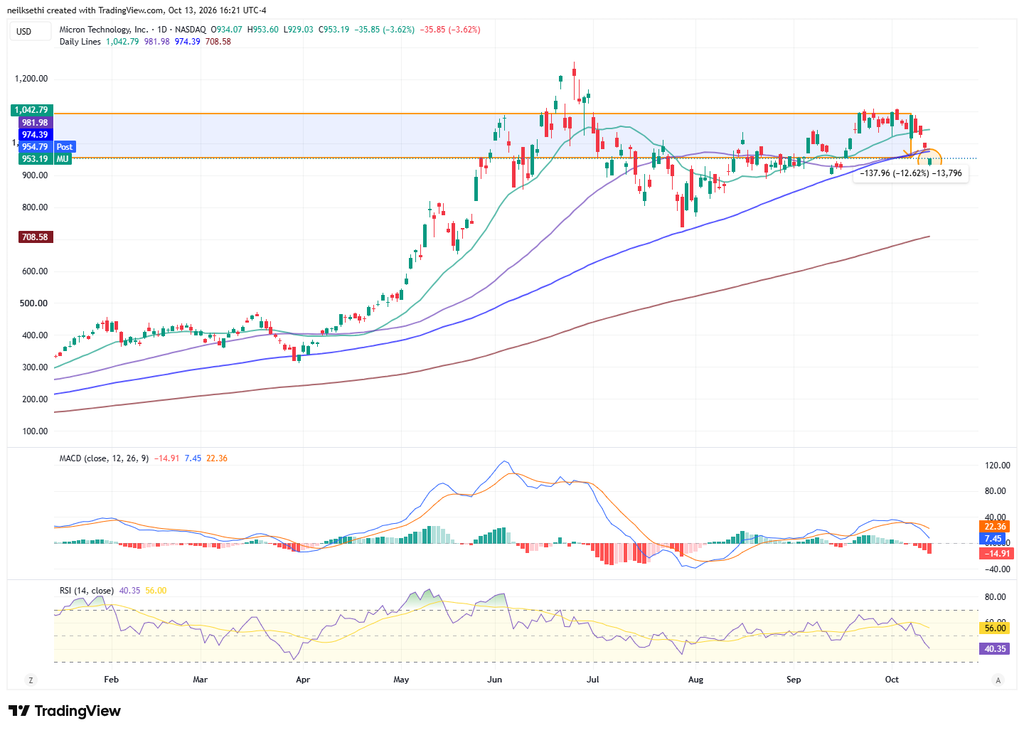
Weakness continued to be led by memory names, with Micron (MU) falling another 3.6%, taking its losses over the past four sessions to over 12%. It also fell beneath the 50- and 100-day moving averages, so I did exit my position as I indicated yesterday. On this topic, see Alex Frew McMillan’s piece, Here’s Why the Simple Explanation for the Chip Selloff Makes No Sense.
But it wasn’t just memory names, with chip-equipment maker Applied Materials (AMAT) falling 6.7%, the worst performer in the S&P 500, even as its CEO said it expects to double revenue over the next few years in a Bloomberg interview. Chris Versace gave his take on the firm’s investor breakfast at SEMICON West today for TheStreet Pro.
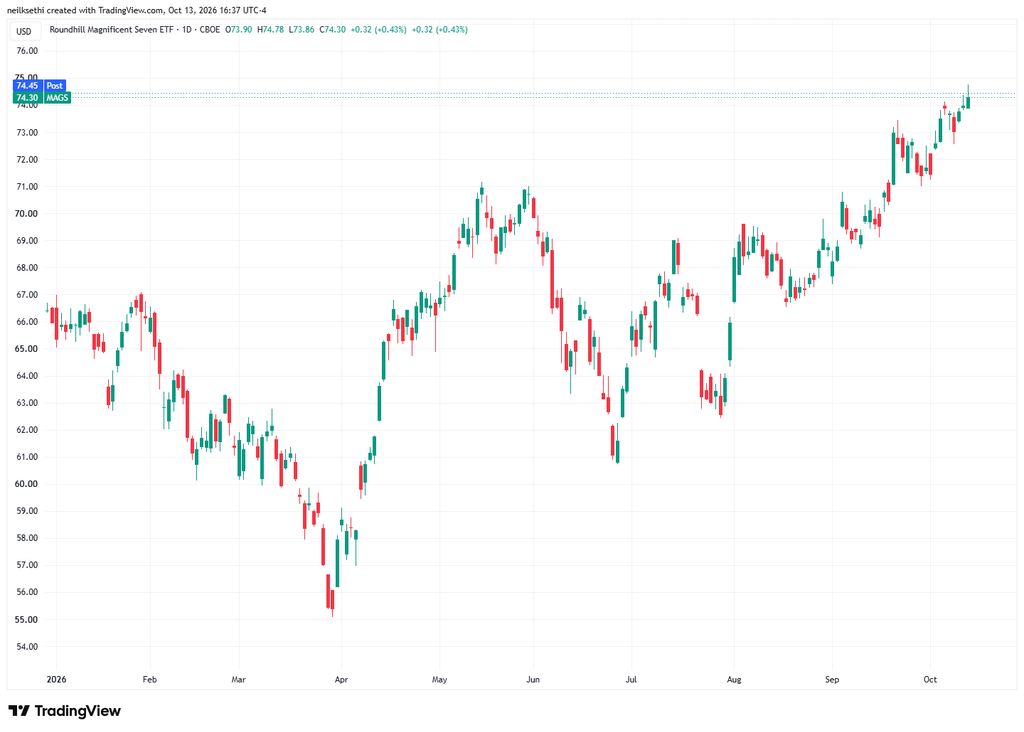
Offsetting the semiconductor weakness was relative strength in the Magnificent 7 group of companies. The Roundhill Magnificent Seven ETF (MAGS) was up 0.4% to a record high.
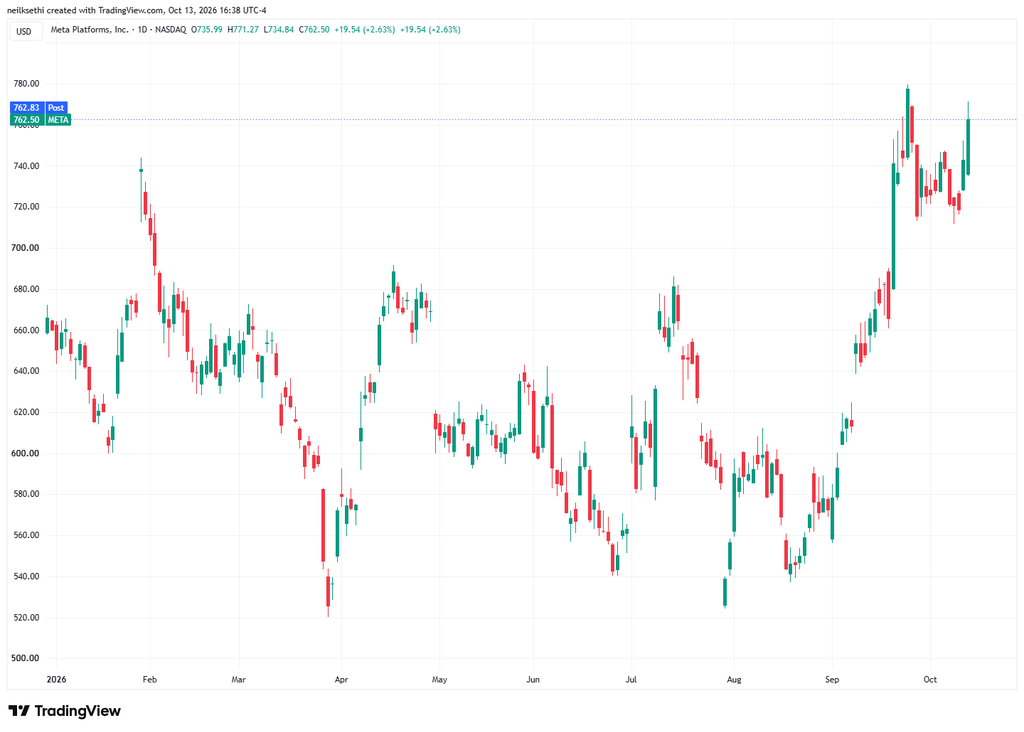
The top gainer in the Mag-7 was Meta Platforms (META), which added another 2.6%, taking it back up towards its all-time high from last month.
Microsoft (MSFT) added 0.4%, taking it to another all-time high.
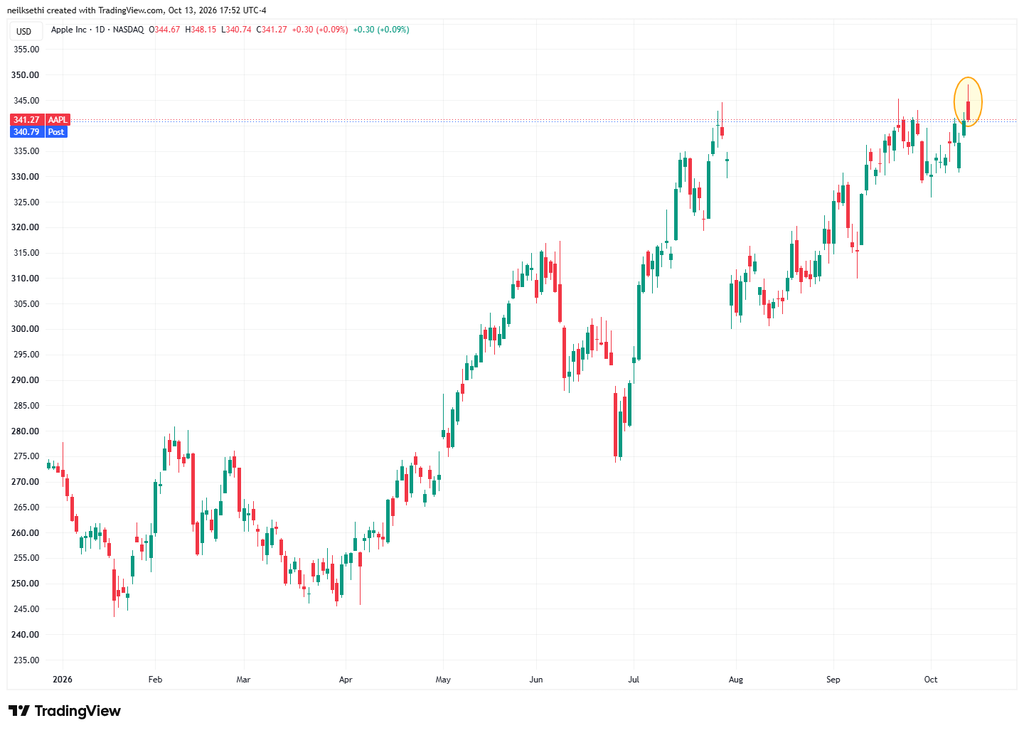
Apple (AAPL) +0.1% also closed around its all-time closing high, although down from much higher levels during the session after its “Welcome Home” event on Tuesday morning. See Chris Versace’s takeaways: Apple’s Smart Home Update Brings 2 Real Barometers to Watch.
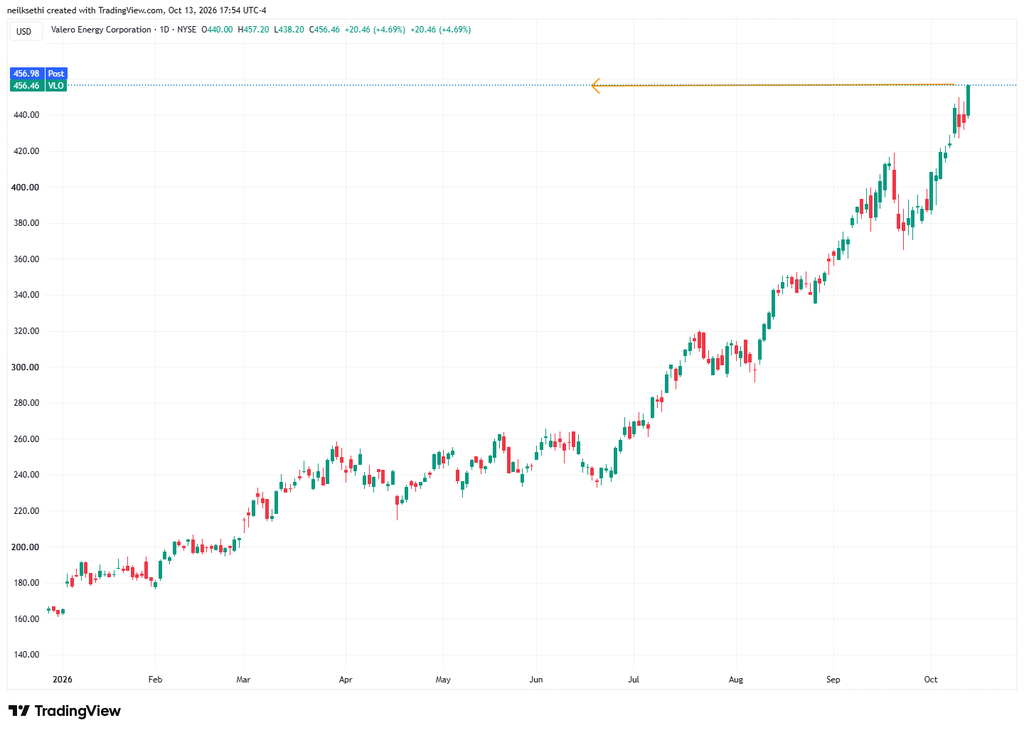
Refiners also had a strong session, helping to power the Energy sector. Valero Energy (VLO) +4.7% was the second-strongest performer in the S&P 500, reaching fresh record highs.
The biggest gainer on the S&P 500 was CDW Corporation (CDW) +5.7% on no apparent news.
Financials, meanwhile, were weighed down by the big banks, with the State Street SPDR Bank ETF (KBE) falling 0.7%. JPMorgan (JPM) and Goldman Sachs (GS) saw mild losses, but Citigroup (C) fell nearly 6% and Wells Fargo (WFC) over 3% as they unofficially kicked off Q3 earnings season. Citi was the third-worst performer in the S&P 500. For more on the bank earnings, see my post below and Chris Versace’s JPMorgan, Goldman Kick Off Bank Earnings with Equities Stealing the Show.
Wall Street Journal
As noted Johnson & Johnson (JNJ) dragged the Health Care sector lower as the bellwether’s shares dropped nearly 6% after the company’s earnings report. “We are clear on where MedTech performance needs to improve,” said J&J’s chief financial officer Joe Wolk on the earnings call, citing its cardiovascular and surgery units. Its $16.6 billion acquisition of heart-pump maker Abiomed has been a drag. JNJ was the second worst performer in the S&P 500.
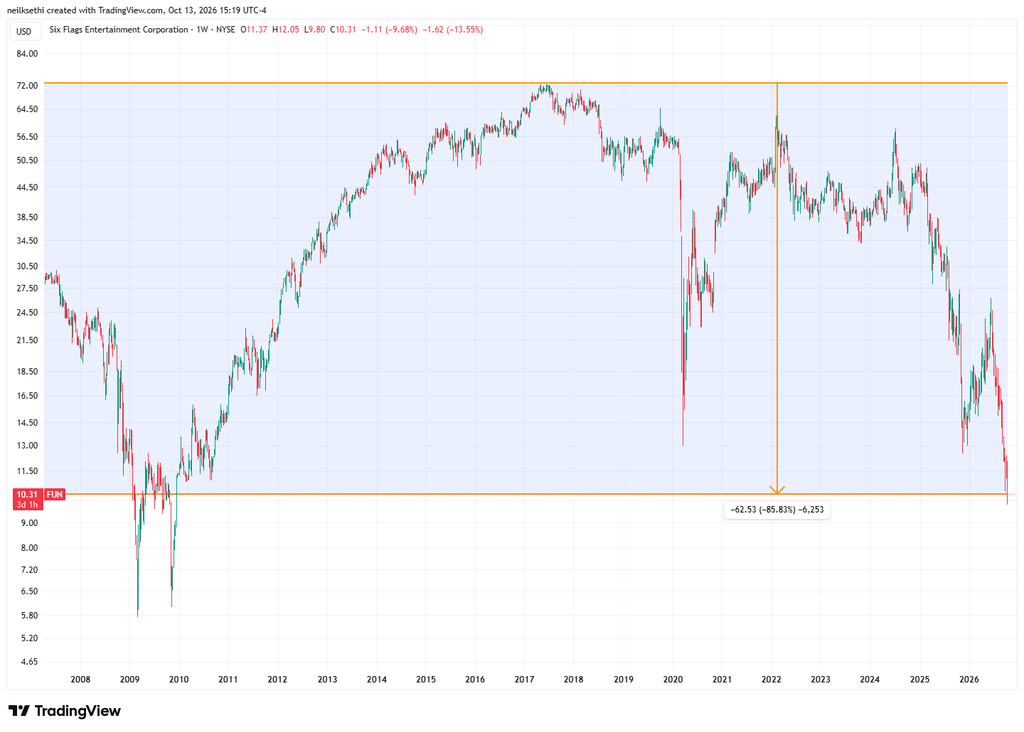
Shares of amusement park operator Six Flags Entertainment (FUN) fell around 13% following a fatal incident on one of the company’s roller coasters in Georgia. That takes them to their lowest level since 2009, down over 85% from their all-time high in June 2017.
The number of large SPX winners (up over 3%) was little changed at 13 from 10 Monday, while the number of large losers (down over 3%) came in at ~20. As mentioned previously, both of these metrics have remained very (extremely?) subdued since the start of August rarely getting above 50 and only once above 100. Very unusual compared to the past couple of years.
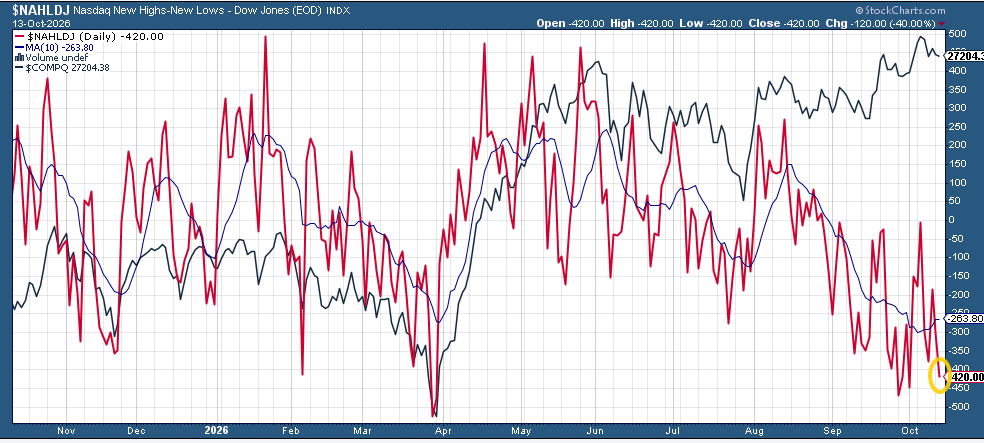
And we did get our 32nd straight session that the Nasdaq saw more new 52-week lows than new highs.
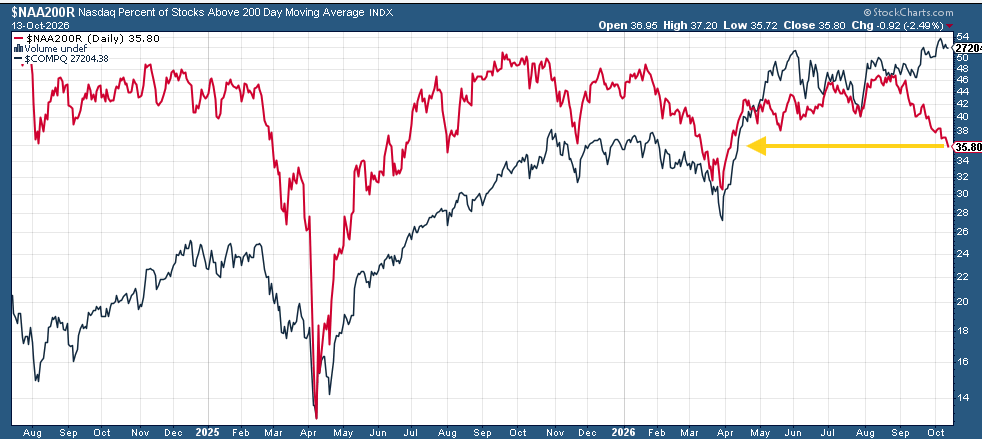
While Nasdaq stocks over their 200-DMAs hit new lows.
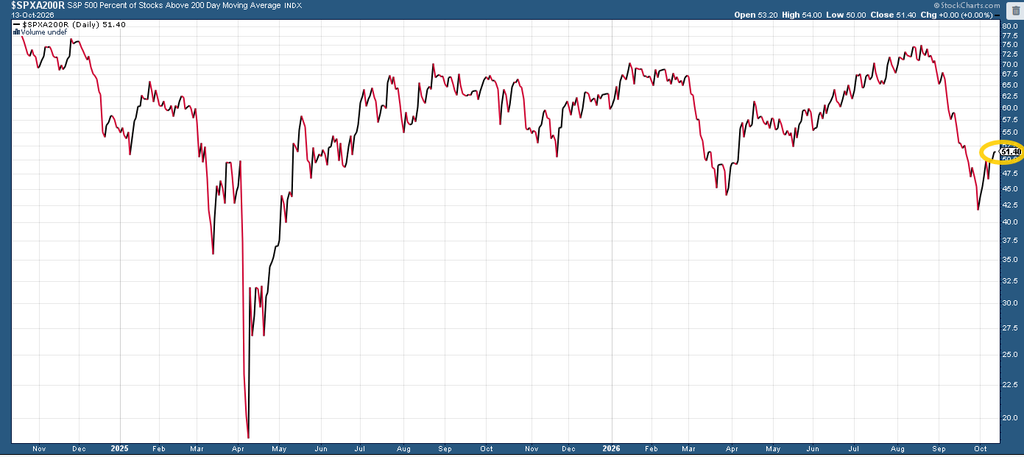
Even as SPX stocks over their 200-DMA got back over 50%.
Some other stock-specific commentary from TheStreet Pro:
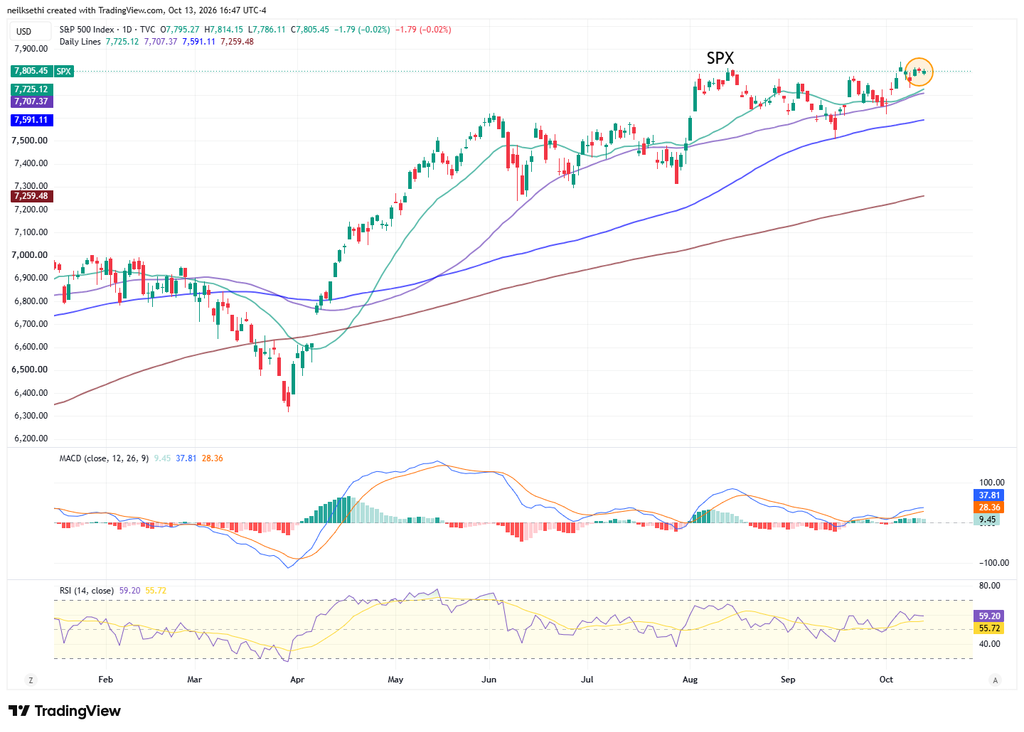
Note on all charts the colored lines are moving averages (the average price over the lookback period — days on the daily charts, weeks on the weekly charts): 20 = green 50 = purple 100 = blue 200 = brown
Exception is monthly charts where blue is 10-month moving average and brown is 20-month moving average.
MACD = Moving average convergence/divergence line, a measure of momentum that compares longer term and shorter term momentum to gauge if a move is strengthening or weakening. This is probably my favorite individual indicator.
RSI = Relative Strength Index (basically what it sounds like) = measures the strength of the move comparing gains to losses over the given lookback window (I use the standard 14 periods).
SPX remains just under its all-time high. The daily MACD and RSI also remain positive, and it is above all moving averages I track.
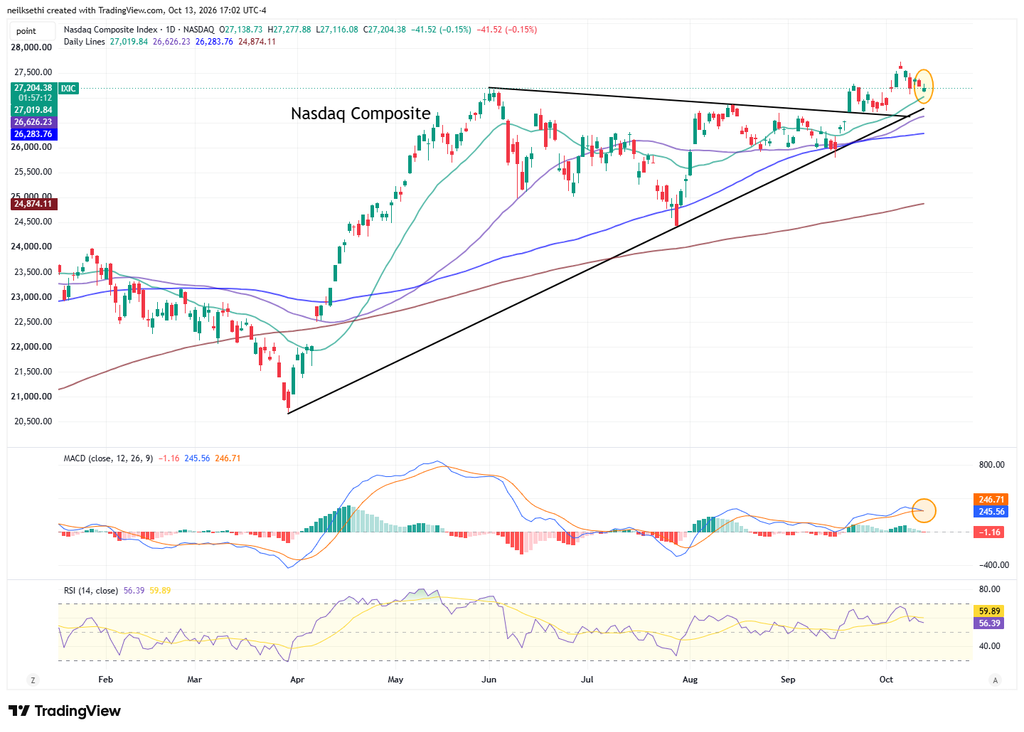
NasdaqComposite a similar story although a little further from its all-time high, and its chart is no longer superior to the SPXwith now a MACD crossover sell signal.
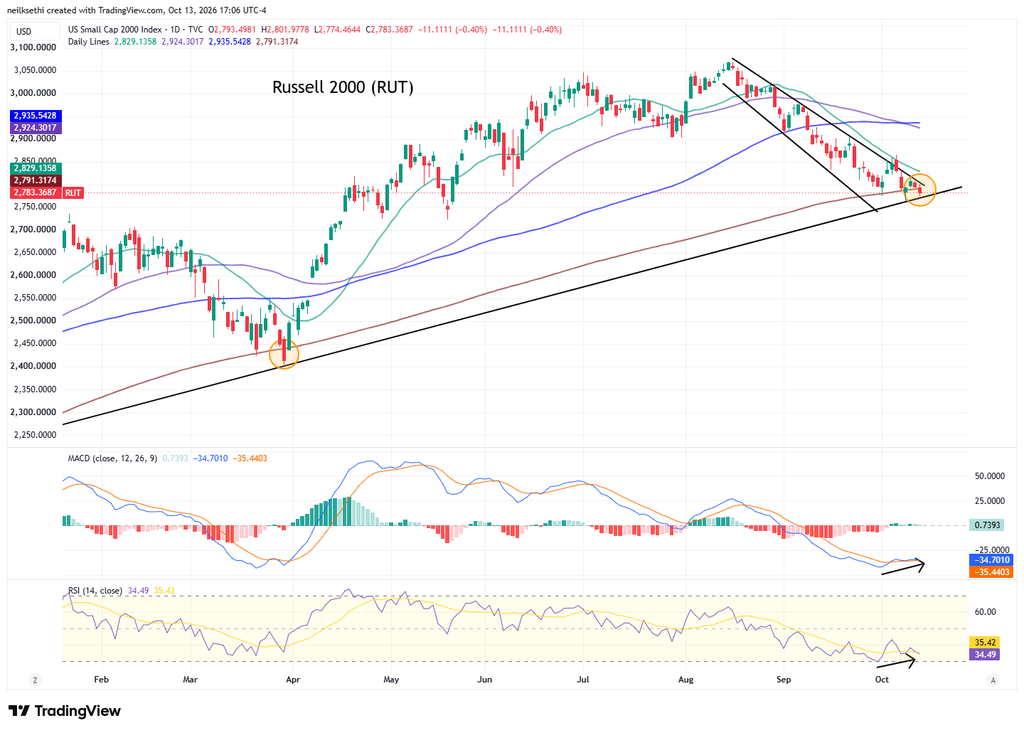
The Russell 2000 (RUT) closed below its 200-DMA for the first time since March. It did hold for now the uptrend line from the April 2025 lows which also held the March decline. Breaking that would be notable and would normally see me put a short on the index, but it has a divergence in the MACD and price that keeps me cautious on doing that.
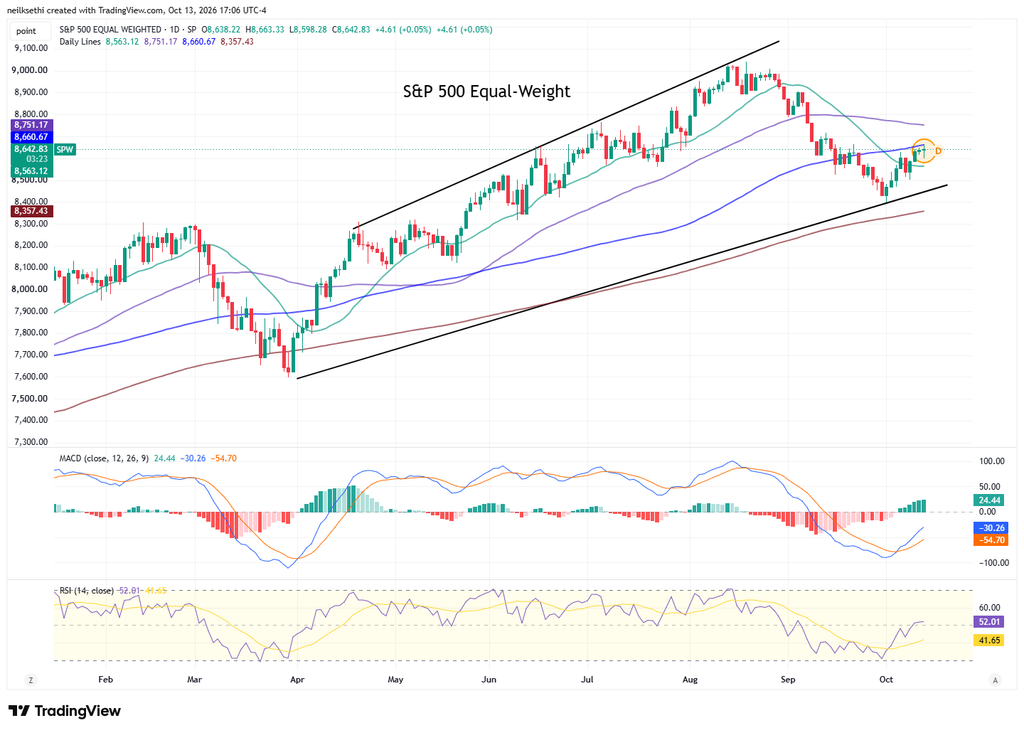
The equal-weighted SPX continues to be capped by the 100-DMA. It has a positive MACD, and the RSI is over 50, so as noted last week “the technicals support a continued move higher.”
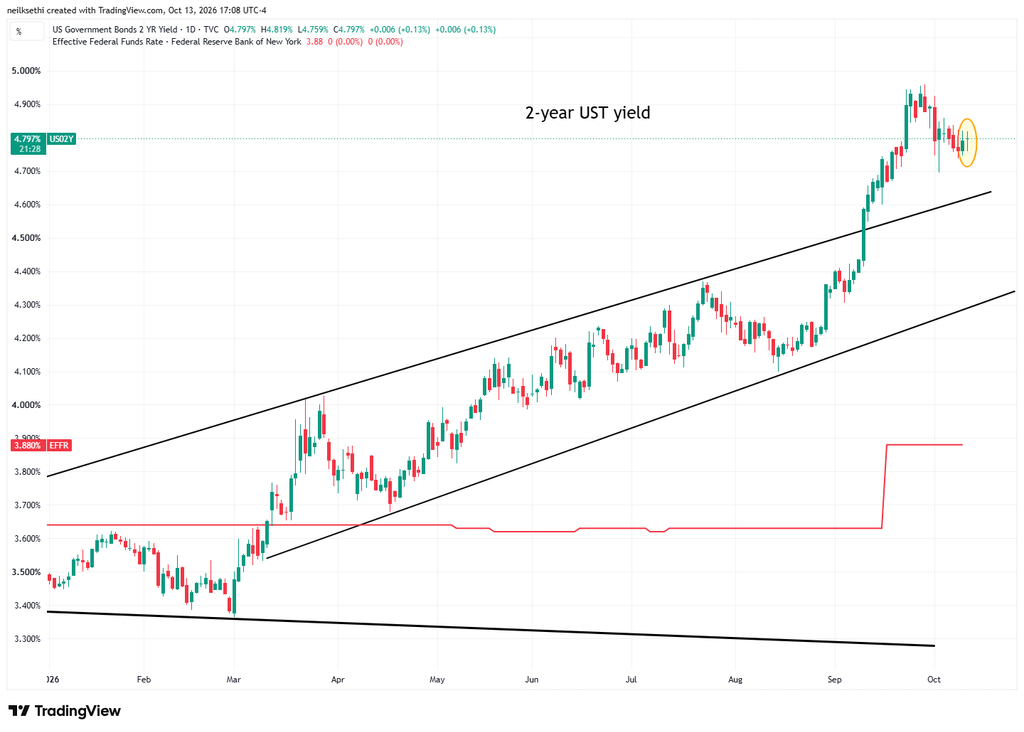
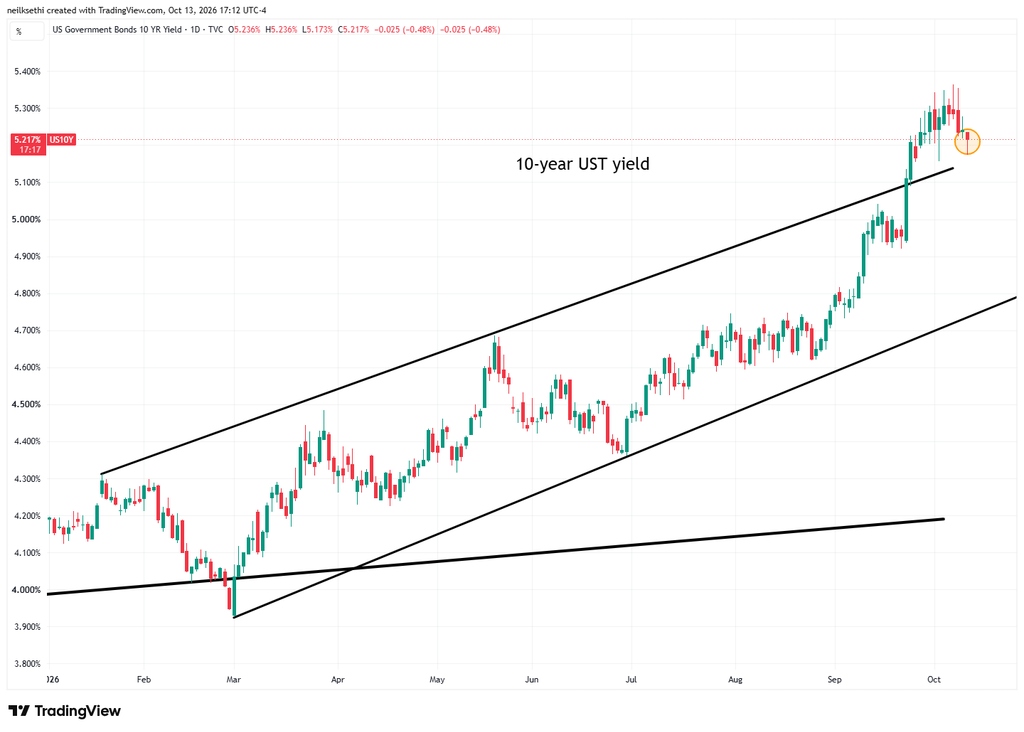
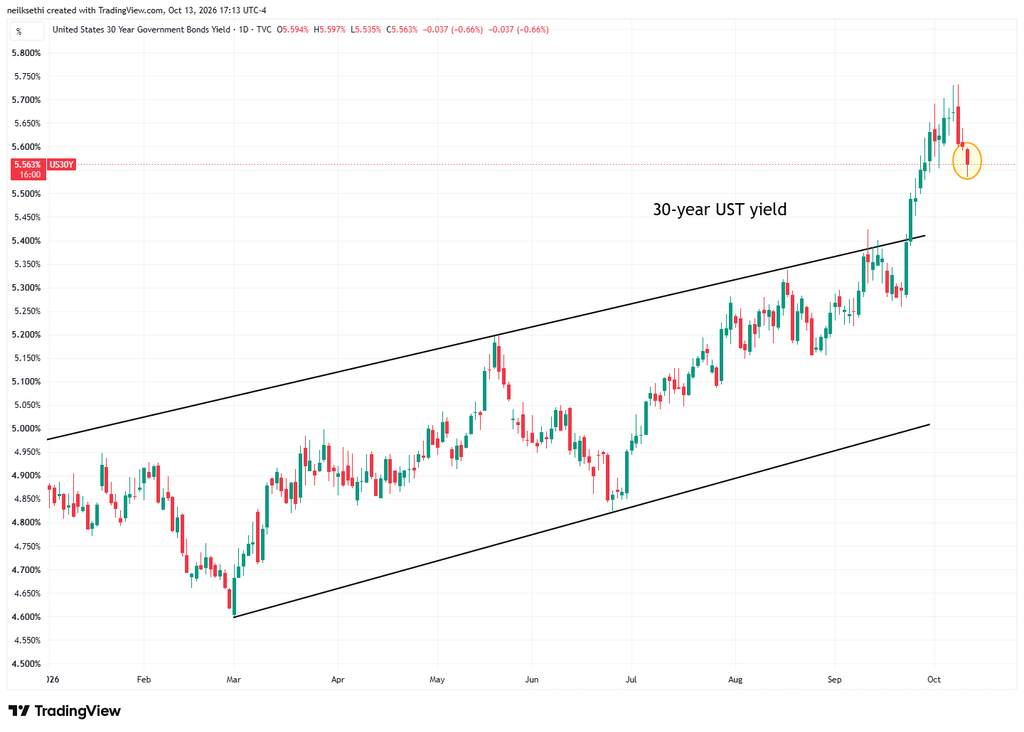
Treasury yields “twisted” with the short end edging higher (despite Fed rate hike expectations easing) while the long end fell.
The 2-year Treasury rose one basis point (including the after-hours).
It is ~92 basis points above the Effective Fed Funds rate, so still calling for (at least a couple) more rate hikes.
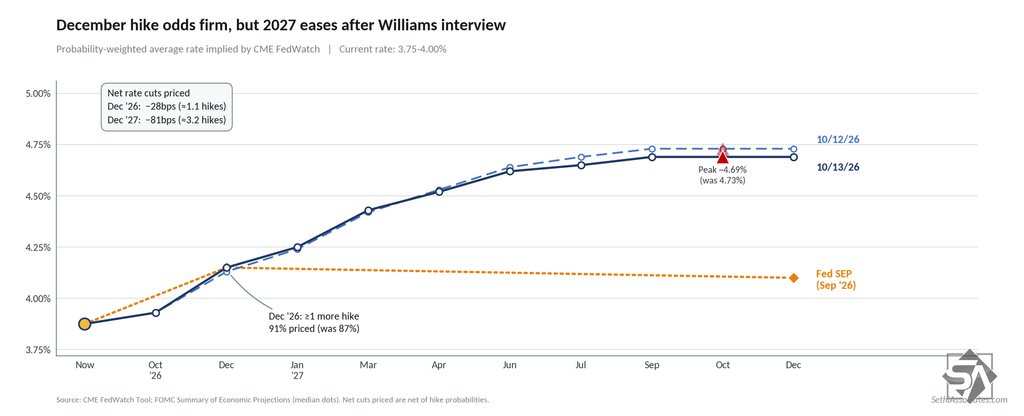
That is even as the CME Fedwatch tool saw 2027 FOMC rate hike expectations fall after NY Fed President Williams in a Bloomberg interview (see post below) said when pressed that his base case was no hikes in 2027 (after one more hike in 2026). That saw 2027 rate hike pricing fall to ~81 basis points of tightening (from ~85) but further firmed a December hike (now 91%).
Here’s more detail on the Williams interview:
10-year yields eased back to 5.22% (including after-hours), the lowest close in two weeks but still just nine basis points from the highest close since 2002 last week.
30-year yields eased four basis points to 5.56% (including after-hours), also a two-week closing low.
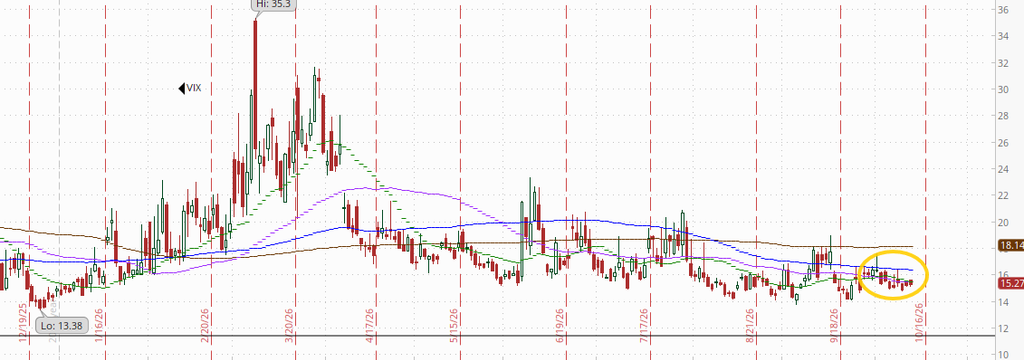
VIX edged up to 15.3. That’s consistent with ~0.96% average daily moves in the SPX over the next 30 days.
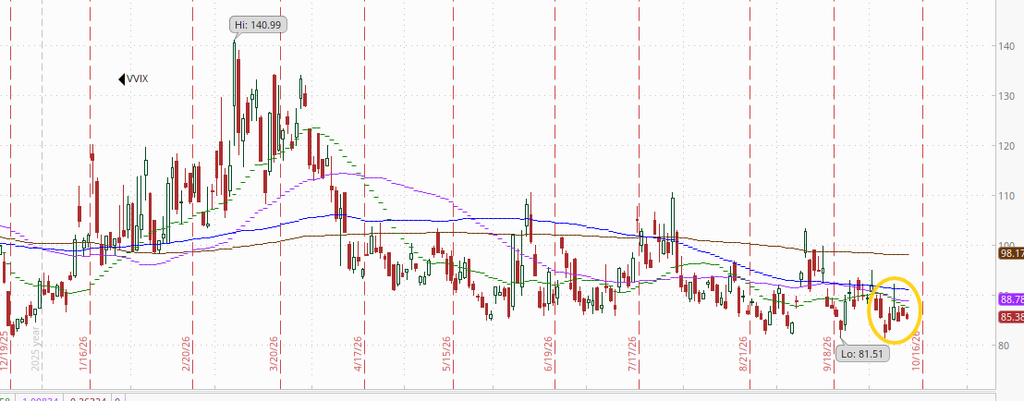
The VVIX (VIX of the VIX) eased to 85.4. The current level is consistent with “moderate” daily moves in the VIX over the next 30 days (historically, normal is 80-100, although we haven’t been below 80 since July 2024). Above 100 is the level flagged by Charlie McElligott as indicating higher stress.
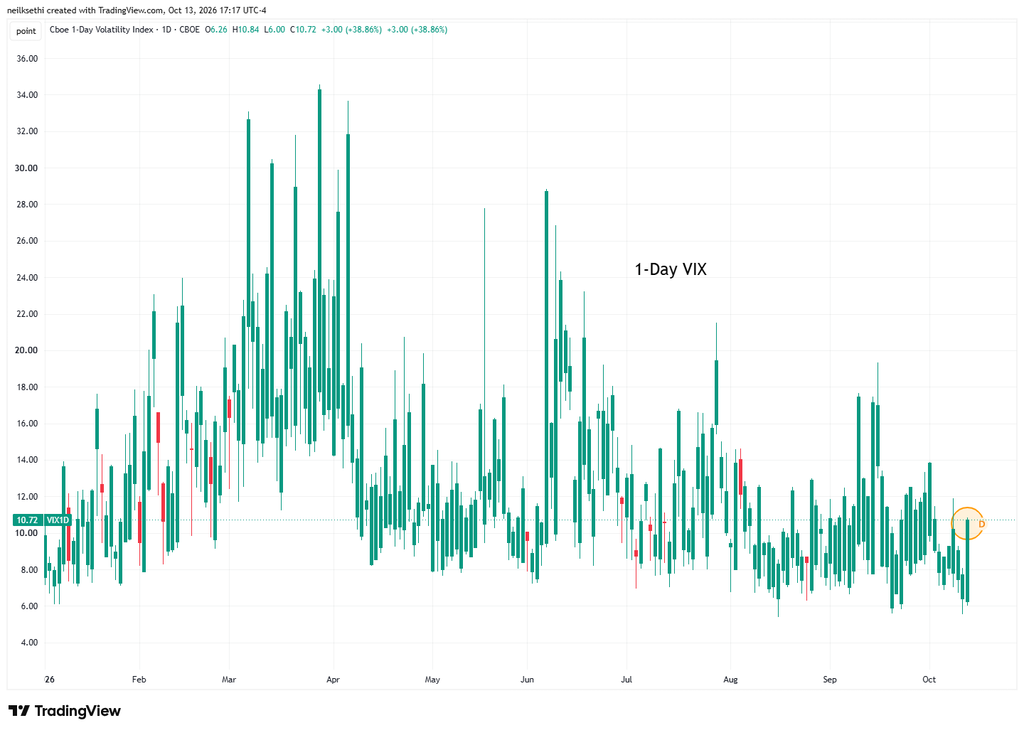
Ahead of CPI, though, the 1-day VIX jumped to 10.7, from the lows of the year. Still for a CPI day that’s pretty tame. The current reading is consistent with a move of just 0.68% in the SPX next session.
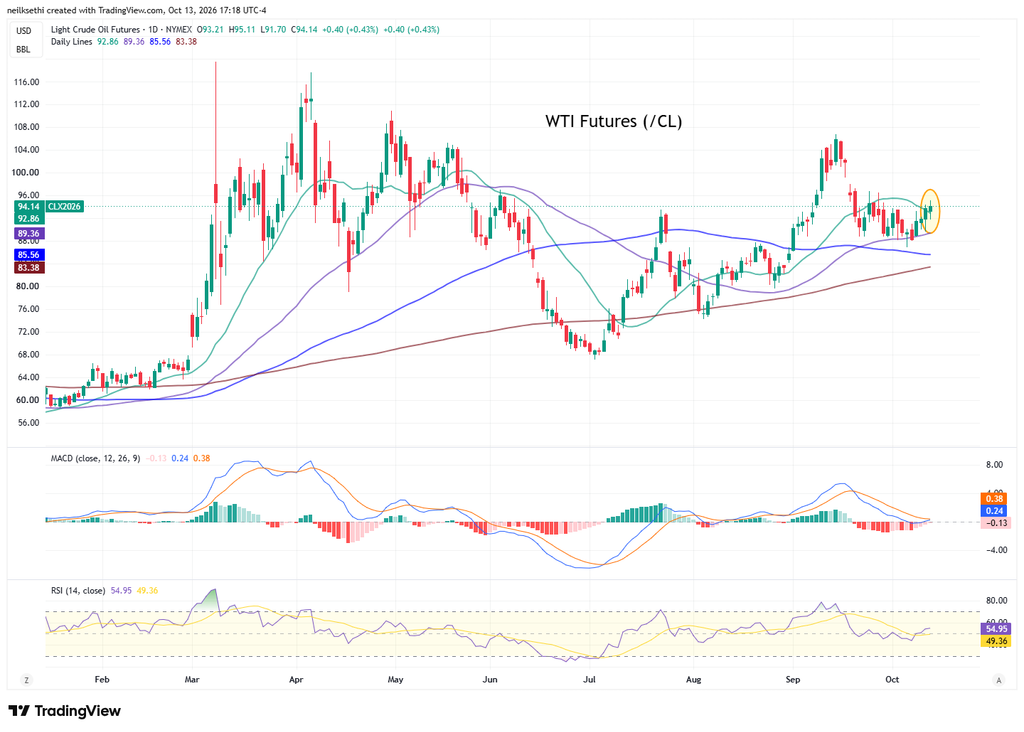
WTI futures (/CL) up for a fourth session to the highest close in three weeks (including after-hours).
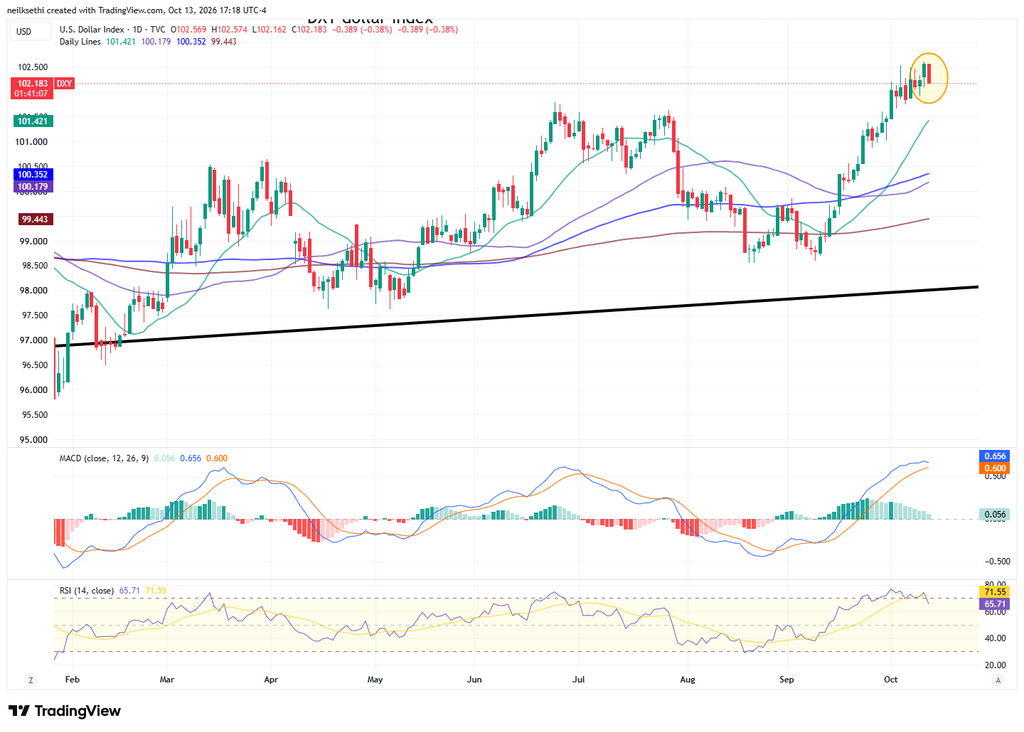
The DXY dollar index (which is fixed weighted with a heavy 57% weighting vs the euro) fell back 0.4% from the highest close since April 2025 Monday.
As I mentioned last month “The daily MACD remains positive and the RSI is above 60 so it continues to have strong technical support.”
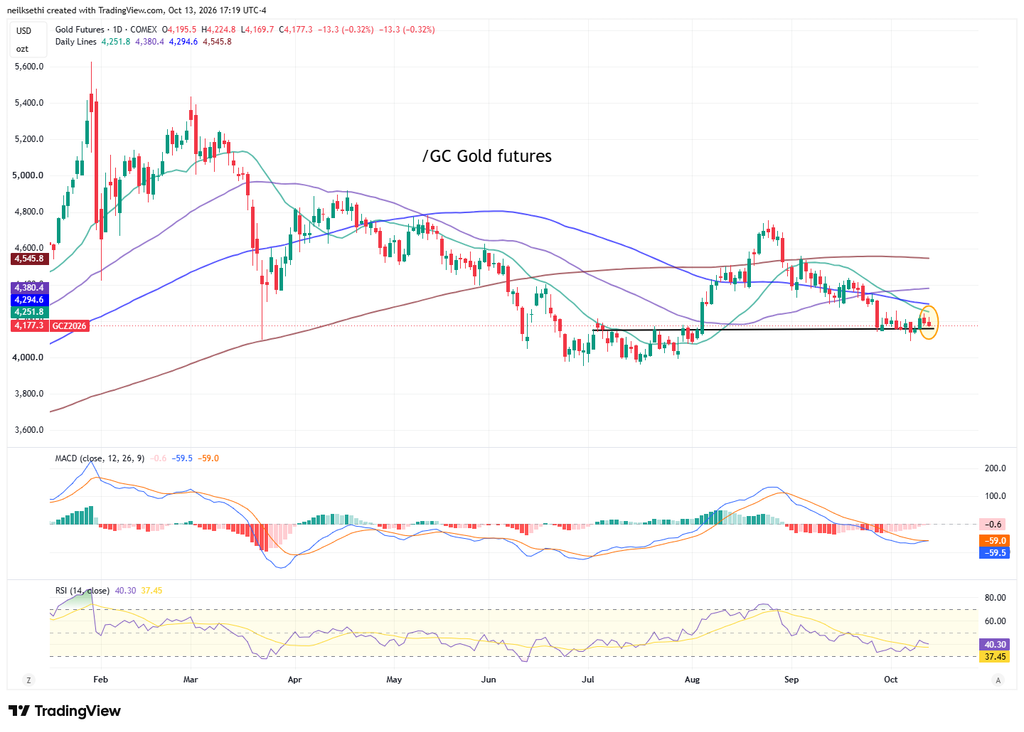
Gold futures (/GC) continue to remain just above support. As mentioned Friday, “still has quite a bit of resistance above, thin margin below.” The daily MACD remains negative (but very close to crossing positive) and the RSI is around 40.
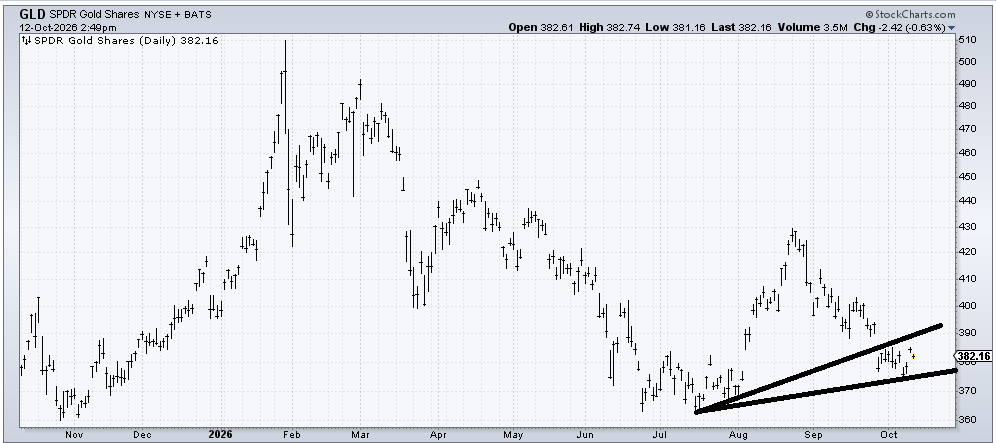
Before I left, I said I thought if GLD held 385 it would be okay. It did not hold. In fact, I think it was the very next day it gapped under. Yet, like a moth to a flame, I am still drawn to it. If it cannot get up and over 390 in the next week or two, I would give up on it.
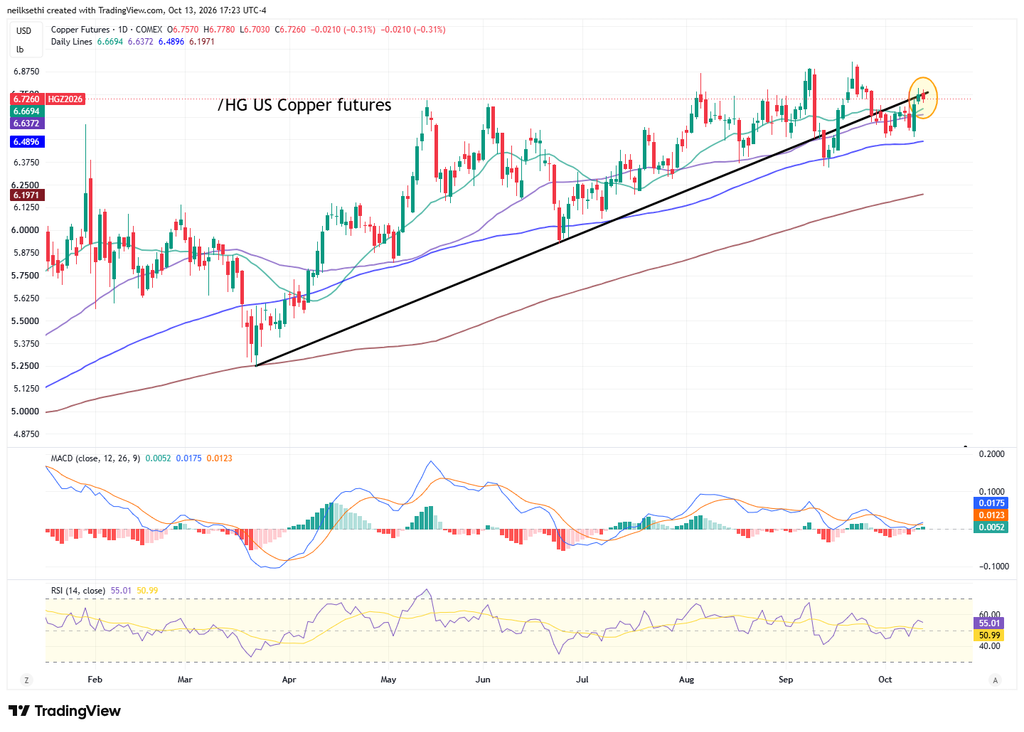
US copper futures (/HG) edged back from 2-week highs, although overall still remaining range bound. Daily MACD and RSI slightly positive.
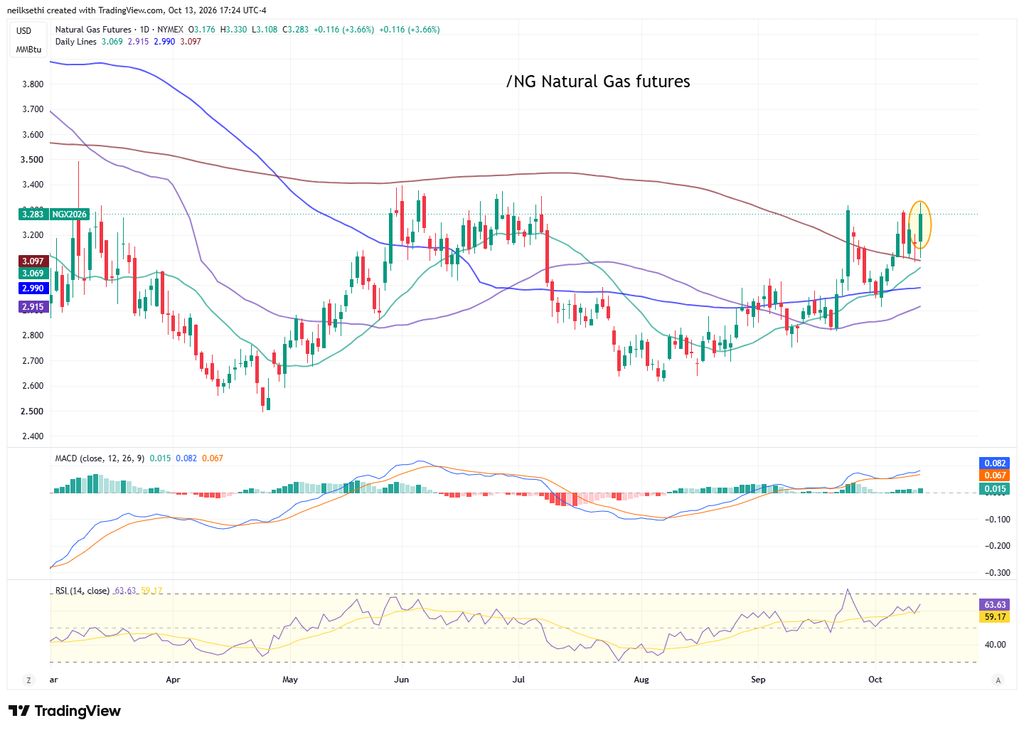
US natural gas futures (/NG) at one point touched four month highs before finishing just below. Back to the top of their range since March. They do have positive technicals, so if they get over the $3.40 area they could run.
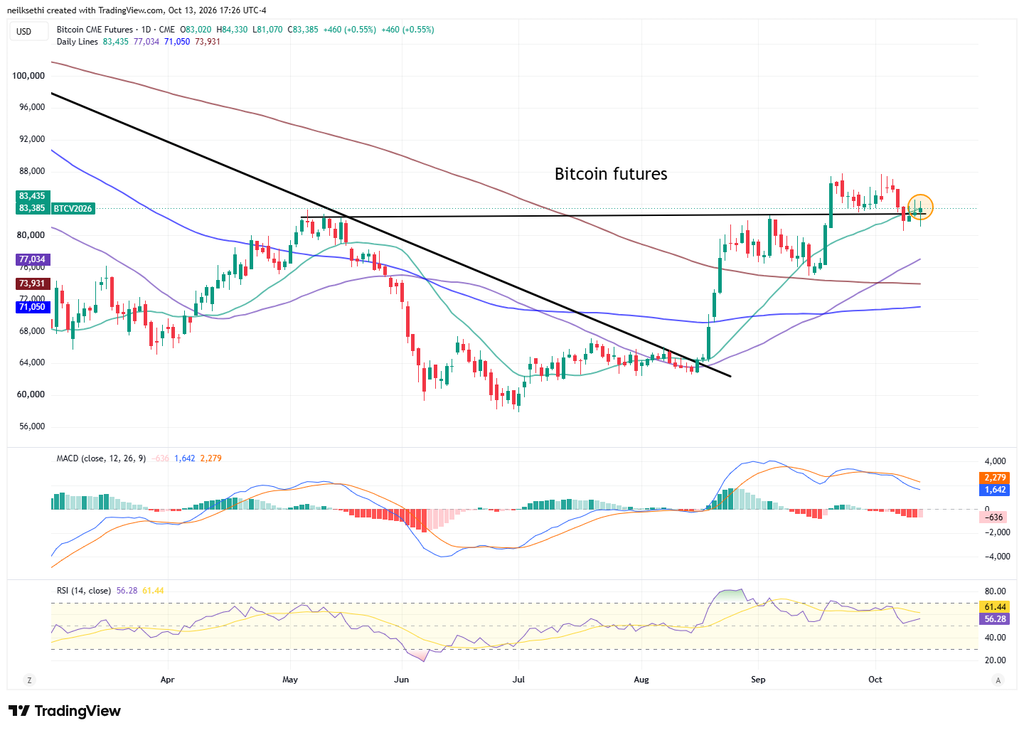
Bitcoin futures, like gold, remain just over support. Daily MACD still negative, although the RSI still holds just above 50.
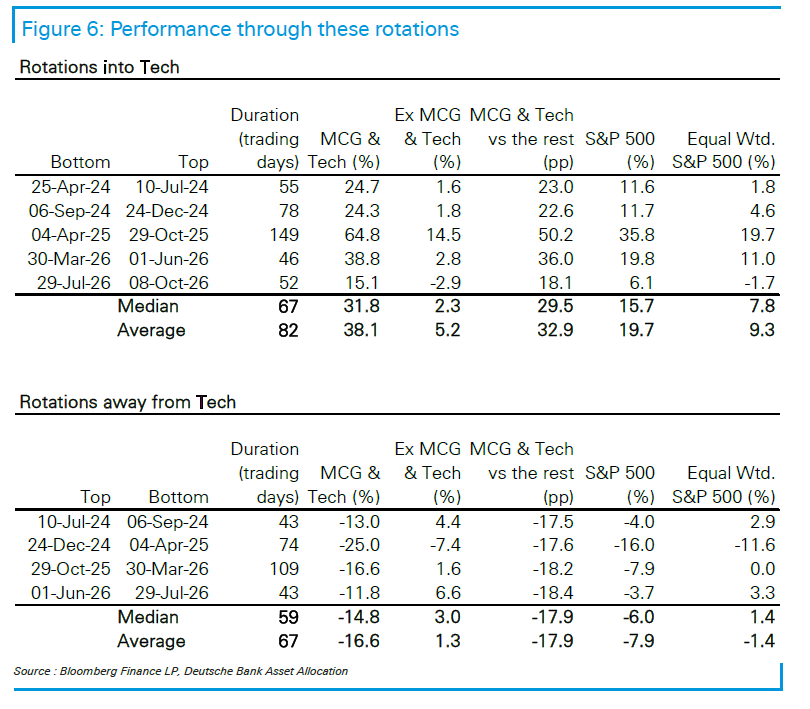
I went through on Sunday my concerns about the Tech trade. It was lengthy, so I won’t revisit that all here, but it was in part based on the analysis of Deutsche Bank’s equity team, who as I mentioned has “called the past year as good as anyone”.
My takeaway was: “I remain hopeful that Tech can get it back into gear, but it does seem we’re due for a rotation out of Tech, and those have lasted over a month since mid-2024. So if they’re right, the answer is no, Tech and non-Tech will not rise together.”
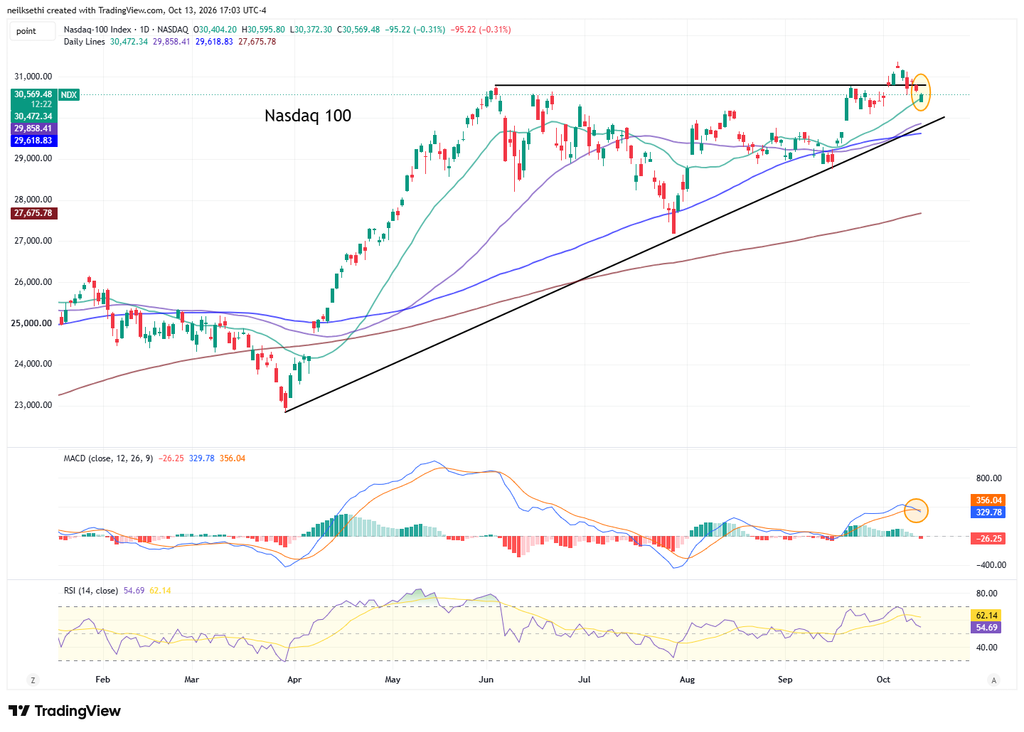
As I also said though “let’s not prejudge the outcome,” but I have to say after looking at the charts my caution levels continue to rise. So far the technicals for the Nasdaq, Nasdaq-100, SOX, and key stocks such as Nvidia, AMD, Micron, etc., have not broken, even if they’ve come back to where they were two weeks ago.
But as you can also see, their technical condition is far from pristine, and outside of the top level indices, there are daily MACD crossovers, and, in the case of SOX and Micron, the RSI falling under 50. I did sell out of SK Hynix (SKHY) today when that broke under its moving average support, and Micron will also get that treatment on any notable further weakness.
Meanwhile we’re seeing positive MACD crossovers and breakouts across a number of previous losers in Staples, Health Care, Real Estate, etc., with strong recent performances.
We have a day before we get to CPI (and PPI the day after) which will likely determine the near-term direction for this Tech vs everything else trade. We also get back to having to worry about Treasury yields tomorrow.
I kept the whole thing because it is the necessary lead-in to today, where the AI trade did continue its softening even while other areas of Tech (such as the Mag-7 as noted in the stock section) held up. And while Treasury yields did start trading, as noted they were tame. But despite that we saw a slightly weaker tape for the non-Tech trade, in no small part due to weakness in big banks and pharma.
So where does that leave us? In my opinion in a very uncertain place as we head into CPI. The “best” outcome in terms of clarity would be either a cool or hot print (in contrast to the “best” outcome for my portfolio which would be a cool print but definitely not a hot print). Either way an unexpected report would be a clear catalyst as I mentioned Sunday:
A benign print that keeps yields easing gives the broadening room to run even if Tech takes a breather, and with the bond market primed for the short-covering rally I’ve been waiting for, the impact of a cool print could extend well beyond a session or two. A hot print, on the other hand, likely puts an October rate hike back on the table and probably sends yields to new highs.
So, as always, let’s see what we get.
The Day Ahead – CPI Leads Wednesday
US economic data gives us our data highlight of the week in September CPI. We’ll also get weekly mortgage applications and US petroleum inventories.
Fed speakers stay busy with Governor Bowman (twice) and regional Fed president Barkin (who though we heard from today). We’ll also get the the Fed’s Beige Book, an anecdotal read on conditions across the 12 Fed districts that’s prepared for the upcoming FOMC meeting. Given how much regional Fed presidents rely on such anecdotes (see Beth Hammack’s speech Monday if you need evidence), it’s more important than many think.
No non-Bill (>1yr in maturity) US Treasury auctions this week.
Q3 earnings season continues with six S&P 500 components: Bank of America (BAC), Morgan Stanley (MS), BlackRock (BLK), Progressive (PGR), Fastenal (FAST) and State Street (STT).
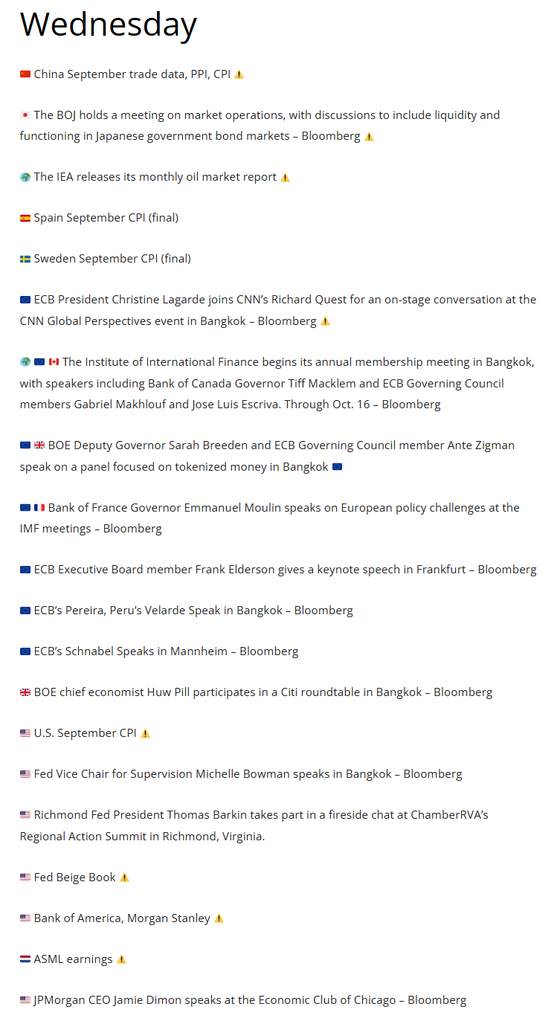
Ex-US highlights include China September CPI, PPI, and trade balance and the IEA releases its monthly oil market report. Quite a few central bank speakers (see C Barraud’s rundown below).
At the time of publication, in terms of equities mentioned, Sethi was longMSFT, AAPL, META, AMAT, AVGO, C, QQQ, SPY, RSP, IWM, CPER, IBIT and numerous equities in the energy sector.
As a reminder comments are encouraged. If they are directed at me, please put @NeilSethi in front.
BofA’s September CPI preview: “Not too hot, not too cold”
BofA expects core CPI to cool to 0.23% month-over-month after August’s “surprisingly strong” 0.29%.
They see the details following recent trends: tariff pressure on goods fading, shelter “benign,” and airfares and hotelShow more
Goldman (Callahan): Cyclical angst…
The GSCYCS vs. DEFS pair just had its worst week since mid-August, and the R2K has closed lower for five straight weeks. In turn, we’re starting to see heavier price action among the more “cyclical” cohorts of Tech/Semis, with Analog SemisShow more
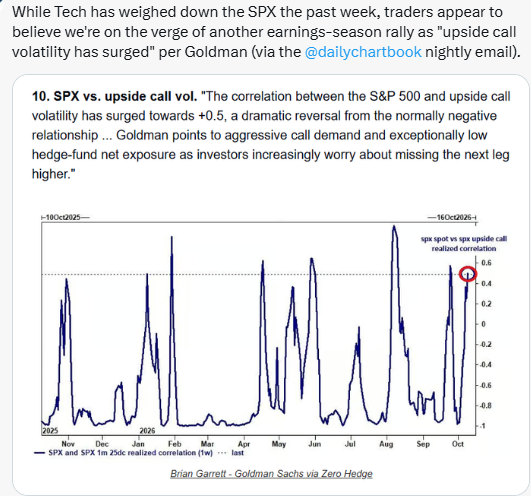
And Goldman notes (via the @dailychartbook nightly email) again this week that short interest in the Russell 2000 is "at its most extreme in three years," while calls are bidless.
"Maximum short, minimum insurance against being wrong"Show more
If the Russell 2000 $RUT does break technical resistance, it could unleash a short covering rally. Goldman this weekend noted:
"Positioning is deeply depressed, with GS systematic exposure in the 7th percentile and leveraged funds carrying record short exposure, according to
The selloff in US semiconductor shares has echoed to Asia where South Korea's Kospi fell over 6% with Samsung Electronics Co. and SK Hynix Inc. shares dropped more than 7% each.
"The Kospi is now down a third from the record high it reached in June, and has fallen below itsShow more
Chip Selloff Keeps a Lid on Indices Despite Another Day of Broader Gains
Eight of 11 sectors rose and the Dow Jones Industrial Average gained for a third straight day, but another selloff in chipmakers kept the S&P 500 little changed and the Nasdaq in the red on the lightest
Blackrock upgrades US Treasuries and downgrades US equities:
The 10-year Treasury yield has risen 110 basis points this year to around 5.25%, driven mainly by higher real interest rates rather than inflation expectations or term premium.... We think that is overdone. With termShow more
Goldman's Global Asset Allocation team made some headlines Monday moving to an overweight on equities including the S&P 500:
We are shifting back to our OW equities for 3m, and remain OW for 12m. We continue to think earnings growth remains supportive for equities and followingShow more
Packed Tuesday Brief from @C_Barraud contained a post on the IMF's updated forecasts where they slightly raised their global growth estimate to 3.1% from 3% in July (they kept 2027 at 3.4%), but forecast an increasing divergence.
Thirty-two economies now account for 95% ofShow more
Fund managers are the most overweight Tech since August 2020, per BofA's FMS, even as AI is a top concern for overcrowding, tail risks and credit events and more see an AI bubble than don't:
BofA’s October Global Fund Manager Survey shows a net 37% overweight in technology, upShow more
Quick AI-assisted summary of the big bank earnings this morning:
Equity trading desks posted huge numbers again, and net interest income held up. Fixed income trading though cooled at JPMorgan, Goldman and Wells Fargo as the bond selloff took hold. Credit remained clean acrossShow more
MarketWatch
@MarketWatch
Bank earnings today: Here's who missed estimates and who beat them trib.al/cVRpwrV
WSJ: Happy Birthday, Bull Market!
The S&P 500 started to climb four years ago today and hasn't looked back.
The bull market that started Oct. 12, 2022 has featured a gain of more than 110% in the broad stock benchmark and has stretched out for about 1,000 trading days,Show more
NY Fed President Williams, part of the core center of the Fed, who was instrumental in reversing expectations for an October hike to a hold with a speech September 29th, now takes some heat out of 2027 Fed rate hike expectations in an interview with Bloomberg News today (fullShow more
investingLive
@investingLive_
Fed Williams: Sees no need for rate hike in 2027 at this time
investinglive.com/central-banks/…