Stocks Got Tired of Going Down. Can They Continue Going Up?
Let’s take a deep dive into breadth as measured by the overbought/oversold oscillator.
You've reached your free article limit
You've read 0 of 1 free Pro articles.

It’s time to talk about the Overbought/Oversold Oscillator.
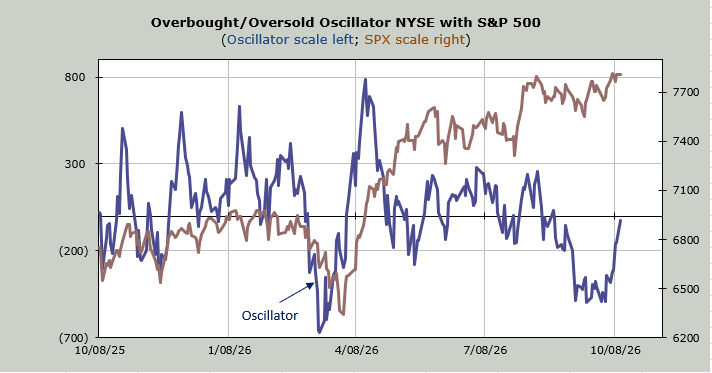
It has languished in oversold territory for nearly a month. There was no spike low as we had in late March. There was milling around at the lows. Generally, that is not great because it means we did not see anything capitulatory. We saw stocks just get tired of going down.
But we also know there was nothing capitulatory because we know sentiment remains very complacent, if not mostly bullish. But back to the Oscillator.
It is now nearing the zero line for the first time since early August. That’s a long time for a short-term Oscillator to be below the zero line. Just look how fast it went from overbought to oversold in February/March.
Now let’s check in on the Nasdaq’s Oscillator. Same thing. You would think that, with Nasdaq at all-time highs, this would at least be above the zero line, but it is not. What this tells us is how weak the others have been (the NYSE tells us the same).
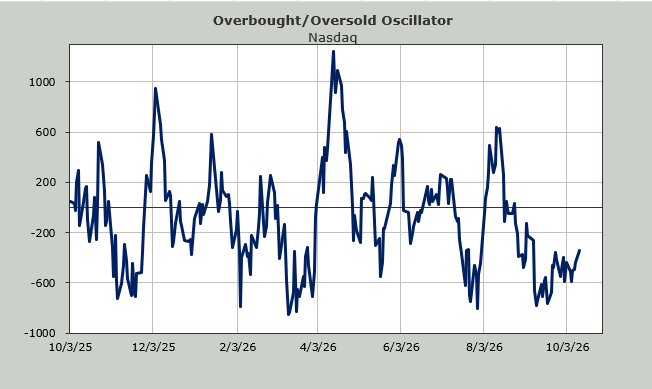
Both of these indicators are based on breadth, and we know how weak breadth has been. I expect, unless the market collapses in the next two days (not my expectation) both of these Oscillators will shoot upward, with the NYSE finally getting over the zero line. That will mean by Thursday this will be back to an overbought condition.
Nasdaq, though, might not make it over the zero line, and that is what I will be focused on. A failure to get over the zero line would obviously not be a great situation.
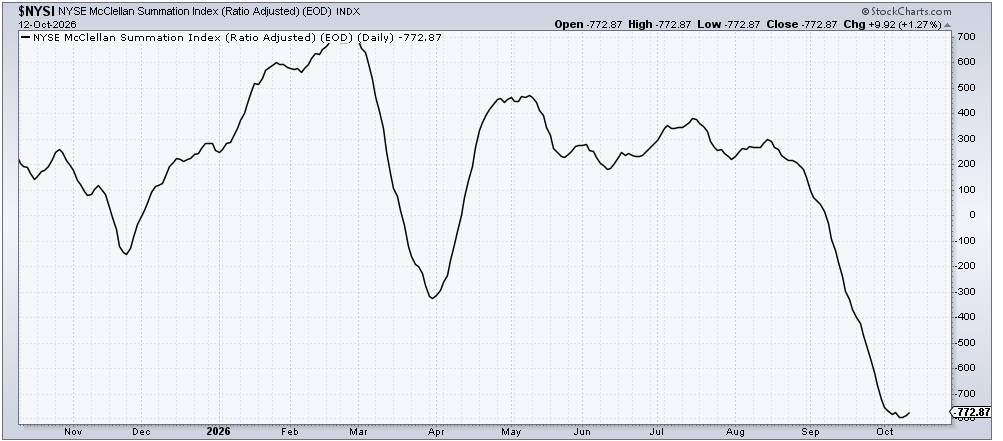
Back in August, when I turned sour on the ‘others,’ one of the indicators I highlighted was the McClellan Summation Index. It was heading down. Yet I liked tech because its Summation Index, where I use volume, was heading upward.
That changed about three weeks ago. Nasdaq’s Summation Index rolled over and began heading down, even while Nasdaq rallied. Nasdaq’s Summation Index is still heading down.
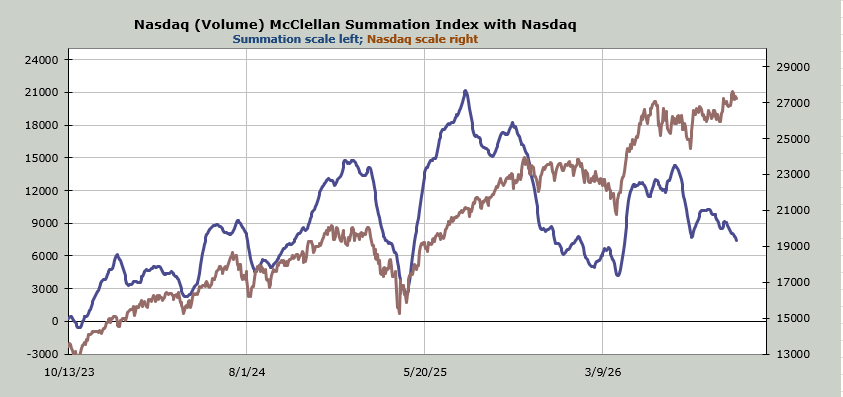
One reason I think we’re about to see the rotation (into the others from tech) is because if we look at the NYSE Summation Index, we don’t see that blip upward in late August/early September that Nasdaq’s had. But if you squint really hard, you can see that for the first time in two months the NYSE’s Summation Index is trying desperately to turn upward.
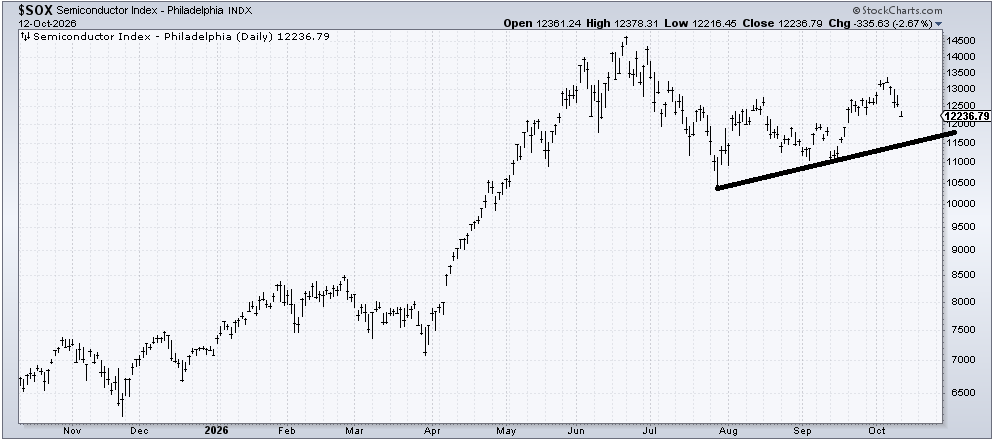
The SOX has now had four straight red days. This is the longest such streak since it made that low back in July. It’s coming toward its 50-day moving average (not shown), which is just over 12,000. I have drawn in an uptrend line that comes in around 11,600. I would not be surprised to see an up day in the SOX, but for the time being, I think it is heading toward that uptrend line.