Tech Could Bounce Here, but That Doesn’t Mean the Selloff Is Over
The either/or market continued for another day with tech stocks continuing to fall. They’re nearing interesting support levels, but a bounce could be followed by more downside.
You've reached your free article limit
You've read 0 of 1 free Pro articles.
The Market
Note: My grandkids are coming for a quick visit, so there will be no Top Stocks on Thursday evening. The next edition will be Sunday.
Today was yet another Either/Or Day even though it did not seem to be. Breadth was terrible, but the RSP once again outperformed the tech-heavy S&P. Heck, just look at the Dow, which likes to think it is tech-heavy with all those names they have added in recent years, but it is not. And it was barely down today.
I’d like to say we had a minor Realization Day when it comes to tech, but I’m putting the emphasis on minor. Let’s talk charts for a minute. The QQQs, S&P, and Nasdaq have all come down to their 50 DMAs. So let’s say there is some support there. They also have gaps to fill just below. For example we looked at the QQQs the other day, and they have a gap around 720. It’s close.
The SOX has now been down six straight days, so sure, once again I will say it ought to rally, but that’s the best I can say right now. The best news is that the QQQs traded nearly 50 million shares, which these days is on the high side, although not extreme. It’s not panicky, but it at least shows a willingness to sell.
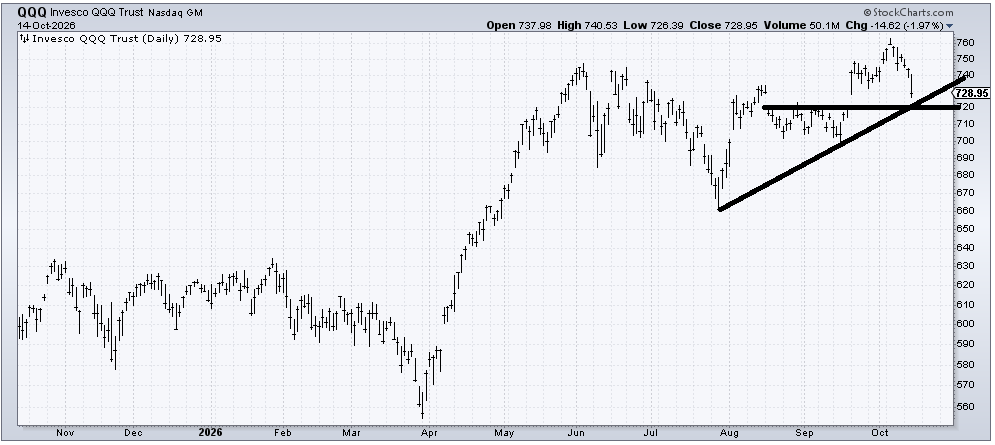
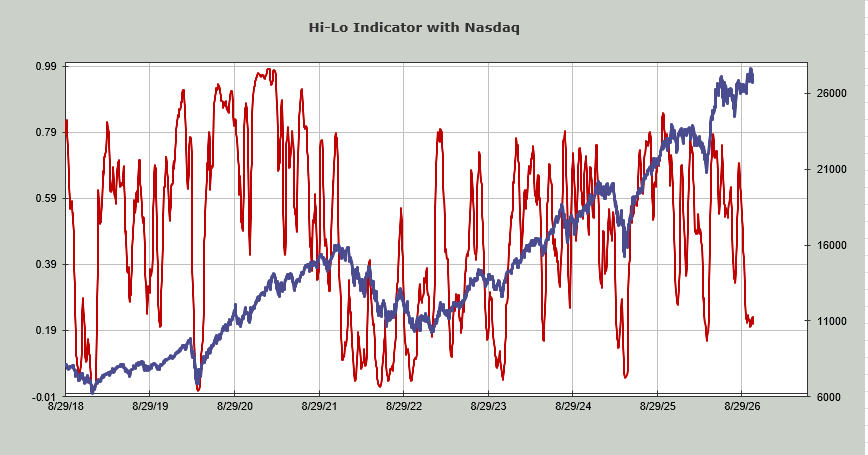
Nasdaq once again saw an increase in stocks making new lows. Now it’s just shy of 700. That cannot be blamed on the bonds. The wild thing is that because Nasdaq had that run to new highs, its Hi-Lo Indicator has not gotten oversold. Under .19 is oversold, so it probably gets there in the next few days.
Speaking of oversold, the Nasdaq McClellan Summation Index, which made a lower low today, now needs a net differential of +9.1 billion shares to halt the decline. As you can see, once it gets up into the area where it needs +10 billion shares or more, it’s getting oversold.
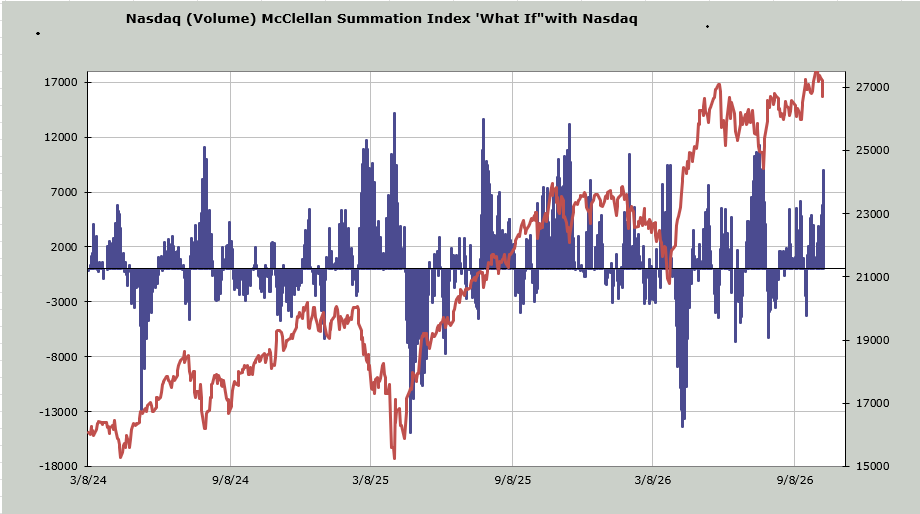
What does all of this mean? It means we can see a bounce tomorrow, even one led by tech stocks, but I still think sentiment is too complacent and that the ‘others,’ even if they pull back while tech rallies, are going to outperform.
New Ideas
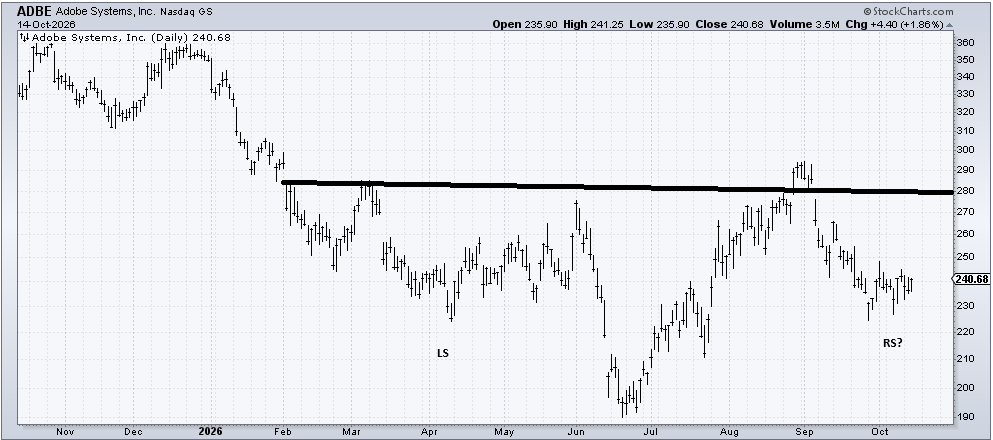
There is someone who asks about Adobe (ADBE) quite frequently, and I am usually lukewarm about it. But in the past few days I find myself wondering if these last few weeks has ADBE forming the right shoulder of a head and shoulders bottom. A stop under 220 seems far away, but that’s all I see.
Today’s Indicator
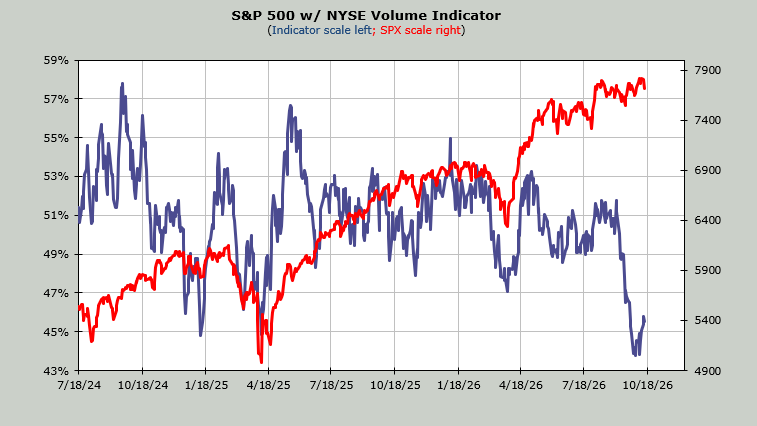
The Volume Indicator has been moving up. That’s the ‘others’ outperforming.
Q&A/Reader’s Feedback
Helene welcomes your questions about Top Stocks and her charting strategy and techniques. Please send an email directly to Helene with your questions. However, please remember that TheStreet.com Top Stocks is not intended to provide personalized investment advice. Email Helene here.
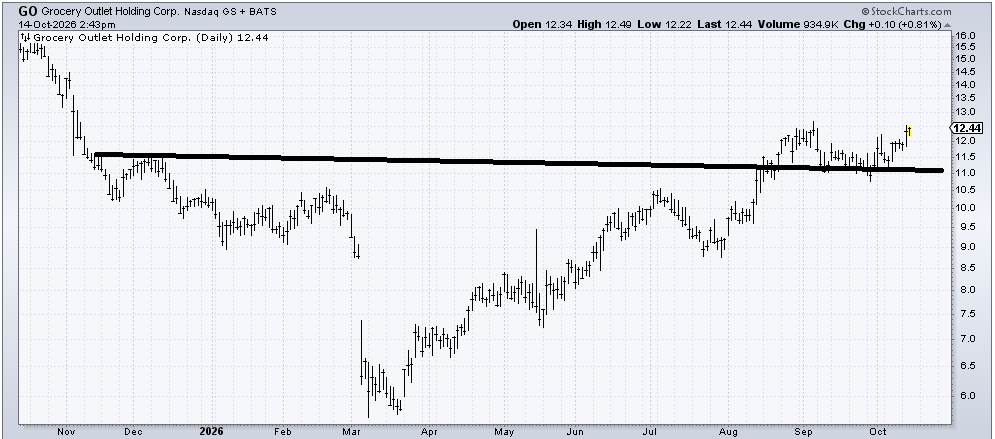
I like the chart of Grocery Outlet (GO), but it’s hard to get excited and chase anything that is up in this tape. It ought to have an intermediate-term target of around 16, but if the stock cannot get up and over this resistance at 12.75 in a hurry (a few days), then I’d say it’s coming back to 11, and we’ll see if it can hold there.
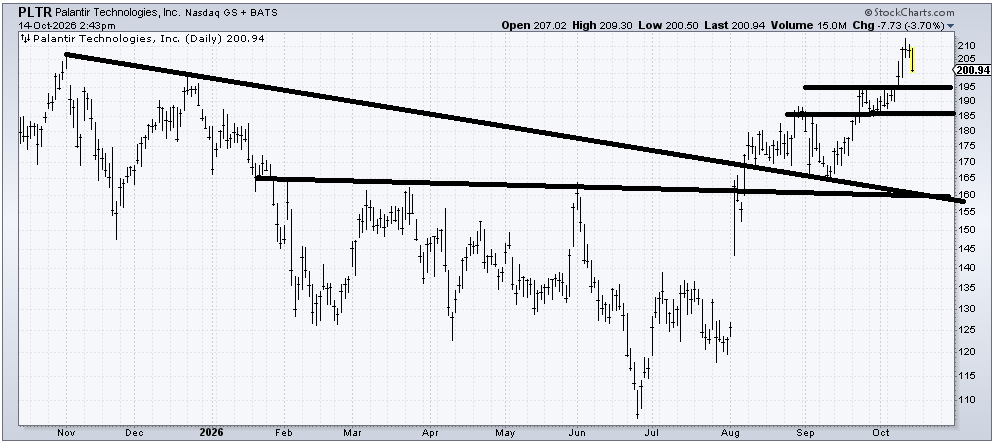
Palantir (PLTR) hit its upside target when it tagged 210 earlier this week. There is some light support at 185-195, so it probably bounces from there. If it can’t hold there or can’t rally from there, I’d say it’s time to take some profits.
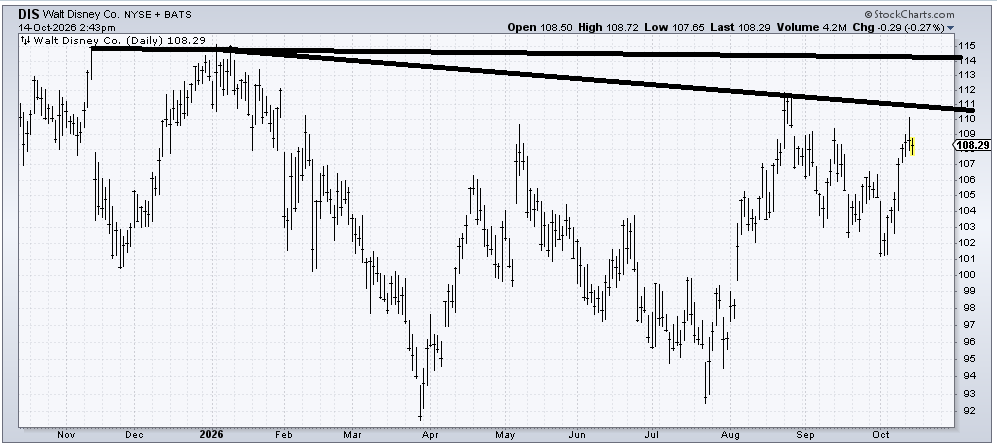
I want to like Disney (DIS) because we have had some good success trading it when it goes down. But right now the best I see is a move into that 111-114 area.
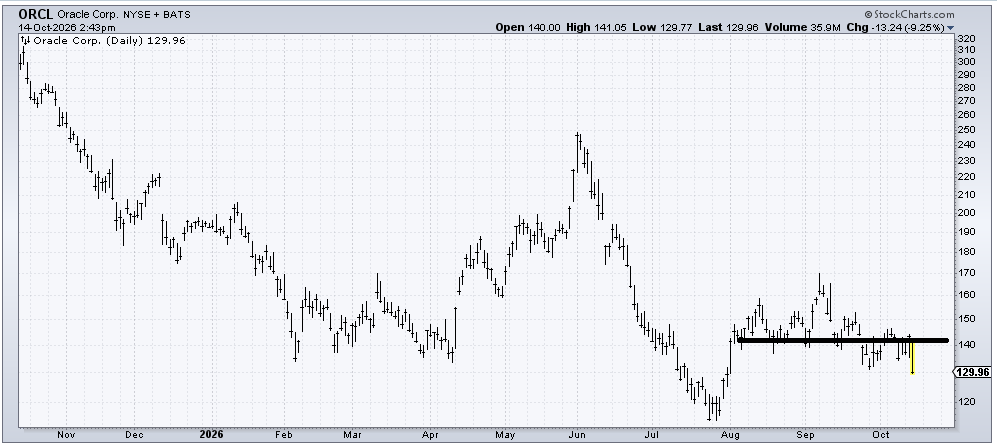
Oracle (ORCL) has some support all the way down to the July lows, but I’m more concerned about the resistance at 140. I am not interested in bottom fishing it. Perhaps I will find something interesting in it as we head further into the fourth quarter as a tax-loss selling candidate.
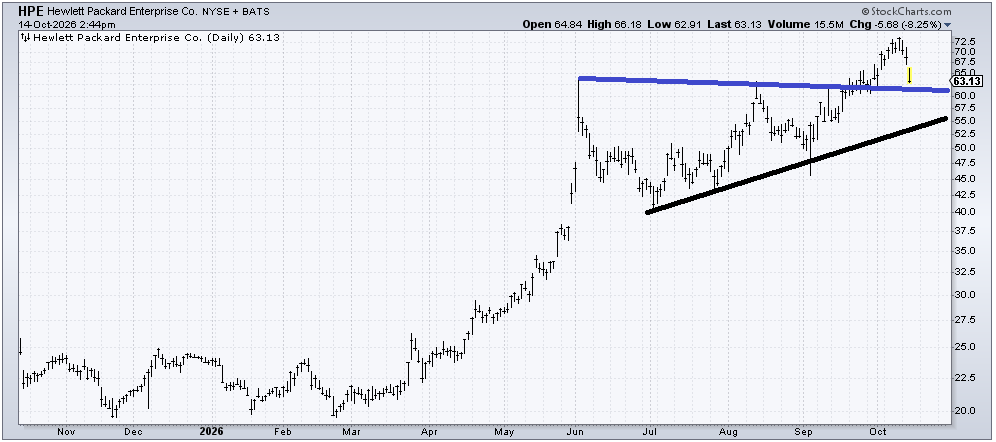
Hewlett Packard Enterprise (HPE) has some support as it approaches 60 (blue line), but I’m not confident it can do more than a short-term bounce off of it. If it can’t even bounce from there, then the black line comes into play. I lean toward profit taking.
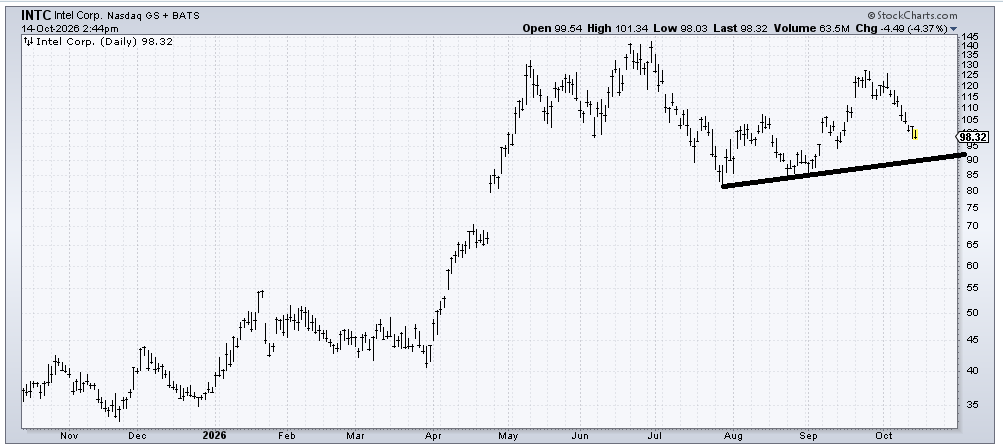
In the immediate near term, Intel (INTC) hasn’t made a lower low (vs yesterday), so it can bounce, but I suspect it will eventually make its way toward that line near 90.
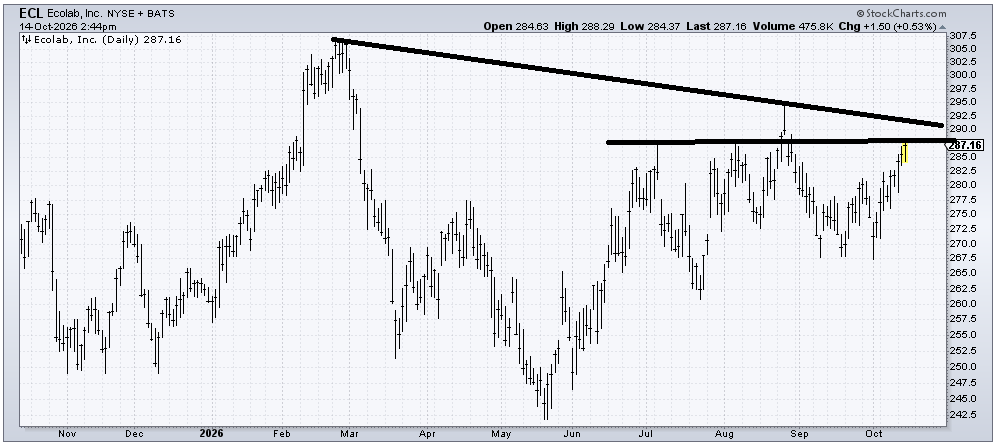
Ecolab (ECL) has a decent chart, but that spike high from August is going to be resistance so it’s hard to chase until we see how it handles that spike high. I’m inclined to think it’s a problem on the first trip up there.
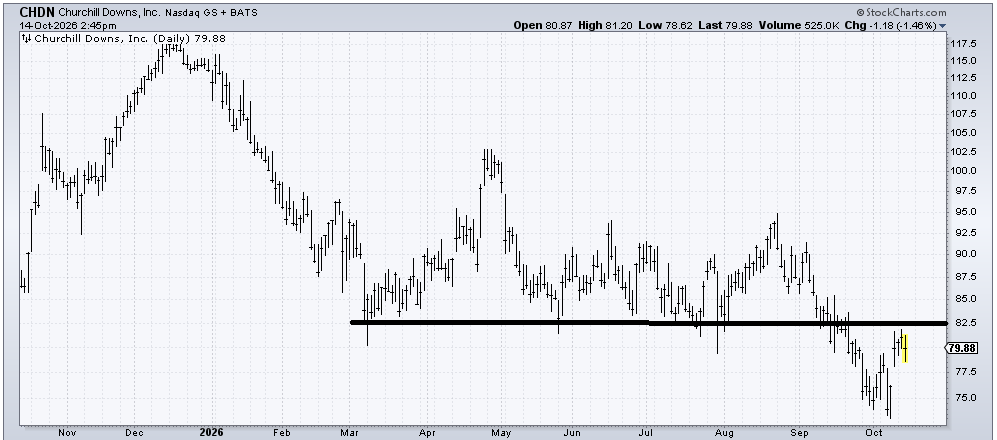
Churchill Downs (CHDN) has got to get back over 82.50 for me to believe that this recent move down was a false break. It will still be a tough slog with all that resistance overhead, but that’s the key: recapturing 82.50.
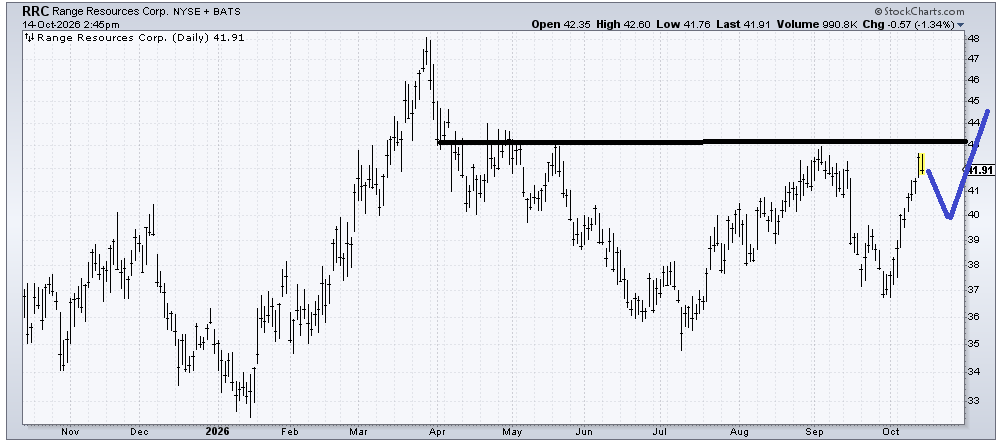
If…and this is a big if…Range Resources (RRC) can pull back looking something like what I have drawn in blue (pay attention to the pattern more than the price I drew), then I will like the chart. Otherwise, I don’t trust it to have a great breakout.
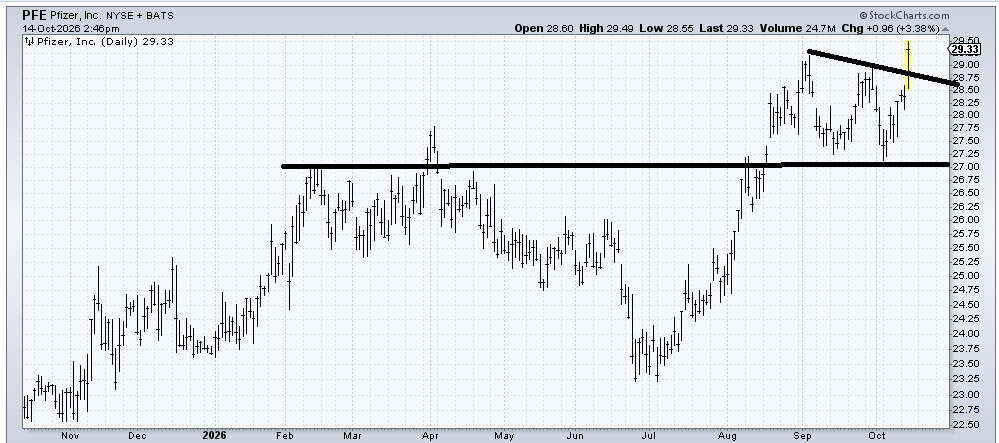
Pfizer (PFE) is finally moving! The next target is around 31. You do not want to see it back under that slanted line around 28.50.