Tech Bounces Back but Rising Yields Pressure Non-Tech
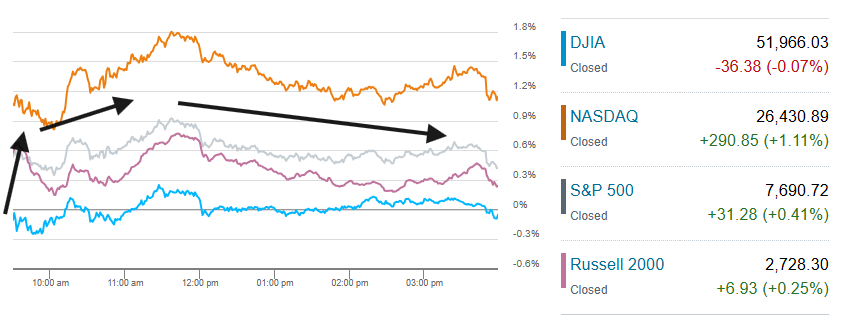
The megacap growth sectors went from worst (Friday) to first (Monday) as chipmakers snapped an eight-session losing streak, but rising Treasury yields left seven sectors, the Dow Jones Industrial Average, and the equal-weight S&P 500 lower.
You've reached your free article limit
You've read 0 of 1 free Pro articles.

Quick Summary
- Tech bounced back from last week’s harsh selloff as buyers returned to chipmakers after their double-digit weekly drop, and megacap and software names also rose, lifting the Nasdaq and S&P 500. But gains faded from the early highs, while rising Treasury yields hit rate-sensitive groups.
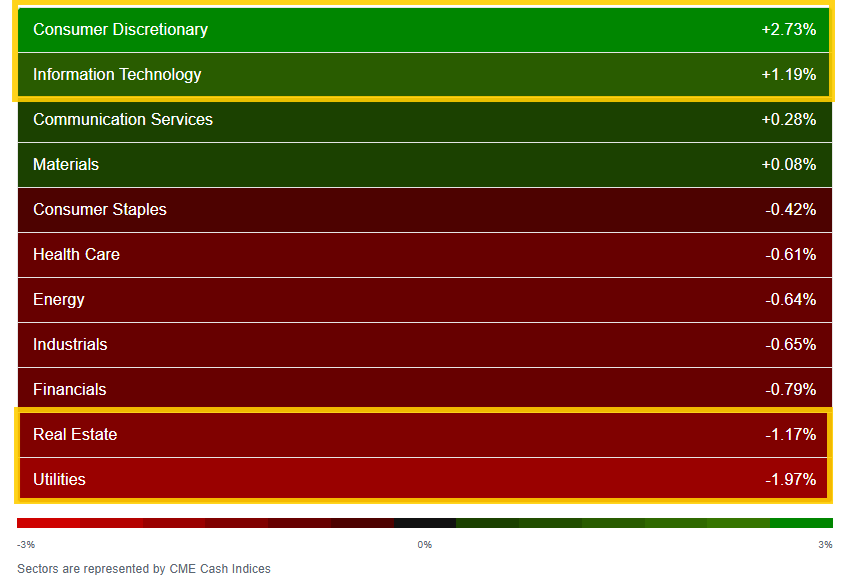
- The Nasdaq rose 1.1%, the S&P 500 0.4% and the Russell 2000 0.3%, while the Dow Jones Industrial Average slipped 0.1%. Despite the gains, breadth was weak, with just 4 of 11 sectors higher and the equal weight S&P 500 down 0.3%. Consumer Discretionary (+2.7%), Tech (+1.2%) and Communications went from Friday’s bottom three to Monday’s top three. Amazon (AMZN) rose 5% after Morgan Stanley named it a top pick raising its price target, and Tesla (TSLA) gained nearly 4% ahead of its results Wednesday. Utilities (-2.0%) and Real Estate (-1.2%) were the worst performers. The PHLX Semiconductor Index (SOX) rose 1.6%, ending an eight-session losing streak, though it had been up as much as 3.7% earlier in the session.
- Treasuries gave back some of last week’s rally. In the cash session the 10-year yield rose 4bp to 5.14%, its biggest gain in nearly two weeks, and the 2-year added 2bp to 4.76%. December WTI futures eased back breaking a 7-session streak of gains (the front-month contract which is less liquid though rose about 2% to above $103, per CNBC).
- In data, the NAHB housing market index of homebuilder sentiment fell three points in October to 29, the lowest level since June 2012.
- Tuesday brings two housing reports and a bigger dose of earnings headlined by Netflix (NFLX), and SpaceX (SPCX).
Market Commentary
Equities:
- Jurrien Timmer, director of global macro at Fidelity Investments, told MarketWatch that the idea that tech stocks are immune to the growing macro pressures isn’t quite right. “Think of it as a dynamic where earnings growth goes in the numerator and the cost of capital goes in the denominator. Right now, earnings are growing by leaps and bounds, but the cost of capital is rising as well,” Timmer said. “It becomes a race between the two over which one affects stock prices more.”
- “Results will show whether strong profit growth can restore confidence in the equity rally,” said Mark Haefele at UBS Chief Investment Office. “We continue to expect resilient growth and earnings to support equities, and see attractive opportunities in quality bonds.”
- “Simply a beat and raise is no longer being rewarded because it’s to be expected,” said Dave Mazza, chief executive officer at Roundhill Financial. “This quarter the bar is beat, raise, lift the full-year guide, and demonstrate margin durability.”
- “It will be particularly interesting to see what’s going on in these non-tech sectors as a gauge on the broader economy,” said Emma Moriarty, portfolio manager at CG Asset Management. “I wonder whether it’s almost a dual-track economy where we’ve got AI and associated services doing really well, and the rest of the economy maybe less well.”
- “If bond yields are stabilizing, that will help equities, through allowing the cycle to look more sustainable, through reducing pressure on AI funding, as well as on consumer finances, and through reducing the drive for P/E compression,” wrote JPMorgan strategist Mislav Matejka. “Indeed, during the most intense phase of yields spiking, forward P/E for AC World fell by 3 points, for SPX by 3 points and for Europe by 2 points. The multiple compression might not need to continue.”
- Lisa Shalett at Morgan Stanley Wealth Management says “growth and earnings remain strong, equity valuations have improved and the AI-capex cycle — dominated by rate-insensitive hyperscalers — is secure.” She added a“2027 should feature slowing capex growth, cooling inflation comparisons and further valuation reversion toward sustainable trend profit growth.”
- LNW chief investment officer Ron Albahary told CNBC the recent moves in CoreWeave’s spreads is a sign that the narrative surrounding the AI trade’s relative insulation from the rise in interest rates has changed. He thinks the market could become “increasingly more fragile” if earnings growth moderates. “Investors are going to become much more discriminating in terms of looking at whether these companies are going to generate the kind of return on capital to justify the debt that they’re taking on,” he said. “Prior to this wave, this sell-off, I think investors were assuming that all AI investments were going to pay off, and that’s not the case.”
Stock and Sector Breakdown:
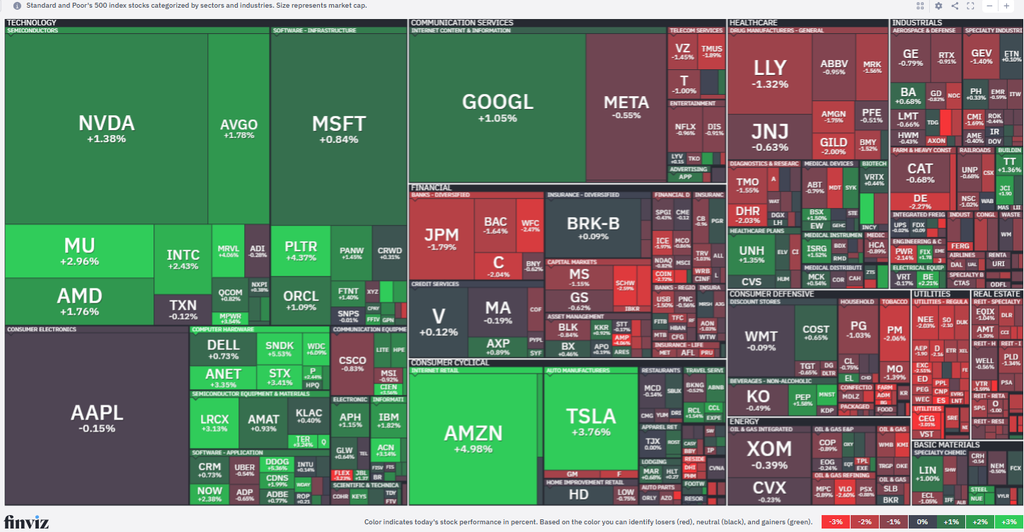
Despite the positive session, just 4 of 11 sectors were higher (down from 6 Friday), with a reversal at the top as Consumer Discretionary, Tech, and Communications, which finished in the bottom three Friday, ended at the top Monday, overpowering the seven red sectors, two of which (Utilities and Real Estate) were down more than 1% as bond yields rose.
Intel (INTC) rose 2.4% amid a broad semiconductor rally as JPMorgan upgraded the chipmaker from Underweight to Neutral, saying its “confidence is building” about management’s execution of the company’s turnaround. The bank kept its Intel stock price target at $85, however TheStreet Pro’s Stephen Guilfoyle upgraded his price target: New Intel Price Target After Huge Surprise Upgrade.
The Philadelphia Semiconductor Index (SOX) broke its eight-day slump, the longest in nearly two decades, rising 1.6%, though that was less than half its gain at the session highs., less than half though where it was at the highs of the session. Note, two semiconductor names were part of Chris Versace’s We’re Making 4 Small Opportunistic Buys in These Holdings.
Micron (MU) also rose 3% and Western Digital (WDC) +6.1% and Sandisk (SNDK) +5.5% would lead the S&P 500. But the semiconductor strength didn’t come at the expense of software with the iShares Expanded Tech-Software ETF (IGV) finishing up 1.4% and Datadog (DDOG) +5.4% and Palantir Technologies (PLTR) +4.4% finishing in the top six S&P 500 performers.
But it was Amazon (AMZN) +5.0% that would lead the top 20 S&P 500 components (as well as the DJIA) after Morgan Stanley raised its price target on the stock to $350 from $335. Tesla (TSLA) was another megacap winner, gaining nearly 4% ahead of its results Wednesday. Rev Shark, though, is unconvinced: Amazon Leads Unconvincing Bounce After Morgan Stanley Price Target Change
SpaceX (SPCX), another Elon Musk company, was also in the news ahead of its own earnings Tuesday, with shares gaining over 1% after Musk pledged one share “to every kid in America.” It comes after Anthropic said it plans to commit 5% of its shares to a new “public benefit fund” with the flexibility to make charitable donations or direct money to “specific populations.”

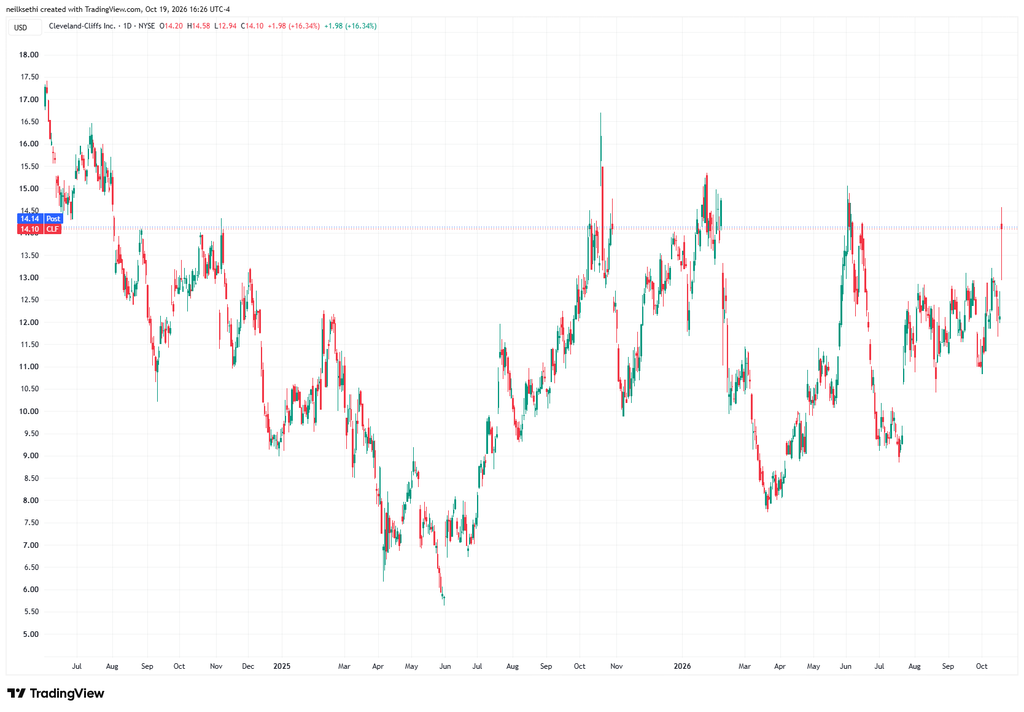
Not an S&P 500 component, Cleveland-Cliffs (CLF) surged more than 16% after beating quarterly earnings expectations.
Going the other way, CoreWeave (CRWV) -0.8% would finish slightly lower – after slumping 12% on Friday – after giving back nearly 8% in gains from earlier in the session after an early boost from Goldman Sachs upgrading the company to buy from neutral. “Not all neoclouds are created equal, and we view CoreWeave as being toward the top of the quality rankings in the ecosystem,” said analysts led by Gabriela Borges. Borges added that the company should be able to finance its future expansion at a cost of debt only modestly higher than existing levels. Nebius (NBIS) +2.9% and Applied Digital (APLD) +6.7% interestingly though held onto gains, although also finished well off the highs.
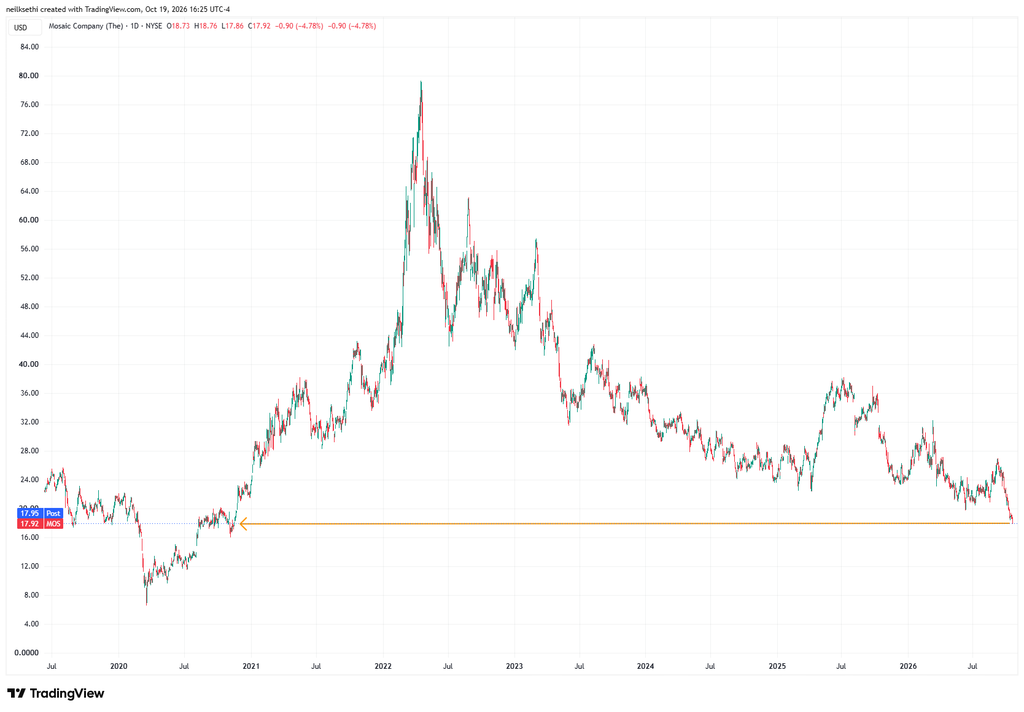
Mosaic (MOS) -4.8% would lead all S&P 500 components to the downside finishing at the lowest levels since November 2020.
The number of large SPX winners (up over 3%) was little changed at 17 from 15 Friday but well below the ~120 Thursday, which was the most we’d seen since the start of August.
The number of large losers (down over 3%) fell to 8 from ~60 Friday.
As mentioned previously, both of these metrics have been very (extremely?) subdued since the start of August, rarely getting above 50 and only twice above 100.
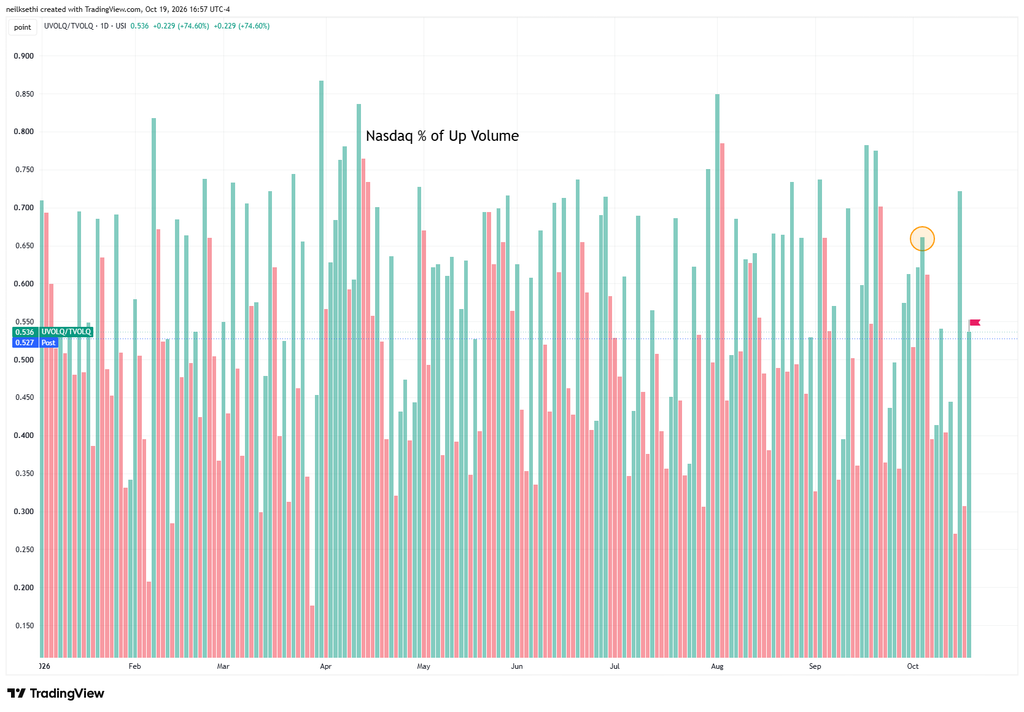
Despite the solid 1.11% index gain, positive volume (intensity in buying stocks up on the session) was very disappointing on the Nasdaq at just 53.6%, barely above 50%. Compare that to October 5th when it was 64.5% on a slightly smaller 1.05% gain.
And looking at new 52-week highs minus lows on the Nasdaq the story wasn’t any better falling to -419 from -378 Friday, the 36th straight session of new lows outnumbering new highs, the longest such streak since the 43-day stretch that ended April 22, 2025.
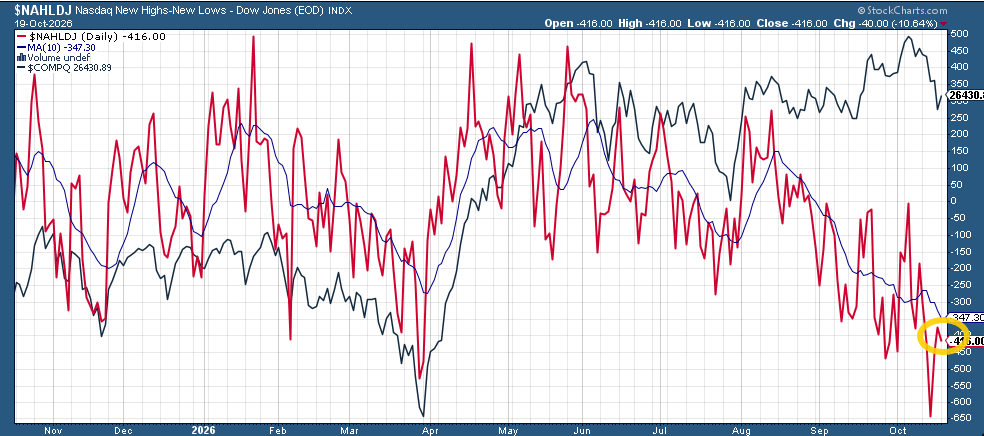
With new 52-week highs now the least since the week of liberation day (the chart is from intra-day but that’s where it would finish).

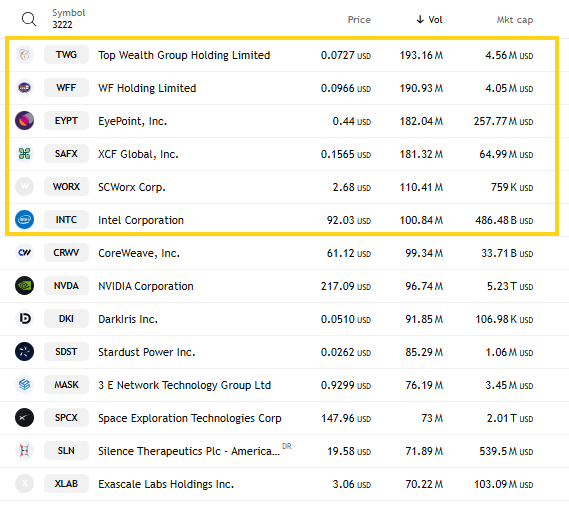
And Nasdaq speculation settled back down, with just six companies trading over 100 million shares (none over 200 million), down from 10 Friday
Some other stock-specific commentary from TheStreet Pro:
- Chris Versace – See above in stock section and Upgrading One of Our ETF Holdings and Boosting Its Price Target
- Stephen Guilfoyle – Buying More Rocket Lab After Wall Street Endorsement
- James “Rev Shark” DePorre – I’m Buying This Health Care Stock as Traders Eye Tech Exit
- Bob Lang –
- Bob Byrne – The AI Boom Has an Electric Bill. Here’s Who Gets Paid
- Bret Jensen – This Mid-Cap Biotech’s Pullback Just Created a Trade I Can’t Ignore
A Look At The Charts
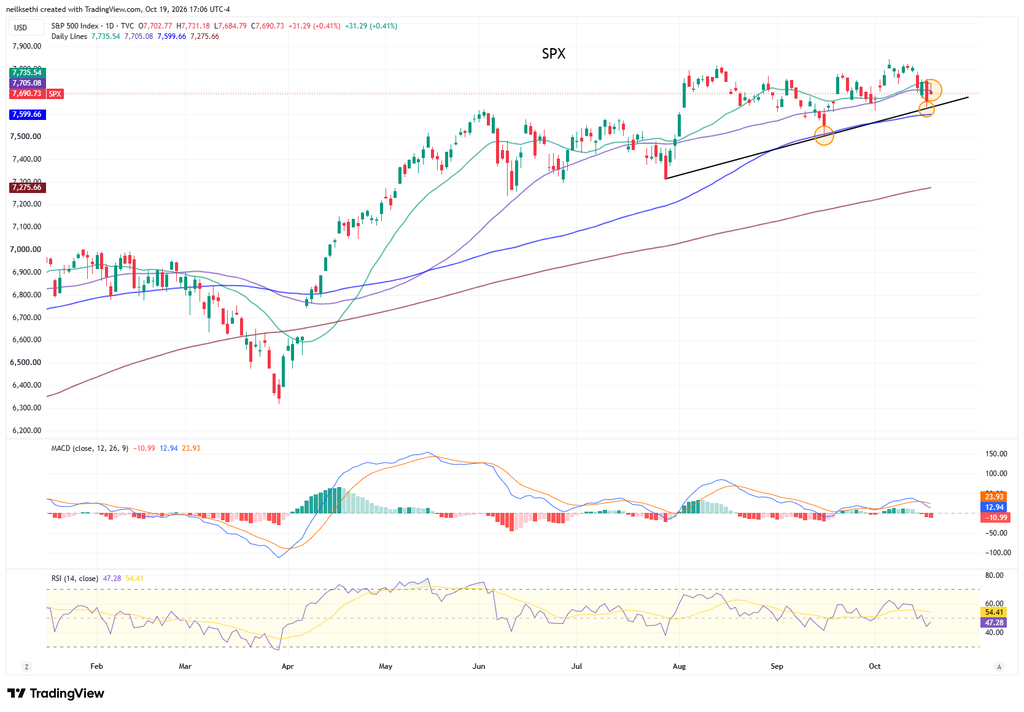
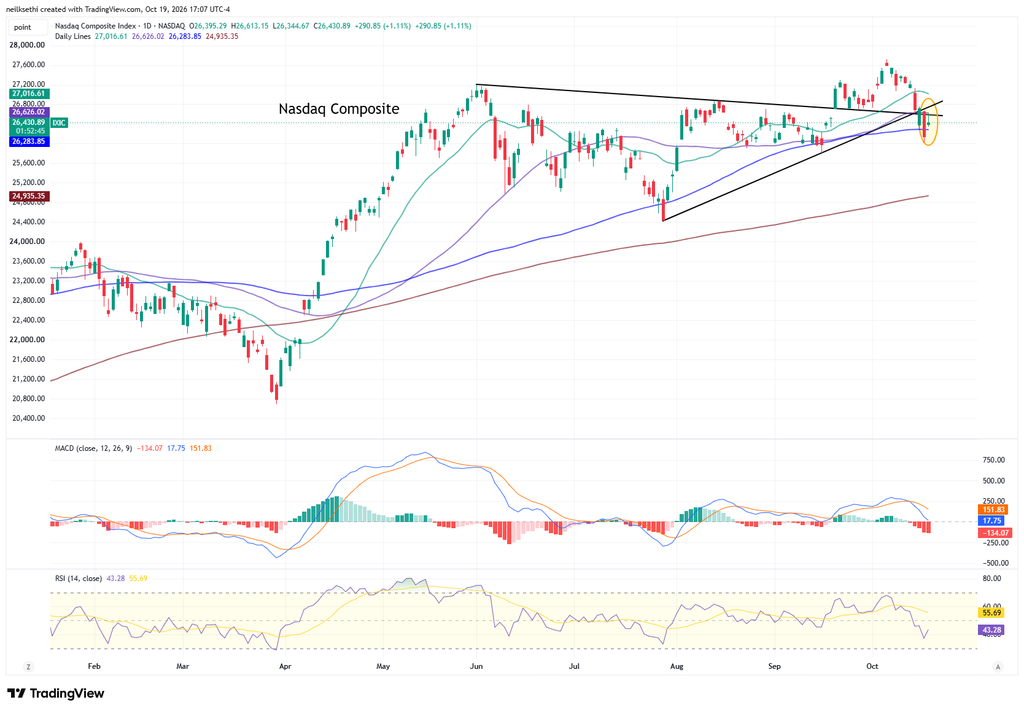
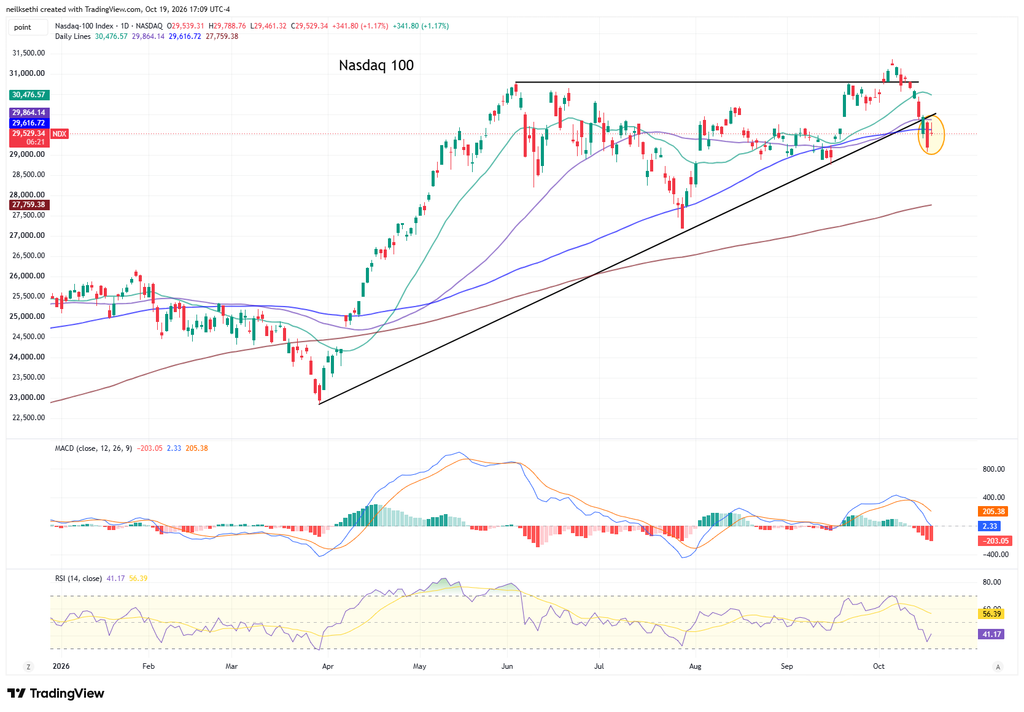
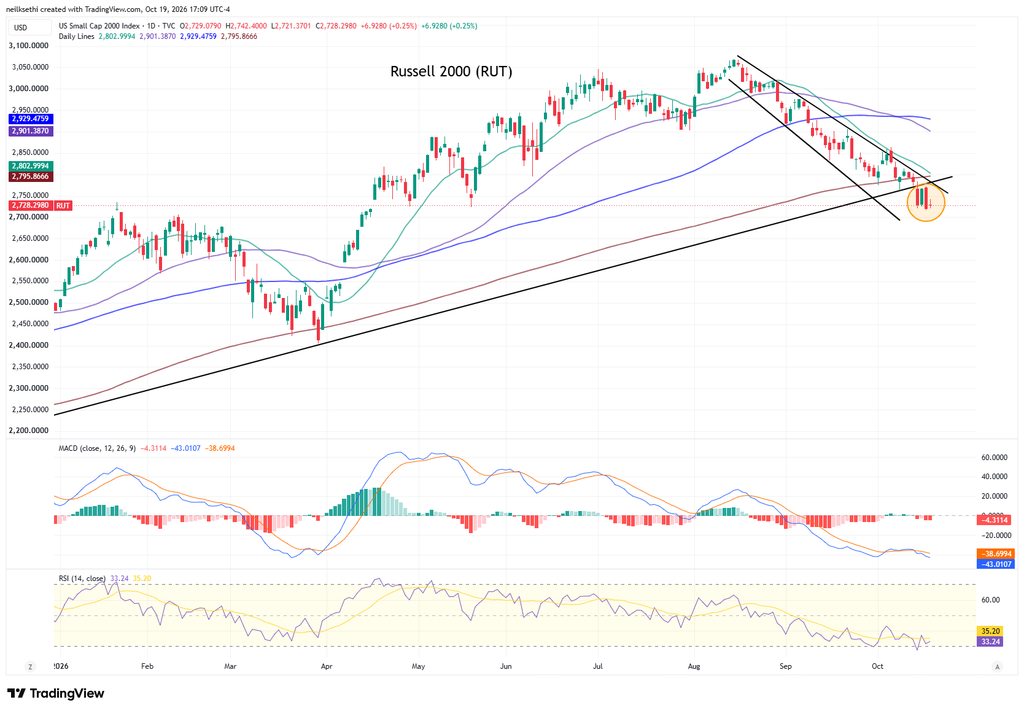
Note on all charts the colored lines are moving averages (the average price over the lookback period — days on the daily charts, weeks on the weekly charts):
20 = green
50 = purple
100 = blue
200 = brownException is monthly charts where blue is 10-month moving average and brown is 20-month moving average.
MACD = Moving average convergence/divergence line, a measure of momentum that compares longer term and shorter term momentum to gauge if a move is strengthening or weakening. This is probably my favorite individual indicator.
RSI = Relative Strength Index (basically what it sounds like) = measures the strength of the move comparing gains to losses over the given lookback window (I use the standard 14 periods).
SPX did get an initial bounce off its uptrend line from July but couldn’t hold above its 50-DMA. As noted last week the daily MACD and RSI have slipped negative.
Bob Lang today on the S&P 500: Charting the Markets: The S&P Is Still Bullish. But for How Long?
Nasdaq Composite able to reclaim its 100-DMA but not 50-DMA. As I noted last week, it has a MACD sell signal and the RSI has fallen under 50. It also remains under the trendline from the August low.
The Nasdaq-100 (QQQ) couldn’t even reclaim the 100-DMA. So this is not at this point a bounce to buy. I’ll be waiting for a break back above the 50-DMA.
The Russell 2000 (IWM) edged off Friday’s 6-month low. The MACD remains “go short” and the RSI remains near 30.
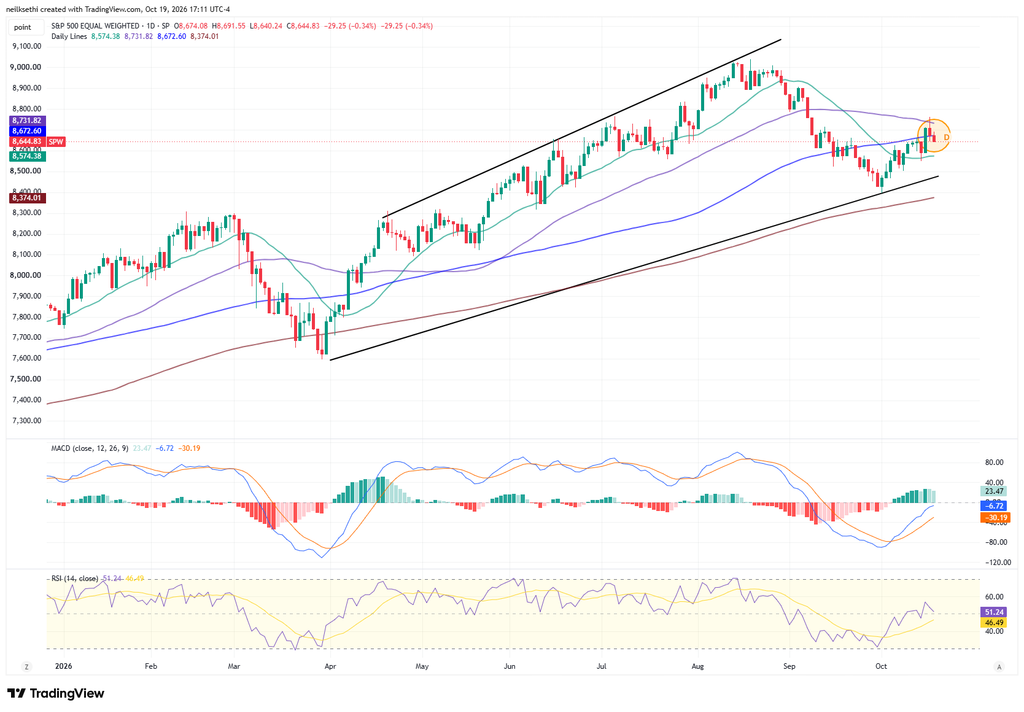
The equal-weighted SPX which I have said has been “able to hold up better” the past couple of weeks fell back under its 100-DMA. Still it remains the only one with a positive MACD, and the RSI is over 50.
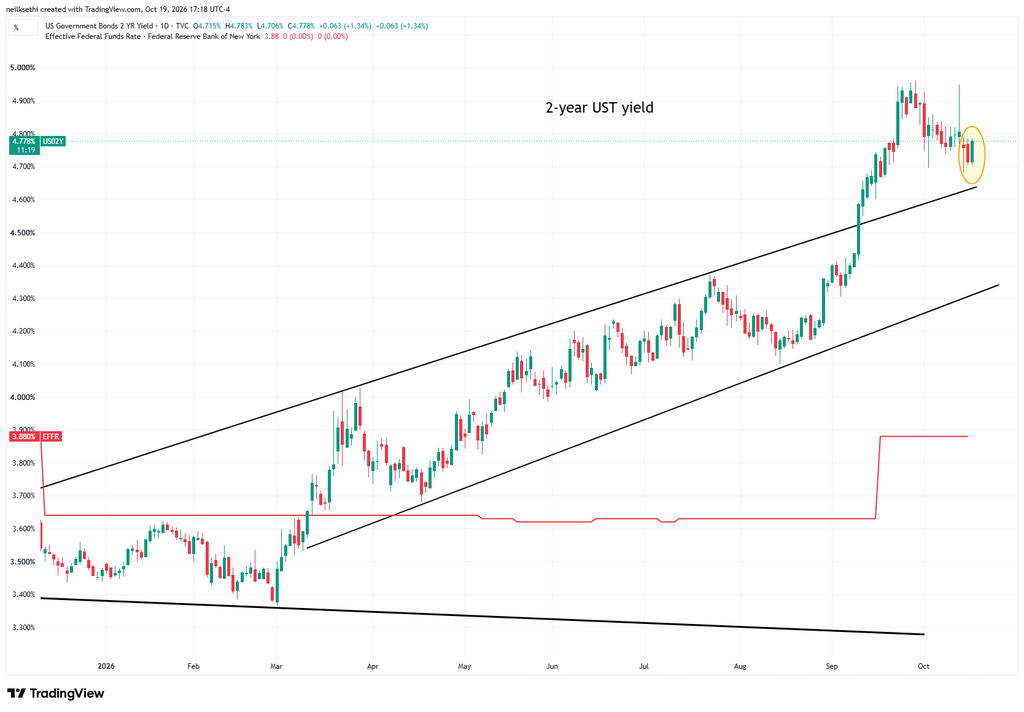
Treasury yields rose across the curve Monday.
The 2-year Treasury gained six basis points (including the after-hours) from the lowest close in a month.
It is ~90 basis points above the Effective Fed Funds rate, so still calling for one or two rate hikes, but not much more than that (it historically has traded 25-50 basis points above the Fed Funds midpoint).
Fed rate hike expectations were little changed with October 17% priced, December 93% priced, and two more after December next year (79 basis points of total hikes).
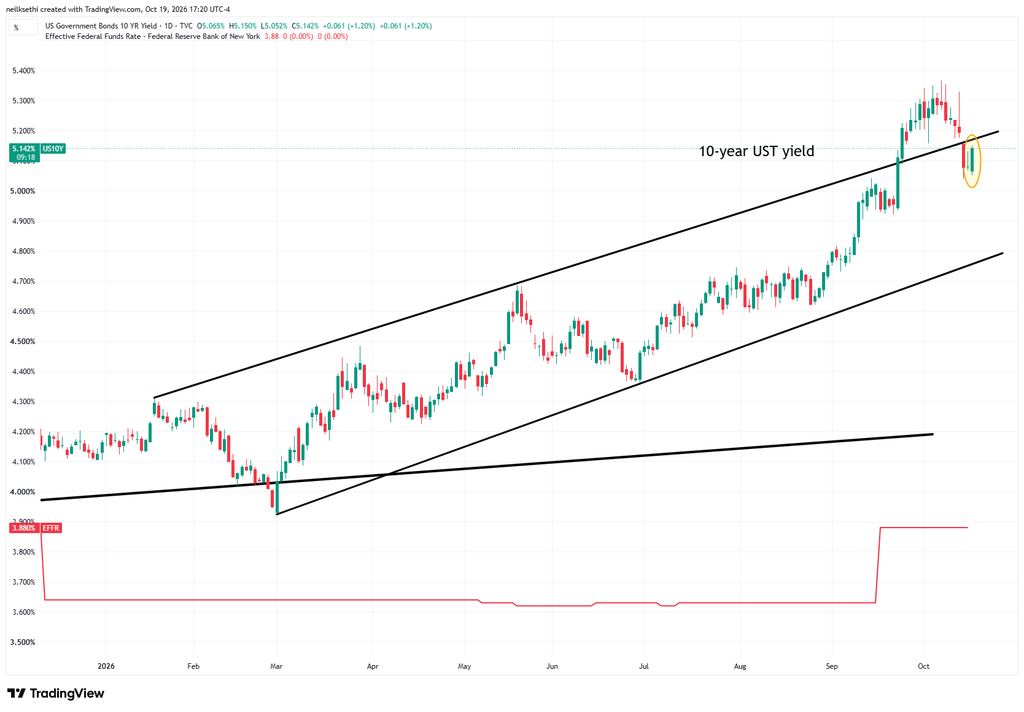
10-year yields also up six basis points to 5.14% (including after-hours) after dropping the most since July 2025 last week.
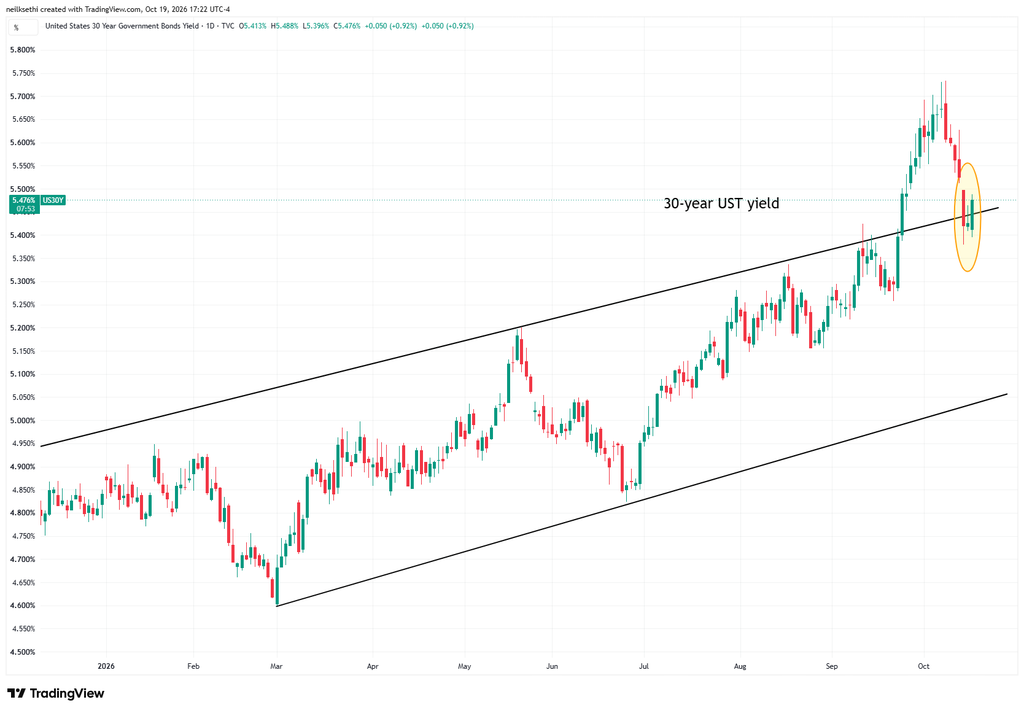
30-year yields up five basis points taking the yield to 5.48% (including after-hours). That came after the largest weekly drop since April 2025.
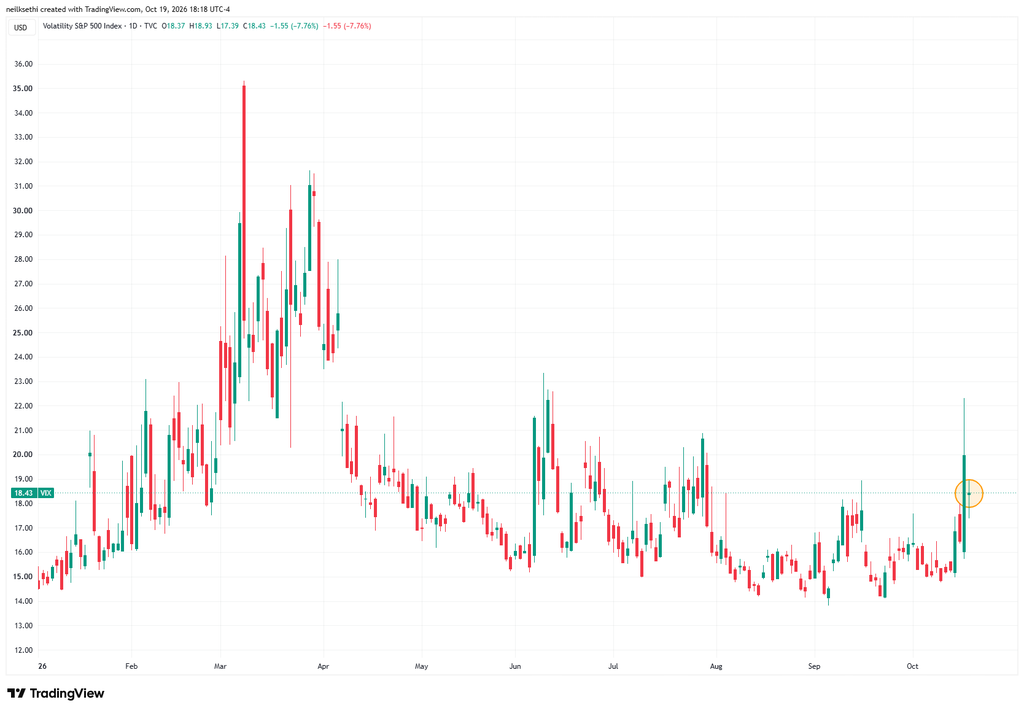
VIX eased back to 18.4 from 20 Friday which was the highest close since July. The current level is consistent with ~1.16% average daily moves in the SPX over the next 30 days.
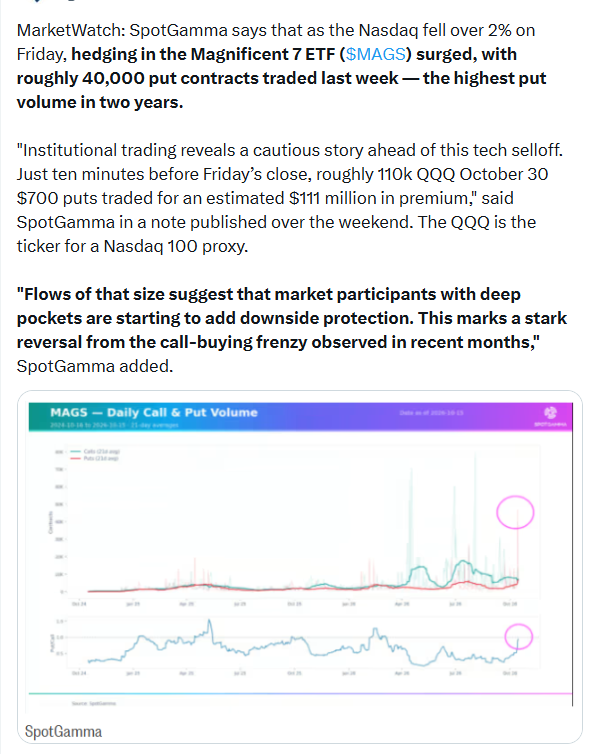
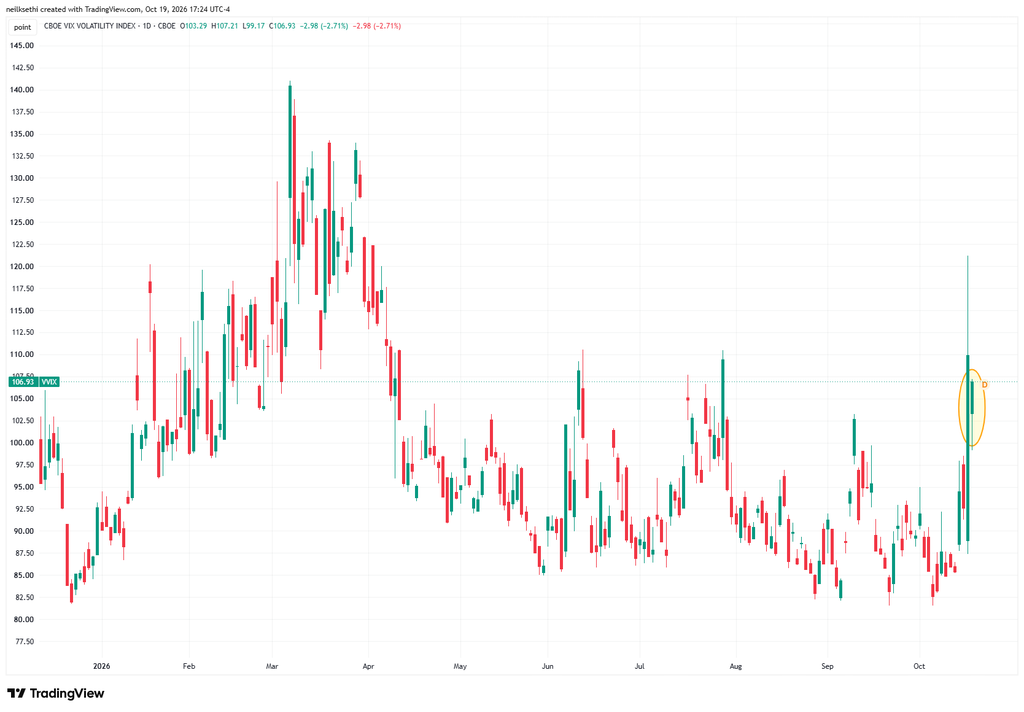
The VVIX (VIX of the VIX) also eased back to 106.9 from the highest levels since March on Friday. The current level is still consistent with “elevated” daily moves in the VIX over the next 30 days (historically, normal is 80-100, although we haven’t been below 80 since July 2024). Above 100 is the level flagged by Charlie McElligott as indicating higher stress.
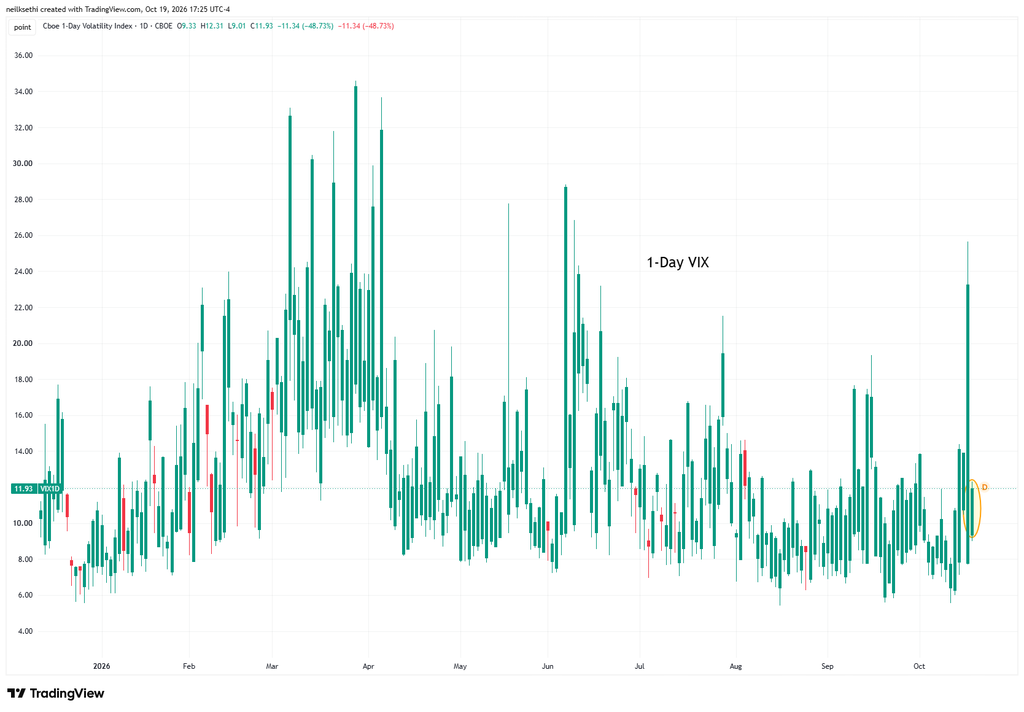
1-day VIX dropped roughly in half to 11.9 from one of the highest closes of the year. The current reading is consistent with a move of just 0.75% in the SPX next session after ~1.5% on Friday.
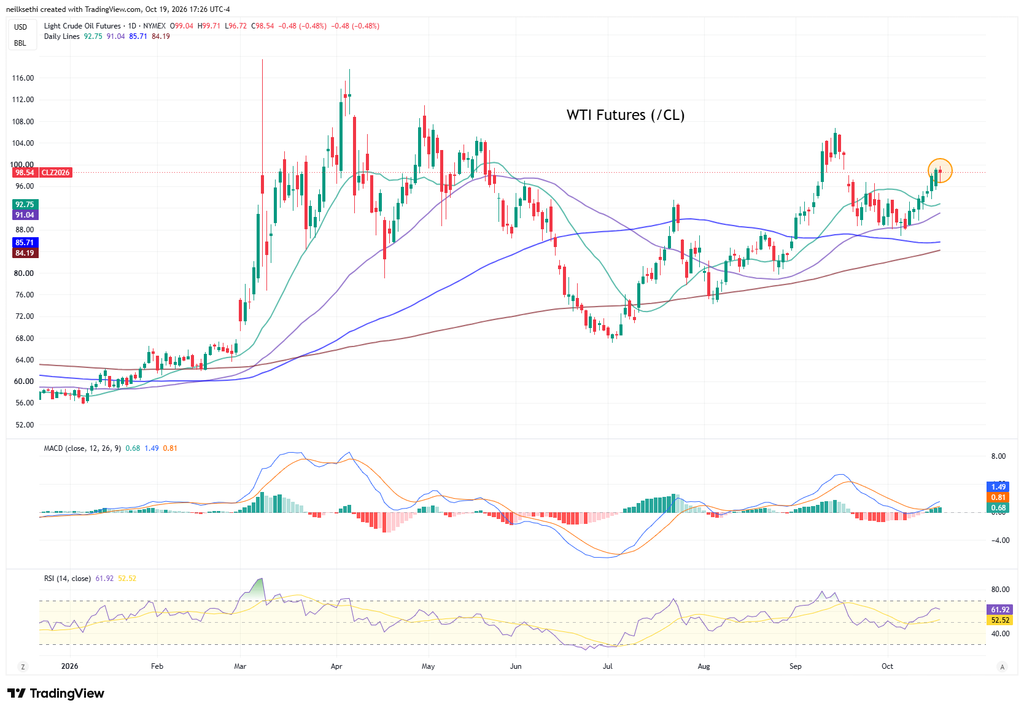
WTI futures (/CL) which TradingView has at December currently were down for the first time in eight sessions from the highest close in a month (including after-hours).
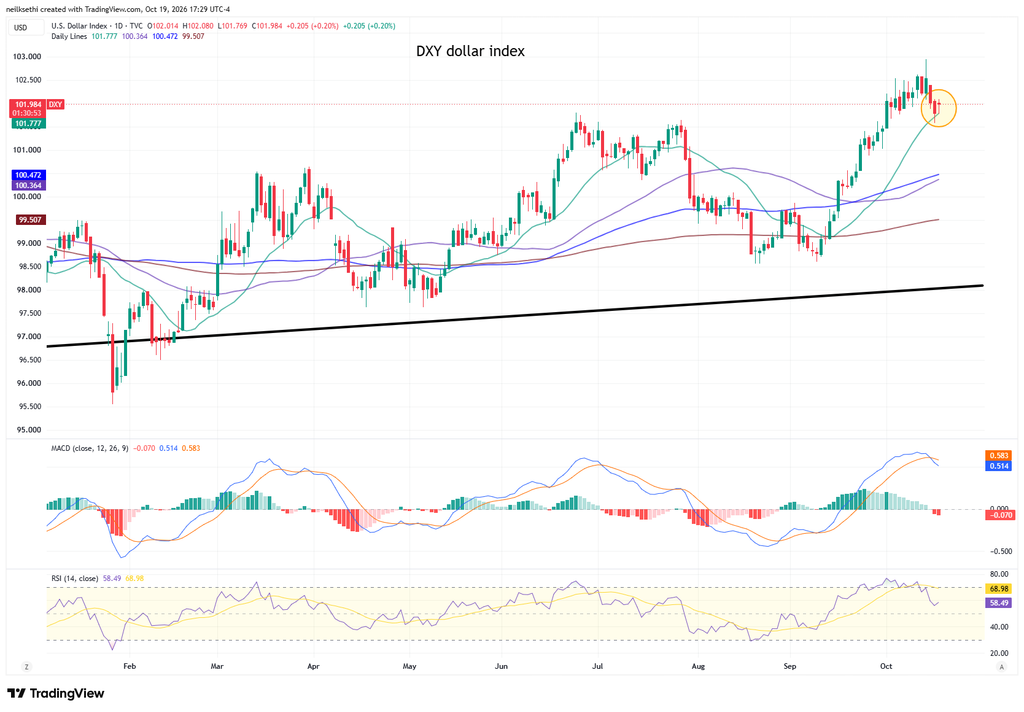
The bounce in rates helped the DXY dollar index (which is fixed weighted with a heavy 57% weighting vs the euro) which also bounced, in its case from its 20-DMA. That said, as I mentioned Friday “The daily MACD flipped to a ‘sell longs’ positioning while the RSI has fallen from over 70 to well under, both of which would argue for a consolidation.”
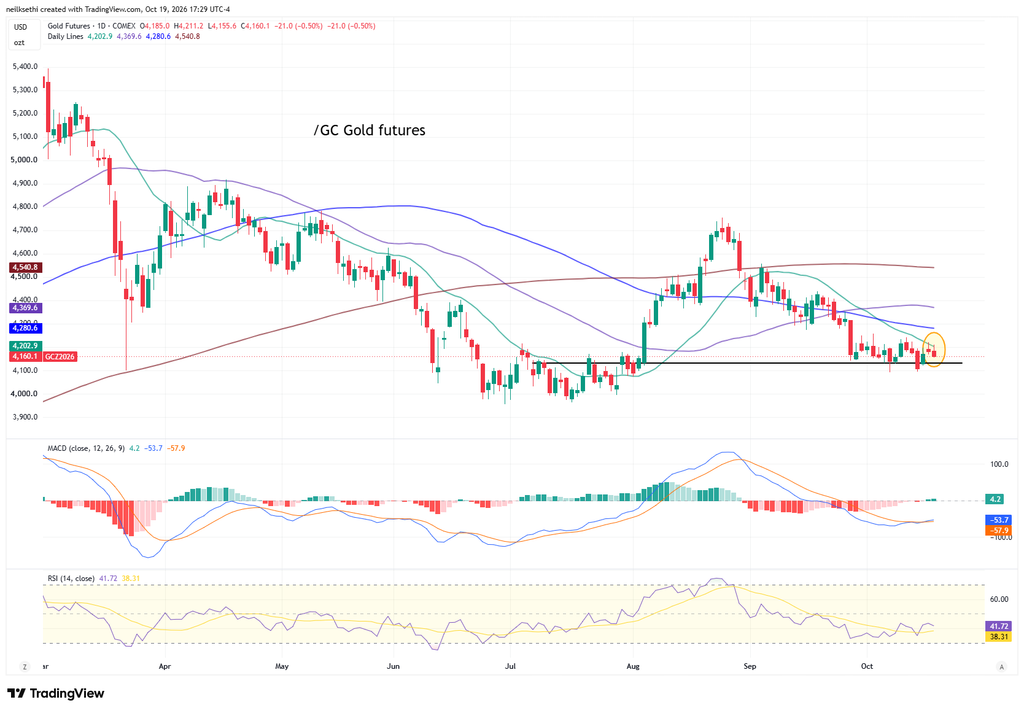
Gold futures (/GC) continue to trade just above support. The daily MACD is slightly positive but the RSI is still under 50. As I mentioned Thursday “It’s worked itself into a position for a rally if it wants to take advantage.”
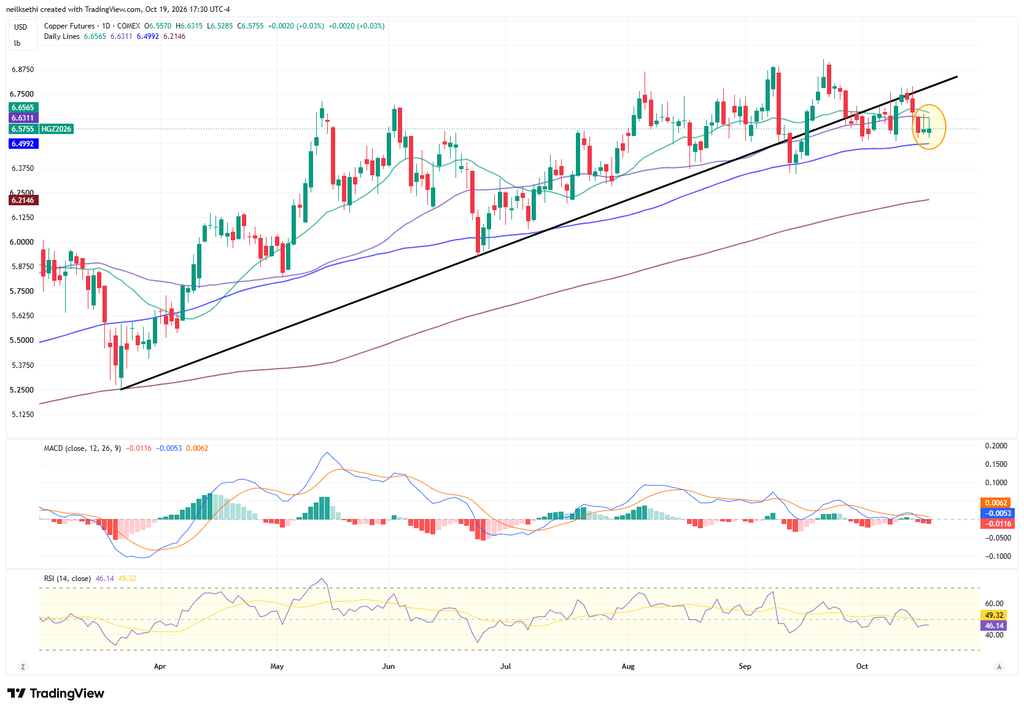
US copper futures (/HG) little changed again Monday. Overall they still remain range bound. Daily MACD and RSI remain slightly negative.
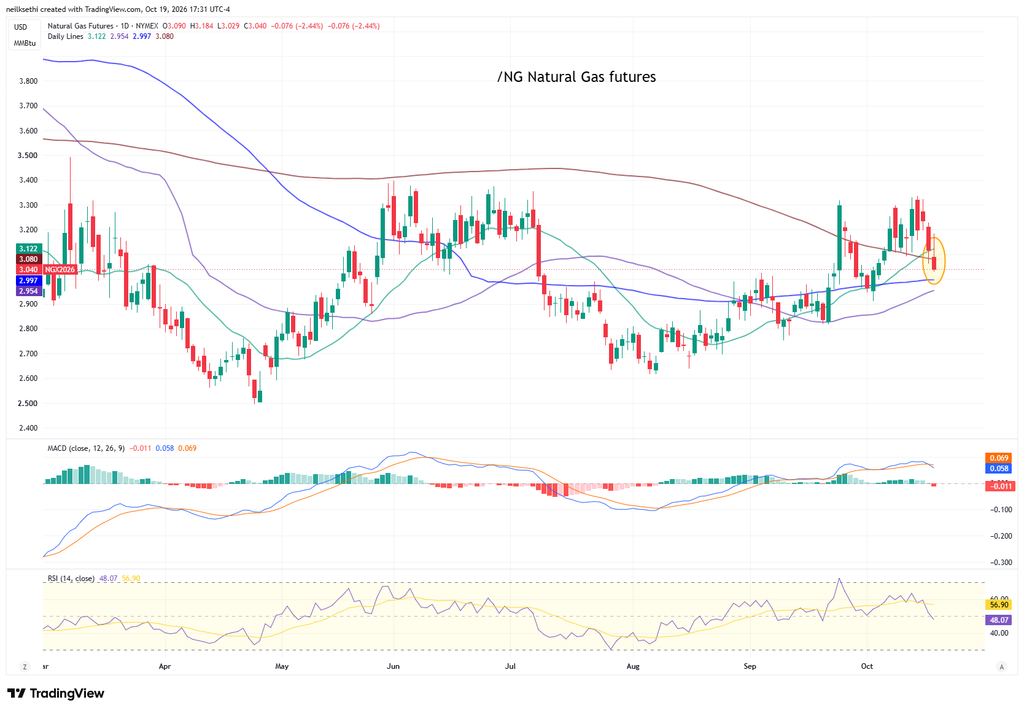
US natural gas futures (/NG) fell back again, moving back towards the middle of their range since March.
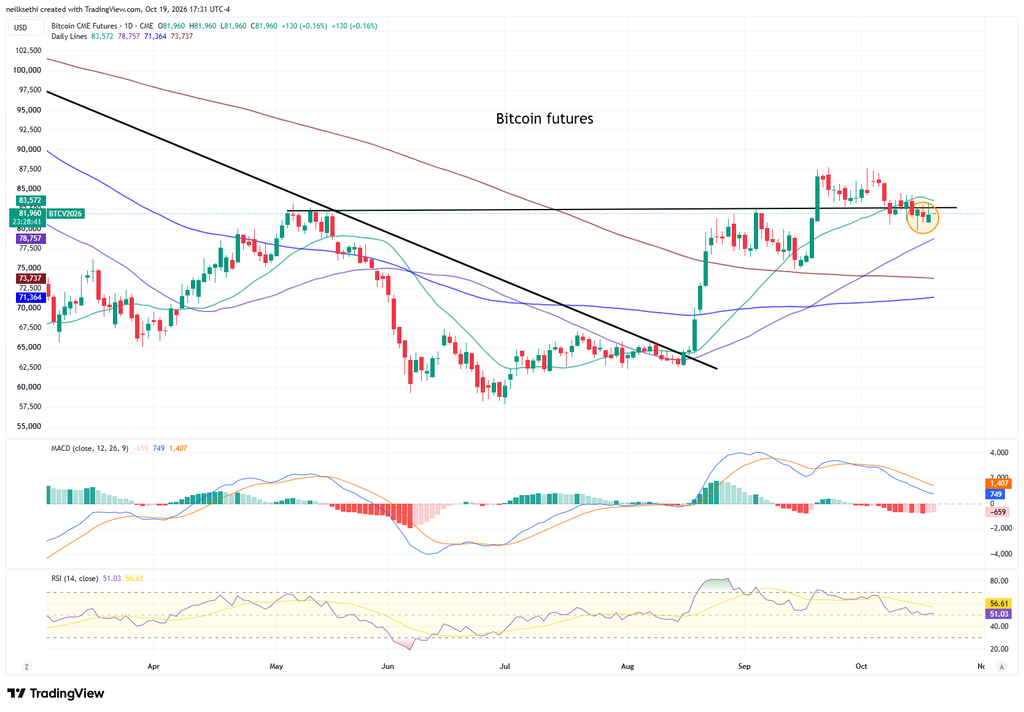
Bitcoin futures, unlike gold, remain under support. Daily MACD still negative, with the RSI around 50.
More From TheStreet Pro:
- Chris Versace –
- Helene Meisler – If You Think the Semis Are Weak, Take a Look at These Stocks
- James “Rev Shark” DePorre –
- Stephen Guilfoyle – A Look Back on a Very Dark Day on the Market
- Bret Jensen – Here’s My Plan If the Startled Market Is Overcome With Fear
And From Me If You Missed It:
Miscellaneous:
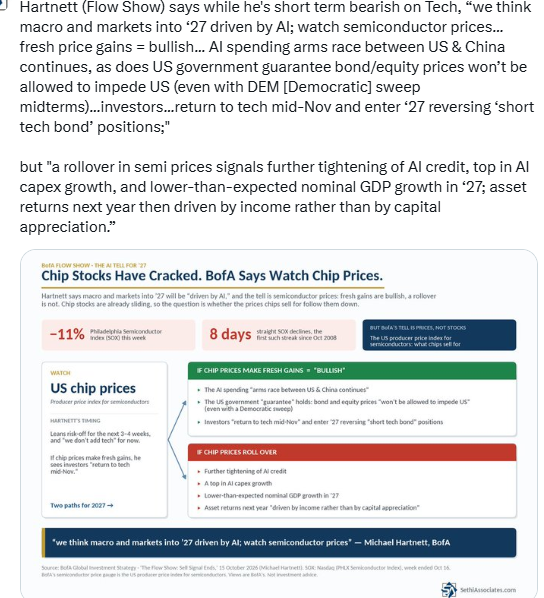
So what does Hartnett like?
“peak yield” beneficiaries, “small cap, REITs, and particularly consumer discretionary.” Investors are the most underweight discretionary since July 2008 per BofA’s October Fund Manager Survey.
The logic: “bond yields declining in Oct = equity breadth to improve in Q4,” and there’s plenty to lift. 355 S&P 500 stocks are 10% or more below their 52-week highs, 188 are 20% or more below, and 93 are 30% or more below.
But “don’t add tech.” Investors are the most overweight since August 2020, and an “AI bubble in ‘27 [is] now consensus.” He does see investors returning to tech by mid-November. Longer term, BofA says stay long gold, commodities and emerging markets.

Wrap-Up – A Bounce or Something More?
As I noted Sunday:
All the negativity has my contrarian impulses on high alert (I have traditionally liked to go against the grain), but I have a tough time going against both DB and Rubner, and the Goldman prime desk are no dummies. So for now, I will maintain my cautious stance on the Tech trade while being more aggressive with stocks outside of the Tech area which I have increasingly been doing the past couple of weeks as chart setups germinate.
…
And we still haven’t seen much short-covering in bonds which would add fuel to the rotation. But of course any push higher in yields could just as easily stall it out.
…
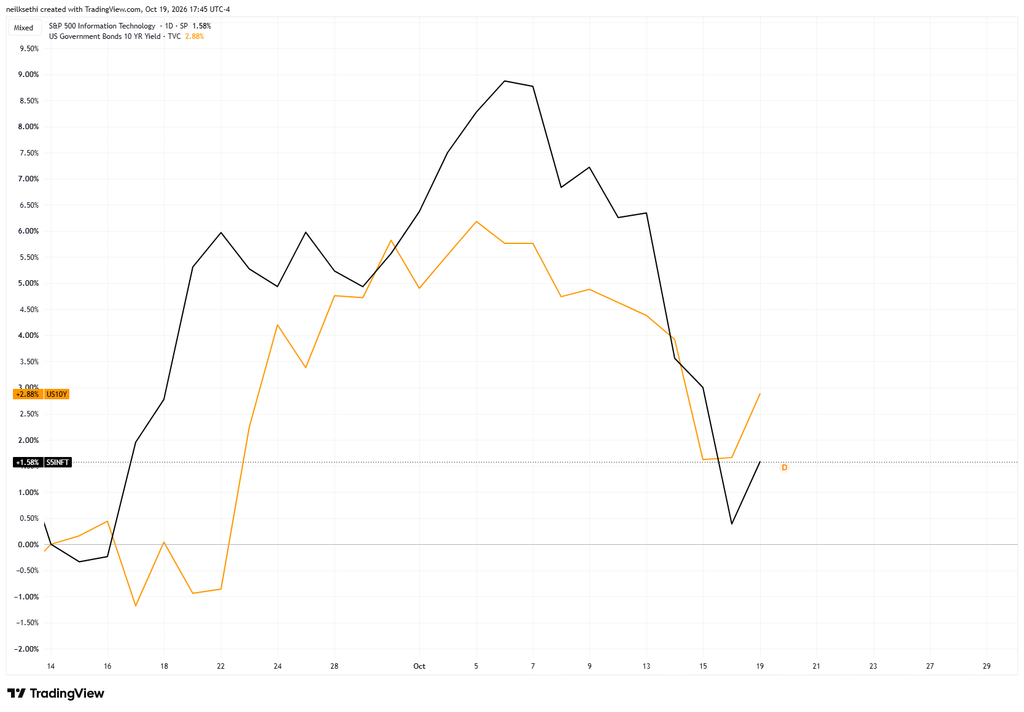
Although I would be remiss not to note that a rebound in Tech may come along with a rebound in bond yields given the tie between the two identified earlier. So AI worries are doing double duty: weighing on Tech while pulling yields lower despite hot inflation, fueling leadership in rate-sensitive and defensive sectors like Utilities, Health Care and Staples.
And sure enough, we did get a bounce in Tech (which is not unexpected given the severity of the losses), but for now it’s just that. After a decline like we have seen this month, it takes more than one or two days to establish a new trend. So, for now, I will retain my cautiousness on Tech, although we’ll get a test of sentiment tomorrow with SpaceX ahead of Meta on Wednesday.
Another notable from today is we did see a rise in yields come along with the Tech bounce, so the strong positive correlation between Tech and 10-year yields continues. That means to the extent we see more days like today (strong Tech, strong yields) we likely will see weakness elsewhere, keeping us in Helene’s “either/or market”.
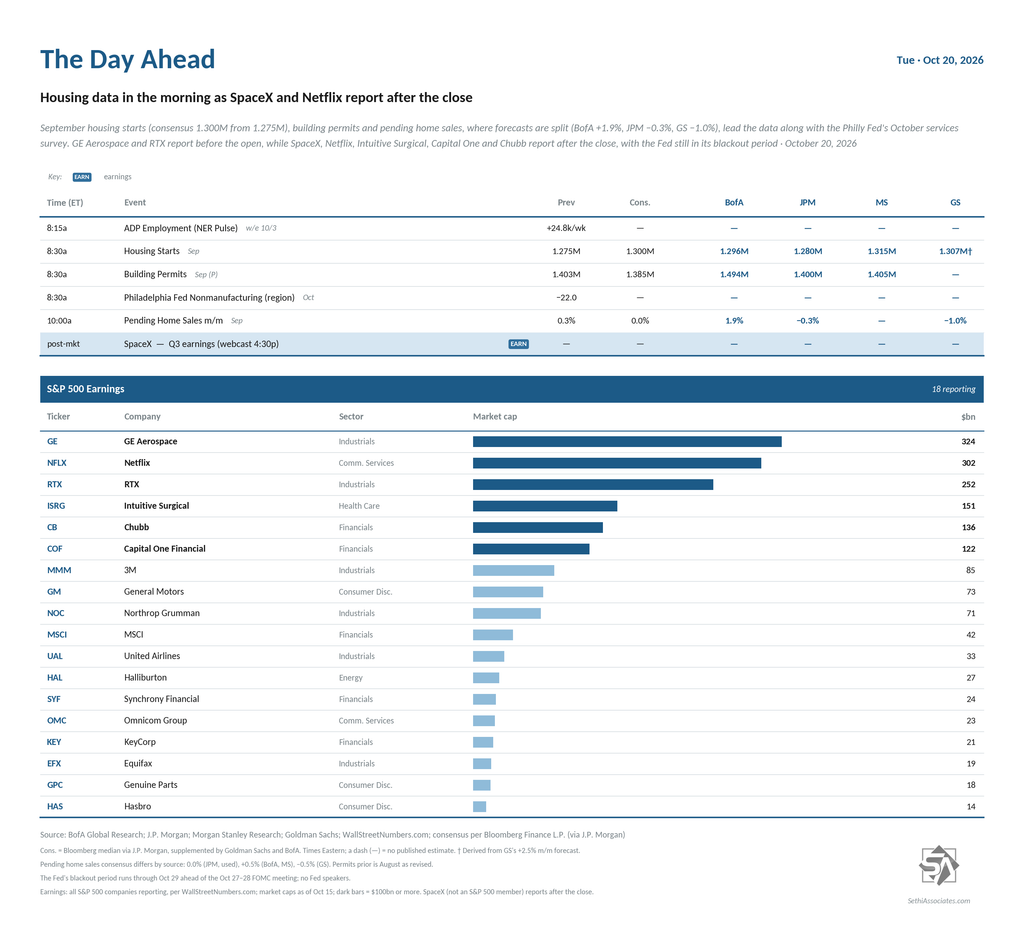
The Day Ahead – Another Light Day on the Calendar
US economic data turns to housing with September housing starts and building permits along with September pending home sales. We’ll also get the Philly Fed’s October nonmanufacturing survey and the weekly ADP report.
The Fed remains in its blackout period ahead of next week’s October 27–28 FOMC meeting.
No non-Bill (>1yr in maturity) US Treasury auctions, with the next a $13bn 20-year bond reopening coming Wednesday.
Q3 earnings season continues though with 18 S&P 500 components: GE Aerospace (GE), Netflix (NFLX), RTX (RTX), Intuitive Surgical (ISRG), Chubb (CB), Capital One (COF), 3M (MMM), General Motors (GM), Northrop Grumman (NOC), MSCI (MSCI), United Airlines (UAL), Halliburton (HAL), Synchrony Financial (SYF), Omnicom (OMC), KeyCorp (KEY), Equifax (EFX), Genuine Parts (GPC) and Hasbro (HAS).
Outside the S&P 500, SpaceX (SPCX) reports after the close.
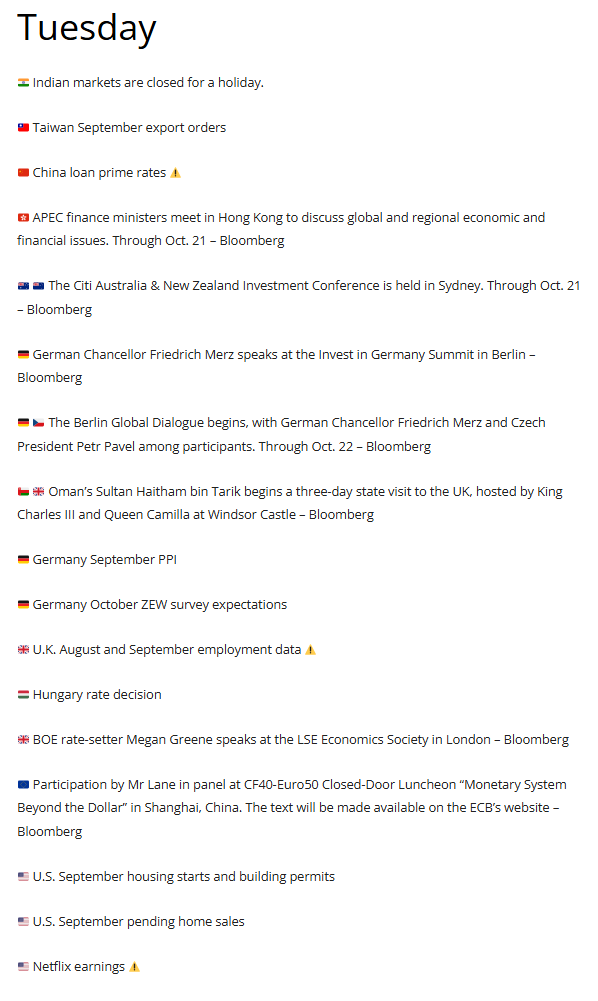
Ex-US highlights are China 1-yr and 5-yr loan prime rates, UK August average weekly earnings, unemployment rate, September jobless claims change, Germany September PPI, October Zew
survey, Italy August current account balance, Eurozone October Zew survey, August ECB current account, construction output. India is closed for a holiday.
From Christophe Barraud’s international Week Ahead rundown:
At the time of publication, in terms of equities mentioned, Sethi was short WDC, long AMZN, PLTR, NFLX, SPCX, SPY, RSP, CPER, and numerous equities in the energy sector.
As a reminder comments are encouraged. If they are directed at me, please put @NeilSethi in front.