Another Day of S&P 500 Losses Saved By Iran Deal Headline
Rumors of a potential deal to open the Strait of Hormuz lifted stocks out of the red, but another rise in yields and oil prices kept them under pressure.
You've reached your free article limit
You've read 0 of 1 free Pro articles.

Note: There will be no evening update Friday as I am visiting my youngest daughter this weekend. The Week Ahead will be out but might be Monday morning.
Quick Summary
US equity indices opened lower again Thursday, again under pressure from rising yields and oil prices. The 30-year Treasury yield hit its highest since 2004, the 10-year its highest since June 2007, and the 2-year since 2024, while oil prices gained after Iranian President Masoud Pezeshkian said his country wouldn’t allow freedom of navigation through the Strait of Hormuz while sanctions and a US blockade remain in place.
Adding fuel to the fire were a chorus of hawkish Fed speakers — including from former more dovish members NY Fed President John Williams and Philadelphia President Ana Paulson — who pushed October FOMC rate hike odds to ~71% with now nearly four hikes priced through the end of next year.
Equities would be saved though by a Reuters report that negotiations between the US and Iran in New York were exploring a path out of war that would involve Tehran reopening the Strait of Hormuz and a lifting of Washington’s economic blockade of Iran. Following the report equities would shoot higher although not able to extend much above the flat line.
The S&P 500 and Nasdaq would finish the day roughly unchanged, the Russell 2000 -0.1%, and the Dow Jones Industrial Average -0.3% (its third straight loss).
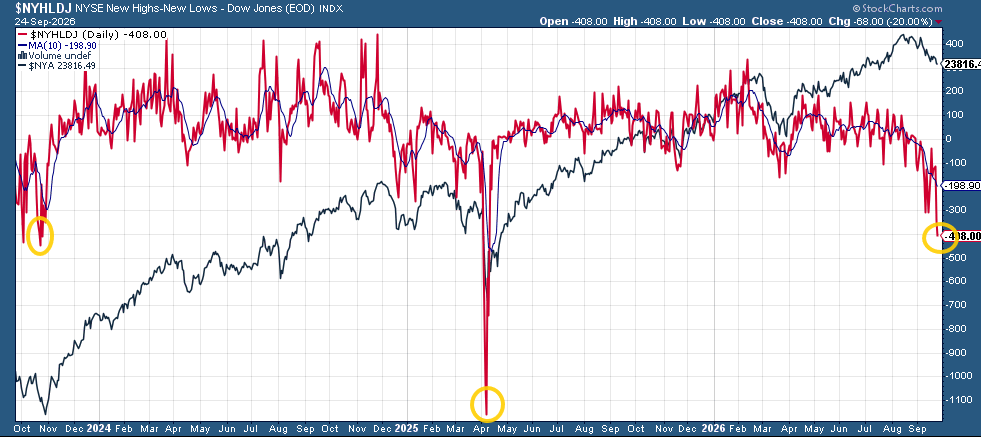
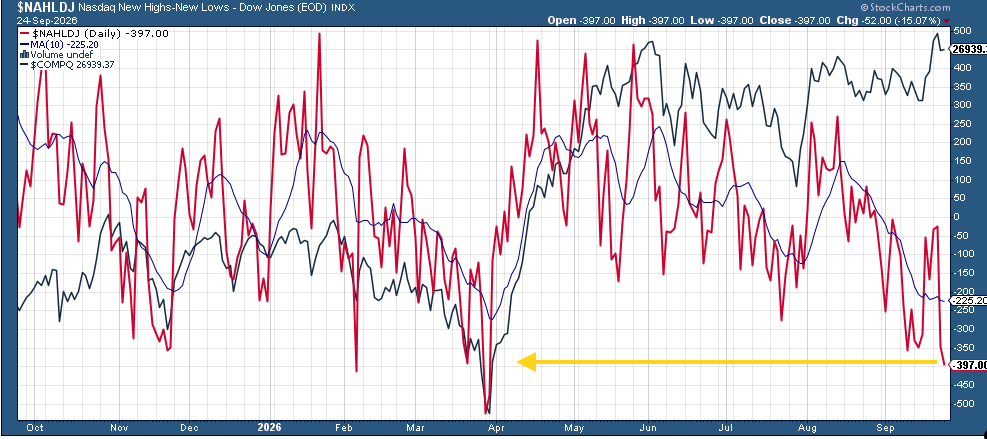
Breadth improved to 4 of 11 sectors higher (from just 1 Wednesday) but things were weak under the surface with the ratio of new 52-week lows to new 52-week highs hitting the lowest level since April 2025 on the NYSE and this last April on the Nasdaq.
Market Commentary
Equities:
- “We are firmly set up for higher yields in this environment,” said Byron Anderson at Laffer Tengler Investments. “Rate hikes do not solve Iran, oil, the AI boom, or inflation. They do increase borrowing costs for everyone else in the market, which will eventually hit labor and the consumer if the Fed gets aggressive with hikes.”
- “Another week of low jobless claims reaffirms the resilience of the labor market and reflects the underlying strength of the near-term economic outlook,” Jim Baird, chief investment officer at Plante Moran Financial Advisors, said in emailed commentary on Thursday. “At the same time, labor market strength reinforces the growing expectation that the Federal Reserve has ample room to raise rates further until policymakers are convinced that inflation is on a path back to 2% in an acceptable timeframe.”
- Policy tightening is likely to be less aggressive than current market pricing suggests, according to Ulrike Hoffmann-Burchardi at UBS Chief Investment Office. While recent comments from officials have been hawkish, her base case is for the Fed to raise rates in December before keeping them steady.“So, we continue to recommend positioning for further equity gains while diversifying and managing concentration risk,” she said. “Resilient growth and robust earnings should help markets withstand a measured tightening cycle, while higher bond yields provide opportunities to add portfolio income.”
- Stocks can keep climbing even as rising bond yields raise the bar for earnings growth, JPMorgan Chase & Co.’s Grace Peters said in a Bloomberg Television interview. She identified several forces pushing bond yields higher: strong growth data, supply coming to market to finance AI infrastructure, and inflation fears tied to oil prices above $100. Fixed income still has a place in portfolios, but requires selectivity, she said, instead preferring equities during what she expects will be a “broadening earnings super-cycle.”
- “While solid economic growth and healthy corporate fundamentals suggest interest rates are not yet restrictive enough to derail the expansion, the rapid increase in yields and elevated bond market volatility are creating a more meaningful headwind for equities,” said Angelo Kourkafas at Edward Jones.Any easing of geopolitical tensions that helps relieve pressure on energy prices could go a long way toward stabilizing the bond market, in his view. Until then, Kourkafas believes upward pressure on yields is likely to persist as expectations for additional Fed tightening remain elevated.“Rising yields and higher oil prices are testing market resilience, but strong economic momentum and broad-based earnings growth continue to serve as powerful sources of support,” he added.
Stock and Sector Breakdown:
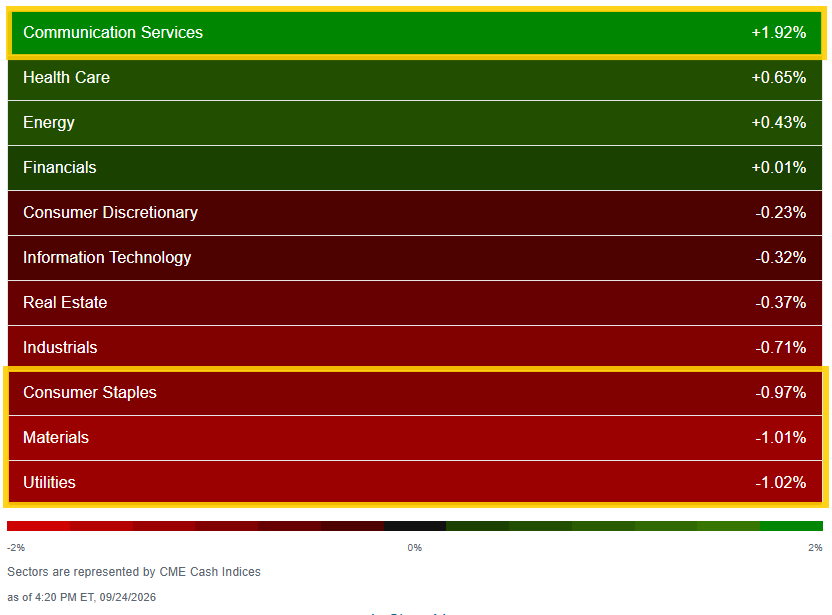
Sector breadth improved to 4 of 11 sectors higher Thursday (from 1 Wednesday but down from 5 Tuesday, 7 Monday) led by Communications +1.9%, the only sector up over +0.7%.
Three sectors though down around 1% or more although all lightweights in Staples, Materials and Utilities. Superheavyweight Tech was -0.3% limiting the damage.
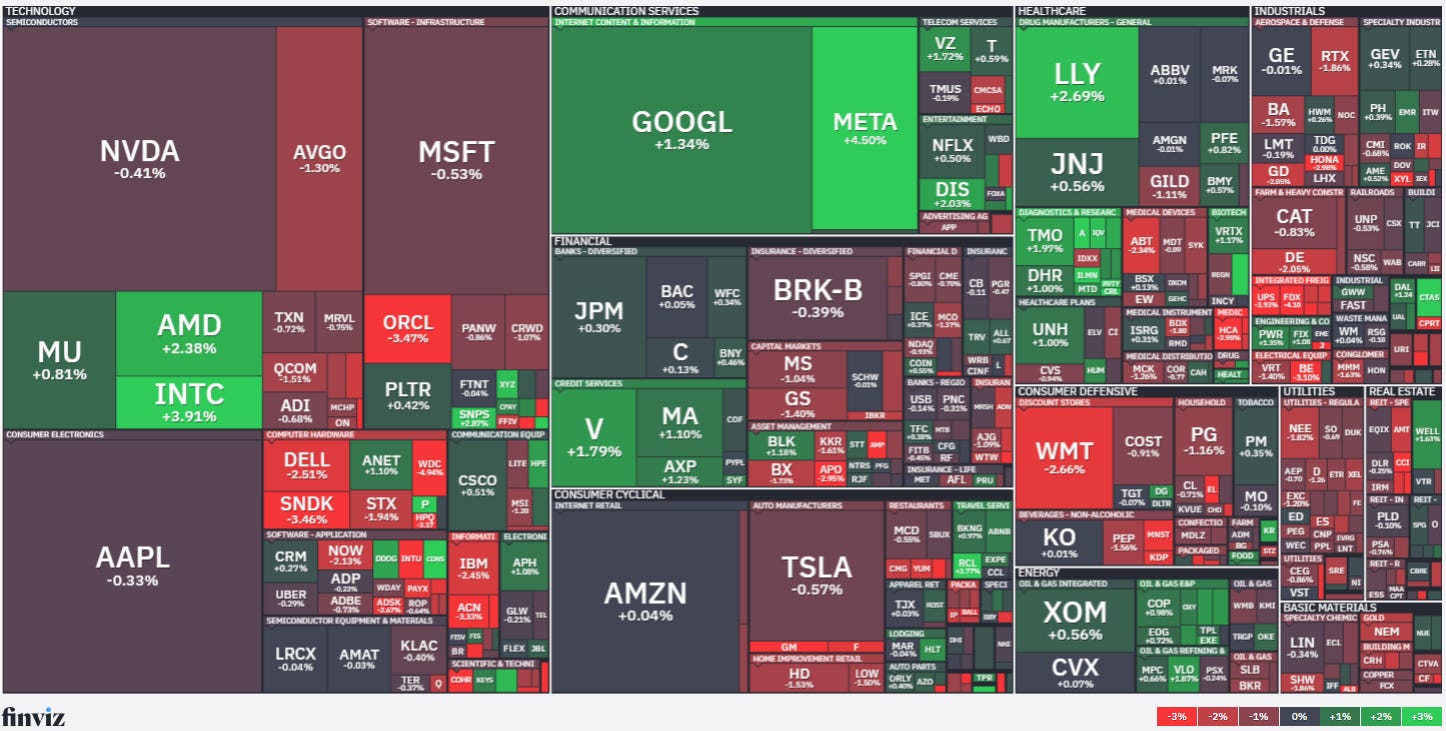
Oracle (ORCL) -3.5% fell after Bloomberg News reported, citing sources, that the company is moving to shield itself from delays related to a massive data center project being built in New Mexico. That saw protection against Oracle debt surge to a record high.
Gen Digital (GEN) -12.1% was the largest loser on the S&P 500 on FT reports that the company was in talks to buy internet service firm GoDaddy (GDDY) +4.6%. Second was MGM Resorts International (MGM) -11.0%, which tumbled after Barry Diller’s People withdrew its proposal to buy the casino giant.
On the other side, Meta Platforms (META) +4.5% continued to build on its recent gains after introducing last night a Muse Charm device and new VR headsets and following a wave of price target hikes from top analysts.
The health care sector was supported by continued strength in Moderna (MRNA) +7.0% and Eli Lilly (LLY) +2.9%.
Everpure (P) +11.2% led all S&P 500 components after an analyst day where the data storage solutions company raised midpoints for FY28 preliminary revenue and operating profit 16% and 36% above consensus, respectively. So many questions. Everpure? Is it in the S&P 500? And it snagged the ticker P? FWIW, it does have a 9 out of 10 rating on TipRanks, so might have to dive into it more.
[Note: chart uses futures prices.]
Despite the flat day, the number of large SPX winners (up over 3%) remained very subdued at just 12, up from 7 Wednesday but down from ~25 Tuesday, ~55 Monday, while the number of large losers (down over 3%) rose to ~35 from ~25 Wednesday, 11 Tuesday. Both of these metrics have remained very subdued the past six weeks rarely getting above 50 and only once above 100.
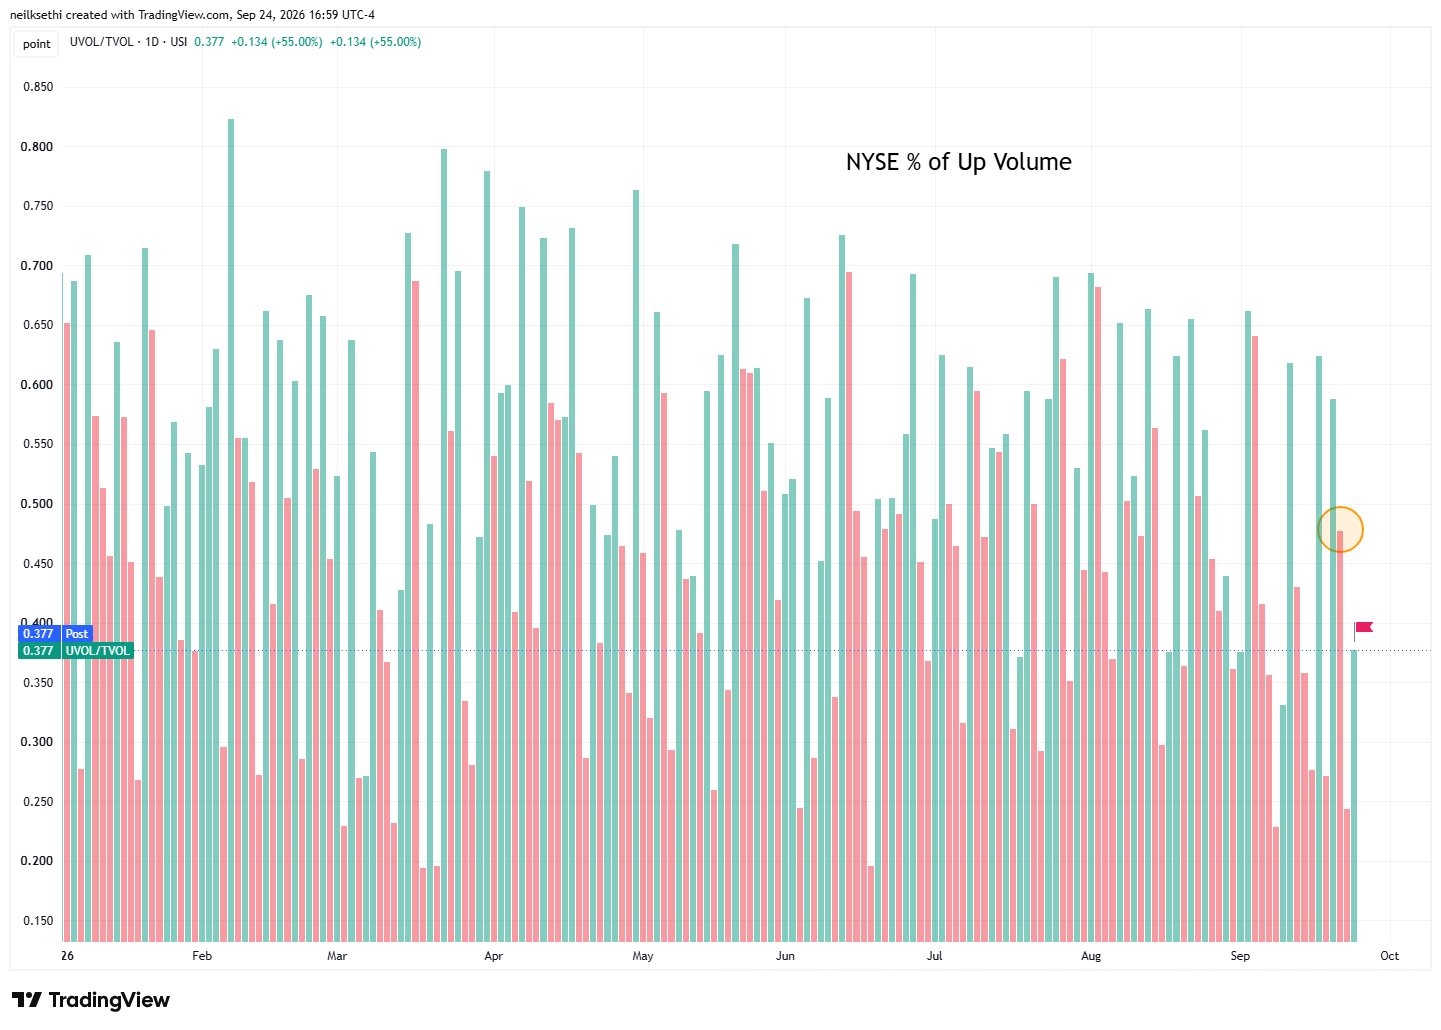
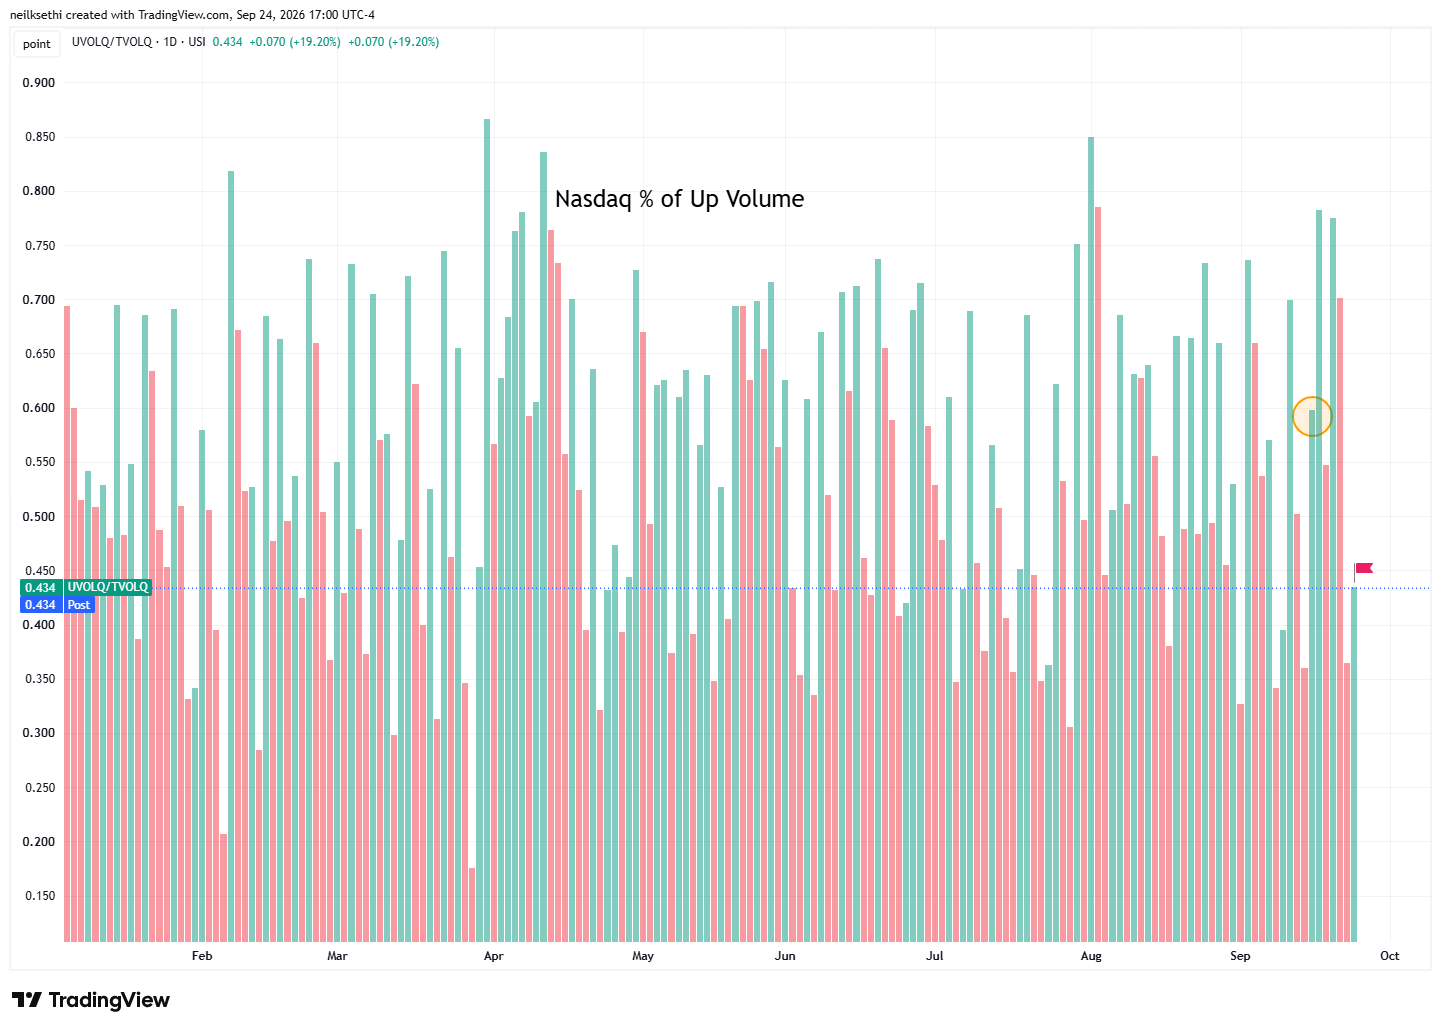
Other breadth metrics were similarly weak. Positive volume (intensity of buying in stocks up on the day) was just 37.7% on the NYSE despite the mild -0.13% loss. Compare to Tuesday when it was 47.7% on a -0.24% loss.
Similarly, on the Nasdaq it was 43.4% on a 0.01% gain. Compare to Sept 16th (circle) when it was 57.2% on a -0.01% loss.
Even worse were new 52-week highs vs lows which dropped to -408 on the NYSE and -403 on the Nasdaq Thursday. The former, outside of liberation day, the least since October 2023, and the latter the least since April (and before that liberation day).
Some other stock-specific commentary from TheStreet Pro today:
- Chris Versace –
- Stephen Guilfoyle –
- Bob Lang – Chart of the Day: Paccar Is Stuck in Reverse
A Look At The Charts
Note on all charts the colored lines are moving averages (the average price over the lookback period — days on the daily charts, weeks on the weekly charts):
20 = green
50 = purple
100 = blue
200 = brownException is monthly charts where blue is 10-month moving average and brown is 20-month moving average.
MACD = Moving average convergence/divergence line, a measure of momentum that compares longer term and shorter term momentum to gauge if a move is strengthening or weakening. This is probably my favorite individual indicator.
RSI = Relative Strength Index (basically what it sounds like) = measures the strength of the move comparing gains to losses over the given lookback window (I use the standard 14 periods).
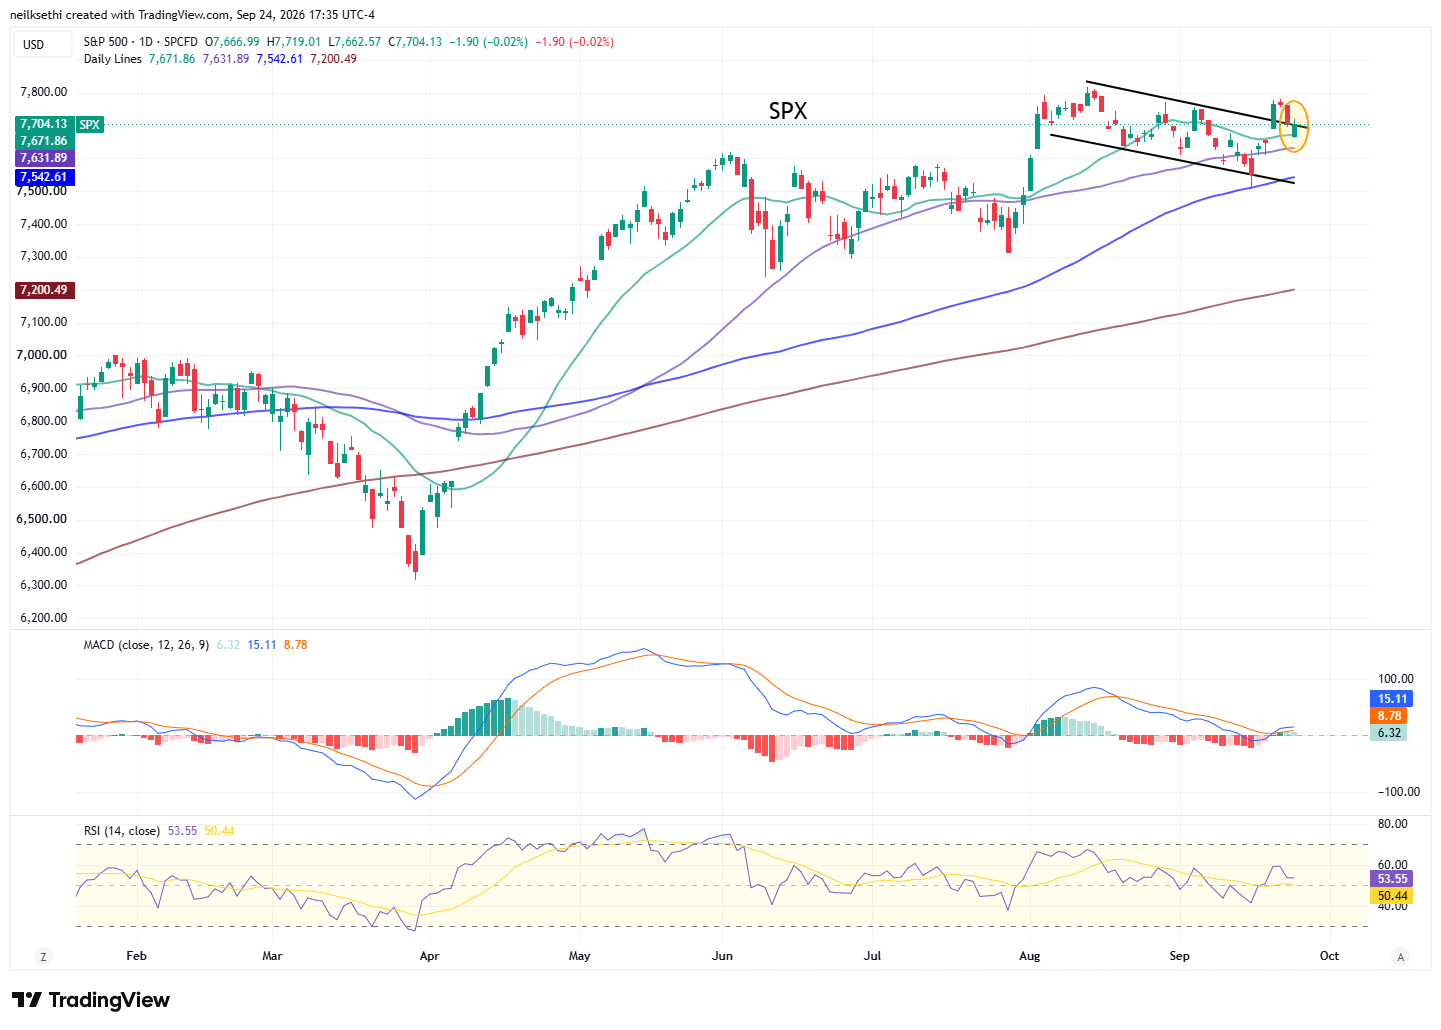
SPX ended unchanged after having fallen back into its downtrend channel earlier in the session. The daily MACD remains in a “go long” positioning, and the RSI over 50.
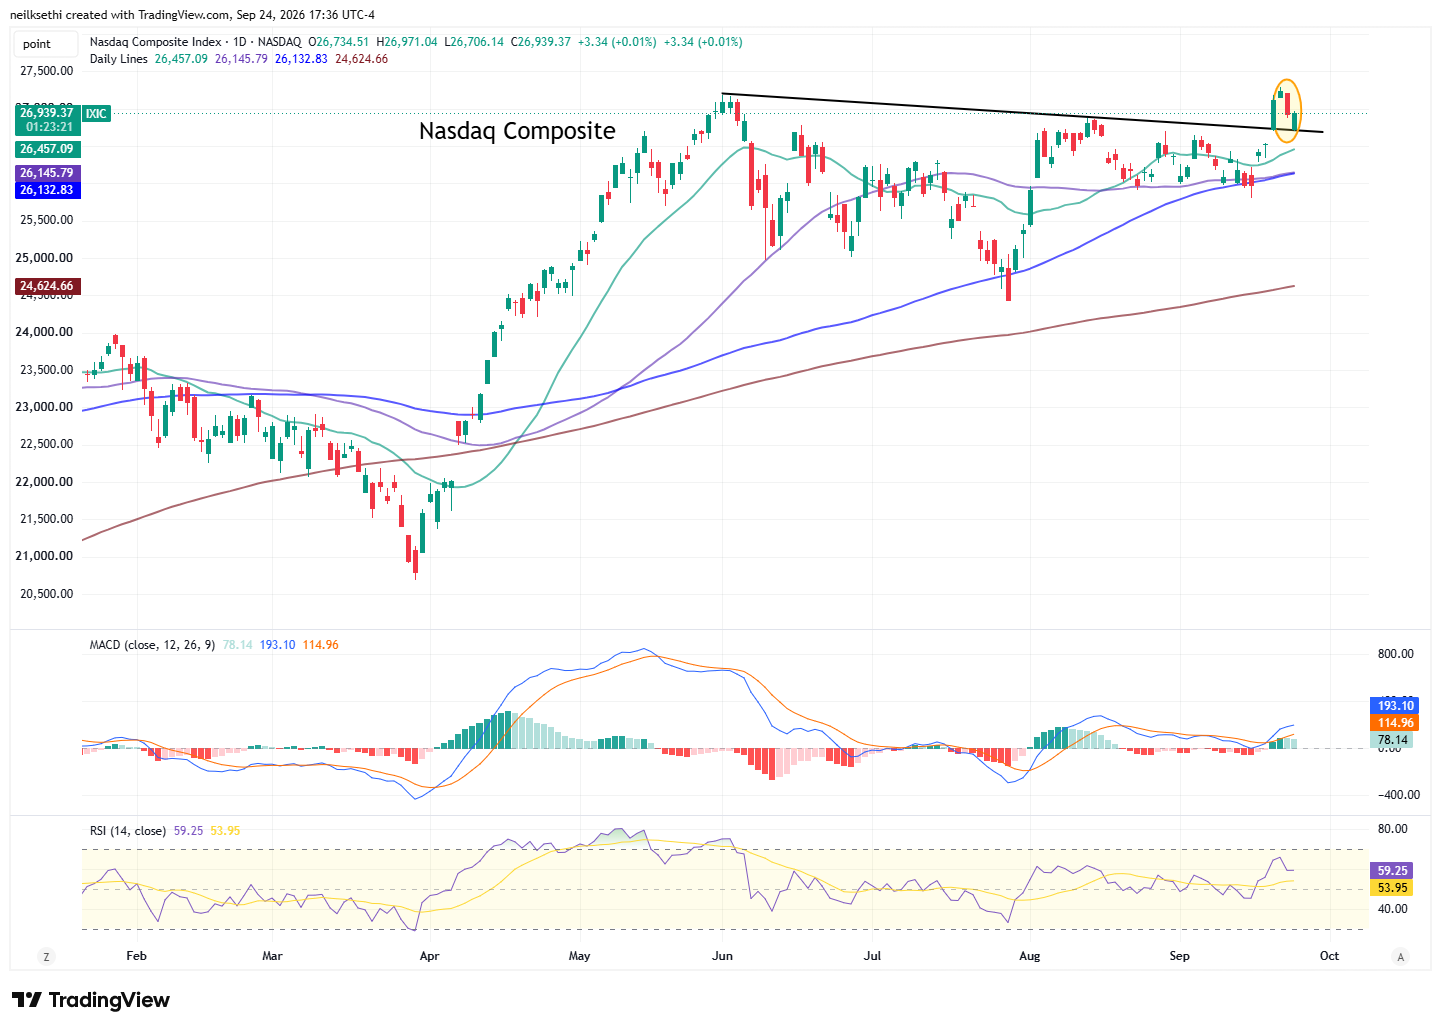
Nasdaq Composite tested its former resistance but it held and has a stronger chart.
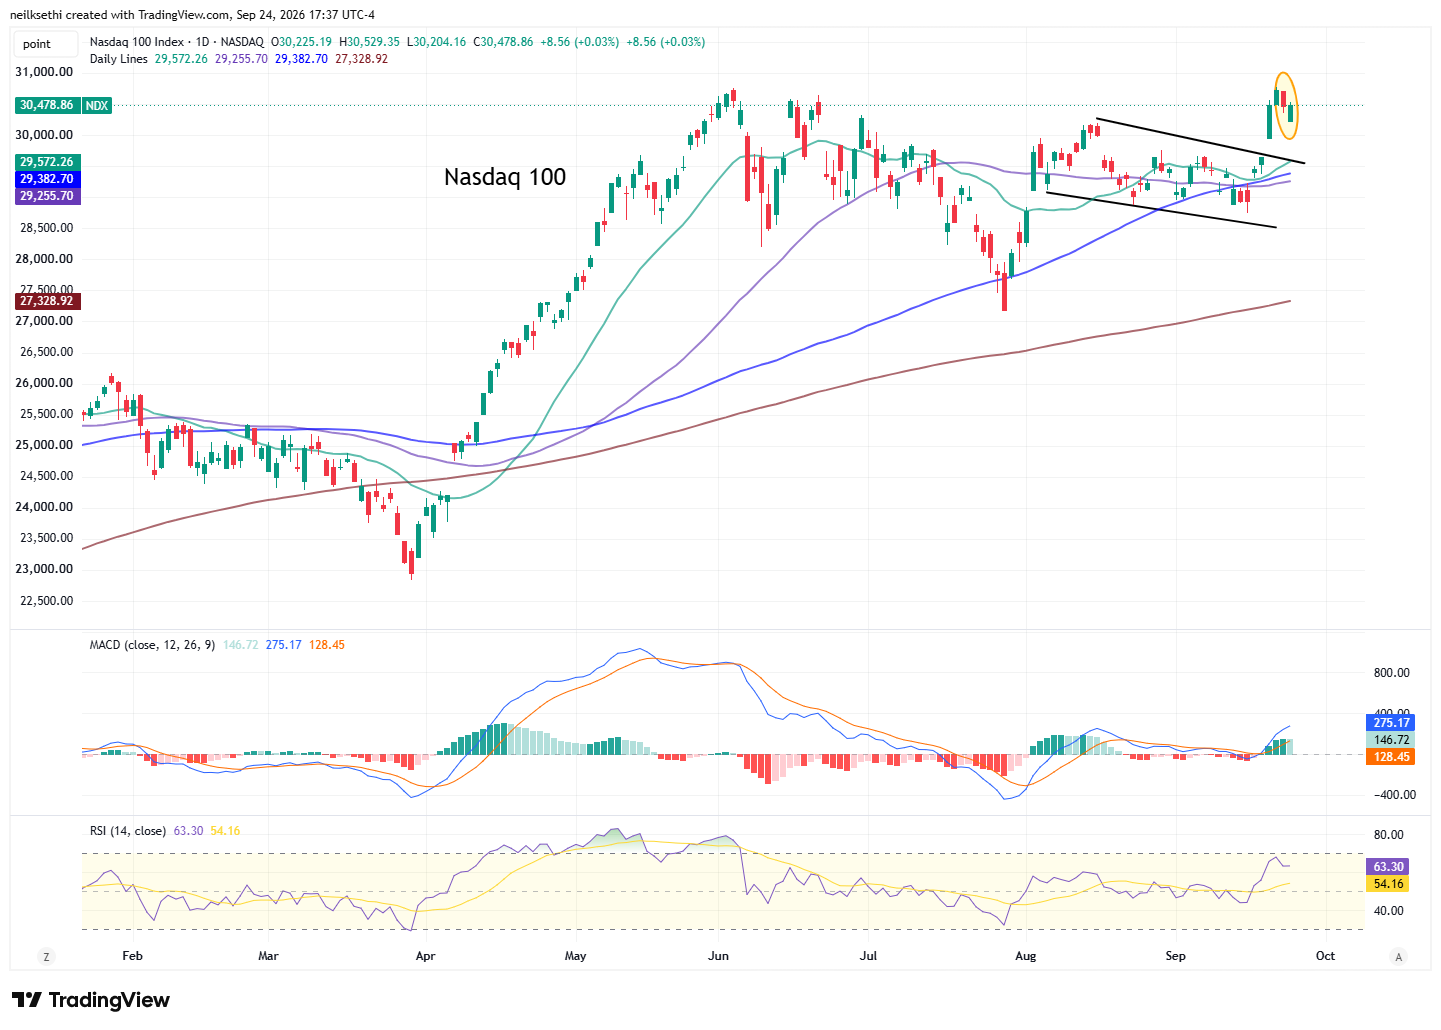
The Nasdaq-100 (QQQ) closed slightly higher. Daily MACD and RSI also positive here.
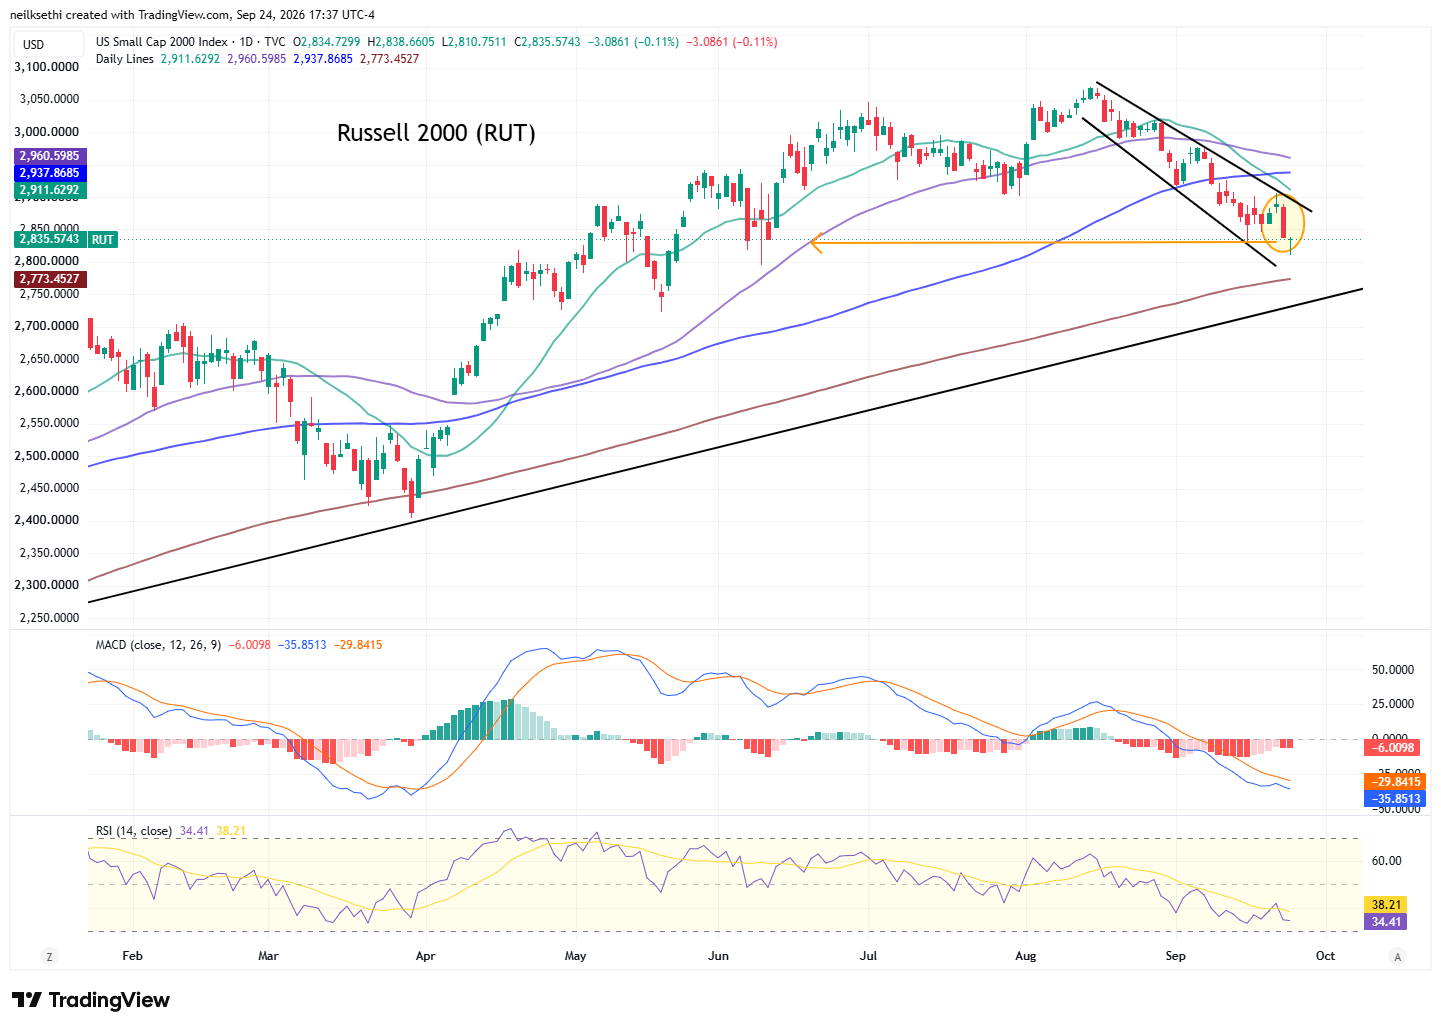
The Russell 2000 (RUT) I said three weeks ago was “much more problematic,” and that remains the case as it fell to the lowest close since June 10th and also broke last Wednesday’s intraday low. Its daily MACD remains in “go short” positioning, and the RSI back under 40. Getting closer to that test of the 200-DMA I mentioned a week ago.
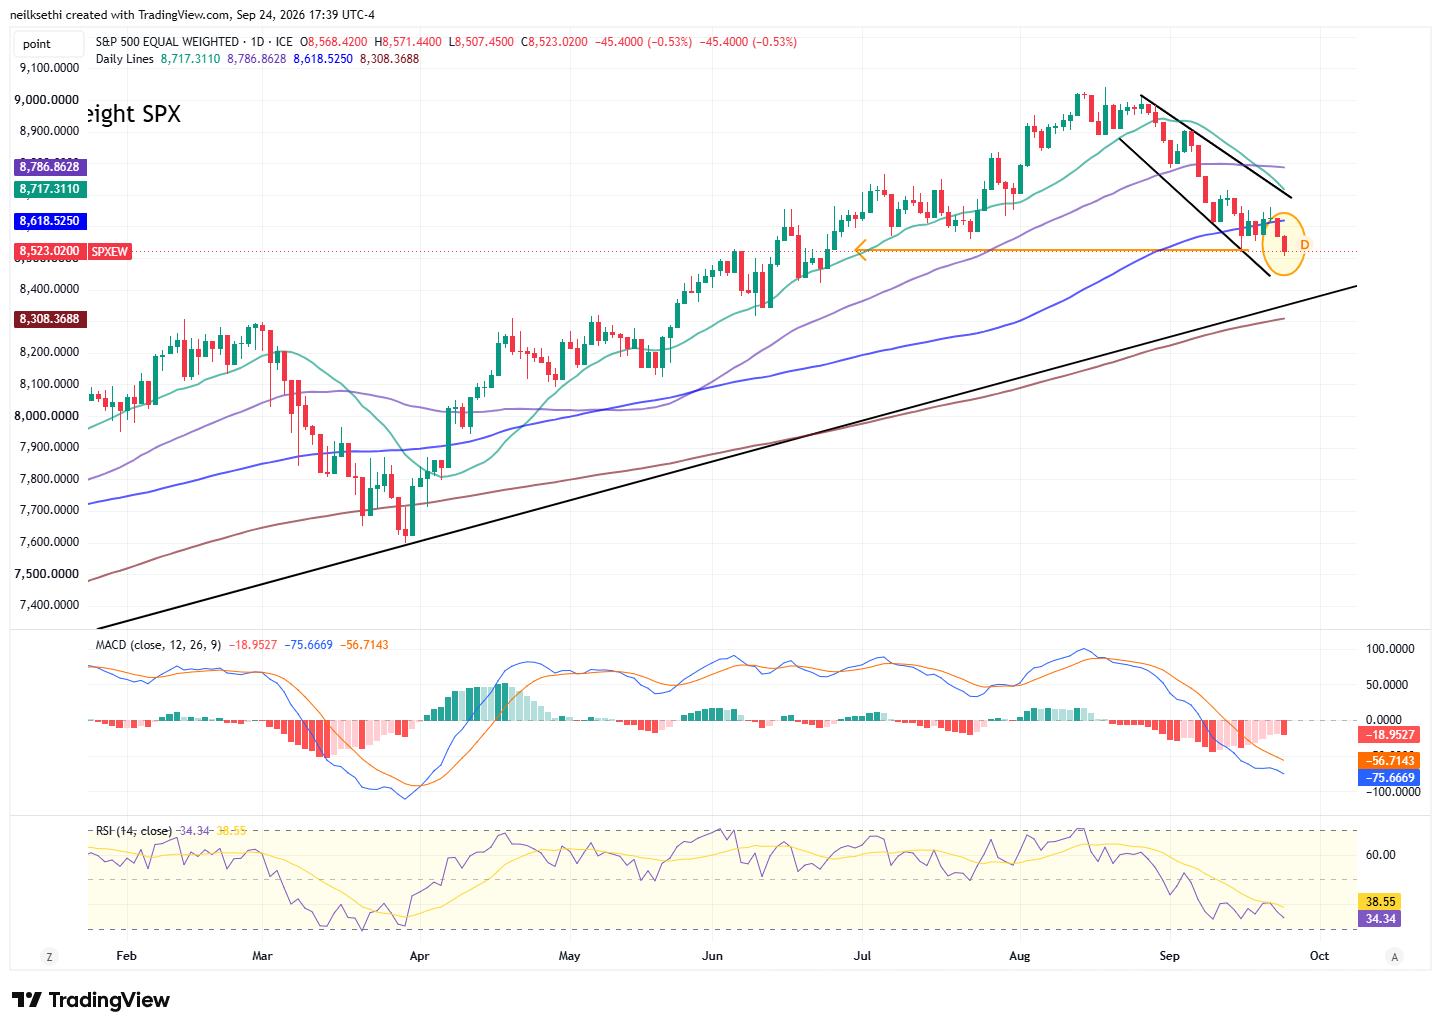
The equal-weighted SPX I said last Wednesday is “back to concerning.” I mentioned early last week “I did take off most of my holdings in (RSP) for now. I’ll be looking for a tradeable bottom to form.” Like the RUT it broke last Wednesday’s intraday low. Daily MACD and RSI are still weak. Has some room to get there, but that uptrend line/200-DMA area might be the place for a buy.
Treasury yields rose again across the curve in a bear steepening (longer maturity yields up more than shorter):
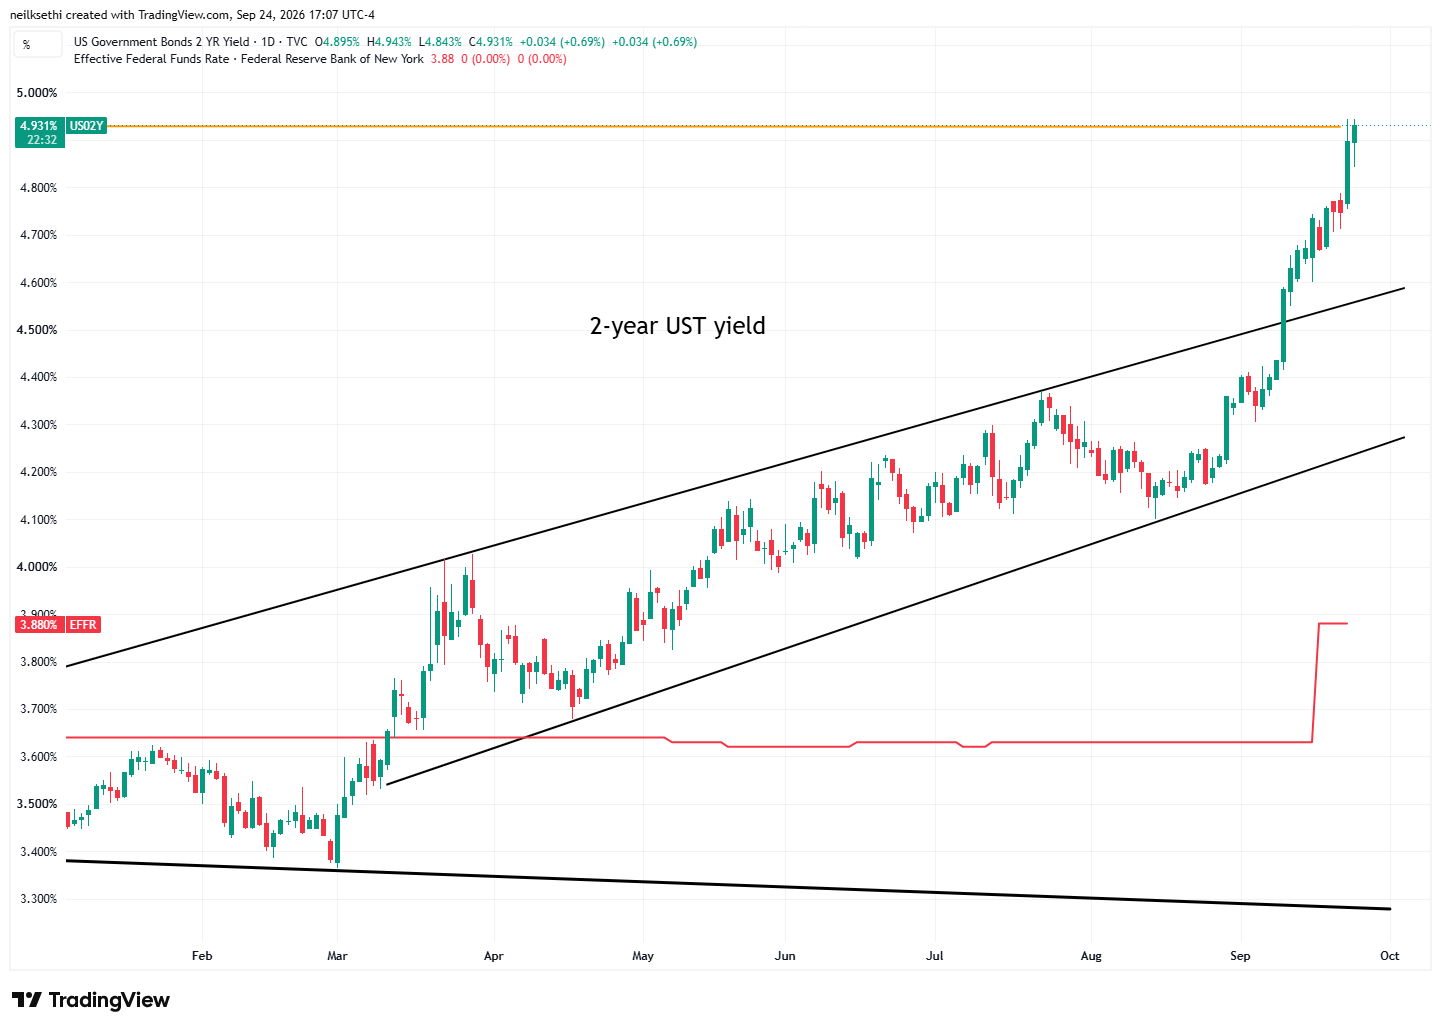
The 2-year Treasury rose 3 basis points after 15 Wednesday to the highest since May 2024 (including after-hours).
It is now ~114 basis points above the Effective Fed Funds rate, so still screaming for (a few) more rate hikes.
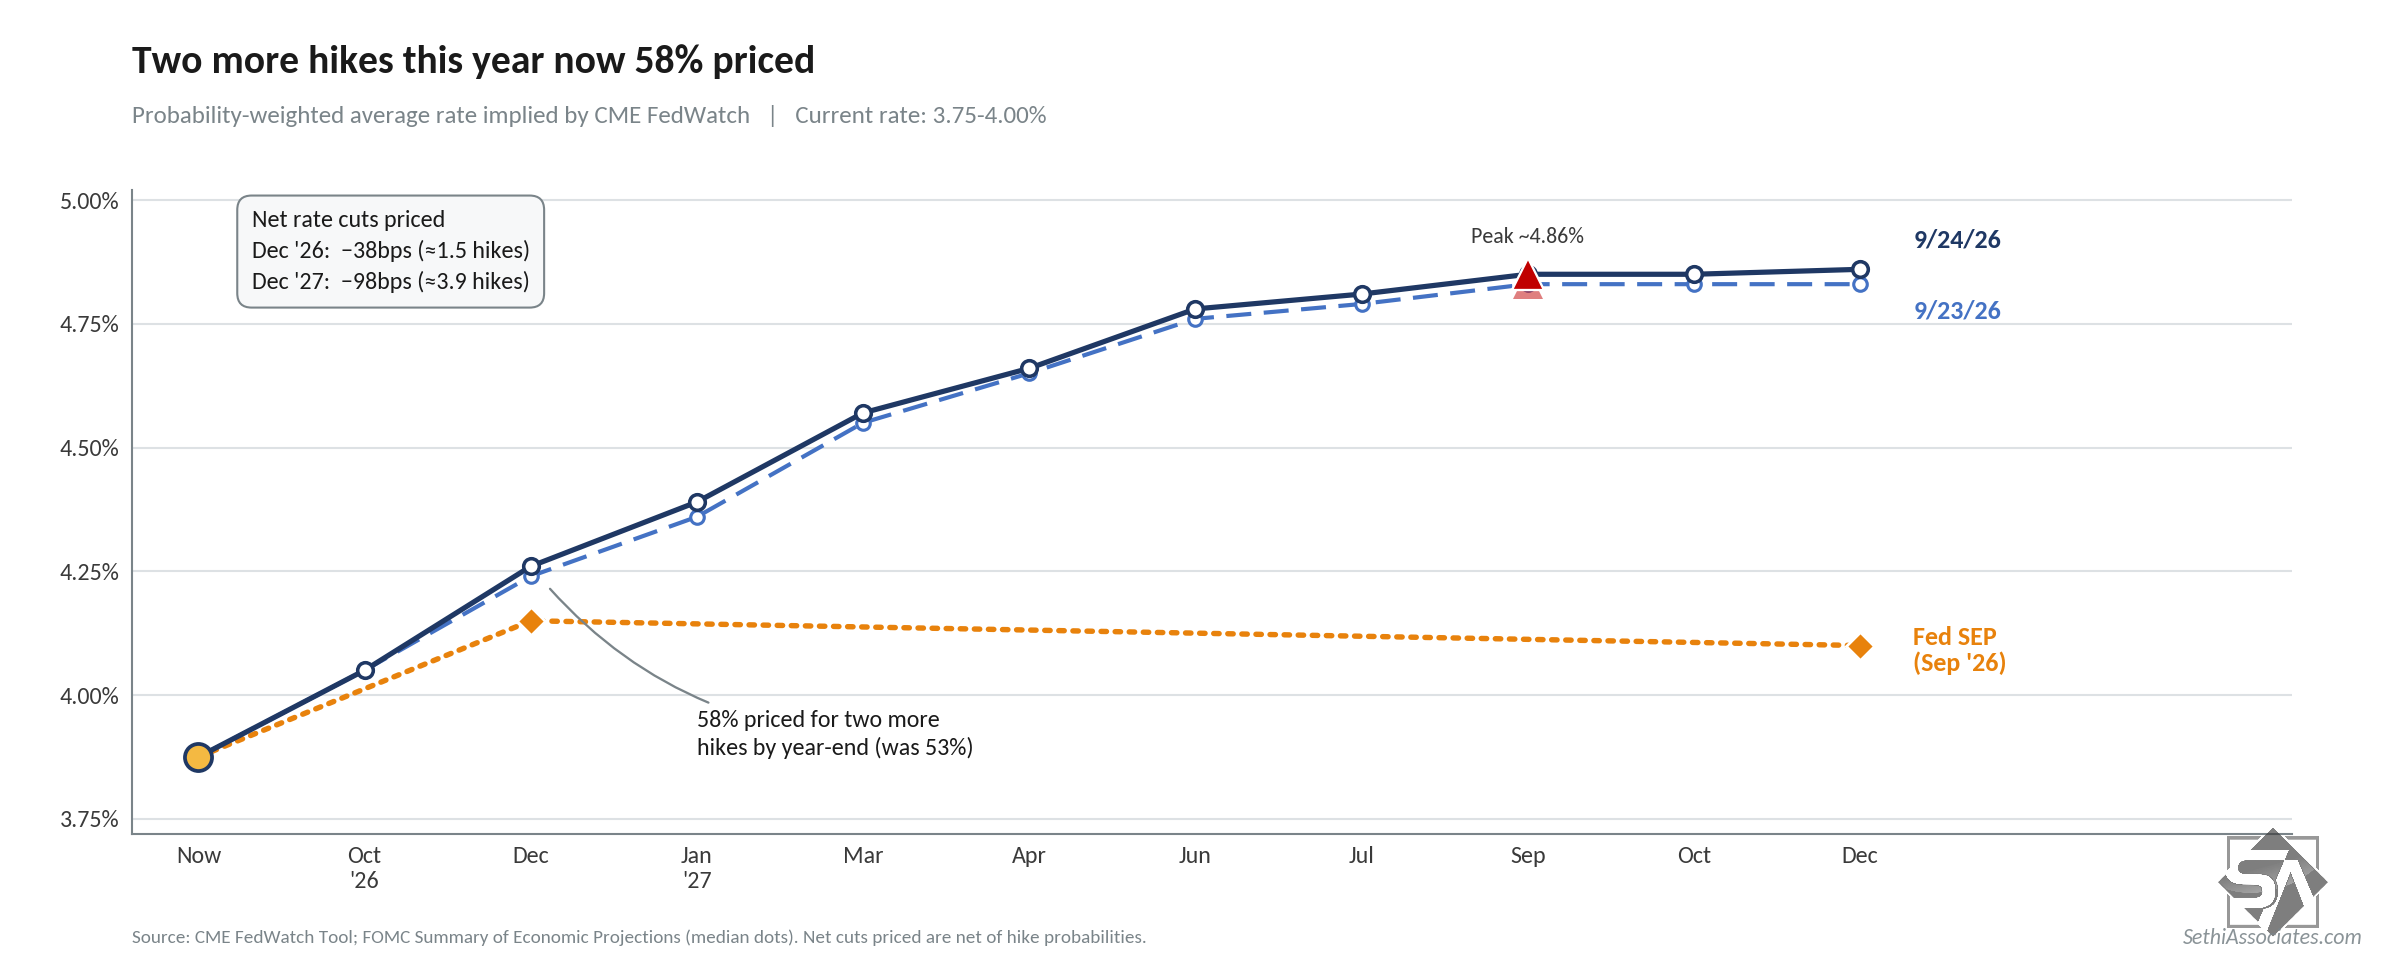
In that regard, Fed fund futures from CME’s Fedwatch tool remained elevated with the chances for an October hike now 71% and two hikes this year at 58%. Two additional hikes are almost fully priced for 2027 (98 total basis points priced through YE 2027 up from 78 Tuesday).
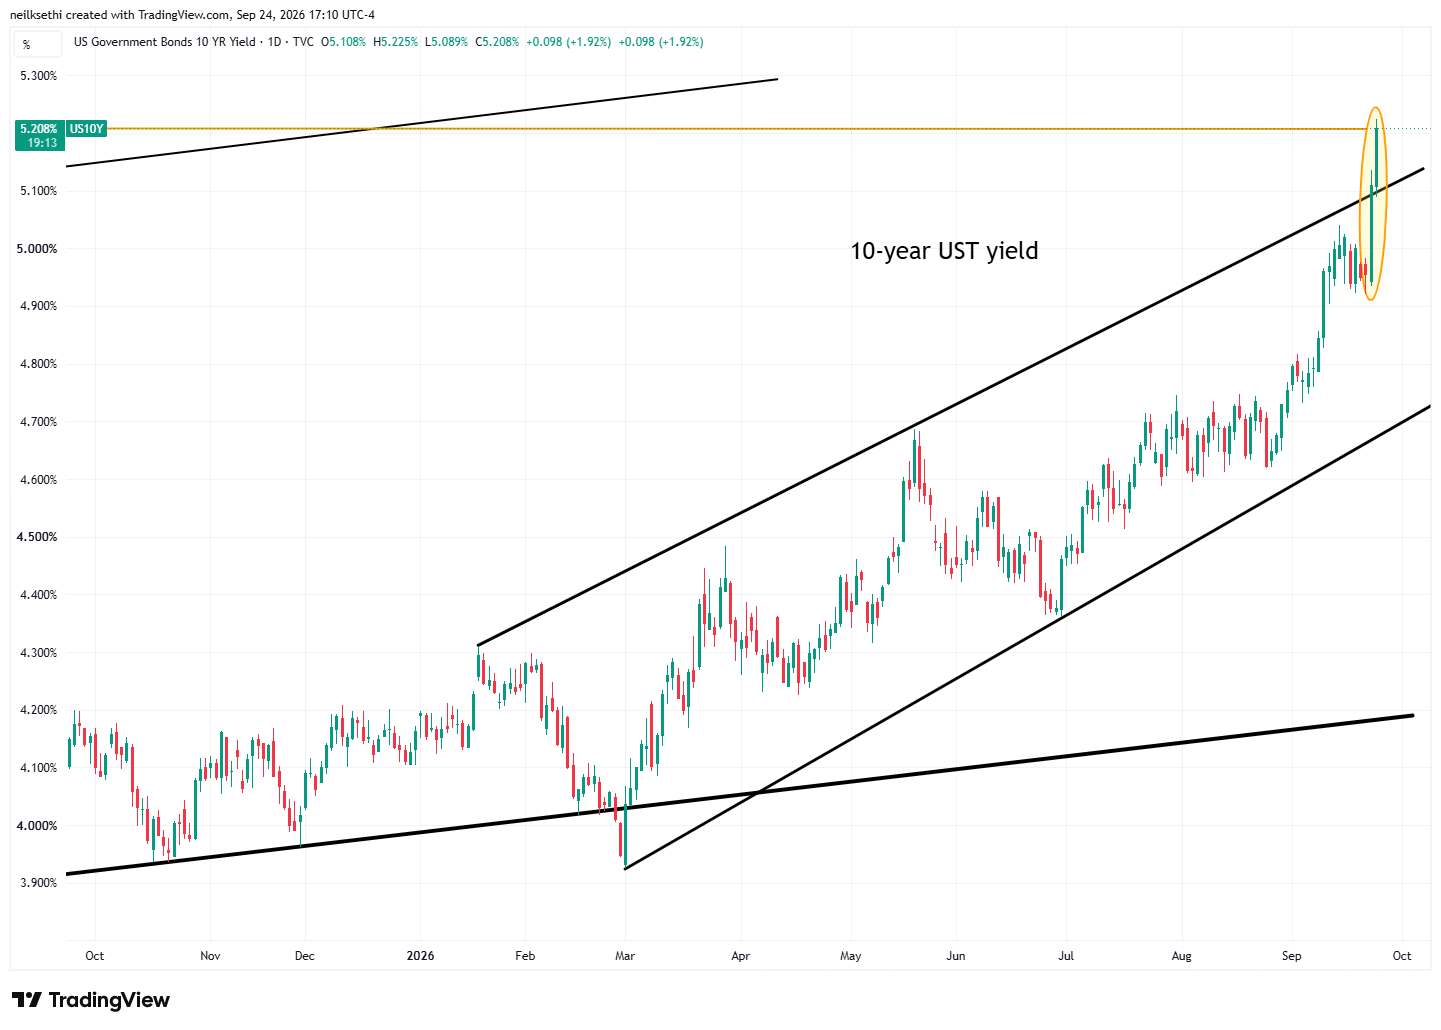
10-year yields up another 10 basis points after 15 Wednesday to 5.21% including the after-hours session, the highest close since June 2007. It’s now pushing further above its channel even more extended.
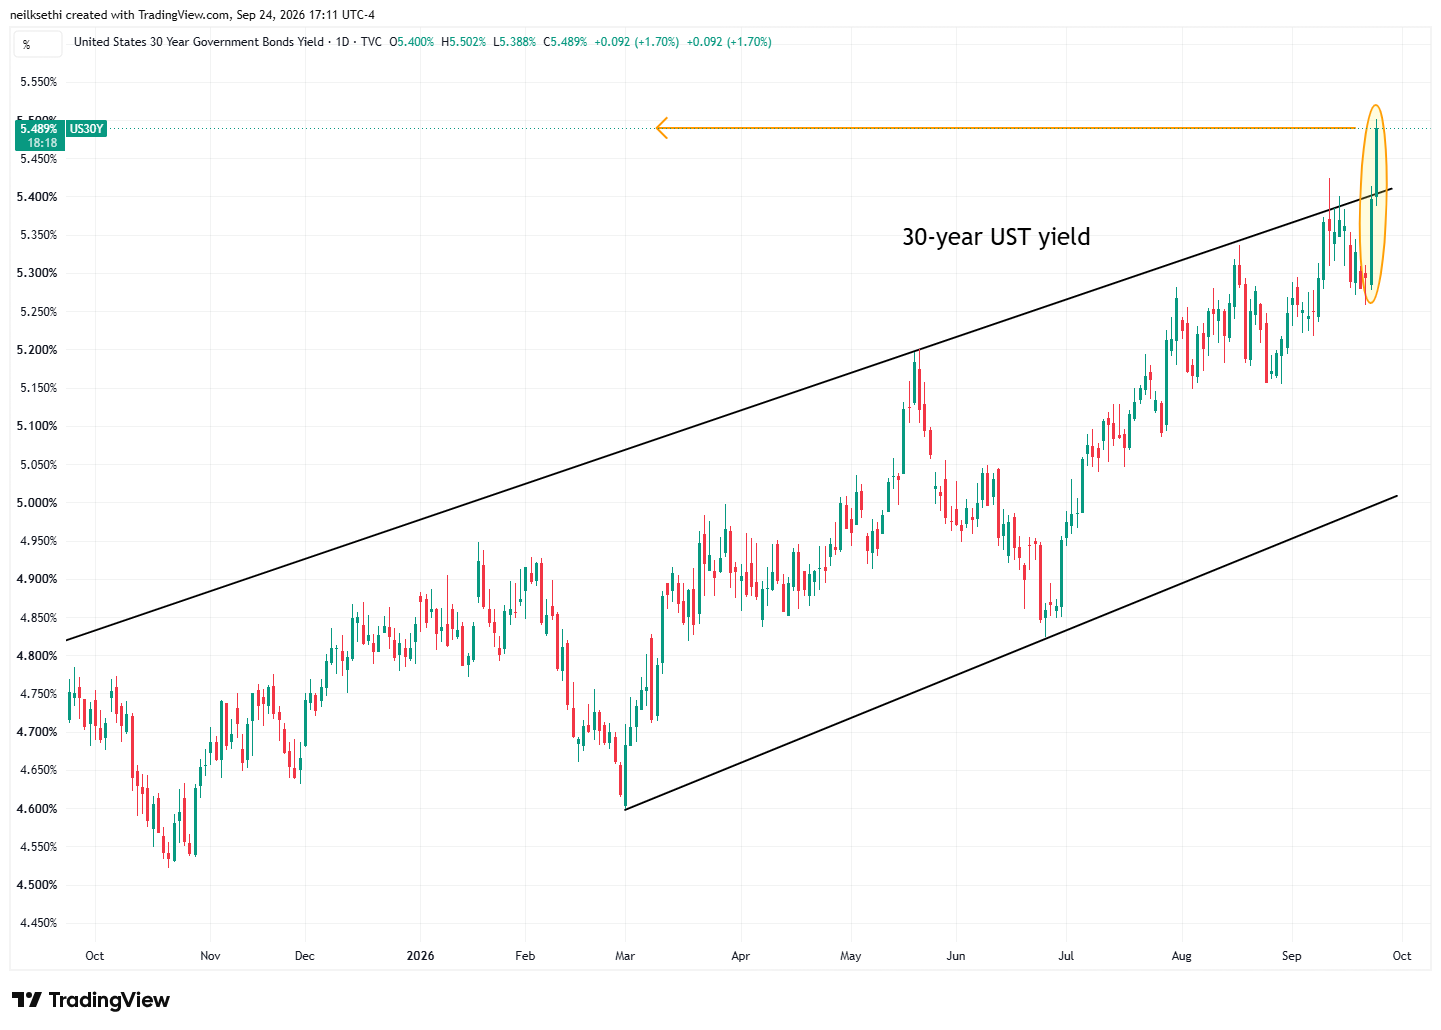
30-year yields up 9 basis points after 10 Wednesday ending after hours at 5.49%, the highest close since 2004 and also above the top of its channel.
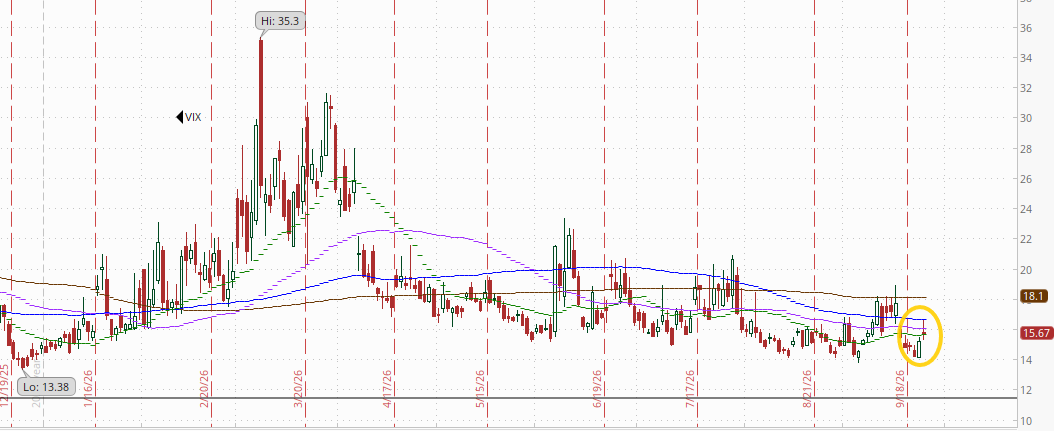
VIX up for a second day to 15.7, still fairly tame. That’s consistent with ~0.98% average daily moves in the SPX over the next 30 days.
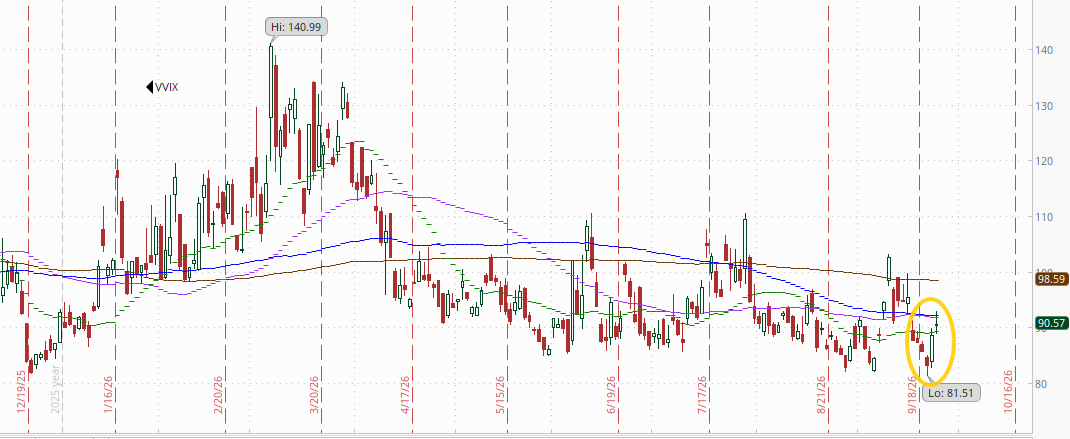
The VVIX (VIX of the VIX) also up to 90.6 also remaining relatively subdued.
The current level is consistent with “moderate” daily moves in the VIX over the next 30 days (historically, normal is 80-100). Above 100 is the level flagged by Charlie McElligott as indicating higher stress.
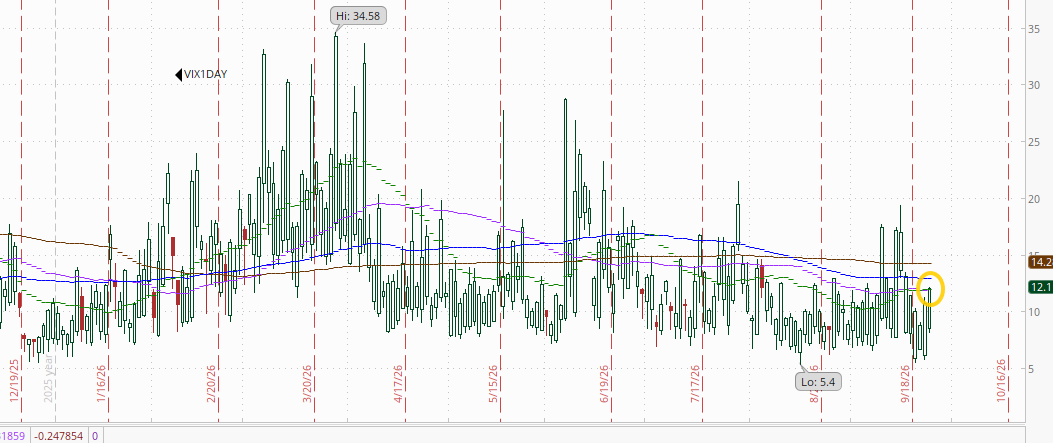
The 1-day VIX also up to 12.1. The current reading isconsistent with a move of 0.77% in the SPX next session.
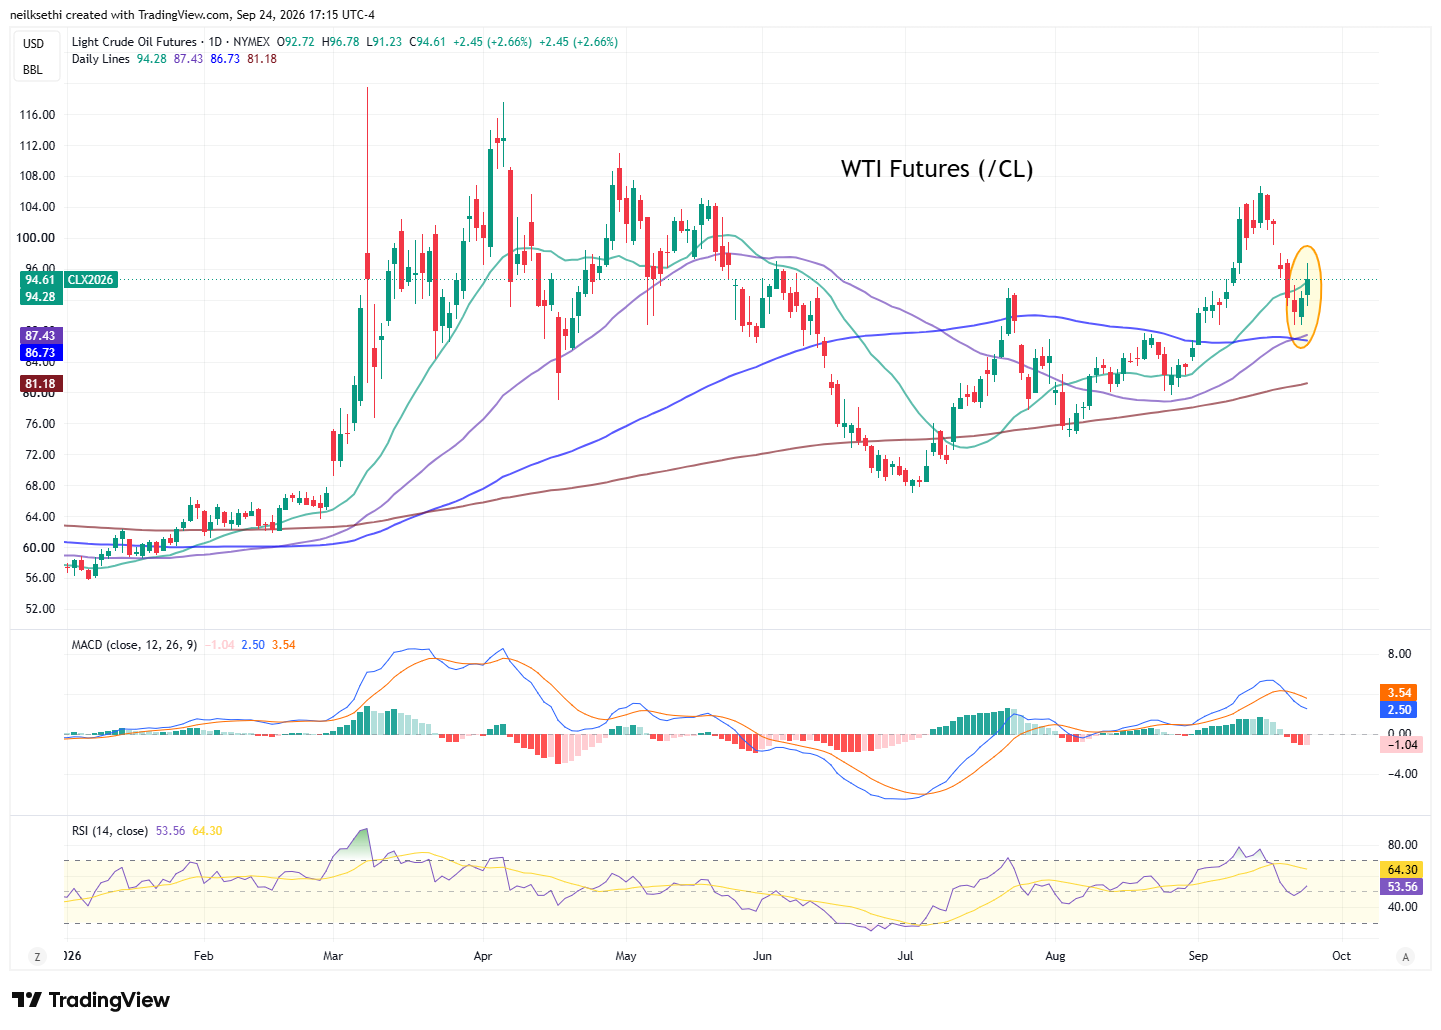
WTI futures (/CL) up for a second session after breaking a five-session losing streak.
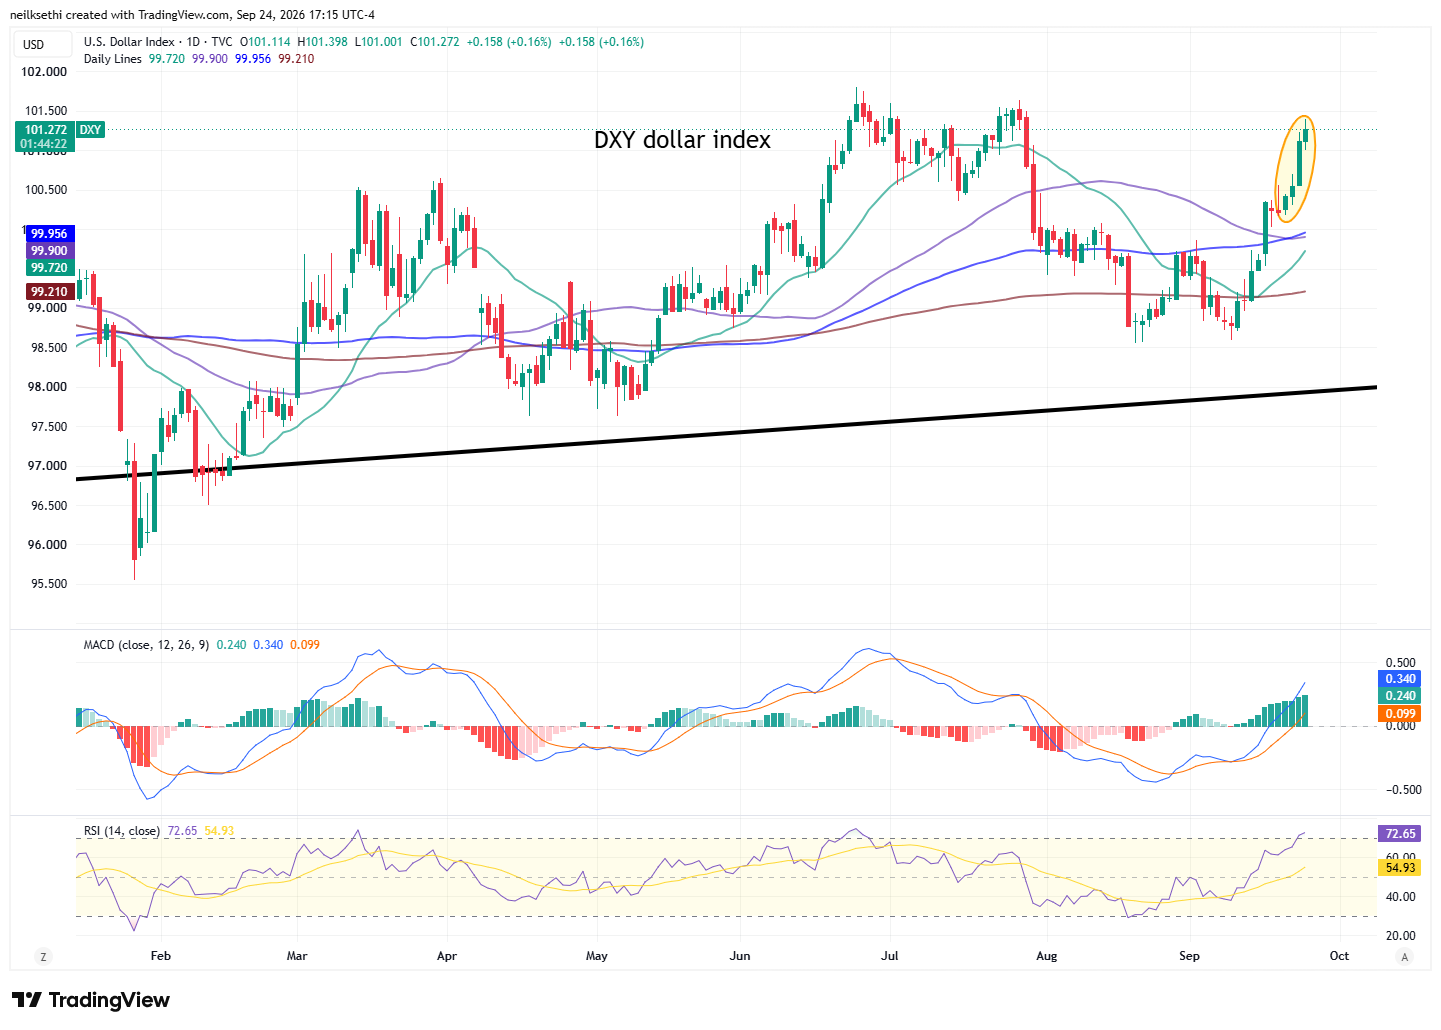
The DXY dollar index (which is fixed weighted with a heavy (57%) weighting vs the euro), up for a fourth session and now not far from the highs of the year.
As I mentioned last week “The daily MACD remains positive and the RSI is above 60 so it continues to have strong technical support.”
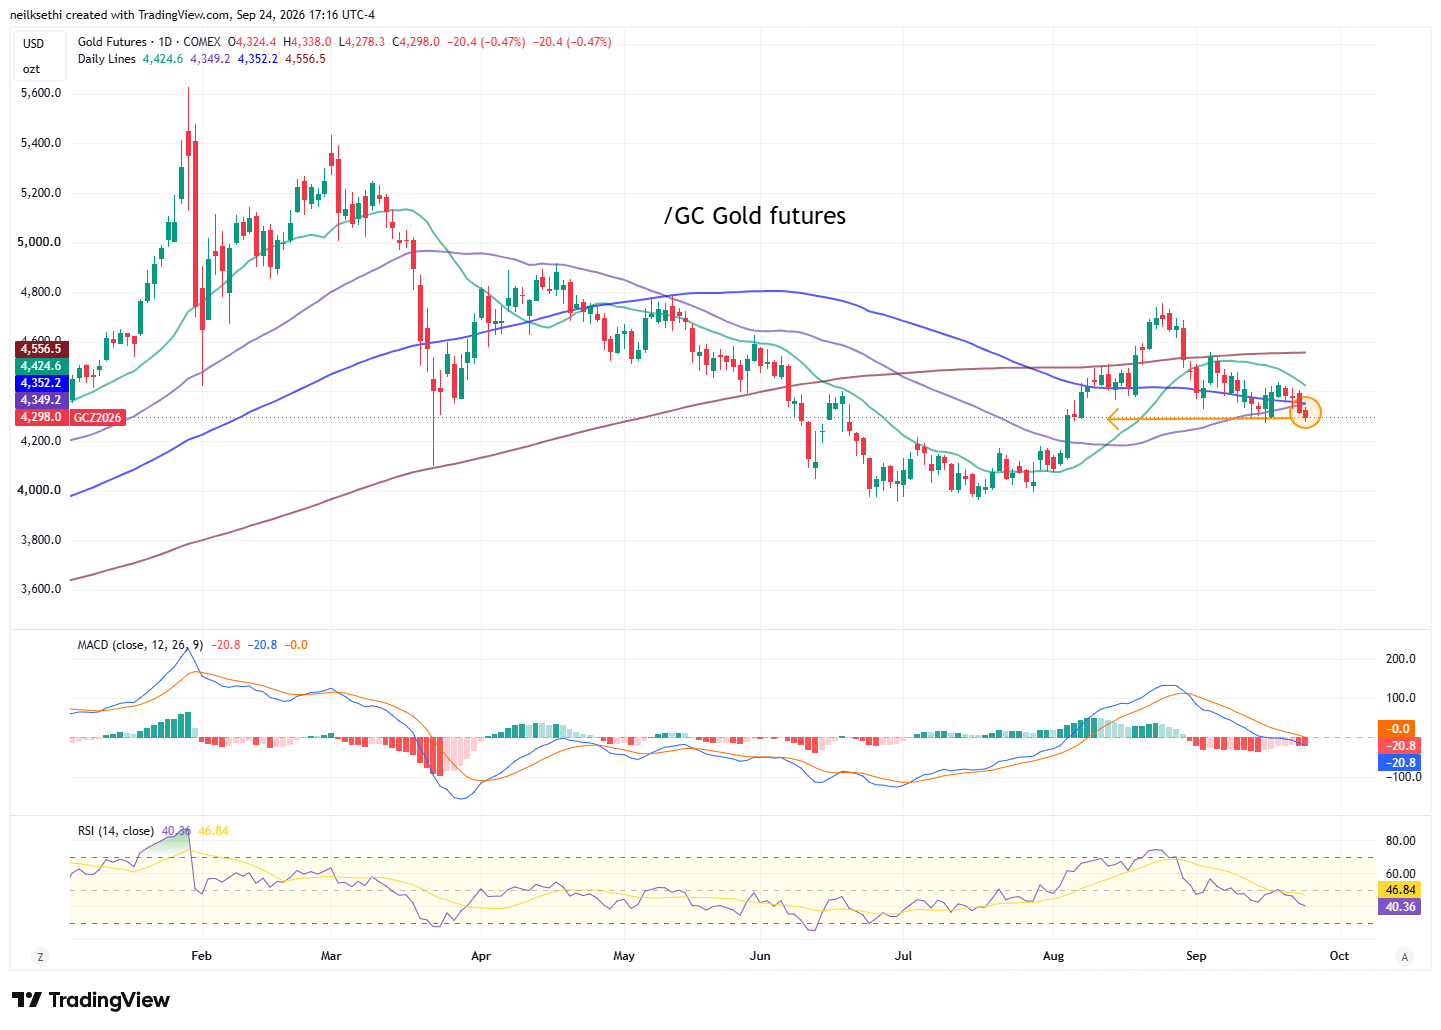
Gold futures (/GC) fell to another 6-week closing low. The daily MACD remains negative and the RSI is under 50. I said Wednesday “needs to hold last week’s intraday lows,” but it’s threatening to break them.
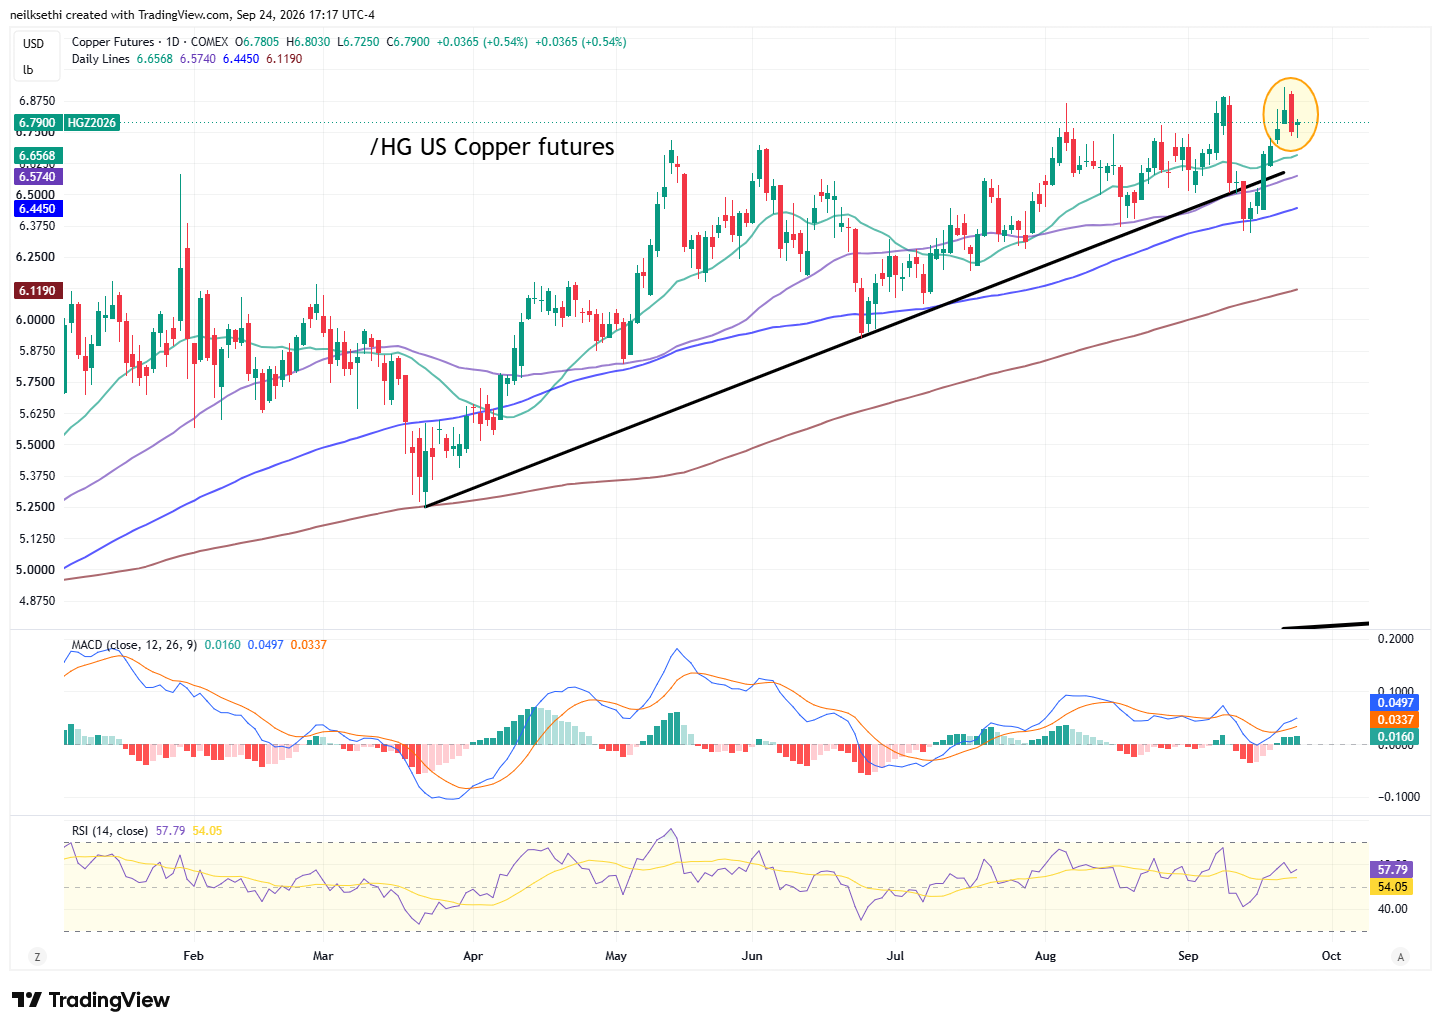
US copper futures (/HG) got back a little of Wednesday’s losses remaining not far from their all-time highs. Daily technicals overall remain positive.
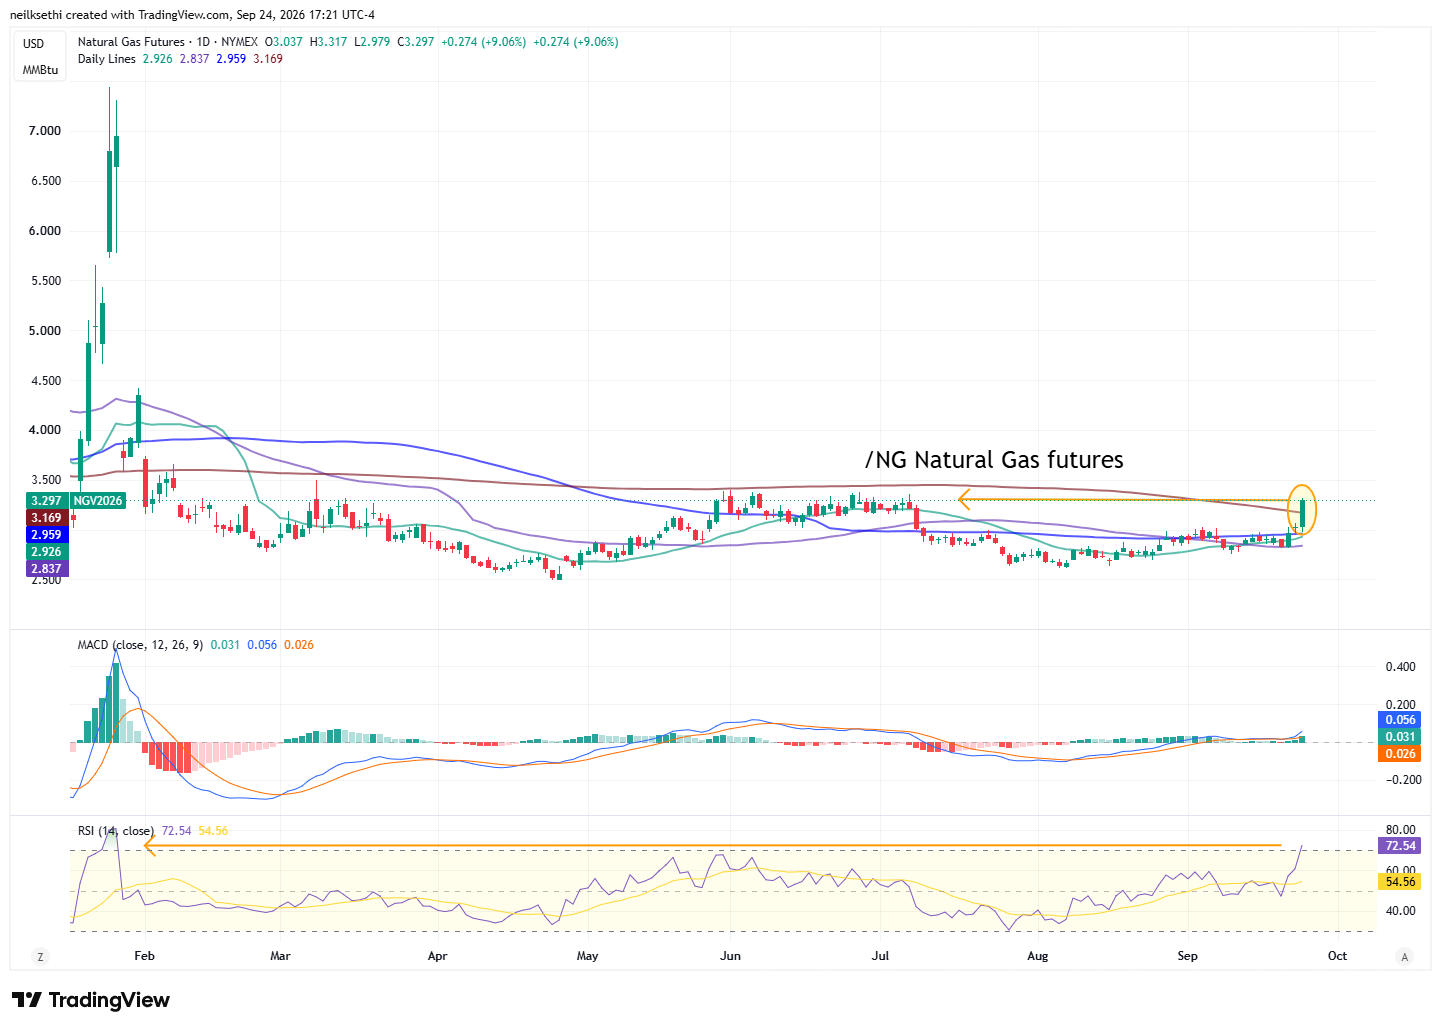
On US natural gas futures (/NG) I said Wednesday “I’ll look to get some exposure tomorrow if we don’t see it reverse lower,” and I did get some exposure and it paid off with a 9.1% rip higher today. I’ve got a tight stop, but if it clears the $3.40 area (currently $3.30) we could get another leg higher. RSI is the highest since its January surge.
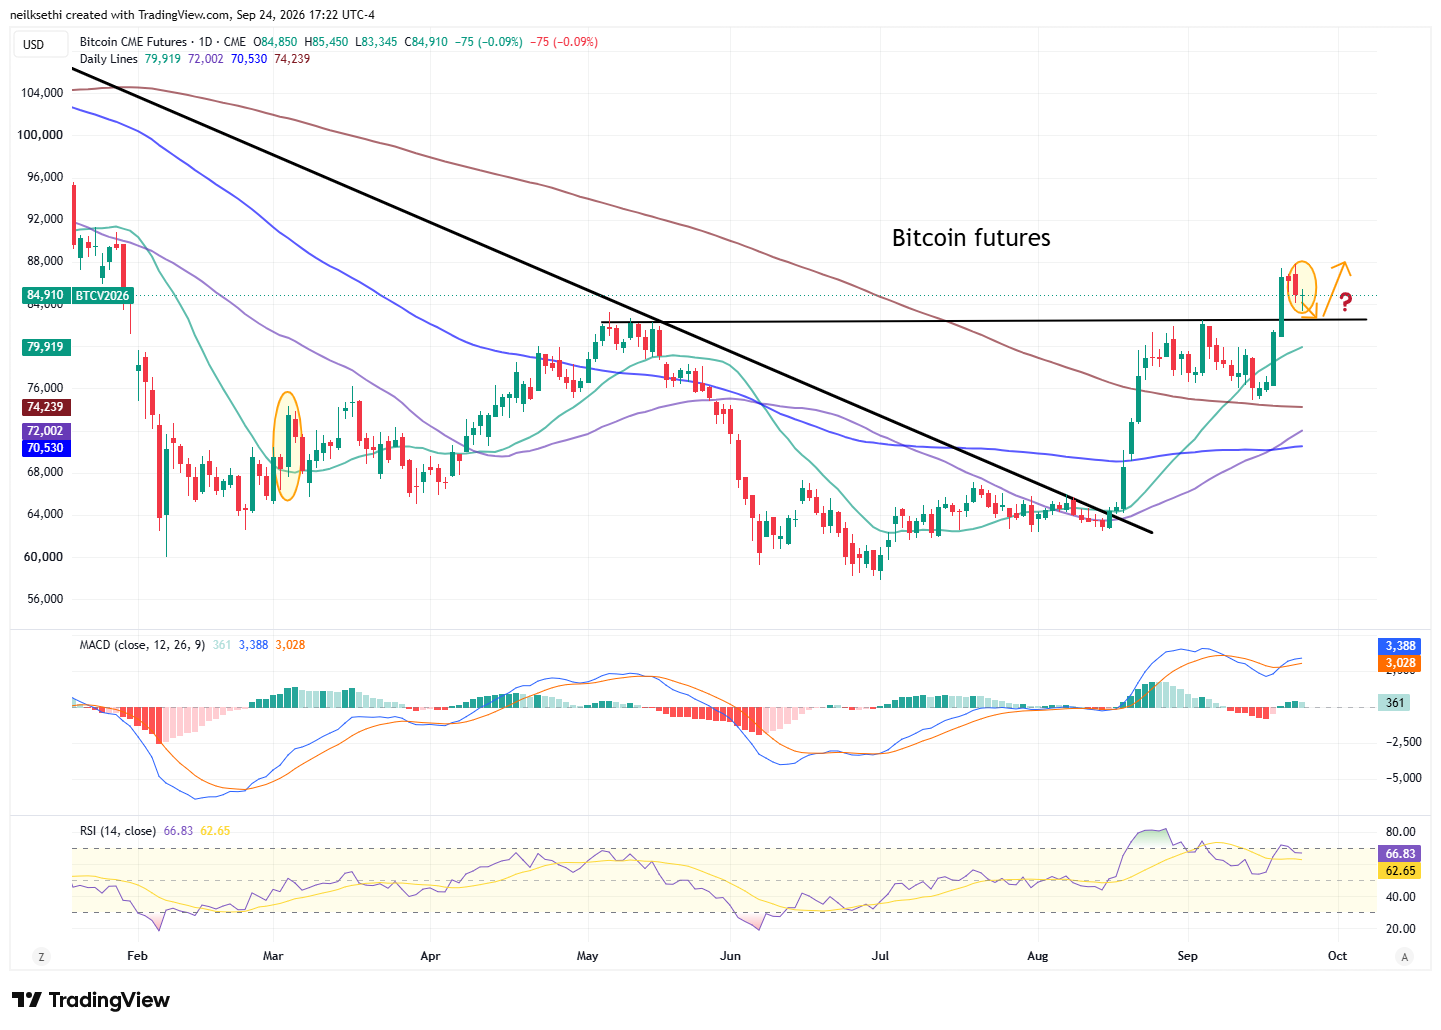
Bitcoin futures eased back, so far following the“natural path” (for bulls) I laid out Wednesday. Daily MACD is positive while the RSI is near 70.
More From TheStreet Pro:
- James “Rev Shark” DePorre –
- Helene Meisler – Yes, We Are Oversold. But We Are Also Complacent.
- Ed Ponsi – Several Signs Point to a Potential Blowout Earnings Season
- Alex Frew McMillan – Following Tariff Truce Update, Investors Can Expect More From Trump-Xi Summit
And From Me If You Missed It:
- Unemployment Claims Pinned Near Historic Lows
- New Home Sales Unexpectedly Jump as Average Prices See Record Drop
- Nvidia Is the Cheapest It’s Been in a Decade. But Is It Cheap for a Reason?
Miscellaneous:
Wrap-Up – Another Iran Deal Stick Save
I said Wednesday:
The gravitational pull of surging interest rates was too powerful for even the renewed Tech trade to escape Wednesday. I had mentioned in prior weeks that it would be difficult for stocks to succeed if rates were going to continue ratcheting higher, let alone a jump like we saw today.
I had hoped that we had seen the highs, at least in the short term, but clearly not. We are unfortunately now apparently in a “good news is bad news” (and vice versa) cycle, and given my positive outlook on the economy, I’m not sure how much bad news we’re going to get (although we do get new home sales tomorrow which it seems hard to believe will be anything but weak). So it seems we’ll just have to wait for this most recent leg in yields to run its course. We’re already above levels that I thought would cap things so I’m taking the other side of this trade, but it could be some time before that pays off the way things are going.
This hasn’t dented my longer-term optimism though, and the pullback is creating what will prove to be bargains in many stocks. I’ll try to write about some of those later this week or next (Nvidia is up next per reader requests – remember just email me at [email protected] if you want a stock run through the META process).
And we followed a similar script Thursday before the all-too-familiar “Iran deal headline” saved us from what seemed surely to be another day of losses. Always reminds me of Charlie Brown, Lucy, and the football. Perhaps we will indeed this time get a deal which may be enough to see a reversal of recent trends.
Bonds are certainly stretched on every metric, and a sharp short-covering rally awaits at some point, while stocks seem to want to break higher if given the chance. We know discretionary positioning is low, and retail has been a seller according to Bank of America for eight weeks.
So it feels like the ingredients are there for a rally, but we’re now pushing back towards those important support levels as well, so I can just as easily say the ingredients are there for another leg lower.
Which one we see, time will tell.
The Day Ahead – TGIF
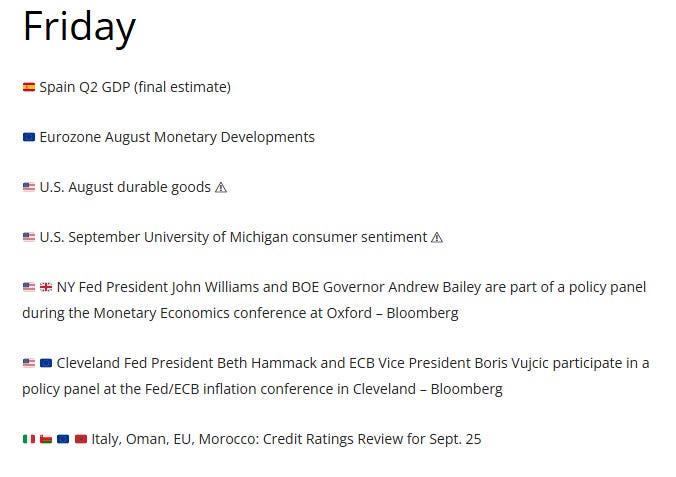
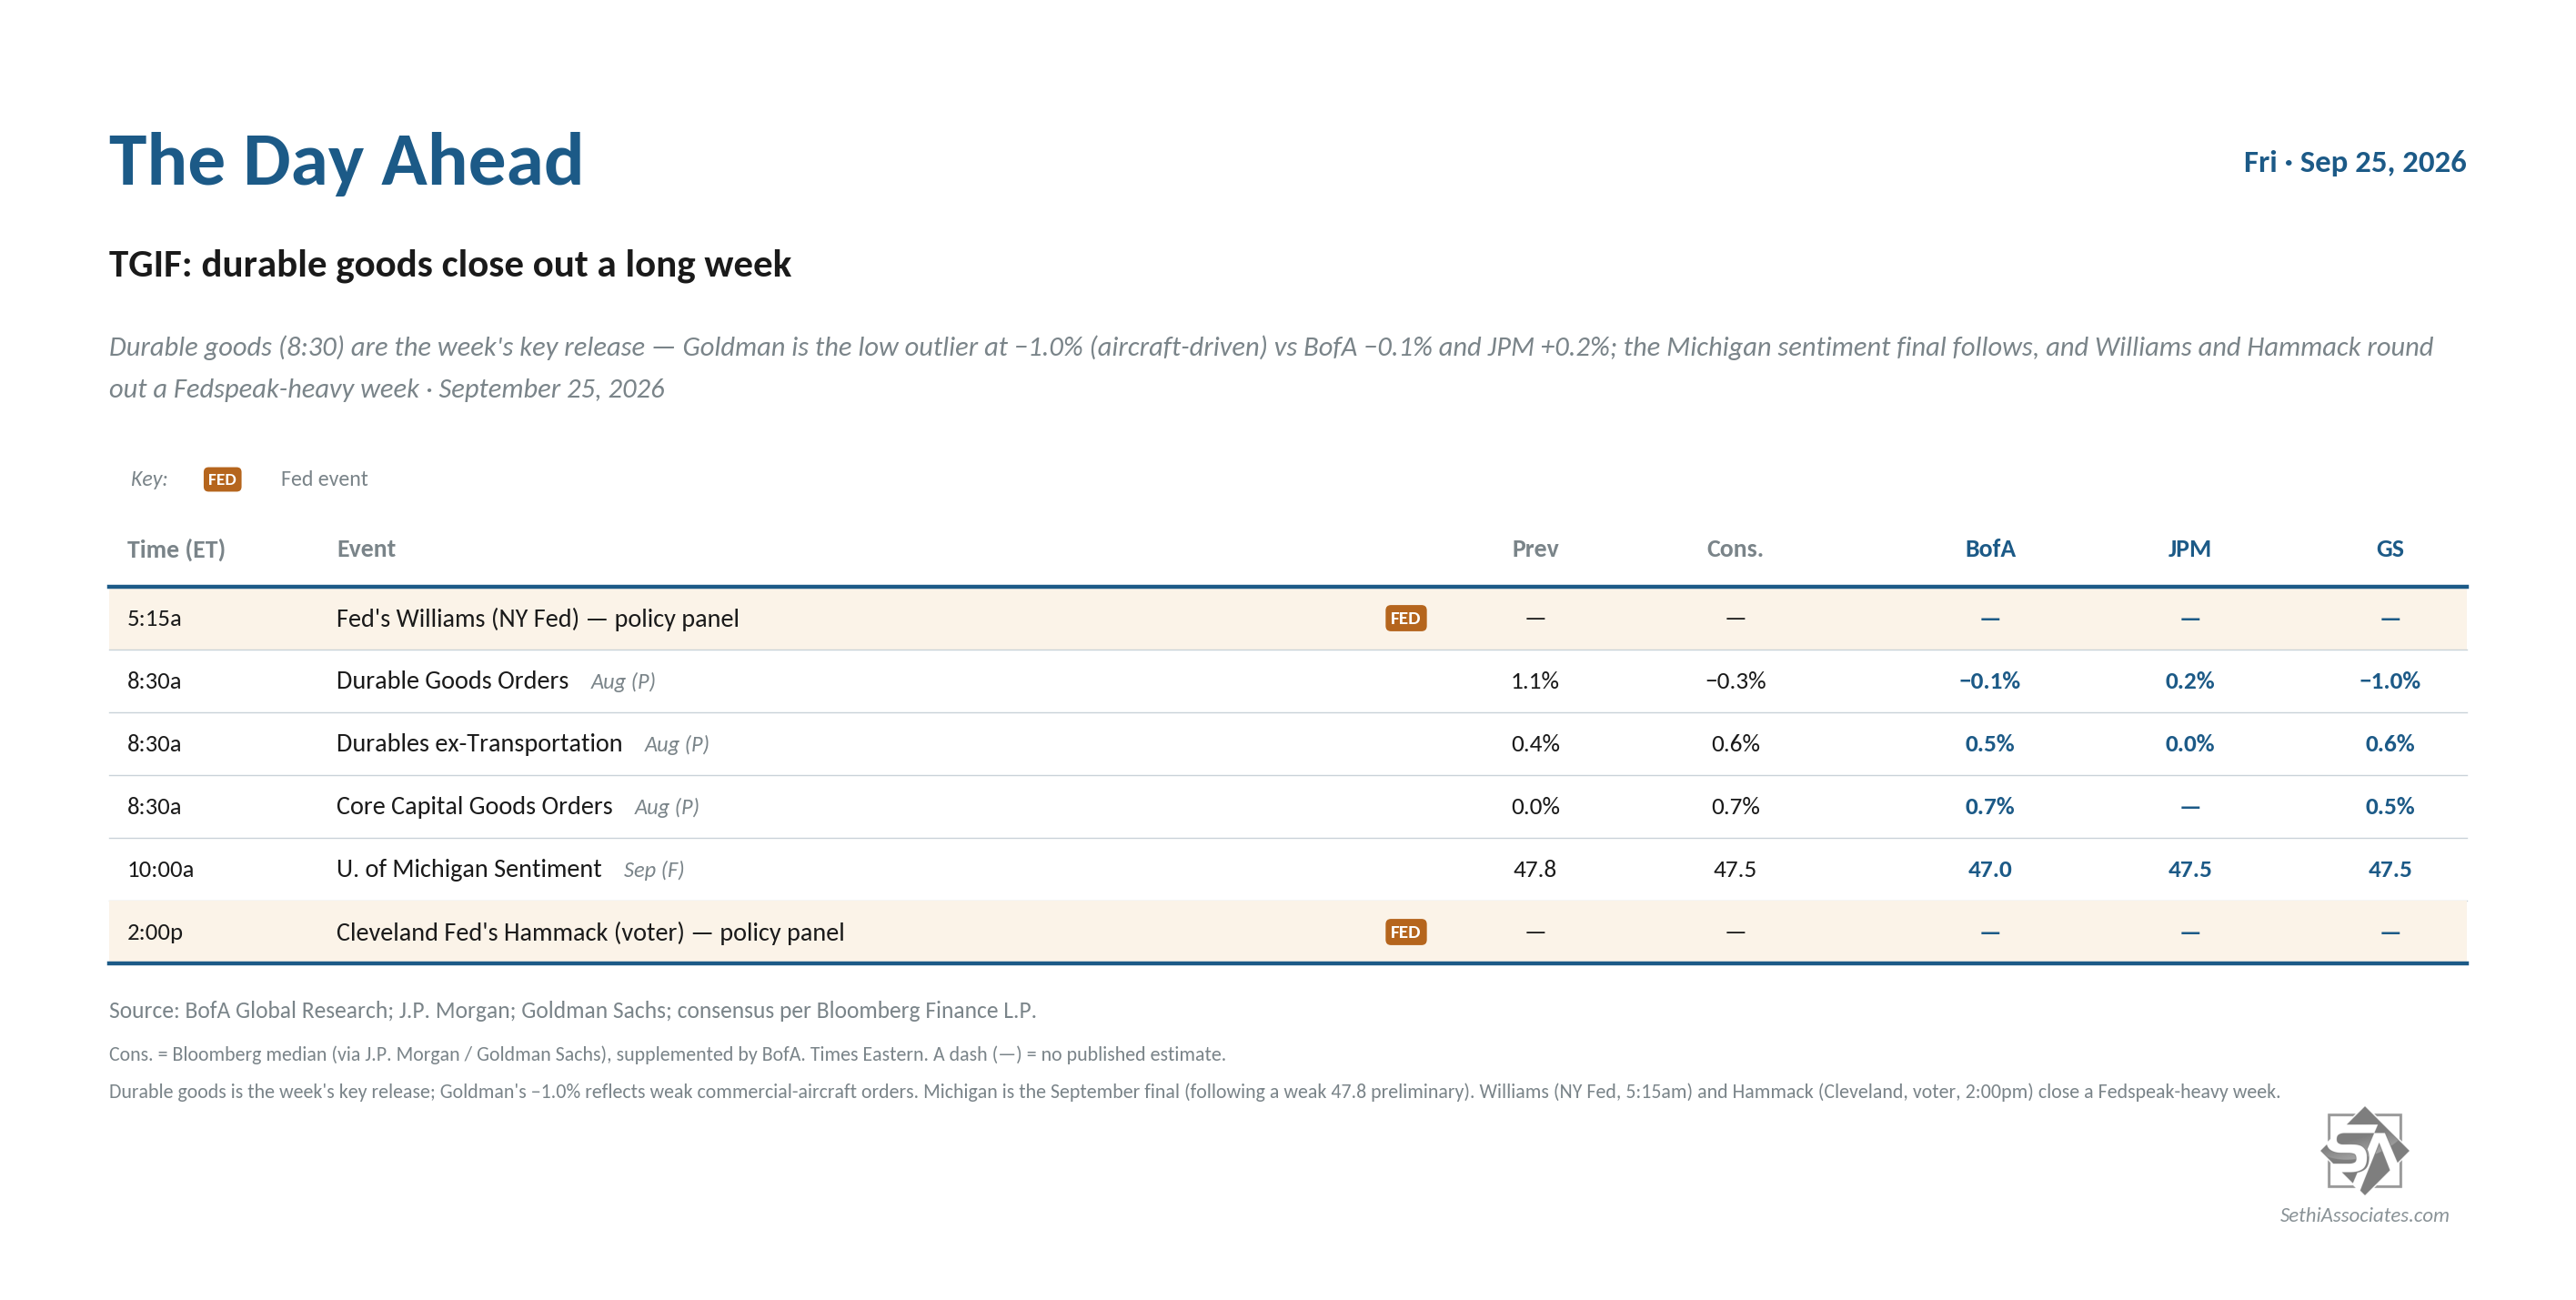
US economic data wraps up the week with August durable goods (lasting >3 years) and the final September UMich consumer sentiment survey.
Fed speakers continue and we’ll again hear from NY Fed President Williams and Cleveland President Hammack.
Non-Bill (>1yr in maturity) US Treasury auctions done for the week (thank goodness).
No SPX components reporting Friday.
Ex-US highlights are UK September GfK consumer confidence, Germany October GfK consumer confidence, Eurozone August M3.
From Christophe Barraud’s international Week Ahead rundown: